Estimating Regional Sources and Sinks of CO 2 Using GOSAT XCO 2
|
|
|
- Janis Robbins
- 6 years ago
- Views:
Transcription
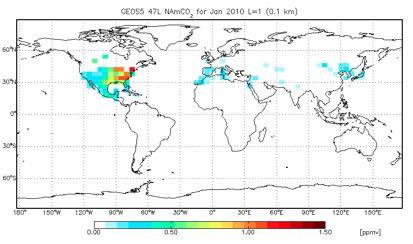
1 Estimating Regional Sources and Sinks of CO 2 Using GOSAT XCO 2 Feng Deng Dylan Jones Daven Henze Nicolas Bousserez Kevin Bowman Joshua Fisher Ray Nassar IWGGMS-9 YokohamaJapan May
2 XCO 2 Observations ACOS-GOSAT b29 XCO2 for July Dec 2010 to quantify monthly fluxes in 2010 Conducted three difference XCO2 inversions using high-gain data: RUN A: XCO2 screened by selecting only data with ΔP < 5 hpa RUN B: XCO2 bias corrected following the approach of Wunch et al 2011 RUN C: XCO2 bias corrected using estimated fitting coefficients from Wunch et al 2011 Use the GEOS-Chem 4-dimensional variational 4D-var data assimilation system to solve for monthly fluxes at the 4 5 resolution of the model using an 18-month assimilation window 1 July December 2010 XCO 2 in RUN_B and RUN_C are similar Both RUN_C and RUN_B are lower than RUN_A in summer in the subtropics and higher in winter in the extratropics 2

3 Inversion Results: Annual Fluxes 2010 Global Mean fluxes RUN_A: 379 Pg C RUN_B: 402 Pg C RUN_C: 411 PgC 3
4 Annual Mean Regional Flux Estimates Boreal Tropical South America South America Northern Africa The$three$XCO 2 $inversions$produce$very$different$es5mates$for$boreal$north$america$temperate$north$ America$and$temperate$South$America With$the$pressure$filtering$Run_A$the$GOSAT$XCO 2 $suggests$a$source$of$about$05$pg$c$for$temperate$north$ America$whereas$RUN_B$and$RUN_C$suggest$a$sink The$three$XCO 2 $based$es5mates$are$consistent$for$tropical$south$america$northern$africa$temperate$eurasia$ and$europe Southern Africa Boreal Eurasia Eurasia Tropical Asia Australia Europe 4
5 Annual Mean Regional Flux Estimates Boreal Tropical South America South America Northern Africa The$three$XCO 2 $inversions$produce$very$different$es5mates$for$boreal$north$america$temperate$north$ America$and$temperate$South$America With$the$pressure$filtering$Run_A$the$GOSAT$XCO 2 $suggests$a$source$of$about$05$pg$c$for$temperate$north$ America$whereas$RUN_B$and$RUN_C$suggest$a$sink The$three$XCO 2 $based$es5mates$are$consistent$for$tropical$south$america$northern$africa$temperate$eurasia$ and$europe Southern Africa Boreal Eurasia Eurasia Tropical Asia Australia Europe 4
6 Annual Mean Regional Flux Estimates Boreal Tropical South America South America Northern Africa The$three$XCO 2 $inversions$produce$very$different$es5mates$for$boreal$north$america$temperate$north$ America$and$temperate$South$America With$the$pressure$filtering$Run_A$the$GOSAT$XCO 2 $suggests$a$source$of$about$05$pg$c$for$temperate$north$ America$whereas$RUN_B$and$RUN_C$suggest$a$sink The$three$XCO 2 $based$es5mates$are$consistent$for$tropical$south$america$northern$africa$temperate$eurasia$ and$europe Southern Africa Boreal Eurasia Eurasia Tropical Asia Australia Europe 4
7 / " / Monthly Mean Regional Flux Estimates "& Global$mean$es5mates$are$similar$for$all$three$XCO 2$inversions $ %& $ %& /0-1 "& European$fluxes$are$consistent$across$the$3$XCO 2$inversions$and$with$ the$mpiubgc$flux$data$product 45 "? 6 789:89 The$stronger$uptake$in$RUN_B$and$RUN_C$in$May$and$June$in$ "> ;<12=3 $North$America$results$in$an$underes5mate$of$XCO 2$at$ & Lamont :89 "$ ;<12=3 - / :#093 / " :#06; " / "& "& "$ /0-1 / $ %& $ % : :89 ;<12=3 "> 6 789:89;<12=3 "> ;<12=3 & "> /0-1 /0-1 "? ;<12=3 "? :89 "? $ %9 & "? "> &" &# & /0-1 RUN_A 45 # / :89 # - EF &# & /0-1 "" "$ 2 "C4D$B"$B &$ "" - - "$ "? 6 789:89 $"> RUN_C 45 ;<12=3 :#06; " 2 $B"$B &% $%& - &$ $%& - &% :#093 $ %9 2 $>"$> 2 "?4@$>"$> AB 12-" " :; <:7:= &" ;<12=3 # # & $ /0-5
8 / " / Monthly Mean Regional Flux Estimates "& Global$mean$es5mates$are$similar$for$all$three$XCO 2$inversions $ %& $ %& /0-1 "& European$fluxes$are$consistent$across$the$3$XCO 2$inversions$and$with$ the$mpiubgc$flux$data$product 45 "? 6 789:89 The$stronger$uptake$in$RUN_B$and$RUN_C$in$May$and$June$in$ "> ;<12=3 $North$America$results$in$an$underes5mate$of$XCO 2$at$ & Lamont :89 "$ ;<12=3 - / :#093 / " :#06; " / "& "& "$ /0-1 / $ %& $ % : :89 ;<12=3 "> 6 789:89;<12=3 "> ;<12=3 & "> /0-1 /0-1 "? ;<12=3 "? :89 "? $ %9 & "? "> &" &# & /0-1 RUN_A 45 # / :89 # - EF &# & /0-1 "" "$ 2 "C4D$B"$B &$ "" - - "$ "? 6 789:89 $"> RUN_C 45 ;<12=3 :#06; " 2 $B"$B &% $%& - &$ $%& - &% :#093 $ %9 2 $>"$> 2 "?4@$>"$> AB 12-" " :; <:7:= &" ;<12=3 # # & $ /0-5
9 Uncertainty Reduction on Monthly Regional Flux Estimates Maximumuncertaintyreduc0on 50%forTropicalSouthAmerica Intheextratropicsthelargest uncertaintyreduc0onwas obtainedforthenorth Americanfluxes0mates Minimumuncertaintyreduc0onin Europeinwinter Globe Europe Australia Tropical Asia Eurasia Boreal Eurasia Southern Africa Northern Africa South America Tropical South America Boreal 6
10 Regional Sensitivity Analysis The modeled CO 2 profile fx is transformed to match the instrument sensitivity using the observation operator XCO 2 m = XCO 2 a j h j a j f x y a j where x = surface CO 2 fluxes and ya = GOSAT a priori profile Europe and Asia CO 2 Fluxes dxco 2 m dx df x = h j a j dx j j Produce influence functions Jacobians for North America Europe and temperate Asia The total flux for each region was scaled to yield a CO 2 source of 1 Pg C/month In each source region CO 2 was emitted for 1 month and the model was allowed to transport the emitted CO 2 for an additional 3 months after the fluxes were turned off The modeled fields were sampled along the GOSAT orbit and transformed with the averaging kernels and pressure weights 7


11 Regional Jacobians Jan Jan 2010 n XCO2 Sensitivity European XCO2 Sensitivity ppm/pg C ppm/pg C Asia XCO2 Sensitivity Sensi0vitywithrespecttoJanuaryfluxesin January Weak$sensi5vity$to$European$fluxes$in$Jan$due$to$limited$ observa5onal$coverage$at$highula5tudes ppm/pg C 8

12 Regional Jacobians April April 2010 n XCO2 Sensitivity European XCO2 Sensitivity ppm/pg C ppm/pg C Asia XCO2 Sensitivity Sensi0vitywithrespecttoAprilfluxesinApril Greater$sensi5vity$to$European$fluxes$in$April$due$to$beXer$ observa5onal$coverage$at$highula5tudes ppm/pg C 9


13 Regional Jacobians April May 2010 n XCO2 Sensitivity European XCO2 Sensitivity ppm/pg C ppm/pg C Asia XCO2 Sensitivity Sensi0vitywithrespecttoAprilfluxesinMay Observa5ons$over$Europe$in$May$provide$greater$ sensi5vity$to$north$american$fluxes$in$april$than$ observa5ons$over$north$america ppm/pg C 10
14 Estimating Transit Times for Continental Emissions Receptor regions for pulse experiment Eastern Pacific North America Atlantic Europe Siberia Asia Simulate the transit times using a narrower pulse: For the 3 continental regions Europe Asia emit a pulse of 1 Pg C for 1 day and transport the emitted CO 2 for an additional 3 months after the fluxes were turned off Look at the distribution of the 3 tracers across each of the 6 receptor regions 11
15 Transit Times to the Middle Troposphere ~5 km n Receptor Europe Asia Atlantic Ocean Receptor European Receptor Time Days Siberian Receptor Europe Asia Time Days Asian Receptor Time Days Eastern Pacific Receptor Time Days Time Days Time Days On timescales of 1-2 weeks n fluxes are influenced mainly by observations across North America and Eurasia n fluxes are strongly influenced by long-range transport and would be more sensitive to regional biases in the XCO2 data European fluxes influenced mainly by observations in Eurasia on short timescales week European fluxes are less sensitive to long-range transport 12
16 Summary Residual biases in the XCO 2 data are a challenge for the regional flux estimates Regional flux estimate must be interpreted with care The inversion significantly increased the uptake in the northern extratropics to correct for the underestimate of the seasonal cycle in our a priori fluxes n fluxes are strongly influenced by long-range transport The flux estimates should be more sensitive to spatially varying biases in the observations and to model transport errors European fluxes are influenced mainly by observations in Eurasia on short timescales The flux estimate are less sensitive to biases in the observations outside of Europe and to model transport errors Because of the observational coverage of GOSAT the inversion is most sensitive to North American fluxes in the northern extratropics Better observational coverage is critical including data over the oceans to capture the continental export TheworkhasbeensupportedbytheNa0onalAeronau0csandSpaceAdministra0ontheNaturalScienceandEngineering ResearchCouncilofCanadaandtheCanadianSpaceAgency 13
17 Inversion Configuration Use the GEOS-Chem 4-dimensional variational 4D-var data assimilation system to solve for monthly fluxes at the 4 5 resolution of the model using an 18-month assimilation window 1 July December 2010 Initial conditions obtained by assimilating surface flask data from Jan 2007 to July 2009 and scaling a posteriori CO 2 field for 1 July 2009 to remove the global mean bias relative to the XCO 2 datasets; The initial bias was 024% 027% and 027% for RUN_A RUN_B and RUN_C respectively Assume a priori and observation error covariance matrices are diagonal Prior Fluxes Fossil fuel emissions Andres et al 2011; Biomass Burning GFEDv3; Biofuel emissions Yevich and Logan 2003 Shipping emissions Corbett and Koehler ; Endresen et al ; Aviation emissions Friedl 1997; Kim et al 2007; Wilkerson et al 2010; Chemical source of CO 2 Nassar et al 2010 Ocean-atmosphere CO 2 flux Takahashi et al 2009 Gross primary productivity GPP and total ecosystem respiration TER specified from BEPS Chen et al 1999; Deng & Chen 2011 assuming a balanced biosphere 14
Data Assimilation Working Group
 Data Assimilation Working Group Dylan Jones (U. Toronto) Kevin Bowman (JPL) Daven Henze (CU Boulder) IGC7 4 May 2015 1 Chemical Data Assimilation Methodology State optimization: x is the model state (e.g.,
Figures and tables Table 1 Annual CO emissions 1 : a priori and a posteriori estimates for selected regions, Tg a -1. Figure 1. Seasonal a priori CO
 Figures and tables Table 1 Annual CO emissions 1 : a priori and a posteriori estimates for selected regions, Tg a -1. Figure 1. Seasonal a priori CO emissions from fossil fuel, biofuel, and biomass burning
Carbon Flux Data Assimilation
 Carbon Flux Data Assimilation Saroja Polavarapu Environment Canada Thanks: D. Jones (U Toronto), D. Chan (EC), A. Jacobson (NOAA) DAOS Working group Meeting, 15-16 Aug. 2014 The Global Carbon Cycle http://www.scidacreview.org/0703/html/biopilot.html
GEMS WP_GHG_8 Estimates of CH 4 sources using existing atmospheric models
 GEMS WP_GHG_8 Estimates of CH 4 sources using existing atmospheric models P. Bergamaschi European Commission Joint Research Centre, Institute for Environment and Sustainability, I-21020 Ispra (Va), Italy
A Global Synthesis Inversion Analysis of Recent Variability in CO 2 Fluxes Using GOSAT. and In Situ Observations
 1 2 A Global Synthesis Inversion Analysis of Recent Variability in CO 2 Fluxes Using GOSAT and In Situ Observations 3 4 5 James S. Wang, 1,2 S. Randolph Kawa, 2 G. James Collatz, 2 Motoki Sasakawa, 3 Luciana
On what scales can GOSAT flux inversions constrain anomalies in terrestrial ecosystems?
 On what scales can GOSAT flux inversions constrain anomalies in terrestrial ecosystems? Brendan Byrne 1, Dylan B. A. Jones 1,2, Kimberly Strong 1, Saroja M. Polavarapu 3, Anna B. Harper 4, David F. Baker,6,
3. Carbon Dioxide (CO 2 )
") 3. Carbon Dioxide (CO 2 ) Basic information on CO 2 with regard to environmental issues Carbon dioxide (CO 2 ) is a significant greenhouse gas that has strong absorption bands in the infrared region and
3. Carbon Dioxide (CO 2 ) Basic information on CO 2 with regard to environmental issues Carbon dioxide (CO 2 ) is a significant greenhouse gas that has strong absorption bands in the infrared region and
FLUXNET and Remote Sensing Workshop: Towards Upscaling Flux Information from Towers to the Globe
 FLUXNET and Remote Sensing Workshop: Towards Upscaling Flux Information from Towers to the Globe Space-Based Measurements of CO 2 from the Japanese Greenhouse Gases Observing Satellite (GOSAT) and the
Inverse modeling of long-term CO emission in China with Green s function method and forward sensitivity
 Inverse modeling of long-term CO emission in China with Green s function method and forward sensitivity Keiya YUMIMOTO Meteorological Research Institute (MRI), Japan Meteorological Agency, Japan Itsushi
Ji-Sun Kang. Pr. Eugenia Kalnay (Chair/Advisor) Pr. Ning Zeng (Co-Chair) Pr. Brian Hunt (Dean s representative) Pr. Kayo Ide Pr.
 Pr. Ning Zeng (Co-Chair) Pr. Brian Hunt (Dean s representative) Pr. Kayo Ide Pr.") Carbon Cycle Data Assimilation Using a Coupled Atmosphere-Vegetation Model and the LETKF Ji-Sun Kang Committee in charge: Pr. Eugenia Kalnay (Chair/Advisor) Pr. Ning Zeng (Co-Chair) Pr. Brian Hunt (Dean
Carbon Cycle Data Assimilation Using a Coupled Atmosphere-Vegetation Model and the LETKF Ji-Sun Kang Committee in charge: Pr. Eugenia Kalnay (Chair/Advisor) Pr. Ning Zeng (Co-Chair) Pr. Brian Hunt (Dean
The North Atlantic Oscillation: Climatic Significance and Environmental Impact
 1 The North Atlantic Oscillation: Climatic Significance and Environmental Impact James W. Hurrell National Center for Atmospheric Research Climate and Global Dynamics Division, Climate Analysis Section
Ammonia Emissions and Nitrogen Deposition in the United States and China
 Ammonia Emissions and Nitrogen Deposition in the United States and China Presenter: Lin Zhang Department of Atmospheric and Oceanic Sciences, School of Physics, Peking University Acknowledge: Daniel J.
Study of interannual variability in CO 2 fluxes using inverse modelling
 Study of interannual variability in CO 2 fluxes using inverse modelling Prabir K. Patra, Shamil Maksyutov, Misa Ishizawa, and Takakiyo Nakazawa Greenhouse Gases Modelling Group (D4) Acknowledgment: Gen
Unprecedented strength of Hadley circulation in impacts on CO2 interhemispheric
 Atmos. Chem. Phys. Discuss., https://doi.org/10.5194/acp-2018-203-ac2, 2018 Author(s) 2018. This work is distributed under the Creative Commons Attribution 4.0 License. Interactive comment on Unprecedented
Ammonia from space: how good are current measurements and what could future instruments tell us
 Ammonia from space: how good are current measurements and what could future instruments tell us Karen Cady-Pereira 1, Mark Shephard 2, Daven Henze 3, Juliet Zhu 3, Jonathan Wrotny 1, Jesse Bash 5, Armin
GLOBAL BIOGEOCHEMICAL CYCLES, VOL. 18, GB4005, doi: /2004gb002224, 2004
 GLOBAL BIOGEOCHEMICAL CYCLES, VOL. 18,, doi:10.1029/2004gb002224, 2004 CH 4 sources estimated from atmospheric observations of CH 4 and its 13 C/ 12 C isotopic ratios: 2. Inverse modeling of CH 4 fluxes
Determining Fluxes of CO 2 using Mass Constraints
 Determining Fluxes of CO 2 using Mass Constraints Paul O. Wennberg Gretchen Keppel-Aleks, Debra Wunch, Tapio Schneider Fluxes from variations in boundary layer CO2 Annual mean surface CO2 [ppm] Mixing
Satellite Observations of Greenhouse Gases
 Satellite Observations of Greenhouse Gases Richard Engelen European Centre for Medium-Range Weather Forecasts Outline Introduction Data assimilation vs. retrievals 4D-Var data assimilation Observations
!"#"$%&'"(")*+,"$%-&.$&#/",.#0)&'0%0& 0--.,.)0%.*$&1*2&0%,*-+/"2.#&30-"-&0$'&0"2*-*)-&.$&40+0$
*+,$%-&.$&#/,.#0)&'0%0& 0--.,.)0%.*$&1*2&0%,*-+/2.#&30--&0$'&02*-*)-&.$&40+0$") !"#"$%&'"(")*+,"$%-&.$&#/",.#0)&'0%0& 0--.,.)0%.*$&1*2&0%,*-+/"2.#&30-"-&0$'&0"2*-*)-&.$&40+0$!"#$%&'()(*&$+",%-./0%123456$2#$17*&'(8($+%9-./%056$2#$,(*(8:;($+,-3156$%#$&$+%9-./%056$2#$%(*&$+%9-./%056$4#$
!"#"$%&'"(")*+,"$%-&.$&#/",.#0)&'0%0& 0--.,.)0%.*$&1*2&0%,*-+/"2.#&30-"-&0$'&0"2*-*)-&.$&40+0$!"#$%&'()(*&$+",%-./0%123456$2#$17*&'(8($+%9-./%056$2#$,(*(8:;($+,-3156$%#$&$+%9-./%056$2#$%(*&$+%9-./%056$4#$
Satellite Constraints on Arctic-region Airborne Particles Ralph Kahn NASA Goddard Space Flight Center
 Satellite Constraints on Arctic-region Airborne Particles Ralph Kahn NASA Goddard Space Flight Center Sea of Okhotsk, MODIS image Feb. 6, 2007, NASA Earth Observatory Arctic Aerosol Remote Sensing Overview
Supplement of Vegetation greenness and land carbon-flux anomalies associated with climate variations: a focus on the year 2015
 Supplement of Atmos. Chem. Phys., 17, 13903 13919, 2017 https://doi.org/10.5194/acp-17-13903-2017-supplement Author(s) 2017. This work is distributed under the Creative Commons Attribution 3.0 License.
Science Results Based on Aura OMI-MLS Measurements of Tropospheric Ozone and Other Trace Gases
 Science Results Based on Aura OMI-MLS Measurements of Tropospheric Ozone and Other Trace Gases J. R. Ziemke Main Contributors: P. K. Bhartia, S. Chandra, B. N. Duncan, L. Froidevaux, J. Joiner, J. Kar,
Estimation of Surface Fluxes of Carbon, Heat, Moisture and Momentum from Atmospheric Data Assimilation
 AICS Data Assimilation Workshop February 27, 2013 Estimation of Surface Fluxes of Carbon, Heat, Moisture and Momentum from Atmospheric Data Assimilation Ji-Sun Kang (KIAPS), Eugenia Kalnay (Univ. of Maryland,
Using visible spectra to improve sensitivity to near-surface ozone of UV-retrieved profiles from MetOp GOME-2
 Using visible spectra to improve sensitivity to near-surface ozone of UV-retrieved profiles from MetOp GOME-2 Richard Siddans, Georgina Miles, Brian Kerridge STFC Rutherford Appleton Laboratory (RAL),
Figure 1. Carbon dioxide time series in the North Pacific Ocean (
 Evidence #1: Since 1950, Earth s atmosphere and oceans have changed. The amount of carbon released to the atmosphere has risen. Dissolved carbon in the ocean has also risen. More carbon has increased ocean
Climate Outlook for December 2015 May 2016
 The APEC CLIMATE CENTER Climate Outlook for December 2015 May 2016 BUSAN, 25 November 2015 Synthesis of the latest model forecasts for December 2015 to May 2016 (DJFMAM) at the APEC Climate Center (APCC),
The feature of atmospheric circulation in the extremely warm winter 2006/2007
 The feature of atmospheric circulation in the extremely warm winter 2006/2007 Hiroshi Hasegawa 1, Yayoi Harada 1, Hiroshi Nakamigawa 1, Atsushi Goto 1 1 Climate Prediction Division, Japan Meteorological
Eurasian Snow Cover Variability and Links with Stratosphere-Troposphere Coupling and Their Potential Use in Seasonal to Decadal Climate Predictions
 US National Oceanic and Atmospheric Administration Climate Test Bed Joint Seminar Series NCEP, Camp Springs, Maryland, 22 June 2011 Eurasian Snow Cover Variability and Links with Stratosphere-Troposphere
Introduction of climate monitoring and analysis products for one-month forecast
 Introduction of climate monitoring and analysis products for one-month forecast TCC Training Seminar on One-month Forecast on 13 November 2018 10:30 11:00 1 Typical flow of making one-month forecast Observed
SUPPLEMENTARY INFORMATION
 Intensification of Northern Hemisphere Subtropical Highs in a Warming Climate Wenhong Li, Laifang Li, Mingfang Ting, and Yimin Liu 1. Data and Methods The data used in this study consists of the atmospheric
Comparison of Aura TES Satellite Greenhouse Gas Measurements with HIPPO profiles
 ComparisonofAuraTESSatelliteGreenhouse GasMeasurementswithHIPPOprofiles John Worden 1, Susan Kulawik 1, Kevin Wecht 2, Vivienne Payne 3, Kevin Bowman 1, and the TES team (1) Jet Propulsion Laboratory /
Sensitivity of climate models to seasonal variability of snow-free land surface albedo
 Theor. Appl. Climatol. (2009) 95: 197 221 DOI 10.1007/s00704-007-0371-8 Printed in The Netherlands Max-Planck-Institute for Meteorology, Hamburg, Germany Sensitivity of climate models to seasonal variability
A BIRD S EYE VIEW OF THE CARBON CYCLE. Anna M. Michalak
 A BIRD S EYE VIEW OF THE CARBON CYCLE Anna M. Michalak Current natural carbon sinks Huntzinger et al. (Ecol Model, 2012) How can the atmosphere help? In situ atmospheric CO 2 observations! Source: NOAA-ESRL
Aerosol Modeling and Forecasting at NRL: FLAMBE and NAAPS
 Aerosol Modeling and Forecasting at NRL: FLAMBE and NAAPS Edward Hyer NRL Aerosol Group Naval Research Laboratory Monterey, California Lingo: FLAMBE, NAAPS and NAVDAS FLAMBE: Fire Locating and Monitoring
Using GOME and SCIAMACHY NO 2 measurements to constrain emission inventories potential and limitations
 Institute of Environmental Physics and Remote Sensing IUP/IFE-UB Department 1 Physics/Electrical Engineering TP-HTAP WMO Geneva, 25 January 2007 Using GOME and SCIAMACHY NO 2 measurements to constrain
World Geography Chapter 3
 World Geography Chapter 3 Section 1 A. Introduction a. Weather b. Climate c. Both weather and climate are influenced by i. direct sunlight. ii. iii. iv. the features of the earth s surface. B. The Greenhouse
Climate Change 2007: The Physical Science Basis
 Climate Change 2007: The Physical Science Basis Working Group I Contribution to the IPCC Fourth Assessment Report Presented by R.K. Pachauri, IPCC Chair and Bubu Jallow, WG 1 Vice Chair Nairobi, 6 February
Reversal of Arctic Oscillation pattern and its relation to extreme hot summer in Japan in 2010
 Reversal of Arctic Oscillation pattern and its relation to extreme hot summer in Japan in 2010 Climate and Ecosystems Dynamics Division Department of Environmental Science & Technology Mie University 507322
HTAP-2 analysis for the Arctic
 Institute for Climate and Atmospheric Science SCHOOL OF EARTH AND ENVIRONMENT Photo: Chuck Brock, NOAA. HTAP-2 analysis for the Arctic Steve R. Arnold 1, Louisa K. Emmons 2, Kathy S. Law 3, Sarah A. Monks
Atmospheric Inversion results
 Atmospheric Inversion results Viterbo RECCAP Philippe Peylin LSCE, France Rachel Law CSIRO, Australia Kevin Gurney, Xia Zhang Arizona State University/Purdue University, USA Zegbeu poussi LSCE, France
Temporal and spatial distribution of tropospheric CO 2 over China based on satellite observations during
 Temporal and spatial distribution of tropospheric CO 2 over China based on satellite observations during 2003-2010 ZHANG XingYing 1,2* BAI WenGuang 1,& ZHANG Peng 1 1 Key Laboratory of Radiometric Calibration
CPTEC and NCEP Model Forecast Drift and South America during the Southern Hemisphere Summer
 CPTEC and NCEP Model Forecast Drift and South America during the Southern Hemisphere Summer José Antonio Aravéquia 1 Pedro L. Silva Dias 2 (1) Center for Weather Forecasting and Climate Research National
Transcom 3 inversion intercomparison: Model mean results for the estimation of seasonal carbon sources and sinks
 GLOBAL BIOGEOCHEMICAL CYCLES, VOL. 18,, doi:10.1029/2003gb002111, 2004 Transcom 3 inversion intercomparison: Model mean results for the estimation of seasonal carbon sources and sinks Kevin Robert Gurney,
Introduction of Seasonal Forecast Guidance. TCC Training Seminar on Seasonal Prediction Products November 2013
 Introduction of Seasonal Forecast Guidance TCC Training Seminar on Seasonal Prediction Products 11-15 November 2013 1 Outline 1. Introduction 2. Regression method Single/Multi regression model Selection
Supplemental Materials
 Supplemental Materials Figure S-1. Locations of the ozonesonde stations used in the TOST product for the period 2008-2012. Figure S-2. Map of the seven regions: Eastern USA, Eastern China, Atlantic, Indonesia,
2015 Record breaking temperature anomalies
 2015 Record breaking temperature anomalies June 2015 global temperature was the highest in 136 (since 1880) years reaching an average of 0.88 C above the 20 th century average. This is an increase of 0.12
Chapter outline. Reference 12/13/2016
 Chapter 2. observation CC EST 5103 Climate Change Science Rezaul Karim Environmental Science & Technology Jessore University of science & Technology Chapter outline Temperature in the instrumental record
Global monthly averaged CO 2 fluxes recovered using a geostatistical inverse modeling approach: 1. Results using atmospheric measurements
 JOURNAL OF GEOPHYSICAL RESEARCH, VOL. 113,, doi:10.109/007jd009734, 008 Global monthly averaged CO fluxes recovered using a geostatistical inverse modeling approach: 1. Results using atmospheric measurements
Interannual and decadal changes in the sea-air CO 2 flux from atmospheric CO 2 inverse modeling
 GLOBAL BIOGEOCHEMICAL CYCLES, VOL. 19,, doi:10.1029/2004gb002257, 2005 Interannual and decadal changes in the sea-air CO 2 flux from atmospheric CO 2 inverse modeling Prabir K. Patra, Shamil Maksyutov,
 Page 1 of 5 Home research global climate enso effects Research Effects of El Niño on world weather Precipitation Temperature Tropical Cyclones El Niño affects the weather in large parts of the world. The
The influence of internal model variability in GEOS-5 on interhemispheric CO 2 exchange
 JOURNAL OF GEOPHYSICAL RESEARCH, VOL. 117,, doi:10.1029/2011jd017059, 2012 The influence of internal model variability in GEOS-5 on interhemispheric CO 2 exchange Melissa Allen, 1 David Erickson, 2 Wesley
MOZAIC-IAGOS : Its role in the satellite validation and in assessing the ozone trends.
 MOZAIC-IAGOS : Its role in the satellite validation and in assessing the ozone trends. MOZAIC Aug. 1994 Jun. 2009 http://mozaic.aero.obs-mip.fr 32 000 flights 230 000 Hours http://www.iagos.org V. Thouret,
GHG-CCI. Achievements, plans and ongoing scientific activities
 GHG-CCI 4 th CCI CMUG Integration Meeting 2-4 CCI Integration Jun 2014, Meeting, Met ECMWF, Office, 14-16 Exeter, March 2011 UK Achievements, plans and ongoing scientific activities Michael Buchwitz Institute
Carbon Cycle Introduction
 Carbon Cycle Introduction Inez Fung UC Berkeley Ifung@berkeley.edu 2nd NCAR-MSRI Summer Graduate Workshop on Carbon Data Assimilation NCAR July 9-13 2006 High-precision Atm CO 2: at MLO since 1958 180
IMPACT STUDIES OF HIGHER RESOLUTION COMS AMV IN THE KMA NWP SYSTEM
 Proceedings for the 13 th International Winds Workshop 27 June - 1 July 2016, Monterey, California, USA IMPACT STUDIES OF HIGHER RESOLUTION COMS AMV IN THE KMA NWP SYSTEM Jung-Rim Lee, Hyun-Cheol Shin,
The OCO-2 Level 4 Gridded Flux Product
 The OCO-2 Level 4 Gridded Flux Product Sean Crowell, Andrew Schuh, David Baker, Andy Jacobson, Sourish Basu, Junjie Liu, Frederic Chevallier, Feng Deng, Liang Feng, Annmarie Eldering, Chris O Dell, Mike
AT760 Global Carbon Cycle. Assignment #3 Due Friday, May 4, 2007 Atmospheric Transport and Inverse Modeling of CO 2
 AT760 Global Carbon Cycle Assignment 3 Due Friday, May 4, 2007 Atmospheric Transport and Inverse Modeling of CO 2 In this exercise you will develop a very simplified model of the mixing of the global atmosphere.
Introduction of products for Climate System Monitoring
 Introduction of products for Climate System Monitoring 1 Typical flow of making one month forecast Textbook P.66 Observed data Atmospheric and Oceanic conditions Analysis Numerical model Ensemble forecast
Climate Dynamics (PCC 587): Hydrologic Cycle and Global Warming
: Hydrologic Cycle and Global Warming") Climate Dynamics (PCC 587): Hydrologic Cycle and Global Warming D A R G A N M. W. F R I E R S O N U N I V E R S I T Y O F W A S H I N G T O N, D E P A R T M E N T O F A T M O S P H E R I C S C I E N C
Climate Dynamics (PCC 587): Hydrologic Cycle and Global Warming D A R G A N M. W. F R I E R S O N U N I V E R S I T Y O F W A S H I N G T O N, D E P A R T M E N T O F A T M O S P H E R I C S C I E N C
On error estimation in atmospheric CO 2 inversions
 JOURNAL OF GEOPHYSICAL RESEARCH, VOL. 107, NO. D22, 4635, doi:10.1029/2002jd002195, 2002 Correction published 22 July 2006 On error estimation in atmospheric CO 2 inversions Richard J. Engelen, 1 A. Scott
On tracer correlations in the troposphere: The case of ethane and propane
 JOURNAL OF GEOPHYSICAL RESEARCH, VOL. 109,, doi:10.1029/2004jd005023, 2004 On tracer correlations in the troposphere: The case of ethane and propane Yuhang Wang and Tao Zeng School of Earth and Atmospheric
Will a warmer world change Queensland s rainfall?
 Will a warmer world change Queensland s rainfall? Nicholas P. Klingaman National Centre for Atmospheric Science-Climate Walker Institute for Climate System Research University of Reading The Walker-QCCCE
The Orbiting Carbon Observatory (OCO) Mission Watching The Earth Breathe Mapping CO 2 From Space. The OCO-3 Mission: An Overview
 Mission Watching The Earth Breathe Mapping CO 2 From Space. The OCO-3 Mission: An Overview") The Orbiting Carbon Observatory (OCO) Mission Watching The Earth Breathe Mapping CO 2 From Space. The OCO-3 Mission: An Overview Annmarie Eldering and the OCO-3 Team May 2013 IWGGMS Meeting Yokohama, Japan
The Orbiting Carbon Observatory (OCO) Mission Watching The Earth Breathe Mapping CO 2 From Space. The OCO-3 Mission: An Overview Annmarie Eldering and the OCO-3 Team May 2013 IWGGMS Meeting Yokohama, Japan
The Carbon Cycle Data Assimilation System CCDAS
 The Carbon Cycle Data Assimilation System CCDAS Marko Scholze & CCDAS team JULES science meeting, Edinburgh, 8 January 2009 top-down vs. bottom-up net CO 2 flux at the surface atm. CO 2 data atmospheric
SCIAMACHY Carbon Monoxide Lessons learned. Jos de Laat, KNMI/SRON
 SCIAMACHY Carbon Monoxide Lessons learned Jos de Laat, KNMI/SRON A.T.J. de Laat 1, A.M.S. Gloudemans 2, I. Aben 2, M. Krol 2,3, J.F. Meirink 4, G. van der Werf 5, H. Schrijver 2, A. Piters 1, M. van Weele
Prentice Hall EARTH SCIENCE
 Prentice Hall EARTH SCIENCE Tarbuck Lutgens Chapter 21 Climate 21.1 Factors That Affect Climate Factors That Affect Climate Latitude As latitude increases, the intensity of solar energy decreases. The
The Atmospheric Circulation
 The Atmospheric Circulation Vertical structure of the Atmosphere http://www.uwsp.edu/geo/faculty/ritter/geog101/textbook/atmosphere/atmospheric_structure.html The global heat engine [courtesy Kevin Trenberth,
Impacts of Climate Change on Autumn North Atlantic Wave Climate
 Impacts of Climate Change on Autumn North Atlantic Wave Climate Will Perrie, Lanli Guo, Zhenxia Long, Bash Toulany Fisheries and Oceans Canada, Bedford Institute of Oceanography, Dartmouth, NS Abstract
Assessing the Lightning NO x Parameterization in GEOS-Chem with HNO 3 Columns from IASI
 Assessing the Lightning NO x Parameterization in GEOS-Chem with HNO 3 Columns from IASI Matthew Cooper 1 Randall Martin 1,2, Catherine Wespes 3, Pierre-Francois Coheur 3, Cathy Clerbaux 3,4, Lee Murray
Updated Dust-Iron Dissolution Mechanism: Effects Of Organic Acids, Photolysis, and Dust Mineralogy
 Updated Dust-Iron Dissolution Mechanism: Effects Of Organic Acids, Photolysis, and Dust Mineralogy Nicholas Meskhidze & Matthew Johnson First International Workshop on the Long Range Transport and Impacts
Global Temperature Report: December 2018
 Jan 2, 2019 Vol. 28, No. 9 For Additional Information: Dr. John Christy, (256) 961-7763 christy@nsstc.uah.edu Dr. Roy Spencer, (256) 961-7960 spencer@nsstc.uah.edu Global Temperature Report: December 2018
Climate Chapter 19. Earth Science, 10e. Stan Hatfield and Ken Pinzke Southwestern Illinois College
 Climate Chapter 19 Earth Science, 10e Stan Hatfield and Ken Pinzke Southwestern Illinois College The climate system A. Climate is an aggregate of weather B. Involves the exchanges of energy and moisture
The Orbiting Carbon Observatory (OCO) Mission Watching The Earth Breathe Mapping CO 2 From Space. OCO-2 Overview
 Mission Watching The Earth Breathe Mapping CO 2 From Space. OCO-2 Overview") The Orbiting Carbon Observatory (OCO) Mission Watching The Earth Breathe Mapping CO 2 From Space. OCO-2 Overview Michael Gunson, Annmarie Eldering and the OCO Team June 17, 2014 2013. IWGGMS May 2013 2014.
The Orbiting Carbon Observatory (OCO) Mission Watching The Earth Breathe Mapping CO 2 From Space. OCO-2 Overview Michael Gunson, Annmarie Eldering and the OCO Team June 17, 2014 2013. IWGGMS May 2013 2014.
Attribution of anthropogenic influence on seasonal sea level pressure
 Click Here for Full Article GEOPHYSICAL RESEARCH LETTERS, VOL. 36, L23709, doi:10.1029/2009gl041269, 2009 Attribution of anthropogenic influence on seasonal sea level pressure N. P. Gillett 1 and P. A.
Climate Outlook for October 2017 March 2018
 The APEC CLIMATE CENTER Climate Outlook for October 2017 March 2018 BUSAN, 25 September 2017 The synthesis of the latest model forecasts for October 2017 to March 2018 (ONDJFM) from the APEC Climate Center
Global monthly averaged CO 2 fluxes recovered using a geostatistical inverse modeling approach: 2. Results including auxiliary environmental data
 JOURNAL OF GEOPHYSICAL RESEARCH, VOL. 113,, doi:10.1029/2007jd009733, 2008 Global monthly averaged CO 2 fluxes recovered using a geostatistical inverse modeling approach: 2. Results including auxiliary
Climate Outlook for March August 2017
 The APEC CLIMATE CENTER Climate Outlook for March August 2017 BUSAN, 24 February 2017 Synthesis of the latest model forecasts for March to August 2017 (MAMJJA) at the APEC Climate Center (APCC), located
Katherine E. Lukens and E. Hugo Berbery. Acknowledgements: Kevin I. Hodges 1 and Matthew Hawcroft 2. University of Reading, Reading, Berkshire, UK
 Boreal Winter Storm Tracks and Related Precipitation in North America: A Potential Vorticity Perspective Katherine E. Lukens and E. Hugo Berbery Acknowledgements: Kevin I. Hodges 1 and Matthew Hawcroft
Factors That Affect Climate
 Factors That Affect Climate Factors That Affect Climate Latitude As latitude (horizontal lines) increases, the intensity of solar energy decreases. The tropical zone is between the tropic of Cancer and
Tropical Moist Rainforest
 Tropical or Lowlatitude Climates: Controlled by equatorial tropical air masses Tropical Moist Rainforest Rainfall is heavy in all months - more than 250 cm. (100 in.). Common temperatures of 27 C (80 F)
Global inventory of nitrogen oxide emissions constrained by space-based observations of NO2 columns
 Global inventory of nitrogen oxide emissions constrained by space-based observations of NO2 columns The Harvard community has made this article openly available. Please share how this access benefits you.
Global evaluation of SCIAMACHY and MOPITT carbon monoxide column differences for
 Click Here for Full Article JOURNAL OF GEOPHYSICAL RESEARCH, VOL. 115,, doi:10.1029/2009jd012698, 2010 Global evaluation of SCIAMACHY and MOPITT carbon monoxide column differences for 2004 2005 A. T. J.
Prentice Hall EARTH SCIENCE
 Prentice Hall EARTH SCIENCE Tarbuck Lutgens Chapter 21 Climate 21.1 Factors That Affect Climate Factors That Affect Climate Latitude As latitude increases, the intensity of solar energy decreases. The
Measuring Carbon Dioxide from the A-Train: The OCO-2 Mission
 Measuring Carbon Dioxide from the A-Train: The OCO-2 Mission David Crisp, OCO-2 Science Team Leader for the OCO-2 Science Team Jet Propulsion Laboratory, California Institute of Technology March 2013 Copyright
CLASS VI GEOGRAPHY FORTNIGHTLY SYLLABUS NEW SESSION 2 ND APRIL Sub Topic. Introduction- The different celestial bodies.
 CLASS VI GEOGRAPHY FORTNIGHTLY SYLLABUS 08-09 NEW SESSION ND APRIL 08 S. No Fortnight Days Main Topic. nd April 3 th April Chapter The Earth in the Solar system Sub Topic - The different celestial bodies
Time-series observations in the Northern Indian Ocean V.V.S.S. Sarma National Institute of Oceanography Visakhapatnam, India
 The Second GEOSS Asia-Pacific Symposium, Tokyo, 14-16 th April 28 Time-series observations in the Northern Indian Ocean V.V.S.S. Sarma National Institute of Oceanography Visakhapatnam, India Seasonal variations
ACE-FTS observations of short-lived reactive species in the UTLS
 ACE-FTS observations of short-lived reactive species in the UTLS Mijeong Park 1, Bill Randel 1, Louisa Emmons 1, Shawn Honomichl 1, Peter Bernath 2, Kaley Walker 2, and Chris Boone 2 1 ACOM/NCAR and 2
Seasonal variations of CO and HCN in the troposphere measured by solar absorption spectroscopy over Poker Flat, Alaska
 University of Wollongong Research Online Faculty of Science - Papers (Archive) Faculty of Science, Medicine and Health 2005 Seasonal variations of CO and HCN in the troposphere measured by solar absorption
Nonlinear atmospheric response to Arctic sea-ice loss under different sea ice scenarios
 Nonlinear atmospheric response to Arctic sea-ice loss under different sea ice scenarios Hans Chen, Fuqing Zhang and Richard Alley Advanced Data Assimilation and Predictability Techniques The Pennsylvania
Winter Forecast. Allan Huffman RaleighWx
 Winter 2015-16 Forecast Allan Huffman RaleighWx Disclaimer Seasonal forecasting is difficult and you are always learning. I attempt to look at all factors I understand and have seen correlate in the past
Seasonal Climate Watch February to June 2018
 Seasonal Climate Watch February to June 2018 Date issued: Jan 26, 2018 1. Overview The El Niño-Southern Oscillation (ENSO) is expected to remain in a weak La Niña phase through to early autumn (Feb-Mar-Apr).
Rainfall parameterization in an off-line chemical transport model
 ATMOSPHERIC SCIENCE LETTERS Atmos. Sci. Let. 5: 82 88 (2004) Published online in Wiley InterScience (www.interscience.wiley.com). DOI: 1002/asl.68 Rainfall parameterization in an off-line chemical transport
1 What Is Climate? TAKE A LOOK 2. Explain Why do areas near the equator tend to have high temperatures?
 CHAPTER 17 1 What Is Climate? SECTION Climate BEFORE YOU READ After you read this section, you should be able to answer these questions: What is climate? What factors affect climate? How do climates differ
Atmospheric circulation analysis for seasonal forecasting
 Training Seminar on Application of Seasonal Forecast GPV Data to Seasonal Forecast Products 18 21 January 2011 Tokyo, Japan Atmospheric circulation analysis for seasonal forecasting Shotaro Tanaka Climate
Introduction to Climate ~ Part I ~
 2015/11/16 TCC Seminar JMA Introduction to Climate ~ Part I ~ Shuhei MAEDA (MRI/JMA) Climate Research Department Meteorological Research Institute (MRI/JMA) 1 Outline of the lecture 1. Climate System (
Chapter 1 Climate in 2016
 Chapter 1 Climate in 2016 1.1 Global climate summary Extremely high temperatures were frequently observed in many regions of the world, and in particular continued for most of the year in various places
Energy Systems, Structures and Processes Essential Standard: Analyze patterns of global climate change over time Learning Objective: Differentiate
 Energy Systems, Structures and Processes Essential Standard: Analyze patterns of global climate change over time Learning Objective: Differentiate between weather and climate Global Climate Focus Question
Unusual North Atlantic temperature dipole during the winter of 2006/2007
 Unusual North Atlantic temperature dipole during the winter of 2006/2007 4 J. J.-M. Hirschi National Oceanography Centre, Southampton, United Kingdom Over most of western Europe and generally over the
Relationship between atmospheric circulation indices and climate variability in Estonia
 BOREAL ENVIRONMENT RESEARCH 7: 463 469 ISSN 1239-695 Helsinki 23 December 22 22 Relationship between atmospheric circulation indices and climate variability in Estonia Oliver Tomingas Department of Geography,
Variability of the Boundary Layer Depth over Certain Regions of the Subtropical Ocean from 3 Years of COSMIC Data
 Variability of the Boundary Layer Depth over Certain Regions of the Subtropical Ocean from 3 Years of COSMIC Data S. Sokolovskiy, D. Lenschow, C. Rocken, W. Schreiner, D. Hunt, Y.-H. Kuo and R. Anthes