Larry Thomason, Jean-Paul Vernier, Adam Bourassa, Florian Arfeuille, Christine Bingen, Thomas Peter, Beiping Luo
|
|
|
- Myron Randolph Morrison
- 6 years ago
- Views:
Transcription
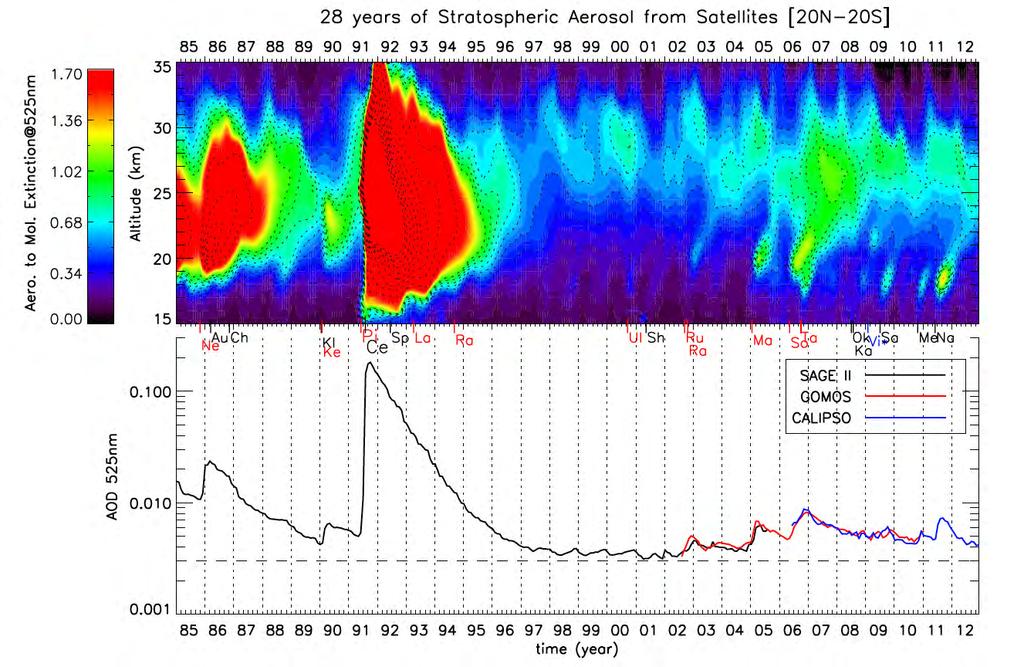
1 Stratospheric Aerosol Data Set (SADS Version 2) Prospectus Larry Thomason, Jean-Paul Vernier, Adam Bourassa, Florian Arfeuille, Christine Bingen, Thomas Peter, Beiping Luo Basic description of the contents of the final data product The stratospheric aerosol data set (SADS) that we propose will strongly mimic the product that was produced for CCMI a few years ago (and now referenced as SADS Version 1). That data set spanned the period 1960 to 2010 and was broken into essentially 3 time periods for what is essentially an aerosol extinction record that is unified through the use of the ETH 4- aerosol derived product methodology. The first period consisted of a model-based representation for the period for 1960 through 1978; in the new version this will be extended to span 1850 to Optical depths will mostly follow those in the GISS stratospheric aerosol optical depth record. The second period is the early space-based record that in Version 1 primarily relied on the SAM II/SAGE series of instruments and built on the gap-free data set produced as a part of ASAP (SPARC, 2006). This data set also used some airborne lidar data from the 1981 to 1984 period and lidar data from Mauna Loa, USA and Camaguey, Cuba in the post-pinatubo period June 1991 through In the latter period, SAGE II data in the lower stratospheric is missing entirely or in part (depending on latitude and date within this period). In the new version, we will incorporate CLAES and HALOE aerosol data in the 1991 to 1995 period to reduce the influence of missing data. This will be somewhat empirical since these data sets are not entirely consistent with the SAGE II observations and some scaling is required to prevent discontinuities. The third period spans from the end of the SAGE II mission in August 2005 to the present and Version 1 was primarily dependent on CALIPSO. In the new version, we will attempt to incorporate data from GOMOS and OSIRIS. Some effort to make the transition and qualitative features of this portion of the data set fit in well with the SAGEbased portion of the record. We recognize that there is a requirement for producing both the data set and a supporting publication by the end of We expect to complete our work on time following this approximate schedule: January to July, create new base data sets August-September, create ETH extended data sets October-December, QA on the data products and write supporting manuscript Critiques of Version 1 would be helpful at an early stage would be helpful and appreciated. Some further details and changes from SADS Version 1 Spatial/temporal resolution While there was some variability in the data set we produced for Version 1, we propose to create a uniform spatial-temporal data set for the updated version. This will be monthly, 5 degree latitude, 0.5 km bins for the entire period. Clearly, not all of the datasets are conducive to this resolution and significant interpolation will be required. Documentation produced at the end of the development will indicate the native resolution for each data set employed as well as the methodology used in expanding it to fit the uniform grid. The nearly 2000 monthly grids will span 80S to 80N and 5.0 to 40.0 km though the fraction of this grid that has data in it will be highly variable. At a minimum, we expect to fill all grid boxes between the tropopause and 30 km.
2 Data parameters At a minimum, in all grid boxes the native measurements whatever the source will be included in the data set, for some parameters like CLAES IR extinction, they are converted to extinction at another wavelength which will likewise be retained. Detailed flagging will indicate the source of the data and whether it is interpolated from adjacent temporal points. Data will be reported for all times and periods from the tropopause (or lower) upward to where the data is no longer considered robust. In most circumstances this will mean that little data will be available above 30 km except following major volcanic events particularly the June 1991 eruption of Pinatubo where useful data extends as high as 35 km. Bulk data parameters will be reported in the gird including any native data source (such as the SAGE II 2008 approach) and the 4- produce other aerosol properties. It should be noted that all approaches assume sulfate-only aerosol and any departure from this will not be reflected in the analyses. Most polar stratospheric clouds will be removed but it is likely that some influence from STS PSCs will remain in the data set. Every effort to produce a gap free data product will be made for the entire period. However, the base measurements from which aerosol size distribution parameters are derived will only be filled in as much as they are necessary to producing the bulk aerosol product parameters. Given that many periods will have minimal data from which to infer these parameters, the inferences of aerosol parameters will be made from statistical correlations derived from periods in which sufficient measurements are available to derive them. At this junction, this is solely the SAGE II period. While we recognize the limitations of indirect inferences of bulk properties based on SAGE II, we don t see any viable alternative to proceeding along this course. Recent comparisons with The University of Wyoming OPC suggests that the 2008 approach is in much better agreement than earlier approaches. Aerosol radiative input data sets that were produced for some models in the Version 1 (extinction, single scattering albedo and asymmetry factor for model-dependent spectral bands) may be produced request based on the Version 2 analyses. Files were produced in ASCII in the last version but can easily be saved in IDL save files if that is desired. If other formats (e.g., netcdf) are desired, it should be requested as soon as possible by CCMI and we will attempt to accommodate a single additional format. Standard data products: Aerosol extinction at 525 and 1020 nm, surface area density, volume density, mass density, and size distribution parameters (native, as available, and 4- ). Given current interests, sulfur mass may be included as well. Description of changes to the data product Pre SAGE ( ) With the exception of adopting the uniform gridding and the expansion of the data set to match the standard grid this product will be produced in the same manner as for Version 1. The period will also be extended back to SAGE Era ( ) The analysis in the 1979 to 1984 period will remain essentially unchanged except the grid will be expanded to 0.5-km vertical resolution from the 1-km resolution in the previous version. For 1979 to
3 1981, the data used in primarily SAGE I 1000-nm data with SAM II 1000-nm data at high latitudes (NH and SH). Between 1982 and the start of the SAGE II mission, the analysis is primarily dependent on SAM II data at high latitudes, LaRC 48-inch lidar data in northern mid-latitudes, and a series of NASA airborne lidar missions between 1981 and For the SAGE II product will be produced in a manner consistent with earlier versions. Some changes have been made to improve quality at high latitudes and in the immediate aftermath of the Pinatubo eruption. In particular, CLAES data is used between October 1991 and the end of its mission in April This data is qualitatively consistent with SAGE II data but requires some scaling to produce compatible data for this analysis. Its inclusion in the October 1991 to the end of 1992 changes the tropical analysis substantially (much more aerosol near 20 km). HALOE has a lesser impact but is value added for a few years following the eruption once the data has been treated using the process suggested in Thomason (2012). The period between the eruption in mid-june until October remains a period in which filling the grid is as much a matter of art as science as observations to fill the low latitudes in particularly are scarce and the inhomogeneity of the aerosol field are so high that it is difficult to imagine ever producing a meaningful monthly mean grid. Since there are NO low latitude SAGE II measurements in June. We propose to essentially move the eruption data from mid-june (where the grid is an interpolation of May to July observations supplemented with some subtropical lidar data) to July 1 where far more observations are available. The period for July to September remains a work in progress but it will be a challenge to produce something substantially more meaningful than what we have produced in the past given the dearth of data and the highly stratified nature of the aerosol layers in this period (e.g., see the figure appended below). A solution for a long standing issue of how to produce meaningful analyses at high latitudes in winter has been developed. The method assumes that aerosol properties are reasonably homogeneous on an equivalent latitude. Aerosol statistics are compiled in an equivalent latitude/time grid (as the function k(q e,z,t)). This has been done before including as a part of CCMI Version 1 and is straightforward. Since SAGE II uses MERRA data meteorological data, this will be used throughout this analysis. Using the full MERRA product (not just that associated with SAGE II observations) the density of equivalent latitudes as a function of latitude for winter hemispheres is computed as the function is p(q q e,z,t). This would be like for latitudes of 60 to 65N, 8% of the time the equivalent latitude is between 50 and 55N, 17% of the time it is between 55 and 60N, 43% of the time it is between 60 and 65N, and so on. The reconstructed distribution of aerosol properties on a latitude grid, k, is computed using k (q j,,z,t) = Σk(q je,z,t) p(q j q ei,z,t) where the j subscript is for latitude bin j, and the i subscript is for equivalent latitude bin i. Gloria Manney has agreed to help produce values for the p function. We expect substantially better high latitude data fields. Post SAGE ( ) We expect the post-sage period to be heavily to be constructed primarily from a combination of space-based observations by CALIPSO, GOMOS, and OSIRIS. These instruments employ fundamentally different measurement techniques than solar occultation (e.g., SAGE) and even between each other. Therefore maintaining data continuity will be a challenge for Version 2. In Version 1, this period was primarily filled with empirically-scaled CALIPSO data. Recently, there has been a successful effort to combine SAGE II, GOMOS and CALIPSO to construct a stratospheric aerosol optical depth dataset during the period (Vernier et al., 2011). Results showed that the overlapping satellite
4 data correlated well after stratospheric aerosol enhancement following several small volcanic eruptions (e.g. Manam in 2005 Soufriere Hills in 2006), which strongly suggests that these datasets are coherent with each other. In order to improve the continuity of a composite aerosol record, an empirical scaling technique to facilitate the construction of a long-term stratospheric aerosol optical depth record. This dataset was used in several simulations to include the climate impacts of small volcanic eruptions since the mid-2000 s (Solomon et al., 2011, Fyfe et al., 2012) and identify the signals of those eruptions on climate variables (Santer et al., 2013,2014). For SADS Version 2, we plan to build on this effort also incorporate data from OSIRIS (Bourassa et al.,2012; Landon et al., 2015). And we expect a smoother transition from the SAGE period and generally superior aerosol data set for this time period compared to version 1. Recommendations for background aerosol We will produce a recommended background aerosol annual cycles if this is desired. This would most likely be based on detrended 1999 to 2001 composite. The ETH additions to the above data sets No changes to the methodology to produce aerosol size parameters (ETH 4- ) are anticipated. Some changes can be expected due to changes in the input files. At the end of this process, new QA will be performed to ensure that the final product is robust and that we have minimized anomalies in the final products. Aerosol radiative properties such as extinction, single scattering albedo and asymmetry factor parameters for model-dependent spectral bands, will be produced on a by-request basis as for Version 2.

5 Airborne lidar data from July 1991 (Winker et al., 1991)


6 Version 1 with CLAES/HALOE data in addition to SAGE II (half way to version 2) Version 1 analysis SAGE II data in June 1991 with No Interpolation or Filling Version 1
7
Spaced-Based Measurements of Stratospheric Aerosols
 Spaced-Based Measurements of Stratospheric Aerosols Larry W. Thomason NASA Langley Research Center Hampton, Virginia USA 6/17/2003 L. Thomason 1 Measurement by Extinction of Solar Radiation Stratospheric
Laura Revell, Andrea Stenke, Beiping Luo, Stefanie Kremser, Eugene Rozanov, Timofei Sukhodolov and Thomas Peter
 Impacts of Mt. Pinatubo volcanic aerosol on the tropical stratosphere in chemistry-climate model simulations using CCMI and CMIP6 stratospheric aerosol data Laura Revell, Andrea Stenke, Beiping Luo, Stefanie
Natural and anthropogenic aerosols in the UTLS: Sources and role of Asian monsoon transport
 Natural and anthropogenic aerosols in the UTLS: Sources and role of Asian monsoon transport Mian Chin, NASA Goddard Space Flight Center + Tom Kucsera, Thomas Diehl, Huisheng Bian, Valentina Aquila, Qian
Seasonal and interannual variability of upper tropospheric aerosols: Sources and the role of Asian monsoon transport
 Seasonal and interannual variability of upper tropospheric aerosols: Sources and the role of Asian monsoon transport Mian Chin, NASA GSFC Valentina Aquila, Huisheng Bian, Tom Kucsera, Qian Tan, Peter Colarco,
Physical and Optical Properties of the Stratospheric Aerosol Layer
 Physical and Optical Properties of the Stratospheric Aerosol Layer Patrick Hamill Department of Physics and Astronomy San Jose State University San Jose, California Justification for this Talk Much debate
Recent anthropogenic increases in SO2 from Asia have minimal impact on stratospheric aerosol
 !1 Recent anthropogenic increases in SO2 from Asia have minimal impact on stratospheric aerosol Ryan R. Neely III (NCAR/ASP), O. Brian Toon, Susan Solomon, Karen H. Rosenlof, John S Daniel, J. English,
The Need For Meteoritic Dust In The Stratosphere
 Global LIDAR Remote Sensing of Stratospheric Aerosols and Comparison with WACCM/CARMA: The Need For Meteoritic Dust In The Stratosphere CESM Whole Atmosphere Working Group Meeting 23 June 2011 Breckenridge,
Supporting Online Material for
 www.sciencemag.org/cgi/content/full/1153966/dc1 Supporting Online Material for The Sensitivity of Polar Ozone Depletion to Proposed Geoengineering Schemes Simone Tilmes,* Rolf Müller, Ross Salawitch *To
Validation of GOMOS version 6.01 ozone profiles using ground-based lidar observations. October 2012
 Validation of GOMOS version 6.01 ozone profiles using ground-based lidar observations October 2012 Anne.van.Gijsel@knmi.nl Introduction In this study we have compared GOMOS IPF version 6.01 ozone profiles
Developments in CALIOP Aerosol Products. Dave Winker
 Developments in CALIOP Aerosol Products Dave Winker NASA Langley Research Center Hampton, VA Winker - 1 Outline Level 3 aerosol product (beta-version) Version 4 Level 1 product A few CALIOP assimilation
Global Response to the Major Volcanic Eruptions in 9 Reanalysis Datasets
 Global Response to the Major Volcanic Eruptions in 9 Reanalysis Datasets Masatomo Fujiwara and Takashi Hibino (Hokkaido Univ., Japan) Sanjay Kumar Mehta (Kyoto Univ., Japan) Lesley Gray, Daniel Mitchell,
A possible joint WCRP SPARC SSiRC/AeroCom initiative on stratospheric sulfur
 A possible joint WCRP SPARC SSiRC/AeroCom initiative on stratospheric sulfur Claudia Timmreck and the SSiRC team AeroCom workshop, Hamburg, 23. 9. 2013 Stratospheric Sulfur and Climate Climate Volcanic
The SPARC LOTUS Initiative
 The SPARC LOTUS Initiative Project Leads: I. Petropavlovskikh S. Godin-Beekmann D. Hubert Group Leads: R. Damadeo V. Sofieva B. Hassler S. Frith and 30+ Contributors CEOS AC-VC-14 Meeting, May 2-4, 2018
Polar Ozone Depletion and Trends as Represented by the Whole Atmosphere Community Climate Model (WACCM)
") Polar Ozone Depletion and Trends as Represented by the Whole Atmosphere Community Climate Model (WACCM) Doug Kinnison 1, Susan Solomon 2, Diane Ivy 2, Mike Mills 1, Ryan Neely III 3, and Anja Schmidt 3
Polar Ozone Depletion and Trends as Represented by the Whole Atmosphere Community Climate Model (WACCM) Doug Kinnison 1, Susan Solomon 2, Diane Ivy 2, Mike Mills 1, Ryan Neely III 3, and Anja Schmidt 3
Odin-OSIRIS: A Summary of the Results from the Past Eleven Years
 Odin-OSIRIS: A Summary of the Results from the Past Eleven Years ESA ATMOS 12 June 18, 12 Bruges, Brussels : Year Eleven of a Two Year Mission ESA ATMOS 12 June 18, 12 Bruges, Brussels OSIRIS Designed
Measurement Techniques Improved SAGE II cloud/aerosol categorization and observations of the Asian tropopause aerosol layer:
 Sciences ess Atmos. Chem. Phys., 13, 5 1, 13 www.atmos-chem-phys.net/13/5/13/ doi:1.519/acp-13-5-13 Author(s) 13. CC Attribution 3. License. Atmospheric Chemistry and Physics Atmospheric Measurement Techniques
What are Aerosols? Suspension of very small solid particles or liquid droplets Radii typically in the range of 10nm to
 What are Aerosols? Suspension of very small solid particles or liquid droplets Radii typically in the range of 10nm to 10µm Concentrations decrease exponentially with height N(z) = N(0)exp(-z/H) Long-lived
10 years of stratospheric aerosol observadons from CALIPSO J.-P. Vernier, L.W. Thomason, T.D. Fairlie, J. Kar, M. Natarajan
 10 years of stratospheric aerosol observadons from CALIPSO J.-P. Vernier, L.W. Thomason, T.D. Fairlie, J. Kar, M. Natarajan CALIPSO-Cloudsat 10th Anni versary workshop, June 2016, Paris Some important
Comparing aerosol extinctions measured by Stratospheric Aerosol and Gas Experiment (SAGE) II and III satellite experiments in 2002 and 2003
 II and III satellite experiments in 2002 and 2003") JOURNAL OF GEOPHYSICAL RESEARCH, VOL. 110,, doi:10.1029/2004jd005421, 2005 Comparing aerosol extinctions measured by Stratospheric Aerosol and Gas Experiment (SAGE) II and III satellite experiments in
JOURNAL OF GEOPHYSICAL RESEARCH, VOL. 110,, doi:10.1029/2004jd005421, 2005 Comparing aerosol extinctions measured by Stratospheric Aerosol and Gas Experiment (SAGE) II and III satellite experiments in
Stratospheric aerosol profile retrieval from SCIAMACHY limb observations
 Stratospheric aerosol profile retrieval from SCIAMACHY limb observations Yang Jingmei Zong Xuemei Key Laboratory of Middle Atmosphere and Global Environment Observation (LAGEO), Institute of Atmospheric
The Persistently Variable Background Stratospheric Aerosol Layer and Global Climate Change
 The Persistently Variable Background Stratospheric Aerosol Layer and Global Climate Change S. Solomon, 1,2 * J. S. Daniel, 1 R. R. Neely III, 1,2,5 J. P. Vernier, 3,4 E. G. Dutton, 5 L. W. Thomason 3 1
Limb Scanning and Occultation. Ben Kravitz November 12, 2009
 Limb Scanning and Occultation Ben Kravitz November 12, 2009 Occultation An occultation is an event that occurs when one object is hidden by another object that passes between it and the observer. very
Cloud Occurrence from the level 2B CloudSat- CALIPSO Cloud Mask Data
 Cloud Occurrence from the level 2B CloudSat- CALIPSO Cloud Mask Data Jay Mace and Qiuqing Zhang 1. Briefly introduce Geoprof-Lidar Product 2. Examine the vertical and horizontal distribution of cloud occurrence
Global Warming and Climate Change Part I: Ozone Depletion
 GCOE-ARS : November 18, 2010 Global Warming and Climate Change Part I: Ozone Depletion YODEN Shigeo Department of Geophysics, Kyoto University 1. Stratospheric Ozone and History of the Earth 2. Observations
Understanding Recent Tropical Expansion and its Impacts
 Understanding Recent Tropical Expansion and its Impacts www.cawcr.gov.au Chris Lucas Hanh Nguyen The Centre for Australian Weather and Climate Research A partnership between CSIRO and the Bureau of Meteorology
HEIGHT-LATITUDE STRUCTURE OF PLANETARY WAVES IN THE STRATOSPHERE AND TROPOSPHERE. V. Guryanov, A. Fahrutdinova, S. Yurtaeva
 HEIGHT-LATITUDE STRUCTURE OF PLANETARY WAVES IN THE STRATOSPHERE AND TROPOSPHERE INTRODUCTION V. Guryanov, A. Fahrutdinova, S. Yurtaeva Kazan State University, Kazan, Russia When constructing empirical
Diagnosis of Relative Humidity Changes in a Warmer Climate Using Tracers of Last Saturation
 Diagnosis of Relative Humidity Changes in a Warmer Climate Using Tracers of Last Saturation 8 March, 2011 Jonathon Wright Department of Applied Mathematics & Theoretical Physics University of Cambridge
VALIDATION OF ENVISAT PRODUCTS USING POAM III O 3, NO 2, H 2 O AND O 2 PROFILES
 VALIDATION OF ENVISAT PRODUCTS USING POAM III O 3, NO 2, H 2 O AND O 2 PROFILES A. Bazureau, F. Goutail Service d Aéronomie / CNRS, BP 3, Réduit de Verrières, 91371 Verrières-le-Buisson, France Email :
Current Status of COMS AMV in NMSC/KMA
 Current Status of COMS AMV in NMSC/KMA Eunha Sohn, Sung-Rae Chung, Jong-Seo Park Satellite Analysis Division, NMSC/KMA soneh0431@korea.kr COMS AMV of KMA/NMSC has been produced hourly since April 1, 2011.
Recent Climate History - The Instrumental Era.
 2002 Recent Climate History - The Instrumental Era. Figure 1. Reconstructed surface temperature record. Strong warming in the first and late part of the century. El Ninos and major volcanic eruptions are
TRENDS IN DIRECT NORMAL SOLAR IRRADIANCE IN OREGON FROM
 TRENDS IN DIRECT NORMAL SOLAR IRRADIANCE IN OREGON FROM 1979-200 Laura Riihimaki Frank Vignola Department of Physics University of Oregon Eugene, OR 970 lriihim1@uoregon.edu fev@uoregon.edu ABSTRACT To
Simulated Radiances for OMI
 Simulated Radiances for OMI document: KNMI-OMI-2000-004 version: 1.0 date: 11 February 2000 author: J.P. Veefkind approved: G.H.J. van den Oord checked: J. de Haan Index 0. Abstract 1. Introduction 2.
Global LIDAR Remote Sensing of Stratospheric Aerosols and Comparison with WACCM/CARMA
 Global LIDAR Remote Sensing of Stratospheric Aerosols and Comparison with WACCM/CARMA CESM Whole Atmosphere Working Group Meeting 16-17 February 2011 National Center for Atmospheric Research Boulder, Colorado
NOAA Snow Map Climate Data Record Generated at Rutgers
 NOAA Snow Map Climate Data Record Generated at Rutgers David A. Robinson Rutgers University Piscataway, NJ Snow Watch 2013 Downsview, Ontario January 29, 2013 December 2012 snow extent departures Motivation
Merged SAGE II Ozone_cci OMPS ozone dataset for trend studies
 Merged SAGE II Ozone_cci OMPS ozone dataset for trend studies V.F. Sofieva, E. Kyrölä, M. Laine, J. Tamminen Finnish Meteorological Institute, Finland G. Stiller, A. Laeng, T. von Clarmann Karlsruhe Institute
ESA Ozone Climate Change Initiative: combined use of satellite ozone profile measurements
 ESA Ozone Climate Change Initiative: combined use of satellite ozone profile measurements V.F. Sofieva, E. Kyrölä, J. Tamminen, S. Tukiainen, J. Hakkarainen Finnish Meteorological Institute, Finland G.
7.5-year global trends in GOME cloud cover and humidity - a signal of climate change? Institut für Umweltphysik, Uni-Heidelberg, Germany
 7.5-year global trends in GOME cloud cover and humidity - a signal of climate change? T. Wagner, S. Beirle, M. Grzegorski, S. Sanghavi, U. Platt Institut für Umweltphysik, Uni-Heidelberg, Germany The Greenhouse
Tropical stratospheric zonal winds in ECMWF ERA-40 reanalysis, rocketsonde data, and rawinsonde data
 GEOPHYSICAL RESEARCH LETTERS, VOL. 32, L09806, doi:10.1029/2004gl022328, 2005 Tropical stratospheric zonal winds in ECMWF ERA-40 reanalysis, rocketsonde data, and rawinsonde data Mark P. Baldwin Northwest
Volcanic impact on the climate the stratospheric aerosol load in the period
 Discussion started: January 18 Volcanic impact on the climate the stratospheric aerosol load in the period 06 1 Johan Friberg 1, Bengt G. Martinsson 1, Sandra M. Andersson 1,, Oscar S. Sandvik 1 1 Division
Simulation of Polar Ozone Depletion in SD-WACCM4 / MERRA
 Simulation of Polar Ozone Depletion in SD-WACCM4 / MERRA D. Kinnison (NCAR), S. Solomon (MIT), J. Bandoro (MIT), and R. Garcia (NCAR) June 16, 2015 WACCM Working Group Meeting, Baltimore MD. Image courtesy
Comparison of Results Between the Miniature FASat-Bravo Ozone Mapping Detector (OMAD) and NASA s Total Ozone Mapping Spectrometer (TOMS)
 and NASA s Total Ozone Mapping Spectrometer (TOMS)") Comparison of Results Between the Miniature FASat-Bravo Ozone Mapping Detector (OMAD) and NASA s Total Ozone Mapping Spectrometer (TOMS) Juan A. Fernandez-Saldivar, Craig I. Underwood Surrey Space Centre,
Comparison of Results Between the Miniature FASat-Bravo Ozone Mapping Detector (OMAD) and NASA s Total Ozone Mapping Spectrometer (TOMS) Juan A. Fernandez-Saldivar, Craig I. Underwood Surrey Space Centre,
CESM2 (WACCM6): Stratospheric Evaluation
: Stratospheric Evaluation") CESM2 (WACCM6): Stratospheric Evaluation D. Kinnison, M. Mills, R. Garcia, D. Marsh, A. Gettelman, F. Vitt, S. Glanville, C. Bardeen, S. Tilmes, A. Smith, J-F. Lamarque, L. Emmons, A. Conley, J. Richter,
CESM2 (WACCM6): Stratospheric Evaluation D. Kinnison, M. Mills, R. Garcia, D. Marsh, A. Gettelman, F. Vitt, S. Glanville, C. Bardeen, S. Tilmes, A. Smith, J-F. Lamarque, L. Emmons, A. Conley, J. Richter,
1. The frequency of an electromagnetic wave is proportional to its wavelength. a. directly *b. inversely
 CHAPTER 3 SOLAR AND TERRESTRIAL RADIATION MULTIPLE CHOICE QUESTIONS 1. The frequency of an electromagnetic wave is proportional to its wavelength. a. directly *b. inversely 2. is the distance between successive
Evaluation of aerosol measurements from SAGE II, HALOE, and balloonborne optical particle counters
 JOURNAL OF GEOPHYSICAL RESEARCH, VOL. 107, NO. D3, 4031, 10.1029/2001JD000703, 2002 Evaluation of aerosol measurements from SAGE II, HALOE, and balloonborne optical particle counters Mark Hervig 1 and
The exceptional Arctic winter 2005/06
 SPARC data assimilation workshop, 2-4 October 2006 The exceptional Arctic winter 2005/06 An example to investigate polar processes using different assimilations systems 1, Gloria Manney 2,3, Steven Pawson
THE CLIMATE OVER SRI LANKA YALA SEASON 2017
 THE CLIMATE OVER SRI LANKA YALA SEASON 2017 Foundation for Environment, Climate and Technology C/o Mahaweli Authority of Sri Lanka, Digana Village, Rajawella, Kandy, KY 20180, Sri Lanka Citation Lokuhetti,
Stratospheric aerosol characteristics from space-borne observations: extinction coefficient and Ångström exponent
 Stratospheric aerosol characteristics from space-borne observations: extinction coefficient and Ångström exponent Elizaveta Malinina 1, Alexei Rozanov 1, Landon Rieger 2*, Adam Bourassa 2, Heinrich Bovensmann
The solar cycle effect in the MLT region. Simulations with HAMMONIA
 The solar cycle effect in the MLT region Simulations with HAMMONIA Hauke Schmidt Max Planck Institute for Meteorology, Hamburg, Germany Variability of solar UV irradiance as given by UARS / SOLSTICE (Maximum:
Aura Microwave Limb Sounder (MLS) ozone profile data record characteristics, quality and applications
 ozone profile data record characteristics, quality and applications") Aura Microwave Limb Sounder (MLS) ozone profile data record characteristics, quality and applications A presentation for the 2016 meeting of the Committee on Earth Observation Satellites (COES) Atmospheric
Aura Microwave Limb Sounder (MLS) ozone profile data record characteristics, quality and applications A presentation for the 2016 meeting of the Committee on Earth Observation Satellites (COES) Atmospheric
Backscatter Color Ratios of Cirrus Clouds Measured by the Cloud Physics Lidar
 Backscatter Color Ratios of Cirrus Clouds Measured by the Cloud Physics Lidar M. A. Vaughan 1, M. J. McGill, Z. Liu 3, Y. Hu 1, and R. E. Kuehn 4, and S. D. Rodier 4 NASA Langley Research Center, Hampton
MS RAND CPP PROG0407. HadAT: An update to 2005 and development of the dataset website
 MS RAND CPP PROG0407 HadAT: An update to 2005 and development of the dataset website Holly Coleman and Peter Thorne CV(CR) Contract Deliverable reference number: 03.09.04 File: M/DoE/2/9 Delivered from
Effect of Exclusion of Anomalous Tropical Stations on Temperature Trends from a 63-Station Radiosonde Network, and Comparison with Other Analyses
 2288 JOURNAL OF CLIMATE VOLUME 16 Effect of Exclusion of Anomalous Tropical Stations on Temperature Trends from a 63-Station Radiosonde Network, and Comparison with Other Analyses JAMES K. ANGELL NOAA
An Examination of Anomalously Low Column Ozone in the Southern Hemisphere Midlatitudes During 1997
 San Jose State University From the SelectedWorks of Eugene C. Cordero April, 2002 An Examination of Anomalously Low Column Ozone in the Southern Hemisphere Midlatitudes During 1997 Eugene C. Cordero, San
Seasonal Aerosol Vertical Distribution and Optical Properties over North China Xing-xing GAO, Yan CHEN, Lei ZHANG * and Wu ZHANG
 2017 International Conference on Energy, Environment and Sustainable Development (EESD 2017) ISBN: 978-1-60595-452-3 Seasonal Aerosol Vertical Distribution and Optical Properties over North China Xing-xing
An evaluation of the SAGE III version 4 aerosol extinction coefficient and water vapor data products
 Atmos. Chem. Phys.,, 29 213, www.atmos-chem-phys.net//29// Author(s). This work is distributed under the Creative Commons Attribution 3. License. Atmospheric Chemistry and Physics An evaluation of the
Lab Activity: Climate Variables
 Name: Date: Period: Water and Climate The Physical Setting: Earth Science Lab Activity: Climate Variables INTRODUCTION:! The state of the atmosphere continually changes over time in response to the uneven
Recent anthropogenic increases in SO 2 from Asia have minimal impact on stratospheric aerosol
 GEOPHYSICAL RESEARCH LETTERS, VOL. 40, 999 1004, doi:10.1002/grl.50263, 2013 Recent anthropogenic increases in SO 2 from Asia have minimal impact on stratospheric aerosol R. R. Neely III, 1,2,3 O. B. Toon,
History of Earth Radiation Budget Measurements With results from a recent assessment
 History of Earth Radiation Budget Measurements With results from a recent assessment Ehrhard Raschke and Stefan Kinne Institute of Meteorology, University Hamburg MPI Meteorology, Hamburg, Germany Centenary
Influence of Clouds and Aerosols on the Earth s Radiation Budget Using Clouds and the Earth s Radiant Energy System (CERES) Measurements
 Measurements") Influence of Clouds and Aerosols on the Earth s Radiation Budget Using Clouds and the Earth s Radiant Energy System (CERES) Measurements Norman G. Loeb Hampton University/NASA Langley Research Center Bruce
Influence of Clouds and Aerosols on the Earth s Radiation Budget Using Clouds and the Earth s Radiant Energy System (CERES) Measurements Norman G. Loeb Hampton University/NASA Langley Research Center Bruce
Radiative Climatology of the North Slope of Alaska and the Adjacent Arctic Ocean
 Radiative Climatology of the North Slope of Alaska and the Adjacent Arctic Ocean C. Marty, R. Storvold, and X. Xiong Geophysical Institute University of Alaska Fairbanks, Alaska K. H. Stamnes Stevens Institute
Algorithm document for SCIAMACHY Stratozone limb ozone profile retrievals
 Algorithm document for SCIAMACHY Stratozone limb ozone profile retrievals Date of origin: February 6, 2006 Author: Christian von Savigny Institute of Environmental Physics University of Bremen Otto-Hahn-Allee
FORCING ANTHROPOGENIC
 NATURAL CLIMATIC FORCING Earth-Sun orbital relationships, changing landsea distribution (due to plate tectonics), solar variability & VOLCANIC ERUPTIONS vs. ANTHROPOGENIC FORCING Human-Enhanced GH Effect,
CLIMATE CHANGE Albedo Forcing ALBEDO FORCING
 ALBEDO FORCING Albedo forcing is the hypothesis that variations in the Earth s reflectance of solar radiation can bring about global climate change. This hypothesis is undeniable in principle; since virtually
Human influence on terrestrial precipitation trends revealed by dynamical
 1 2 3 Supplemental Information for Human influence on terrestrial precipitation trends revealed by dynamical adjustment 4 Ruixia Guo 1,2, Clara Deser 1,*, Laurent Terray 3 and Flavio Lehner 1 5 6 7 1 Climate
SUPPLEMENTARY INFORMATION
 SUPPLEMENTARY INFORMATION doi:10.1038/nature11784 Methods The ECHO-G model and simulations The ECHO-G model 29 consists of the 19-level ECHAM4 atmospheric model and 20-level HOPE-G ocean circulation model.
Lecture 8. The Holocene and Recent Climate Change
 Lecture 8 The Holocene and Recent Climate Change Recovery from the last ice age About 15,000 years ago, the earth began to warm and the huge ice sheets covering much of North America and Eurasia began
Decadal variability in the Earth s reflectance as observed by Earthshine Enric Pallé
 Decadal variability in the Earth s reflectance as observed by Earthshine Enric Pallé Big Bear Solar Observatory, NJIT The albedo sets the input to the climate heat engine P in = Cπ R 2 E (1 A); Solar constant
Long-Term Time Series of Water Vapour Total Columns from GOME, SCIAMACHY and GOME-2
 Graphics: ESA Graphics: ESA Graphics: ESA Long-Term Time Series of Water Vapour Total Columns from GOME, SCIAMACHY and GOME-2 S. Noël, S. Mieruch, H. Bovensmann, J. P. Burrows Institute of Environmental
Aerosol_cci Phase 2 Aerosol_cci achievements What data sets are being produced How will they be used
 Aerosol_cci Phase 2 Aerosol_cci achievements What data sets are being produced How will they be used Gerrit de Leeuw (FMI & UHEL), Thomas Holzer-Popp (DLR), & the Aerosol_cci team Overview algorithm version
Generation and Initial Evaluation of a 27-Year Satellite-Derived Wind Data Set for the Polar Regions NNX09AJ39G. Final Report Ending November 2011
 Generation and Initial Evaluation of a 27-Year Satellite-Derived Wind Data Set for the Polar Regions NNX09AJ39G Final Report Ending November 2011 David Santek, PI Space Science and Engineering Center University
Lecture Outlines PowerPoint. Chapter 16 Earth Science 11e Tarbuck/Lutgens
 Lecture Outlines PowerPoint Chapter 16 Earth Science 11e Tarbuck/Lutgens 2006 Pearson Prentice Hall This work is protected by United States copyright laws and is provided solely for the use of instructors
Probability of Cloud-Free-Line-of-Sight (PCFLOS) Derived From CloudSat and CALIPSO Cloud Observations
 Derived From CloudSat and CALIPSO Cloud Observations") Probability of Cloud-Free-Line-of-Sight (PCFLOS) Derived From CloudSat and CALIPSO Cloud Observations Donald L. Reinke, Thomas H. Vonder Haar Cooperative Institute for Research in the Atmosphere Colorado
Probability of Cloud-Free-Line-of-Sight (PCFLOS) Derived From CloudSat and CALIPSO Cloud Observations Donald L. Reinke, Thomas H. Vonder Haar Cooperative Institute for Research in the Atmosphere Colorado
Lecture 7: Natural Climate Change. Instructor: Prof. Johnny Luo.
 Lecture 7: Natural Climate Change Instructor: Prof. Johnny Luo http://www.sci.ccny.cuny.edu/~luo Final Exam: May 23 1-3:15pm at MR O44 Outlines (Chapter 11, Edition 1) 1. Variation in solar luminosity
Externally forced and internal variability in multi-decadal climate evolution
 Externally forced and internal variability in multi-decadal climate evolution During the last 150 years, the increasing atmospheric concentration of anthropogenic greenhouse gases has been the main driver
ONE-YEAR EXPERIMENT IN NUMERICAL PREDICTION OF MONTHLY MEAN TEMPERATURE IN THE ATMOSPHERE-OCEAN-CONTINENT SYSTEM
 71 4 MONTHLY WEATHER REVIEW Vol. 96, No. 10 ONE-YEAR EXPERIMENT IN NUMERICAL PREDICTION OF MONTHLY MEAN TEMPERATURE IN THE ATMOSPHERE-OCEAN-CONTINENT SYSTEM JULIAN ADEM and WARREN J. JACOB Extended Forecast
A stratospheric aerosol climatology from SAGE II and CLAES measurements: 2. Results and comparisons,
 JOURNAL OF GEOPHYSICAL RESEARCH, VOL. 108, NO. D13, 4383, doi:10.1029/2002jd002993, 2003 A stratospheric aerosol climatology from SAGE II and CLAES measurements: 2. Results and comparisons, 1984 1999 J.
NATURAL CLIMATIC FORCING Part II
 TOPIC #12 NATURAL CLIMATIC FORCING Part II (p 72 in Class Notes) Today we will focus on the third main driver of NATURAL CLIMATIC FORCING: 1) ATRONOMICAL FORCING 2) SOLAR FORCING 3) VOLCANIC FORCING VOLCANIC
Global NWP Index documentation
 Global NWP Index documentation The global index is calculated in two ways, against observations, and against model analyses. Observations are sparse in some parts of the world, and using full gridded analyses
SEASONAL AND ANNUAL TRENDS OF AUSTRALIAN MINIMUM/MAXIMUM DAILY TEMPERATURES DURING
 SEASONAL AND ANNUAL TRENDS OF AUSTRALIAN MINIMUM/MAXIMUM DAILY TEMPERATURES DURING 1856-2014 W. A. van Wijngaarden* and A. Mouraviev Physics Department, York University, Toronto, Ontario, Canada 1. INTRODUCTION
UKCA_RADAER Aerosol-radiation interactions
 UKCA_RADAER Aerosol-radiation interactions Nicolas Bellouin UKCA Training Workshop, Cambridge, 8 January 2015 University of Reading 2014 n.bellouin@reading.ac.uk Lecture summary Why care about aerosol-radiation
Bugs in JRA-55 snow depth analysis
 14 December 2015 Climate Prediction Division, Japan Meteorological Agency Bugs in JRA-55 snow depth analysis Bugs were recently found in the snow depth analysis (i.e., the snow depth data generation process)
CHAPTER 4. THE HADLEY CIRCULATION 59 smaller than that in midlatitudes. This is illustrated in Fig. 4.2 which shows the departures from zonal symmetry
 Chapter 4 THE HADLEY CIRCULATION The early work on the mean meridional circulation of the tropics was motivated by observations of the trade winds. Halley (1686) and Hadley (1735) concluded that the trade
Solar Cycle 24 Variability Observed by Aura OMI Matthew DeLand and Sergey Marchenko Science Systems and Applications, Inc. (SSAI)
") Solar Cycle 24 Variability Observed by Aura OMI Matthew DeLand and Sergey Marchenko Science Systems and Applications, Inc. (SSAI) 2014 SORCE Science Meeting Cocoa Beach, FL 28-31 January 2014 Solar Measurements
Solar Cycle 24 Variability Observed by Aura OMI Matthew DeLand and Sergey Marchenko Science Systems and Applications, Inc. (SSAI) 2014 SORCE Science Meeting Cocoa Beach, FL 28-31 January 2014 Solar Measurements
A. Windnagel M. Savoie NSIDC
 National Snow and Ice Data Center ADVANCING KNOWLEDGE OF EARTH'S FROZEN REGIONS Special Report #18 06 July 2016 A. Windnagel M. Savoie NSIDC W. Meier NASA GSFC i 2 Contents List of Figures... 4 List of
Satellite-to-Irradiance Modeling A New Version of the SUNY Model
 Satellite-to-Irradiance Modeling A New Version of the SUNY Model Richard Perez 1, James Schlemmer 1, Karl Hemker 1, Sergey Kivalov 1, Adam Kankiewicz 2 and Christian Gueymard 3 1 Atmospheric Sciences Research
An Overview of Atmospheric Analyses and Reanalyses for Climate
 An Overview of Atmospheric Analyses and Reanalyses for Climate Kevin E. Trenberth NCAR Boulder CO Analysis Data Assimilation merges observations & model predictions to provide a superior state estimate.
Aerosol Composition and Radiative Properties
 Aerosol Composition and Radiative Properties Urs Baltensperger Laboratory of Atmospheric Chemistry Paul Scherrer Institut, 5232 Villigen PSI, Switzerland WMO-BIPM Workshop Geneva, 30 March 1 April 2010
REVISION OF THE STATEMENT OF GUIDANCE FOR GLOBAL NUMERICAL WEATHER PREDICTION. (Submitted by Dr. J. Eyre)
") WORLD METEOROLOGICAL ORGANIZATION Distr.: RESTRICTED CBS/OPAG-IOS (ODRRGOS-5)/Doc.5, Add.5 (11.VI.2002) COMMISSION FOR BASIC SYSTEMS OPEN PROGRAMME AREA GROUP ON INTEGRATED OBSERVING SYSTEMS ITEM: 4 EXPERT
WORLD METEOROLOGICAL ORGANIZATION Distr.: RESTRICTED CBS/OPAG-IOS (ODRRGOS-5)/Doc.5, Add.5 (11.VI.2002) COMMISSION FOR BASIC SYSTEMS OPEN PROGRAMME AREA GROUP ON INTEGRATED OBSERVING SYSTEMS ITEM: 4 EXPERT
Ice clouds observed by passive remote sensing :
 Ice clouds observed by passive remote sensing : What did we learn from the GEWEX Cloud Assessment? Claudia Stubenrauch Laboratoire de Météorologie Dynamique, IPSL/CNRS, France Clouds are extended objects
GLOBAL ATMOSPHERIC MOTION VECTOR INTER-COMPARISON STUDY
 GLOBAL ATMOSPHERIC MOTION VECTOR INTER-COMPARISON STUDY Iliana Genkova (1), Regis Borde (2), Johannes Schmetz (2), Chris Velden (3), Ken Holmlund (2), Mary Forsythe (4), Jamie Daniels (5), Niels Bormann
GMES: calibration of remote sensing datasets
 GMES: calibration of remote sensing datasets Jeremy Morley Dept. Geomatic Engineering jmorley@ge.ucl.ac.uk December 2006 Outline Role of calibration & validation in remote sensing Types of calibration
CHAPTER 2 DATA AND METHODS. Errors using inadequate data are much less than those using no data at all. Charles Babbage, circa 1850
 CHAPTER 2 DATA AND METHODS Errors using inadequate data are much less than those using no data at all. Charles Babbage, circa 185 2.1 Datasets 2.1.1 OLR The primary data used in this study are the outgoing
P6.7 View angle dependence of cloudiness and the trend in ISCCP cloudiness. G.G. Campbell CIRA CSU Ft. Collins CO, USA
 P6.7 View angle dependence of cloudiness and the trend in ISCCP cloudiness G.G. Campbell CIRA CSU Ft. Collins CO, USA Campbell@cira.colostate.edu The International Satellite Cloud Climatology Project cloud
Spatial Variability of Aerosol - Cloud Interactions over Indo - Gangetic Basin (IGB)
") Spatial Variability of Aerosol - Cloud Interactions over Indo - Gangetic Basin (IGB) Shani Tiwari Graduate School of Environmental Studies Nagoya University, Nagoya, Japan Email: pshanitiwari@gmail.com
Spatial Variability of Aerosol - Cloud Interactions over Indo - Gangetic Basin (IGB) Shani Tiwari Graduate School of Environmental Studies Nagoya University, Nagoya, Japan Email: pshanitiwari@gmail.com
On the Satellite Determination of Multilayered Multiphase Cloud Properties. Science Systems and Applications, Inc., Hampton, Virginia 2
 JP1.10 On the Satellite Determination of Multilayered Multiphase Cloud Properties Fu-Lung Chang 1 *, Patrick Minnis 2, Sunny Sun-Mack 1, Louis Nguyen 1, Yan Chen 2 1 Science Systems and Applications, Inc.,
Could Instrumentation Drift Account for Arctic Sea Ice Decline?
 Could Instrumentation Drift Account for Arctic Sea Ice Decline? Jonathan J. Drake 3/31/2012 One of the key datasets used as evidence of anthropogenic global warming is the apparent decline in Arctic sea
Tidal Coupling in the Earth s Atmosphere. Maura Hagan NCAR High Altitude Observatory
 Tidal Coupling in the Earth s Atmosphere Maura Hagan NCAR High Altitude Observatory OUTLINE Motivation - Observations Tidal Nomenclature/Characteristics/Sources Results from the Global-Scale Wave Model
STRUCTURAL ENGINEERS ASSOCIATION OF OREGON
 STRUCTURAL ENGINEERS ASSOCIATION OF OREGON P.O. Box 3285 PORTLAND, OR 97208 503.753.3075 www.seao.org E-mail: jane@seao.org 2010 OREGON SNOW LOAD MAP UPDATE AND INTERIM GUIDELINES FOR SNOW LOAD DETERMINATION
WMO OSCAR. Observing Systems Capability Analysis and Review Tool A building block of Rolling Requirements Review
 WMO OSCAR Observing Systems Capability Analysis and Review Tool A building block of Rolling Requirements Review Quantitative user-defined requirements for observation of physical variables in application
GPS Radio Occultation for studying extreme events
 GPS Radio Occultation for studying extreme events Riccardo Biondi (1), A. K. Steiner (1), T. Rieckh (1) and G. Kirchengast (1,2) (1) Wegener Center for Climate and Global Change, University of Graz, Austria