Hot spot Analysis with Clustering on NIJ Data Set The Data Set:
|
|
|
- Elijah Barrett
- 5 years ago
- Views:
Transcription
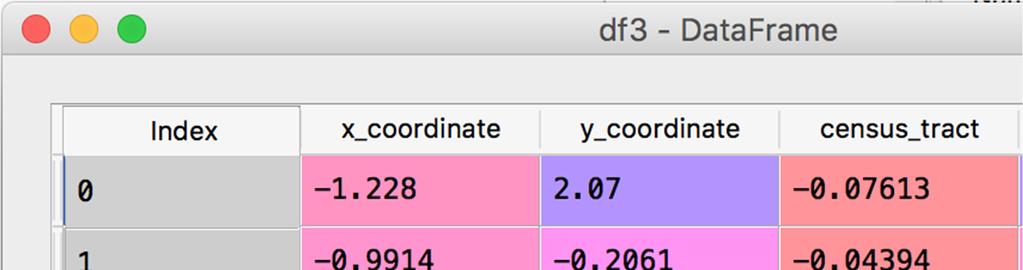
1 Hot spot Analysis with Clustering on NIJ Data Set The Data Set: The data set consists of Category, Call groups, final case type, case desc, Date, X-coordinates, Y- coordinates and census-tract. X-coordinates and Y-coordinates describes longitudes and longitudes respectively and censustract describes the z-coordinate. Case desc describes case description.there are multiple kinds of cases like disturbance, assault, robbery, robbery with weapon, threat, drugs, liquor, prostitution gambling etc. There are two types of categories: Street crimes and final case type.


2 The data set is an excel file(.xlxs) and is shown above. Data Preprocessing : The Data set procured from the Portland District Police Website had some dirty data in the form of blank cells or blank spaces.due to the presence of leading white spaces being too high we use the visualbasic scriptto remove the Leading blank/white spaces.


3 One the White spaces are removed we import the file into the python IDE. We represent the excel file in a pandas dataframe. The reason the pandas dataframe was chosen and not the numpy array was due to the fact that pandas wraps around numpy and to handle heterogenous data the pandas dataframe is quite convenient.


4 ArcMAP ArcGIS is a geographic information system (GIS) for working with maps and geographic information. Used for creating and using maps, compiling geographic data, analyzing mapped information, sharing and discovering geographic information, using maps and geographic information in a range of applications, and managing geographic information in a database.
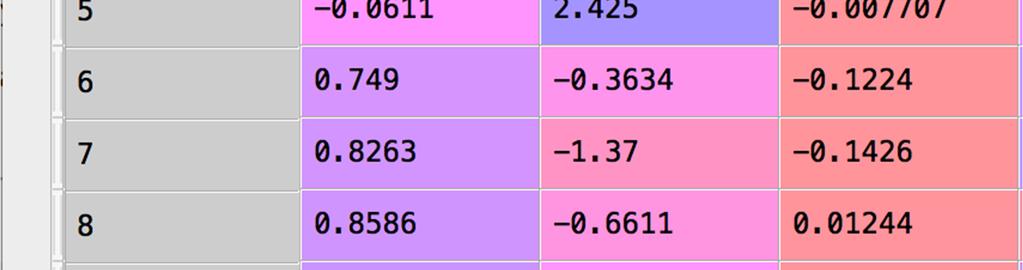
5 Thus we successfully import the file in a dataframe for futhur analysis. Later, the data set contains some columns that are of no use for this analysis.as a result we drop these columns and create a new frame with the required columns. We set the precision of the pandas dataframe to be displayed upto 4 decimal places.although the spyder IDE has a built in option to display the precision according to the user specified value but still it is just a addition step to view the data more clearly in a IDE different from spyder. The data from the columns : x_coordinate and y_ Coordinate is too high and thus for the ease of calculation we perform the Z-score normalization on
6 these values.these values represent the location coordinates for the criminal activities. Now once the normalization is complete we get the values as follows :


7 After normalization we compute the K-Means clustering on the obtained preprocessed and reduced data set.
8 Here, the test shown above is generated using the number of clusters = 18 and max iterations to be 100.The tests were ran for no of clusters in the range of 4 22 and the number of clusters 18 gave an representable and expected result. Once the clustering was done, the generated cluster frame is appended to the original data frame and a separate column named : cluster. Thus it provides us the with the idea as to which row belongs to which cluster.


9 Thus the resulting data frame is as follows : We the write the obtained result back to an excel file and name it : DataMod.xlsx.
10 Graphical Visualization : We represent the clusters visually in python using the seaborn scatterplot. First we need the packages. We utilize the seaborn scatterplot to represent the clusters visually. The plot is x-coordinate vs y_coordinate and the hue attribute being the cluster column. The marker style selected is B and the size selected is 60. The obtained scatterplot is as follows :

11 The above plot shows all the 18 obtained clusters with different color codes. The next visualization includes real time plotting the data on the Portland map.


12 Importing the file into Arcmap : Thus the python-based analysis is now complete and we now move forward to representing the obtained data on a real-time coordinate based map representation. Now first we need to establish a connection to the file. This is done via the catalog side bar. Later on we choose the Connect to Folder option. Once we specify the file directory, the file is ready to get imported inside the workspace.note : We import the actual Sheets inside the workbook as a layer inside arcmap.


13 But we have one restriction here. To successfully work on individual data columns inside the arcmap workspace, we need feature classes for our data sets. Feature classes basically provide every record inside the dataset with a unique ID called OBJECT ID. Without the OBJECT ID its not possible to work on a attribute level.our analysis involves representing the generated clusters onto the map and cluster being an attribute in our dataset, adding the feature classes is an essential step.


14 Once we select the Create Feature Class option, we need to specify the X-coordinate, Y-coordinate and Z- coordinate to specify the X-Y values for our plot.our dataset has these values inside the columns : x_coordinate,y_coordinate and census_tract


15 respectively.we simple select the columns accordingly and complete the feature class creation process. Also, We specify a coordinate system for the class. We have the data from Portland North Oregon and this we select the co-ordinate system appropriately. We get the co-ordinate system information from the original portland shape file obtained from the website.


16 Thus as a result we convert the class co-ordinate plane into a plane of our choice. Once we complete the process we generate the required shape file in the specified
17 directory. Later on we import the shape file inside the workspace by a simple drag and drop operation. Once we finish the import, we get a general view as follows: The above representation just displays the points according to the coordinates specified inside the feature class. To represent the individual clusters we need to select the features by attributes.


18 Thus the attribute selection window, allows us to select the attribute of our choice by simply generating the queries.


19

20 Thus as seen, we are interested in the cluster attribute. We have a total of 18 clusters and the unique values are displayed to the right. To simply add each and every cluster as a layer in the arcmap we change the query value from 0 to and so on upto 17. As a result each and every cluster is now a separate layer as shown inside the Table of Contents pane to the left. Each point belonging to a particular cluster has a different color-code. The main step of geo-plotting the obtained points on a definite coordinate system is finished. Next step involves importing the required shape files for more detailed representation.


21 The shape files are: 1. Portland district shape file 2. Park trails. 3. Water banks. Thus the final representation is as follows : The above map gives an overall representation.


22 The above image highlights the area with high crime saturation.the above maps are generated with cluster size =4. For a more detailed description and analyzing the highly saturated criminal activity areas we analyze the data for no. of clusters = 18. We do the Hot-Spot Analysis. For the hot-spot analsys to work we need a fishnet grid shown as follows :

 and")

23 The above grid is a 30x30 grid superimposed onto the map. The Hot-spot analysis determines the area with the largest saturation of criminal activity. The analysis performed is the : Optimum hotspot analysis. It identifies statistically significant spatial clusters of high values (hot spots) and low values (cold spots).thus it segregates them on the basis of hot spots and cold-spots respectively. The hot-spots are marked with the red blocks on the fishnet grid. Along with the spot identification, we also find a confidence level for


24 each block of the grid.the confidence level of 99% is considered as the perfect hot-spot for our analysis. Thus the above representation displays the hot-spots with red colored blocks.
Intro to GIS In Review
 Intro to GIS In Review GIS Analysis Winter 2016 GIS A quarter in review Geographic data types Acquiring GIS data Projections / Coordinate systems Working with attribute tables Data classification Map design
Working with Temporal Data in ArcGIS
 Working with Temporal Data in ArcGIS By Aileen Buckley, Esri Research Cartographer Time is an important dimension in many types of geospatial visualizations and analyses. The temporal aspect adds when
Data Structures & Database Queries in GIS
 Data Structures & Database Queries in GIS Objective In this lab we will show you how to use ArcGIS for analysis of digital elevation models (DEM s), in relationship to Rocky Mountain bighorn sheep (Ovis
GIS Software. Evolution of GIS Software
 GIS Software The geoprocessing engines of GIS Major functions Collect, store, mange, query, analyze and present Key terms Program collections of instructions to manipulate data Package integrated collection
Combing Open-Source Programming Languages with GIS for Spatial Data Science. Maja Kalinic Master s Thesis
 Combing Open-Source Programming Languages with GIS for Spatial Data Science Maja Kalinic Master s Thesis International Master of Science in Cartography 14.09.2017 Outline Introduction and Motivation Research
Task 1: Start ArcMap and add the county boundary data from your downloaded dataset to the data frame.
 Exercise 6 Coordinate Systems and Map Projections The following steps describe the general process that you will follow to complete the exercise. Specific steps will be provided later in the step-by-step
Esri EADA10. ArcGIS Desktop Associate. Download Full Version :
 Esri EADA10 ArcGIS Desktop Associate Download Full Version : http://killexams.com/pass4sure/exam-detail/eada10 Question: 85 Which format is appropriate for exporting map documents that require vector layers
Lecture 2. Introduction to ESRI s ArcGIS Desktop and ArcMap
 Lecture 2 Introduction to ESRI s ArcGIS Desktop and ArcMap Outline ESRI What is ArcGIS? ArcGIS Desktop ArcMap Overview Views Layers Attribute Tables Help! Scale Tips and Tricks ESRI Environmental Systems
In this exercise we will learn how to use the analysis tools in ArcGIS with vector and raster data to further examine potential building sites.
 GIS Level 2 In the Introduction to GIS workshop we filtered data and visually examined it to determine where to potentially build a new mixed use facility. In order to get a low interest loan, the building
The data for this lab comes from McDonald Forest. We will be working with spatial data representing the forest boundary, streams, roads, and stands.
 GIS LAB 6 Using the Projection Utility. Converting Data to Oregon s Approved Lambert Projection. Determining Stand Size, Stand Types, Road Length, and Stream Length. This lab will ask you to work with
Utilizing Data from American FactFinder with TIGER/Line Shapefiles in ArcGIS
 Utilizing Data from American FactFinder with TIGER/Line Shapefiles in ArcGIS Web Adams, GISP Data Dissemination Specialist U.S. Census Bureau New York Regional Office 1 What We Do Decennial Census Every
GEOREFERENCING, PROJECTIONS Part I. PRESENTING DATA Part II
 Week 7 GEOREFERENCING, PROJECTIONS Part I PRESENTING DATA Part II topics of the week Georeferencing Coordinate systems Map Projections ArcMap and Projections Geo-referencing Geo-referencing is the process
Spatial Analysis using Vector GIS THE GOAL: PREPARATION:
 PLAN 512 GIS FOR PLANNERS Department of Urban and Environmental Planning University of Virginia Fall 2006 Prof. David L. Phillips Spatial Analysis using Vector GIS THE GOAL: This tutorial explores some
UNIT 4: USING ArcGIS. Instructor: Emmanuel K. Appiah-Adjei (PhD) Department of Geological Engineering KNUST, Kumasi
 Department of Geological Engineering KNUST, Kumasi") UNIT 4: USING ArcGIS Instructor: Emmanuel K. Appiah-Adjei (PhD) Department of Geological Engineering KNUST, Kumasi Getting to Know ArcGIS ArcGIS is an integrated collection of GIS software products ArcGIS
UNIT 4: USING ArcGIS Instructor: Emmanuel K. Appiah-Adjei (PhD) Department of Geological Engineering KNUST, Kumasi Getting to Know ArcGIS ArcGIS is an integrated collection of GIS software products ArcGIS
Welcome! Power BI User Group (PUG) Copenhagen
 Copenhagen") Welcome! Power BI User Group (PUG) Copenhagen Making Maps in Power BI Andrea Martorana Tusa BI Specialist Welcome to Making maps in Power BI Who am I? First name: Andrea. Last name: Martorana Tusa. Italian,
Welcome! Power BI User Group (PUG) Copenhagen Making Maps in Power BI Andrea Martorana Tusa BI Specialist Welcome to Making maps in Power BI Who am I? First name: Andrea. Last name: Martorana Tusa. Italian,
ArcMap - EXPLORING THE DATABASE Part I. SPATIAL DATA FORMATS Part II
 Week 5 ArcMap - EXPLORING THE DATABASE Part I SPATIAL DATA FORMATS Part II topics of the week Exploring the Database More on the Table of Contents Exploration tools Identify, Find, Measure, Map tips, Hyperlink,
Calculating Conflict Density and Change over Time in Uganda using Vector Techniques
 Calculating Conflict Density and Change over Time in Uganda using Vector Techniques Created by Patrick Florance and Kyle Monahan; revised by Patrick Florance April 2, 2018. OVERVIEW... 1 SET UP... 1 SET
GIS Functions and Integration. Tyler Pauley Associate Consultant
 GIS Functions and Integration Tyler Pauley Associate Consultant Contents GIS in AgileAssets products Displaying data within AMS Symbolizing the map display Display on Bing Maps Demo- Displaying a map in
Downloading GPS Waypoints
 Downloading Data with DNR- GPS & Importing to ArcMap and Google Earth Written by Patrick Florance & Carolyn Talmadge, updated on 4/10/17 DOWNLOADING GPS WAYPOINTS... 1 VIEWING YOUR POINTS IN GOOGLE EARTH...
A Geo-Statistical Approach for Crime hot spot Prediction
 A Geo-Statistical Approach for Crime hot spot Prediction Sumanta Das 1 Malini Roy Choudhury 2 Abstract Crime hot spot prediction is a challenging task in present time. Effective models are needed which
The Geodatabase Working with Spatial Analyst. Calculating Elevation and Slope Values for Forested Roads, Streams, and Stands.
 GIS LAB 7 The Geodatabase Working with Spatial Analyst. Calculating Elevation and Slope Values for Forested Roads, Streams, and Stands. This lab will ask you to work with the Spatial Analyst extension.
DATA SCIENCE SIMPLIFIED USING ARCGIS API FOR PYTHON
 DATA SCIENCE SIMPLIFIED USING ARCGIS API FOR PYTHON LEAD CONSULTANT, INFOSYS LIMITED SEZ Survey No. 41 (pt) 50 (pt), Singapore Township PO, Ghatkesar Mandal, Hyderabad, Telengana 500088 Word Limit of the
Automatic Watershed Delineation using ArcSWAT/Arc GIS
 Automatic Watershed Delineation using ArcSWAT/Arc GIS By: - Endager G. and Yalelet.F 1. Watershed Delineation This tool allows the user to delineate sub watersheds based on an automatic procedure using
Analyzing the Earth Using Remote Sensing
 Analyzing the Earth Using Remote Sensing Instructors: Dr. Brian Vant- Hull: Steinman 185, 212-650- 8514 brianvh@ce.ccny.cuny.edu Ms. Hannah Aizenman: NAC 7/311, 212-650- 6295 haizenman@ccny.cuny.edu Dr.
Studying Topography, Orographic Rainfall, and Ecosystems (STORE)
") Studying Topography, Orographic Rainfall, and Ecosystems (STORE) Introduction Basic Lesson 3: Using Microsoft Excel to Analyze Weather Data: Topography and Temperature This lesson uses NCDC data to compare
Studying Topography, Orographic Rainfall, and Ecosystems (STORE) Introduction Basic Lesson 3: Using Microsoft Excel to Analyze Weather Data: Topography and Temperature This lesson uses NCDC data to compare
Using a GIS to Calculate Area of Occupancy. Part 1: Creating a Shapefile Grid
 Using a GIS to Calculate Area of Occupancy Part 1: Creating a Shapefile Grid By Ryan Elliott California Natural Diversity Database, A NatureServe network program December 2008 This document describes the
Displaying Latitude & Longitude Data (XY Data) in ArcGIS
 in ArcGIS") Displaying Latitude & Longitude Data (XY Data) in ArcGIS Created by Barbara Parmenter and updated on 2/15/2018 If you have a table of data that has longitude and latitude, or XY coordinates, you can view
Displaying Latitude & Longitude Data (XY Data) in ArcGIS Created by Barbara Parmenter and updated on 2/15/2018 If you have a table of data that has longitude and latitude, or XY coordinates, you can view
SCHOOL OF ENGINEERING AND TECHNOLOGY COMPUTER LAB
 PHASE 1_6 TH SESSION ARCGIS TRAINING AT KU GIS LABS: INTRODUCTION TO GIS: EXPLORING ARCCATALOG AND ARCGIS TOOLS 6 TH SESSION REPORT: 3 RD -5 TH SEPTEMBER 2014 SCHOOL OF ENGINEERING AND TECHNOLOGY COMPUTER
Texas A&M University
 Texas A&M University CVEN 658 Civil Engineering Applications of GIS Hotspot Analysis of Highway Accident Spatial Pattern Based on Network Spatial Weights Instructor: Dr. Francisco Olivera Author: Zachry
Map image from the Atlas of Oregon (2nd. Ed.), Copyright 2001 University of Oregon Press
, Copyright 2001 University of Oregon Press") Map Layout and Cartographic Design with ArcGIS Desktop Matthew Baker ESRI Educational Services Redlands, CA Education UC 2008 1 Seminar overview General map design principles Working with map elements
Map Layout and Cartographic Design with ArcGIS Desktop Matthew Baker ESRI Educational Services Redlands, CA Education UC 2008 1 Seminar overview General map design principles Working with map elements
GED 554 IT & GIS. Lecture 6 Exercise 5. May 10, 2013
 GED 554 IT & GIS Lecture 6 Exercise 5 May 10, 2013 Free GIS data sources ******************* Mapping numerical data & Symbolization ******************* Exercise: Making maps for presentation GIS DATA SOFTWARE
Esri UC2013. Technical Workshop.
 Esri International User Conference San Diego, California Technical Workshops July 9, 2013 CAD: Introduction to using CAD Data in ArcGIS Jeff Reinhart & Phil Sanchez Agenda Overview of ArcGIS CAD Support
Watershed Delineation
 Watershed Delineation Jessica L. Watkins, University of Georgia 2 April 2009 Updated by KC Love February 25, 2011 PURPOSE For this project, I delineated watersheds for the Coweeta synoptic sampling area
The CrimeStat Program: Characteristics, Use, and Audience
 The CrimeStat Program: Characteristics, Use, and Audience Ned Levine, PhD Ned Levine & Associates and Houston-Galveston Area Council Houston, TX In the paper and presentation, I will discuss the CrimeStat
Chapter 1 Introducing GIS for police work
 Chapter 1 Introducing GIS for police work Introduction This chapter introduces crime mapping and analysis using Esri s ArcGIS Desktop for meeting the day-to-day information needs of police organizations.
GIS Workshop UCLS_Fall Forum 2014 Sowmya Selvarajan, PhD TABLE OF CONTENTS
 TABLE OF CONTENTS TITLE PAGE NO. 1. ArcGIS Basics I 2 a. Open and Save a Map Document 2 b. Work with Map Layers 2 c. Navigate in a Map Document 4 d. Measure Distances 4 2. ArcGIS Basics II 5 a. Work with
These modules are covered with a brief information and practical in ArcGIS Software and open source software also like QGIS, ILWIS.
 Online GIS Training and training modules covered are: 1. ArcGIS, Analysis, Fundamentals and Implementation 2. ArcGIS Web Data Sharing 3. ArcGIS for Desktop 4. ArcGIS for Server These modules are covered
This lab exercise will try to answer these questions using spatial statistics in a geographic information system (GIS) context.
 context.") by Introduction Problem Do the patterns of forest fires change over time? Do forest fires occur in clusters, and do the clusters change over time? Is this information useful in fighting forest fires? This
by Introduction Problem Do the patterns of forest fires change over time? Do forest fires occur in clusters, and do the clusters change over time? Is this information useful in fighting forest fires? This
Geography 281 Map Making with GIS Project Four: Comparing Classification Methods
 Geography 281 Map Making with GIS Project Four: Comparing Classification Methods Thematic maps commonly deal with either of two kinds of data: Qualitative Data showing differences in kind or type (e.g.,
Introduction: Name Redacted November 17, 2017 GSP 370 Research Proposal and Literature Review
 Name Redacted November 17, 2017 GSP 370 Research Proposal and Literature Review Introduction: The study of spatial patterns and distributions has been conducted for many years. Over the last few decades,
Students will be able, using GIS, to locate the largest and most destructive earthquakes;
 Exploring Earthquake Hazards with GIS Laboratory for Introduction to Geophysics, Spring 2007 Prof. Constantin Cranganu Brooklyn College of the City University of New York Learning Objectives: Students
Gis Unit TropMed Mahidol U.
 Gis Unit TropMed Mahidol U. Database Information System Database Concepts 1. Non-Spatial Database table, document.. 2. Spatial Database locational databases (geographic) + attribute databases Gis Unit
ArcGIS API for Python for Data Scientists. Andrew Chapkowski Alberto Nieto
 ArcGIS API for Python for Data Scientists Andrew Chapkowski Alberto Nieto Analysts, Data Scientists and Developers Source: PyCon India 2018 Python And Data: Past, Present And Future By Peter Wang Why
Geoprocessing Tools at ArcGIS 9.2 Desktop
 Geoprocessing Tools at ArcGIS 9.2 Desktop Analysis Tools Analysis Tools \ Extract Clip Analysis Tools \ Extract Select Analysis Tools \ Extract Split Analysis Tools \ Extract Table Select Analysis Tools
Aileen Buckley, Ph.D. and Charlie Frye
 An Information Model for Maps: Towards Production from GIS Databases Aileen Buckley, Ph.D. and Charlie Frye Researchers, ESRI GIS vs. cart GIS Outline of the presentation Introduction Differences between
Geodatabase An Overview
 Federal GIS Conference February 9 10, 2015 Washington, DC Geodatabase An Overview Ralph Denkenberger - esri Session Path The Geodatabase - What is it? - Why use it? - What types are there? Inside the Geodatabase
Environmental Criminology
 ENVIRONMENTAL CRIMINOLOGY AND THE IMPACT OF PROBLEM BUSINESSES ON CRIME IN PORTLAND NEIGHBORHOODS Presented by Ryan Arnold Hector Osuna Allen Byrd Environmental Criminology Annually crime plays a large
GIS Quick Facts. CIVL 1101 GIS Quick Facts 1/5.
 CIVL 1101 1/5 What is GIS? Geographic Information Systems (GIS) provide a platform for displaying and analyzing spatial data. GIS systems allow you to view multiple layers of data simultaneously. GIS is
DUSP INTRODUCTIONS WHAT IS GIS? REQUIREMENTS AND TESTOUT GIS TESTOUT REVIEW FALL 2015 SEPTEMBER 3, 2015 ROOM :00-5:00PM
 GIS @ DUSP INTRODUCTIONS WHAT IS GIS? REQUIREMENTS AND TESTOUT GIS TESTOUT REVIEW FALL 2015 SEPTEMBER 3, 2015 ROOM 4-237 - 3:00-5:00PM Merge Geography, Data, and Planning Promote Literacy in Spatial Technology
Are You Maximizing The Value Of All Your Data?
 Are You Maximizing The Value Of All Your Data? Using The SAS Bridge for ESRI With ArcGIS Business Analyst In A Retail Market Analysis SAS and ESRI: Bringing GIS Mapping and SAS Data Together Presented
caused displacement of ocean water resulting in a massive tsunami. II. Purpose
 I. Introduction The Great Sumatra Earthquake event took place on December 26, 2004, and was one of the most notable and devastating natural disasters of the decade. The event consisted of a major initial
(THIS IS AN OPTIONAL BUT WORTHWHILE EXERCISE)
") PART 2: Analysis in ArcGIS (THIS IS AN OPTIONAL BUT WORTHWHILE EXERCISE) Step 1: Start ArcCatalog and open a geodatabase If you have a shortcut icon for ArcCatalog on your desktop, double-click it to start
PART 2: Analysis in ArcGIS (THIS IS AN OPTIONAL BUT WORTHWHILE EXERCISE) Step 1: Start ArcCatalog and open a geodatabase If you have a shortcut icon for ArcCatalog on your desktop, double-click it to start
DP Project Development Pvt. Ltd.
 Dear Sir/Madam, Greetings!!! Thanks for contacting DP Project Development for your training requirement. DP Project Development is leading professional training provider in GIS technologies and GIS application
Week 8 Cookbook: Review and Reflection
 : Review and Reflection Week 8 Overview 8.1) Review and Reflection 8.2) Making Intelligent Maps: The map sheet as a blank canvas 8.3) Making Intelligent Maps: Base layers and analysis layers 8.4) ArcGIS
Geodatabase An Introduction
 2013 Esri International User Conference July 8 12, 2013 San Diego, California Technical Workshop Geodatabase An Introduction David Crawford and Jonathan Murphy Session Path The Geodatabase What is it?
GIS Semester Project Working With Water Well Data in Irion County, Texas
 GIS Semester Project Working With Water Well Data in Irion County, Texas Grant Hawkins Question for the Project Upon picking a random point in Irion county, Texas, to what depth would I have to drill a
GIS CONCEPTS ARCGIS METHODS AND. 2 nd Edition, July David M. Theobald, Ph.D. Natural Resource Ecology Laboratory Colorado State University
 GIS CONCEPTS AND ARCGIS METHODS 2 nd Edition, July 2005 David M. Theobald, Ph.D. Natural Resource Ecology Laboratory Colorado State University Copyright Copyright 2005 by David M. Theobald. All rights
Environmental Systems Research Institute
 Introduction to ArcGIS ESRI Environmental Systems Research Institute Redlands, California 2 ESRI GIS Development Arc/Info (coverage model) Versions 1-7 from 1980 1999 Arc Macro Language (AML) ArcView (shapefile
Lecture 2. A Review: Geographic Information Systems & ArcGIS Basics
 Lecture 2 A Review: Geographic Information Systems & ArcGIS Basics GIS Overview Types of Maps Symbolization & Classification Map Elements GIS Data Models Coordinate Systems and Projections Scale Geodatabases
Comparing whole genomes
 BioNumerics Tutorial: Comparing whole genomes 1 Aim The Chromosome Comparison window in BioNumerics has been designed for large-scale comparison of sequences of unlimited length. In this tutorial you will
Performing Advanced Cartography with Esri Production Mapping
 Esri International User Conference San Diego, California Technical Workshops July 25, 2012 Performing Advanced Cartography with Esri Production Mapping Tania Pal & Madhura Phaterpekar Agenda Outline generic
Style-aware Mid-level Representation for Discovering Visual Connections in Space and Time
 Style-aware Mid-level Representation for Discovering Visual Connections in Space and Time Experiment presentation for CS3710:Visual Recognition Presenter: Zitao Liu University of Pittsburgh ztliu@cs.pitt.edu
Performing Map Cartography. using Esri Production Mapping
 AGENDA Performing Map Cartography Presentation Title using Esri Production Mapping Name of Speaker Company Name Kannan Jayaraman Agenda Introduction What s New in ArcGIS 10.1 ESRI Production Mapping Mapping
Assessing Point Groundwater Contamination Potential
 Assessing Point Groundwater Contamination Potential Florida caves by Introduction Problem Where might caves in Florida be susceptible to potential point contamination sources such as hazardous material
Lecture 4. Spatial Statistics
 Lecture 4 Spatial Statistics Lecture 4 Outline Statistics in GIS Spatial Metrics Cell Statistics Neighborhood Functions Neighborhood and Zonal Statistics Mapping Density (Density surfaces) Hot Spot Analysis
Introduction to ArcGIS 10.2
 Introduction to ArcGIS 10.2 Francisco Olivera, Ph.D., P.E. Srikanth Koka Lauren Walker Aishwarya Vijaykumar Keri Clary Department of Civil Engineering April 21, 2014 Contents Brief Overview of ArcGIS 10.2...
Analysis of Change in Land Use around Future Core Transit Corridors: Austin, TX, Eric Porter May 3, 2012
 Analysis of Change in Land Use around Future Core Transit Corridors: Austin, TX, 1990-2006 PROBLEM DEFINITION Eric Porter May 3, 2012 This study examines the change in land use from 1990 to 2006 in the
WlLPEN L. GORR KRISTEN S. KURLAND. Universitats- und Landesbibliothek. Bibliothek Architektur und Stadtebau ESRI
 hj WlLPEN L. GORR KRISTEN S. KURLAND Universitats- und Landesbibliothek Darmstadt Bibliothek Architektur und Stadtebau ESRI Contents Acknowledgments Preface xvii XV GIS Tutorial 1 Introduction Launch ArcMap
Map your way to deeper insights
 Map your way to deeper insights Target, forecast and plan by geographic region Highlights Apply your data to pre-installed map templates and customize to meet your needs. Select from included map files
How to Make or Plot a Graph or Chart in Excel
 This is a complete video tutorial on How to Make or Plot a Graph or Chart in Excel. To make complex chart like Gantt Chart, you have know the basic principles of making a chart. Though I have used Excel
WEATHER AND CLIMATE COMPLETING THE WEATHER OBSERVATION PROJECT CAMERON DOUGLAS CRAIG
 WEATHER AND CLIMATE COMPLETING THE WEATHER OBSERVATION PROJECT CAMERON DOUGLAS CRAIG Introduction The Weather Observation Project is an important component of this course that gets you to look at real
Using the Stock Hydrology Tools in ArcGIS
 Using the Stock Hydrology Tools in ArcGIS This lab exercise contains a homework assignment, detailed at the bottom, which is due Wednesday, October 6th. Several hydrology tools are part of the basic ArcGIS
Crime Analysis. GIS Solutions for Intelligence-Led Policing
 Crime Analysis GIS Solutions for Intelligence-Led Policing Applying GIS Technology to Crime Analysis Know Your Community Analyze Your Crime Use Your Advantage GIS aids crime analysis by Identifying and
ArcGIS 9.0 Crime Mapping Workbook. We have now arrived at the workbook section of the textbook. The workbook is
 ArcGIS 9.0 Crime Mapping Workbook Introduction We have now arrived at the workbook section of the textbook. The workbook is designed to provide students with a hands-on method for learning the basics of
GEOG4017 Geographical Information Systems Lab 8 Spatial Analysis and Digital Terrain Modeling
 DEPARTMENT OF GEOGRAPHY HONG KONG BAPTIST UNIVERSITY Prof. Q. Zhou GEOG4017 Geographical Information Systems Lab 8 Spatial Analysis and Digital Terrain Modeling Objectives The exercise is designed to familiarize
Providing Electronic Information on Waste Water Discharge Locations
 Providing Electronic Information on Waste Water Discharge Locations Application Guidance Notes Environmental Protection Agency PO Box 3000, Johnstown Castle Estate, Co. Wexford Lo Call: 1890 335599 Telephone:
Geodatabase An Introduction
 Federal GIS Conference 2014 February 10 11, 2014 Washington DC Geodatabase An Introduction Ralph Denkenberger esri Session Path The Geodatabase - What is it? - Why use it? - What types are there? Inside
WMS 9.0 Tutorial GSSHA Modeling Basics Infiltration Learn how to add infiltration to your GSSHA model
 v. 9.0 WMS 9.0 Tutorial GSSHA Modeling Basics Infiltration Learn how to add infiltration to your GSSHA model Objectives This workshop builds on the model developed in the previous workshop and shows you
Trouble-Shooting Coordinate System Problems
 Trouble-Shooting Coordinate System Problems Written by Barbara M. Parmenter, revised 2/25/2014 OVERVIEW OF THE EXERCISE... 1 COPYING THE MAP PROJECTION EXERCISE FOLDER TO YOUR H: DRIVE OR DESKTOP... 2
Your work from these three exercises will be due Thursday, March 2 at class time.
 GEO231_week5_2012 GEO231, February 23, 2012 Today s class will consist of three separate parts: 1) Introduction to working with a compass 2) Continued work with spreadsheets 3) Introduction to surfer software
ST-Links. SpatialKit. Version 3.0.x. For ArcMap. ArcMap Extension for Directly Connecting to Spatial Databases. ST-Links Corporation.
 ST-Links SpatialKit For ArcMap Version 3.0.x ArcMap Extension for Directly Connecting to Spatial Databases ST-Links Corporation www.st-links.com 2012 Contents Introduction... 3 Installation... 3 Database
Abstract: Contents. Literature review. 2 Methodology.. 2 Applications, results and discussion.. 2 Conclusions 12. Introduction
 Abstract: Landfill is one of the primary methods for municipal solid waste disposal. In order to reduce the environmental damage and to protect the public health and welfare, choosing the site for landfill
GIS IN ECOLOGY: ANALYZING RASTER DATA
 GIS IN ECOLOGY: ANALYZING RASTER DATA Contents Introduction... 2 Raster Tools and Functionality... 2 Data Sources... 3 Tasks... 4 Getting Started... 4 Creating Raster Data... 5 Statistics... 8 Surface
A Basic Introduction to Geographic Information Systems (GIS) ~~~~~~~~~~
 ~~~~~~~~~~") A Basic Introduction to Geographic Information Systems (GIS) ~~~~~~~~~~ Rev. Ronald J. Wasowski, C.S.C. Associate Professor of Environmental Science University of Portland Portland, Oregon 3 September
A Basic Introduction to Geographic Information Systems (GIS) ~~~~~~~~~~ Rev. Ronald J. Wasowski, C.S.C. Associate Professor of Environmental Science University of Portland Portland, Oregon 3 September
Gridded Ambient Air Pollutant Concentrations for Southern California, User Notes authored by Beau MacDonald, 11/28/2017
 Gridded Ambient Air Pollutant Concentrations for Southern California, 1995-2014 User Notes authored by Beau, 11/28/2017 METADATA: Each raster file contains data for one pollutant (NO2, O3, PM2.5, and PM10)
Introduction. Project Summary In 2014 multiple local Otsego county agencies, Otsego County Soil and Water
 Introduction Project Summary In 2014 multiple local Otsego county agencies, Otsego County Soil and Water Conservation District (SWCD), the Otsego County Planning Department (OPD), and the Otsego County
An Information Model for Maps: Towards Cartographic Production from GIS Databases
 An Information Model for s: Towards Cartographic Production from GIS Databases Aileen Buckley, Ph.D. and Charlie Frye Senior Cartographic Researchers, ESRI Barbara Buttenfield, Ph.D. Professor, University
Geometric Algorithms in GIS
 Geometric Algorithms in GIS GIS Software Dr. M. Gavrilova GIS System What is a GIS system? A system containing spatially referenced data that can be analyzed and converted to new information for a specific
Theory, Concepts and Terminology
 GIS Workshop: Theory, Concepts and Terminology 1 Theory, Concepts and Terminology Suggestion: Have Maptitude with a map open on computer so that we can refer to it for specific menu and interface items.
Regression Analysis of 911 call frequency in Portland, OR Urban Areas in Relation to Call Center Vicinity Elyse Maurer March 13, 2015
 Regression Analysis of 911 call frequency in Portland, OR Urban Areas in Relation to Call Center Vicinity Elyse Maurer March 13, 2015 Introduction: Using the Linear Regression and Geographically Weighted
Hot Spot / Kernel Density Analysis: Calculating the Change in Uganda Conflict Zones
 Hot Spot / Kernel Density Analysis: Calculating the Change in Uganda Conflict Zones Created by Patrick Florance; revised by Carolyn Talmadge, Madeline Wrable, Kyle Monahan on March 28, 2017 OVERVIEW...
Developing an Analysis Process for Crime Hot Spot Identification and Comparison
 Developing an Analysis Process for Crime Hot Spot Identification and Comparison Joseph M. Dick and Matthew S. Dick Department of Resource Analysis, Saint Mary s University of Minnesota, Minneapolis, MN
ArcGIS Pro: Essential Workflows STUDENT EDITION
 ArcGIS Pro: Essential Workflows STUDENT EDITION Copyright 2018 Esri All rights reserved. Course version 6.0. Version release date August 2018. Printed in the United States of America. The information contained
Outline. ArcGIS? ArcMap? I Understanding ArcMap. ArcMap GIS & GWR GEOGRAPHICALLY WEIGHTED REGRESSION. (Brief) Overview of ArcMap
 Overview of ArcMap") GEOGRAPHICALLY WEIGHTED REGRESSION Outline GWR 3.0 Software for GWR (Brief) Overview of ArcMap Displaying GWR results in ArcMap stewart.fotheringham@nuim.ie http://ncg.nuim.ie ncg.nuim.ie/gwr/ ArcGIS?
GEOGRAPHICALLY WEIGHTED REGRESSION Outline GWR 3.0 Software for GWR (Brief) Overview of ArcMap Displaying GWR results in ArcMap stewart.fotheringham@nuim.ie http://ncg.nuim.ie ncg.nuim.ie/gwr/ ArcGIS?
94-802Z: Geographic Information Systems Summer 2018
 94-802Z: Geographic Information Systems Summer 2018 Instructor: Professor Kristen Kurland Teaching Assistant(s): (Office hours to be posted on Canvas) TBA Class Web Site: http:/www.cmu.edu/canvas
HIRES 2017 Syllabus. Instructors:
 HIRES 2017 Syllabus Instructors: Dr. Brian Vant-Hull: Steinman 185, 212-650-8514, brianvh@ce.ccny.cuny.edu Ms. Hannah Aizenman: NAC 7/311, 212-650-6295, haizenman@ccny.cuny.edu Dr. Tarendra Lakhankar:
Working with ArcGIS: Classification
 Working with ArcGIS: Classification 2 Abbreviations D-click R-click TOC Double Click Right Click Table of Content Introduction The benefit from the use of geographic information system (GIS) software is
Lecture 9: Geocoding & Network Analysis
 Massachusetts Institute of Technology - Department of Urban Studies and Planning 11.520: A Workshop on Geographic Information Systems 11.188: Urban Planning and Social Science Laboratory Lecture 9: Geocoding
Learning ArcGIS: Introduction to ArcCatalog 10.1
 Learning ArcGIS: Introduction to ArcCatalog 10.1 Estimated Time: 1 Hour Information systems help us to manage what we know by making it easier to organize, access, manipulate, and apply knowledge to the
Visualizing Census Data in GIS. Andrew Rowan, Ph.D. Director, NJ Office of GIS
 Visualizing Census Data in GIS Andrew Rowan, Ph.D. Director, NJ Office of GIS Outline VERY accelerated cartography primer Software choices Demos/how-to ArcGIS Desktop (formerly ArcView) ArcGIS Online Notes