Mass Spectrometry. Fundamental LC-MS. Mass Analysers
|
|
|
- Sheryl Hunt
- 6 years ago
- Views:
Transcription

1 Mass Spectrometry Fundamental LC-MS Mass Analysers i Wherever you see this symbol, it is important to access the on-line course as there is interactive material that cannot be fully shown in this reference manual.
2 Aims and Objectives Aims and Objectives Aims Explain the main methods by which spectral data are described Introduce students to spectroscopic mass analyzer types and describe their principles of operation Describe the ion-separation (filtering) process within several popular mass analyser types Introduce Mathieu stability diagrams to explain the mathematical principles behind mass filtering in electrostatic mass analyzing devices Objectives At the end of this Section you should be able to: Describe the working principles associated with the most common mass analysers available in the analytical lab List and explain the generic terms that describe mass analysis (gain, offset, resolution ) Explain the advantages and disadvantages of each of the analyzer types Choose the circumstances under which each mass analyzer type should be used
3 Content Introduction 3 Terms and Definitions 5 Quadrupole Mass Analysers 5 Introduction 5 Quadrupole Rods 6 Equations of Ion Motion 9 Mathieu Stability Diagrams 11 Mass Gain & Offset 13 Resolution and Sensitivity 15 Scan vs. Selected Ion Monitoring 17 RF only Ion Bridges 18 Mass accuracy 19 Performance Limitations Mass Discrimination 21 Performance Limitations Scanning Speeds 22 Time-of- Flight (TOF) Mass Analysers 23 Introduction 23 Equations of motion 23 Resolution 24 The Reflectron 27 Performance Limitations 29 Orthogonally Accelerated TOF (OA TOF) 30 Interfacing Details 34 Mass Resolution / Mass Accuarcy 35 Resolution 24 Ion Trap Mass Analysers 37 Introduction 37 Equations of Ion Motion 39 Practical Considerations (Space Charge Effects) 42 Ion introduction, trapping and ejection 44 Scanning experiments 45 Other Ion Experiments 46 Mass Accuracy, Range and Resolution 46 Magnetic Sector Mass Analysers 47 Introduction 47 Equations of Ion Motion 48 Mass Scanning / Selected Ion Monitoring 50 Electrostatic Analysers 52 Double Focussing Instruments 53 Ion Optics 53 Performance limitations 54 Mass Accuracy & Resolution 55 Performance figures 56 Mass analysers selection 57 Tandem Mass Spectrometry 57 References 58 Crawford Scientific 2
4 Introduction In its simplest form the process of mass analysis in LC-MS involves the separation or filtration of analyte ions (or fragments of analyte ions), created in the Atmospheric Pressure Ionisation (API) interface or in the regions between the API interface and the high vacuum region of the mass analyser. The analyte and fragment ions are plotted in terms of their mass-to-charge ratio (m/z) against the abundance of each mass to yield a mass spectrum of the analyte as shown. The LC/MS process Many factors influence the appearance of the mass spectrum for a particular analyte -the chemical nature of the analyte species, its structure and ionisation potential will all influence the way that the molecule fragments on ionisation. Further, the mode of ionisation and the instrument operating conditions may dictate the degree and type of fragmentation encountered by the analyte. There are several very popular types of mass analyser associated with routine LC-MS analysis and all differ in the fundamental way in which they separate species on a massto-charge basis. This unit of the course will highlight the operating principles of each of the most widely employed mass analysers and suggest uses and operating modes for each. This unit will also outline some of the fundamental concepts that are essential in working with mass analysing systems such as mass accuracy, spectral resolution and mass range. Crawford Scientific 3
5 This unit of the course will highlight the operating principles of each of the most widely employed mass analysers and suggest uses and operating modes for each. This unit will also outline some of the fundamental concepts that are essential in working with mass analysing systems such as mass accuracy, spectral resolution and mass range. Triple quadrupole arrangement Remember: A triple Quadrupole Mass Analyser employs two separate mass analysing quadrupole devices! Crawford Scientific 4
6 Terms and Definitions The mass spectrum of an analyte species is represented by a bar graph that plots signal abundance or relative intensity of each of the ions against mass-to-charge ratio which is often abbreviated as m/z. The term m/z is the parameter or property of the particle that is measured by the mass analyser. Definitions. Mass spectrum Mass resolution (Δm): is the ability of a mass analyser to separate one mass from an adjacent mass. Mass accuracy: is the measurement of the closeness of the given measurement to the true mass of the analyte. Mass Range: Mass analysers measure mass-to-charge ratio (m/z) and the difference between the highest and lowest measurable m/z denotes the mass analyser range. Quadrupole Mass Analysers Introduction In quadrople mass analysing devices electric fields are used to separate ions according to their mass-to-charge ratio (m/z) as they pass along the central axis of four parallel equidistant rods (or poles) that have fixed (DC) and alternating (RF) voltages applied to them. Remember: DC (Direct current or continuous current): Is the constant flow of electric charge from high to low potential. RC (Radio Frequency): The range of electromagnetic frequencies above the audio range and below infrared (from 10 khz to 300 GHz). Crawford Scientific 5

![i Quadrupole working principle The principle of the quadrupole was described by Paul and Steinwegen at the University of Bonn in 1953, [1] carrying on work on ion focussing that had been carried out](/docs-images/73/68727439/images/7-1.jpg "in Athens in 1951 by the electrical engineer Christophilos.")
7 Depending upon the magnitude of these voltages it can be arranged that only ions of only certain masses are allowed to pass the whole length of the quadrupole, passing out of the quadrupole and into a detector, the other ions being deflected onto trajectories which cause them to collide with the rods and pass out of the analysing device. i Quadrupole working principle The principle of the quadrupole was described by Paul and Steinwegen at the University of Bonn in 1953, [1] carrying on work on ion focussing that had been carried out in Athens in 1951 by the electrical engineer Christophilos. Quadrupole Rods The four rods with circular cross-section used to construct the quadrupole mass analyser are shown, along with the theoretically desired cross-section that is actually hyperbolic. [2] Rods are used for engineering convenience in most systems; however, the machining of the rods and their spatial positioning is critical for mass accuracy and resolution. Ideal quadrupole geometry The pole assemblies range in length from about mm, depending upon the nature of the application and the pole diameters lie in the range 5-15 mm, typical quadrupole tunnel radii (r 0 ) being 5mm. Insulating rings that are drilled to allow the passage of the connections to the DC and RF supplies normally hold the poles. Very high mechanical accuracy is required (in the micron region), in both the machining of the rods and their spatial positioning in order to achieve maximum performance. Crawford Scientific 6
, and V cos t is a voltage which oscillates with a")

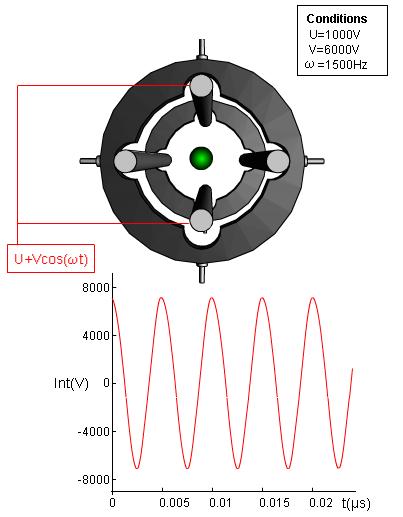
8 Quadrupole construction Unlike simple deflection or acceleration of ions in magnetic and electric fields, the trajectory of ions in the quadrupolar field is complex. Each rod is paired with its diametric opposite and has a potential of U V cos t or U V cos t where U is the DC voltage (either positive or negative), and V cos t is a voltage which oscillates with a radio frequency in the time domain t. [3] Note that each rod pair is successively positive and negative, allowing ions to be both attracted and repelled away from the rods or the central axis of the mass analyser. Along the central axis of the quadrupole assembly and the planes shown, the resultant electric field is zero. Also note that for each pair of rods the peak maximum current in the positive or negative direction will be different. This can be explained by considering the permanent bias of each pair of rods (i.e. + and - U ). Quadrupole voltages Crawford Scientific 7

9 Crawford Scientific 8 i

10 Equations of Ion Motion Application of voltages on the quadrupole rods creates a hyperbolic field within them given 2 2 x y U V cos t by. [2] Where x and y are the distances along the co-ordinate axes, r 0 is the distance from the z- axis to either of the quadrupole surfaces, the other terms have the same meaning than in the last section. When x=y, =0, giving rise to planes of zero field strength within the quadrupole. At all other positions between the poles, the oscillating electric field ( ) causes ions to be alternately attracted to and repelled by the pairs of rods. Note that the equation above shows that the field ( ) has no effect along the direction of the central (z) axis within the quadrupole and so to facilitate the passage of ions through the mass analyser, an accelerating voltage is applied prior to the mass analyser which is usually in the region of 5 V. 2 2 r o Crawford Scientific 9
. Table 1.")

11 Equipotential lines for a quadrupole (hyperbolic field) As long as x and y, which determine the position of an ion from the centre of the rods, remain less than r o, the ion will be able to pass through the quadrupole without touching the rods (resonant, non-collisional, or stable trajectory). Table 1. Advantages and disadvantages of quadrupole mass analysers Advantages Disadvantages Reproducibility Low cost Low resolution Mass discrimination. Peak height vs. mass response must be 'tuned' When the ion is caused to oscillate with a trajectory whose amplitude exceeds r o it will collide with a rod and discharge or pass out of the mass analyser and not be detected (unstable or collisional trajectory). Thus for any particular m/z value the passage of the ion through the quadrupole is dependent upon U, V, ω and r o. The trajectories described for the ions through the quadrupole are complex and cannot be described in a simple way, because they include a large number of physical variables that affect the instantaneous electric fields experienced by the ions. i Crawford Scientific 10

12 Ion trajectories within the quadrupole (oversimplified) Mathieu Stability Diagrams When solving the equations of motion for an ion within the quadrupole, two factors a and q emerge as being important in defining regions of stable ion trajectory. [3,4] a 8zU 2 mr 2 o q 4zV 2 mr 2 o The diagram presented opposite, shows the stable regions in the X and Y axes. For any quadrupole, r o and ω are fixed and the variable parameters are the voltages U (to affect the a term) and V (to affect the q term) and these are varied in such a way that the spatial X-Y coordinates of the ion never exceeds r o in order that the ion is manipulated in a non-collisional trajectory. The region denoted by the letter A (called the first stability region) represents the traditional operating region for quadrupole mass analysers. Notice the symmetry of region A around the q axis. In practice only the top half of this diagram is considered, with the bottom half accessible by simply swapping the electrical connections to the quadrupole. Crawford Scientific 11

13 Practical example of region A Crawford Scientific 12
14 Mass Gain & Offset Instrumentally, the DC voltage (U) and RF voltage (V), are altered according to a linear relationship which is often referred to as the SCAN line or SCAN function. The mode of operation for a mass analyser in which the voltages U and V are ramped linearly is often referred to as SCAN mode. The slope of the SCAN function (i.e. the rate of change of U against V) is often referred as the quadrupole GAIN. The intersection of the scan line with the U axis (i.e. the magnitude of the initial DC voltage applied) is the quadrupole OFFSET. The stability diagrams for THREE ions of mass m 1, m 2 and m 3 are shown opposite and it can be seen that very often the stability regions of ions overlap. To ensure that ions of only one selected m/z value are transmitted, the parameters U, V (at certain selected ω) must be chosen so that the line representing U/V (or a/q) passes close to the apex of region A but still lies within the stable region. If the slope of the line is increased so that it misses the apex of the stability region, no ions of that m/z value will be transmitted. For a given quadrupole assembly, r o and ω are fixed and it is electronically more straightforward to manipulate the voltages U and V. Therefore to transmit ions of subsequently higher unit mass, the voltages U and V are increased (m/z is inversely proportional to both a and q), whilst the ratio U/V (or a/q) is fixed (i.e. the slope of the line is constant). Considering the equations a 8zU 2 mr 2 o q 4zV 2 mr 2 o We see that changing from one mass to another results in a proportional division of a u and q u, which is equivalent to changing the scale in U-V coordinates, thus the triangular area A, will change from one mass to another, like proportional triangles Crawford Scientific 13

15 Mass Gain and Offset Crawford Scientific 14
16 Resolution and Sensitivity At this point it is important to study the effects of the slope and intercept on the SCAN line. Increasing the mass GAIN (the slope of the scan line) by increasing the voltages U against V in a constant proportion, will lead to increased spectral resolution but decreased sensitivity (and vice versa). These concepts are explored further in the diagram opposite. It is very important to note that changes in mass gain affect higher mass ions TO A GREATER EXTENT than they affect lower mass ions due to the nature of the changing slope of the line and the larger stability regions of higher mass ions as shown on the examples opposite. Also, if the slope of the line is increased so that it misses the apex of the stability regions of any of the ions then these ions will not be seen in the mass spectrometer. a i b Gain effect (note that gain in a lower than in b) Crawford Scientific 15
17 When increasing the mass quadrupole DC OFFSET voltage (or U intercept) the resolution will increase but sensitivity will decrease these concepts are represented in the examples opposite. Again the converse is true when decreasing the DC Offset voltage. It should be noted that altering the DC offset voltage affects ions of all masses to the SAME EXTENT. a i b Offset effect (note that offset in a lower than in b) Crawford Scientific 16
18 Scan vs. Selected Ion Monitoring The scanning operation takes a finite time to complete and each individual m/z value is measured for only a fraction of the time that they elute into the mass analyser. The intensity of all peaks within a spectrum are summed to give an overall signal intensity and this maybe plotted against time to give the TOTAL ION CURRENT which has the appearance of a chromatogram obtained by LC with UV detection for example. The intensity of the TOTAL ION CURRENT (TIC), is governed by the scanning speed of the instrument, the faster the scan rate, the more data is collected and the intensity of ALL IONS within the spectrum increases. As all m/z values are recorded, background signal and ions at very low intensity are all summed to give instantaneous signal intensity. TIC versus SIC By choosing to set the quadrupole to certain values of a/q (or U/V) we are able to choose only certain masses for transmission through the mass analyser. This type of spectral experiment, called selected or specific ion monitoring (SIM mode), or selected ion recording (SIR mode), has certain advantages over scanning wide mass ranges. Because not all m/z values are recorded the mass analyser can carry out a SIM experiment very rapidly ( increase over scanning experiment speeds) therefore acquiring more data points. Further, if only the useful m/z values are recorded, i.e. those that are compound specific or most intense, the intensity of the SELECTED ION CURRENT (SIC), that is recorded will be much larger than for the TIC. In this way the sensitivity of the quadrupole mass analyser may be improved for quantitative purposes. In practice quadrupole instruments can be scanned over mass ranges in excess of 1000 Da in a few milliseconds, giving the advantage of real time spectral monitoring for tuning and diagnostic purposes. However, it is usual to slow the scanning speed (100 ms scans) or carry out SIM experiments when analysing samples in order to increase instrument sensitivity by increasing the ion count at each mass. Crawford Scientific 17
19 i Acquisition process RF only Ion Bridges If the DC component of the applied voltage is removed (i.e. U=O) the scan line will lie horizontally along the U/V (a/q) plot abscissa. In this way ions of all m/z values will be allowed to travel through the quadrupole, which will act merely to keep the ions focussed around the central axis and allow transport of ions that have been given an accelerating voltage. In this mode the quadrupole is operating as an RF only 'ion bridge' and is used by several manufacturers to transport and focus ions from one area of the spectrometer to another. [5] Often hexapoles, or octopoles are used in the RF only mode as they are very effective in focussing ions relative to neutral species. Crawford Scientific 18
20 Ion bridges working diagram Mass accuracy API-MS data is usually acquired by averaging a number of scans and smoothing to provide good peak shape and intensity. When dealing with multiply charged ions, the error in the molecular weight determination is obtained by the error in the mass to charge determination multiplied by the number of charges that the ion carries. Fortunately, most API spectra will contain several molecular ion peaks that differ in m/z only by the number of charges held by the ion. In this way, errors may be reduced when several values for the molecular weight are averaged from the same spectrum. Several factors will influence the mass analyser s accuracy unresolved (or overlapping) peaks from impurities or closely related compounds can be problematical when determining accurate mass. Remember: Mass resolution (Δm): is the ability of a mass analyser to separate one mass from an adjacent mass. Mass accuracy: is the measurement of the closeness of the given measurement to the true mass of the analyte. Mass Range: Mass analysers measure mass-to-charge ratio (m/z) and the difference between the highest and lowest measurable m/z denotes the mass analyser range. Crawford Scientific 19
21 Variations in the registered m/z for the same sample in different laboratories (following the same procedure) Signals due to the +10 ion for lysozyme and its oxidation product are shown below at a resolution of 300, 1000, 5000 and 10,000. [6] When using quadrupole mass analysers a resolution of 300 would be typical. In the presented case the lysozyme ion and its oxidation product ion, which is 16 Da higher in mass, would not be resolved and centroid measurement will produce a significant mass error which will be multiplied by a factor 10 the number of elementary charges on the molecule. Averaging measurements of the multiply charged molecular ion peaks will not compensate for this error. Quadrupole mass spectrum of Lysozyme and oxidation product Crawford Scientific 20

22 Performance Limitations Mass Discrimination Mass discrimination is an issue in quadrupole mass analysis. This process can be visualised by examining the mass spectrum of alkyl ethoxy sulphate, it is assumed that the mass spectrum would show equally intense peaks at 265, 661 and 1028 m/z. However, in an instrument where mass discrimination is occurring, the peaks at higher mass will demonstrate significantly reduced intensity. Quadrupole mass spectrum Mass discrimination Discrimination in quadrupole systems is attributed to DC fringing fields at the entrance to the tunnel radius, which tend to deflect ions away from efficient entry into the mass [7, 8] analyser. High mass ions tend to be affected to a greater degree than lower mass ions, which have a higher velocity and thus a shorter residence time in the fringe field. i Fringing fields leads to mass discrimination Perhaps the most common ion-optic approach to solving this problem is the use of the Turner-Kruger entrance lens that protrudes into the central space of the quadrupole to more efficiently transmit ions from the source or nozzle skimmer region, through the fringe fields into the mass analyser. [7] Crawford Scientific 21

![[7] i Turner-Kruger entrance lens Performance Limitations Scanning Speeds Perhaps one of the foremost benefits of the quadrupole mass analyser is its ability to rapidly scan wide mass ranges giving](/docs-images/73/68727439/images/23-1.jpg "it the ability to measure quality spectra over a wide mass range whilst generating enough data points to correctly model the peak profile of the eluting components.")
23 i End cap electrodes are currently used to decrease mass discrimination An alternative ion-optic approach is the use of a Brubaker filter, consisting of end cap electrodes on the rods to produce an RF only field, which guides the ions through the fringe fields and into the quadrupole central space. [7] i Turner-Kruger entrance lens Performance Limitations Scanning Speeds Perhaps one of the foremost benefits of the quadrupole mass analyser is its ability to rapidly scan wide mass ranges giving it the ability to measure quality spectra over a wide mass range whilst generating enough data points to correctly model the peak profile of the eluting components. Under normal circumstances discrete data points (scans) across the TIC peak is considered sufficient for good quantitation (some regulatory bodies may stipulate more). However, ions in the quadrupole interact with an oscillating field in such a way that only those ions of specific m/z values will be allowed to pass to the detector device. Therefore for maximum transmission of ions at a particular m/z value, the RF and DC voltages should not change during the ion transit time through the analyser. Crawford Scientific 22
 in short bursts or packets within the ion source and subjected to an accelerating voltage.")
24 Time-of- Flight (TOF) Mass Analysers Introduction The basic principles of mass analysis using time-of-flight mass analysers are relatively straightforward in comparison to many of the other typical mass analysing devices. Ions are extracted (or produced) in short bursts or packets within the ion source and subjected to an accelerating voltage. The ions then drift or fly down an evacuated tube of set length. [9] i There are no complicated ion focussing devices necessary to constrain the ions to a particular flight path and as such the ions pass in a straight line, at constant speed towards the detector where a plot of abundance against time-of-flight may be recorded. The flight times are correlated against at least two known masses from an infused tune compound allowing a simple conversion to obtain a typical abundance versus mass to charge (m/z) spectrum. Once free from the region of accelerating voltage the speed at which the ions travel down the tube is dependant upon their mass (m) and charge (z). In general terms, for singly charged ions (z=1), the greater the mass of the ion the slower it will travel through the tube towards the detector device. Equations of motion It is important to extract the ions in pulses or packets into the mass analyser because as the ions are separated on basis of flight time, all ions must begin the flight at the same time in order to be able to calculate differences in arrival times. After extraction the ions are subjected to an accelerating electric field (V 1 volts typically 3000 ev). The kinetic energy of each of the ions may be expressed as: 2 mv 2 zev v 2zeV / m / 1 1 Where: m = mass of the ion z = number of fundamental electrostatic charges on the ion e = charge of an electron v = final velocity If the distance from the ion source to the detector is d, then the time (t) taken for the ion to travel through the drift tube to the detector is: Crawford Scientific 23
25 t d v d / 2zeV / m / 1 In practice the flight tube length (d) is fixed as is the value of V 1. The flight time of an ion (t) is directly related to the square root of m/z: d d d m / z t X m / z v zev / m 2eV Where X is a constant based on d, e and V 1. An ion of m/z 100 will take twice as long to travel the distance d as an ion of m/z 25: t t Resolution Resolution in time-of-flight instruments is limited by two important factors, which can decrease the instrument resolving power, especially at high mass. [10,11] The first problem is inherent in the nature of the analytical technique. The difference in flight times between two ions of unit mass difference can be expressed as: t t t m/ z ( m 1) / z X m m 1 Where X is a constant based on d (tube length), e (electron charge) and accelerating electric field V 1. Therefore the arrival time at the detector becomes smaller as the mass of the ions arriving at the detector increases and the ions are increasingly more difficult to differentiate via the detection system. Crawford Scientific 24

26 i a b The peaks presented in the part a, represent low mass particles with one Dalton difference, in a similar way the peaks presented in b represent high mass particles with one Dalton difference. The second problem regarding resolution lies with the method of ion production and separation in the instrument. Not all ions of the same m/z value arrive at the detector simultaneously due to a distribution of the kinetic energies they acquire in the accelerating voltage and are not all accelerated from the same point within the ion source. Therefore, even for ions of the same m/z value, there is a distribution of arrival times at the detector. When attempting to resolve masses that are contiguous, the arrival time of these masses at the detector may overlap and reduce spectral resolution. This problem may be particularly troublesome for ions of high mass. Crawford Scientific 25

27 Crawford Scientific 26 i
 flight path of the ions and has the same polarity as the incumbent ions.")
28 The Reflectron Resolution in TOF instruments can often be improved through the use of a reflectron device. A reflectron is a series of electrostatic lenses which create a homogeneous electrostatic field at the end of the (usual) flight path of the ions and has the same polarity as the incumbent ions. In this way, for example, positive ions will be quickly slowed within the electrostatic field of the reflectron, come to a brief standstill and are then accelerated in the opposite direction. The reflectron is often referred to as an ion-mirror due to the reversal of the ion flight path. Ions having a greater amount of kinetic energy (faster ions) will penetrate the reflectron to a greater depth and so spend slightly longer in the device than ions with lower kinetic energy. In this way isobaric ions can be caused to bunch together to reduce the distribution of flight times and greatly enhance the resolving power of the instrument. Crawford Scientific 27
 as the arriving ions, but it is more usual to expel ions on a slightly deviated path, for convenience of instrument design and positioning of")
29 Ions from the source Pusher electrode i To vacuum system Off axis detection Accelerating voltage V 1 To vacuum system Accelerating voltage V 2 Reflectron -Ion mirror The reflectron TOF mass analyser The reflectron may expel ions in the same path (off axis) as the arriving ions, but it is more usual to expel ions on a slightly deviated path, for convenience of instrument design and positioning of ion-production and detection devices. [12,13] Clearly, the longer the flight tube, the longer it will take for ions to traverse it. If the flight path length (d) is doubled, then ions previously arriving at the detector with times t 1 and t 2 will now have arrival times of 2t 1 and 2t 2 and the time difference between sequential ions arriving at the detector has doubled. The longer the time difference (usually in the order of nanoseconds), the greater the resolving power of the instrument. This is a further advantage when using the reflectron in TOF analysers as the flight path length of all ions is automatically doubled. Traditional linear TOF instruments may achieve resolutions of 1000 or so but an increase to 10,000 or greater resolving power may be achieved through the use of a reflectron. The disadvantage of using reflectron technology is a slight decrease in the sensitivity of the analyser due to ion loss and dispersion of the ion beam, the problem being accentuated for ions of high mass. Due to these problems, the reflectron may be turned off when carrying out analysis of high mass ions at very low concentrations, detection being carried out in the linear mode. The longer the flight tube the better the resolution of the instrument due to amplified differences in flight times Crawford Scientific 28

30 i Ion trajectories on quadrupoles of different size Performance Limitations There is no theoretical upper mass limitation in TOF analysis as all ions may be made to proceed from the ion source to the detector. In practice however, there is a mass limitation in that it becomes increasingly difficult to discriminate between arrival times at the detector when m/z becomes large as has been discussed. This effect coupled with the inherent distribution of ions at nominal m/z values means that discrimination between unit masses becomes difficult over approximately 3000 m/z. At 50,000 m/z the mass overlap may be as much as 50 mass units, however, this may be good enough for many routine applications. The recording and storage of TOF data can be problematical as the data is produced at such high frequency. An instrument with a 2 m flight tube and ion energy of 2 kev may produce a complete mass spectrum from m/z 1 to m/z 800 in 90 μs. Time array detection records full mass range spectra for each transient (or ion packet), a number of which are then integrated (summed), to produce a spectrum whose intensity reflects the sum of all transients. To store all data prior to integration two processors are normally required to ensure no transients are missed due to the fast recording time (theoretically 10,000 transient spectra / sec. may be recorded). Crawford Scientific 29

31 i TOF mass spectrometer operation The direct coupling of API sources with TOF analysers can be problematical, since API techniques yield a continuous ion beam, whereas the TOF analyser operates on a pulsed process. The classical method of overcoming this problem is to direct the ion beam past a slit placed at the ion source entrance, thereby obtaining a pulsed inlet. However, sensitivity of this type of system is poor as most ions are lost. Ions may be collected in an ion storage device using a decelerating field, where they are extracted into the flight tube, which is perpendicular to the incident ion beam. The extraction procedure may be run at up to 1 khz and the perpendicular orientation of the ion storage device helps to reduce kinetic energy dispersion, allowing resolution of up to 25,000 for high mass ions. The most usual approach to solving the interfacing problem between a continuous ion beam source and a TOF analyser is to use orthogonally accelerated TOF (OATOF). Orthogonally Accelerated TOF (OA TOF) The ion beam from a continuous source emerges into the mass analyser and is accelerated through a voltage V 1. The ion beam is a range of ions whose moments are proportional to the charge (z), mass (m) and accelerating voltage V 1. As the ion beam is produced continuously there is no separation of the ions in time. If a second electrode is placed at 90 0 to the emergent continuous ion beam with an applied potential of V 2 volts, then by switching this electrode rapidly on and off a pulse of ions that is passing the electrode surface will be given a momentum of: mv 2zemV 2 in a direction at right angles to the continuous beam. Crawford Scientific 30

32 The resulting vector of the pulse of ions produced is shown in the animation opposite. Effectively a section of the main beam has been selected and pulsed away. [14,15] All ions in this selected packet will start into the flight tube at the same instant a requirement for TOF analysis. i The reflectron TOF mass analyser operation mode The magnitude of the pushing potential (V 2 ) can be adjusted so that the injected ion packet will enter the axis of the flight tube. The pulsing electrode may be turned on and off at any frequency but there are some practical constraints. At the fastest pulsing speeds there is little point in pulsing at such a rate that the previous pulse of ions have not arrived at the detector before the next pulse is generated. A practical maximum upper pulse frequency of around 30 khz is usual. The slowest pulsing speed can be anything the operator chooses and may be advantageous in terms of data storage space. However, sensitivity may be reduced if the pulsing speed is too low. Table 2. Advantages and disadvantages TOF mass analysers Advantages Disadvantages High ion transmission Highest practical mass range of all MS analyzers Detection limit Fast digitizers used in TOF can have limited dynamic range Crawford Scientific 31

33 i The reflectron TOF mass analyser operation mode The ion beam may have to be directed a few degrees away from the axis of the instrument after leaving the acceleration region so that the reflected ions may strike the detector in an off axis position. [16] Effectively the ion packet has to be steered in the correct direction to either enter the reflectron at the correct angle or to impinge on the array detector in a linear instrument. If the initial component of ion velocity (i.e. the velocity of the ions in the axis of the API source prior to orthogonal acceleration) is not enough to deflect the orthogonal ion packet from the axis of the analyser, the ions must be deflected using a small potential difference (100 V), otherwise resolution of the instrument will be compromised. The ion storage region of the interface will accept ions with energies in the region 2.5 to 10 ev per charge for an accelerating voltage of 4 kv. Because a significant proportion of the API ion energy comes from the free jet expansion, the ion energy, and therefore the optimum deflection voltage will have a mass component that is, the heavier the ion the greater the deflection voltage required. This imposes some restrictions on the range of m/z values that may be simultaneously detected, without mass discrimination. These effects may be reduced by using an RF only ion bridge at relatively high pressure ( Torr) where collisional damping will take place and the energy of ions within the ion beam will be normalised to reduce mass discrimination. [17] Crawford Scientific 32

34 i a b Deflecting voltage in a greater than in deflecting voltage in b Crawford Scientific 33

35 Interfacing Details Two approaches to interfacing are possible between the API ion source and the TOF analyser: one involving the use of skimmers with decreasing potential and increasing vacuum, the other involving the use of RF only ion bridges to transport the continuous ion beam from the API source into the modulator of the mass analyser. Dodonov et al, [18] at the University of Manitoba report a very direct approach to interfacing using a three stage pumped interface after Chait et. al. [19] Stage 1 is pumped to approx. 3 Torr (supported by a mechanical pump at 6 L/s), the inlet of which is a stainless steel capillary (12 cm x 0.5 mm i.d.) held at less than 120 o C. A potential difference of between 3 and 3.5 kv is applied between the sprayer and the stage 1capillary to allow for efficient electrospray. Stage 2 is separated from the first stage by a skimmer cone with a 0.15 mm orifice and is evacuated by a 450 L/s turbo pump to give a vacuum of approx Torr. A voltage of V is applied between the capillary of stage 1 and the skimmer of stage 2 to allow for break-up of solvent clusters and CID experiments. Stage 3 is entered through a 2 mm x 6 mm horizontal slit in the second skimmer cone to give access to the mass spectrometer chamber and is evacuated to 2 to 3 x 10⁻⁷ Torr using a 1000 L/s cryogenic pumping system. A potential difference of between 5-10V is applied between the skimmer plates of stage 2 and stage 3 and a grid with a floating potential from around 30 to 50 V is used to provide some focussing of the ion beam without increasing the velocity distribution of the ions within the beam. Crawford Scientific 34
36 Mass Resolution / Mass Accuarcy In the reflecting mode Krutchinsky et.al. [20] report mass accuracy of 8,000 to 10,000 for peptides with masses ranging from 1000 to 6000 Da, these measurements were carried out with little or no deflection voltage and so sensitivity was reduced (50-70% of the ion current was sacrificed). However, resolution was around 4,000 even when the instrument was operating at maximum sensitivity enough to distinguish between the isotopic peaks for most peptides and to enable charge state determination. For smaller ions resolution decreases, but remains high enough to distinguish between peaks of the same nominal mass. Mass spectrum of bovine insuline A spectrum obtained for human apotransferring with the spectrometer calibrated using Substance P gave a molecular weight that differed by only 8 Da in 79,500 from stated literature values. Mass spectrum of human apotransferring Peaks in the mass range are often used as the first peak for mass calibration and misinterpretation of an unresolved peak (e.g. K + ) may lead to large errors in mass assignment. Crawford Scientific 35
37 Peaks in the range Da can be used for mass calibration Typically mass accuracy for small ions (M<2000 Da) is around ppm with internal calibration (simultaneous lock mass infusion), which will allow, in some instances, determination of elemental composition. For large ions (10k <m < 80kDa) and using external calibration methodology accuracy of mass determination in the order of 100 ppm may be achieved. [21-25] Separation compounds with same nominal mass (resolution = 20 ppm) Cytochrome C (12,360 Da) has been analysed from water-methanol solutions at a protein concentration of M, the spectrum being recorded for 1 second during which 2 fmol of protein were consumed. [26] This high sensitivity was achieved with a high duty cycle of pulse formation (approx 20%), nearly complete transmission of the pulsed ion beam through the spectrometer and simultaneous detection of all ions (i.e. no scanning). The dynamic range of the TOF instrument is demonstrated by examining the isotopic peaks of methionine enkephalin, the spectrum collected over one minute, during which 3 pmol were consumed. The six isotopic peak has an abundance 2000 times lower than the first isotopic peak and represents 1.5 fmol of the analyte. [26] Crawford Scientific 36
38 Dynamic range Ion Trap Mass Analysers Introduction Ion trap mass analysers use oscillating electric fields (RF) to trap ions in a controlled manner. The construction of a typical quadrupole ion trap mass spectrometer is shown and consists of a ring electrode with a hyperbolic inner surface and two electrically common hyperbolic end-cap electrodes. The ion trap is operated by applying a sinusoidal potential (fixed RF frequency) to the ring electrode whilst the endcap electrodes may be grounded, biased to a constant DC current (usually = 0), or maintained at an oscillating AC potential depending upon the mode of operation. [22,23] Combinations of RF and AC potentials applied to the ring and end cap electrodes may be used to: Trap all ions within a specific m/z range Trap all ions above a specified m/z value Trap ions of a specified m/z Eject ions of specified m/z values All of these operations may be useful in various analytical applications and the usefulness of ion trap mass analysers in qualitative analysis is widely documented. Crawford Scientific 37

 n Easily saturated High resolution Poor for low mass work (below 100 Da) Good for DDA analyses Poor dynamic range (except the most modern devices) and hence")
39 i Table 3. Advantages and disadvantages of ion trap mass analysers Advantages Disadvantages High sensitivity Produces very unusual spectra if the Multiple Product Ion scan capability ions are stored in the trap too long. (MS) n Easily saturated High resolution Poor for low mass work (below 100 Da) Good for DDA analyses Poor dynamic range (except the most modern devices) and hence may have limited quantitative use The trajectory of the ions resembles a figure 8 in three dimensional space with the ions rotating and oscillating simultaneously. Ion trajectory in the ion trap mass analyser (oversimpliefied). Crawford Scientific 38

40 Equations of Ion Motion Ion motion in the ion trap can be described by Mathieu equations as studied previously for the quadrupole system. [4] Because DC potentials can be applied to the trap, stability diagrams based on a and q can be used to determine which m/z values will remain stable within the trap and which will be ejected under particular sets of experimental parameters. When solving the equations of motion for ions within analyser, three parameters of fundamental importance emerge a, q and β according to the following equations: a Z 2a r 16zU 2 m( r ) 8zV qz 2qr m( r0 2 0 ) Where the subscripts Z and r represent axial and radial motion performed by the ions, U is the DC bias on the endcap electrode, V is the RF amplitude applied to the ring electrode, r o is the radius of the ring electrode, o is the distance from the centre to the trap to one endcap electrode, is the RF angular frequency and m/z the mass to charge ration of the ion. Important: Ion trap mass spectrometer β: The amplitude and frequency of the oscillations performed by the ions within the ion trap mass analyzer are closely related to the β parameter Crawford Scientific 39

41 Ions within the mass analyser perform oscillations, the amplitude and frequency of these oscillations are closely related to the β parameter. The mathematical form of β is complex, but it depends upon both the RF and DC components of the storage field. The expanded stability diagram shows values of a, q and β (in both axial and radial directions). The β values are important as they relate the extent to which any particular ion may follow the imposed RF field. [4] Experimentally, it has been found that the ion storage process has a maximum efficiency when β r values are close to one and β z lies between cero and 0.3. In the same way it has been reported that in order to get selective and controlled ion ejection, the magnetic field parameters of the mass analyser should be chosen in such a way that the β z parameter present values between 0.6 and 1. When the operating line is chosen in such a way that the scan line passes close to an apex of the stability region, then only ions with a very narrow range of specific masses will have a stable trajectories. Crawford Scientific 40


42 Expanded stability diagram. Crawford Scientific 41
43 Practical example of stability of stability region for ion trap mass analysers. Practical Considerations (Space Charge Effects) The ion trap has potential to achieve very high sensitivity, but care is required to achieve this. The trap is limited in its capacity to trap charges (regardless of the m/z value), and as such the operating conditions should be optimised to ensure that only ions of interest are introduced into the trap. [24] In fact, ions due to natural background and matrix may be excluded using ion traps with external ion sources that are capable of excluding specified unwanted ions. The resolution of the trap will diminish rapidly as the ion density increases. The trap has the capacity for only a limited number of ions at any one time before repulsive charges (known as the space charge effect) cause the excess ions to be ejected. Concentrations of ions above the space charge limit lead to poor performance in terms of grossly deteriorated resolution and shifts in the mass axis calibration. To avoid the effects of space charge, the number of ions within the trap are regulated to an optimum (sometimes referred to as the 1/10th level ) to achieve optimum mass to charge analysis. This control occurs by calculating the optimum ion-injection time. Crawford Scientific 42

44 Crawford Scientific 43 i
 ESI - QIT (quadrupole ion trap) instrument is shown. Vacuum levels of 1 x 10⁻³ torr and 2.")
45 Ion introduction, trapping and ejection When used in conjunction with API sources it is usual to introduce the ions from the nozzle skimmer region of the instrument, via a set of ionoptic lenses into the orifice in the end-cap electrode. An early Thermo Finnegan (San Jose, Ca, USA) ESI - QIT (quadrupole ion trap) instrument is shown. Vacuum levels of 1 x 10⁻³ torr and 2.5 x 10⁻⁵ torr are maintained by roughing and dual port turbo-pump systems. This instrument is unique in that the ions are directly transferred from the end of the second octopole into the end-cap of the ion trap analyser. At the outlet of the sampling capillary (200 o C, 400 μm, 11.5cm), positive ions are transmitted through the skimmer by pulsing the tube lens between 0 and 200 V. The sampled ions are collected by the first RF octople ion bridge and transmitted to the second octopole via an interoctopole lens. Each octopole is 5 cm long (r o =3.3mm) and both are operated at 2.5 MHz and 400 V. Crawford Scientific 44

46 Octopole ion bridges are used as they improve transmission relative to static lens systems (mainly due to a decrease in gas scattering) and the octopole regions may be differentially pumped, each being capable of different DC potential offsets for optimum ion transmission. [25] The interoctopole lens may be used to reduce output spikes due to cluster ions hitting the analyser via the application of several hundred volts between the ion injection and scan periods of the mass analysis. Scanning experiments Ion trap spectral experiments are composed of several steps occurring sequentially, this chain of events being called a micro-scan. The different events in a micro-scan include ion injection, isolation, excitation, and analysis. In addition, very often an initial pre-scan is performed to determine the ideal injection time and to avoid space charge effects. [26] After the ions are injected into the trap from the source, a suitable RF voltage on the ring electrode confines them to stable trajectories. An isolation scan can be performed subsequently in order to selectively accumulate a specific ion (or range of ions). The next optional step is ion excitation (in the case of tandem MS), where a voltage is applied to cause the trapped ions to oscillate with higher energy, ultimately causing collisions with the background gas and fragmentation. Finally, ions are analysed by ejection from the ion trap to the detector through openings in the exit end cap electrode. Ions are trapped within the analyser by applying a RF voltage on the ring electrode. In order to increase efficiency, ions must be focussed near the centre where the trapping fields are closest to the ideal, maximizing resolution and sensitivity. This is achieved by introducing a damping gas (which is usually helium) that cools injected ions by collisions, damping down their oscillations until they stabilize. i Collisions within the ion trap mass analyser Crawford Scientific 45
47 Other Ion Experiments It is also possible to select specific m/z values to be ejected from amongst all of the ions within the trap. This is usually achieved by superimposing an AC voltage generated by the ring electrode to cause instability of only the selected ion by causing increasing amplitude resonance in the z axis. This techniques is often termed resonant ejection. [26] Perhaps the most significant use of ion trap analysers involves sequential trapping and fragmentation of specific ions to produce MS n spectral data that is highly specific. This is achieved using collision induced dissociation of selected precursor ions held within the trap at increased background gas pressures. The product ions are then resonance ejected and monitored. One or many of the product ions may be retained within the trap volume for further fragmentation. In this operating mode a series of precursor fragmentations may be carried out allowing MS n theoretical fragmentations. Mass Accuracy, Range and Resolution The mass range achievable with an ion trap is considerably higher than that obtainable by quadrupole mass analysers but lower than that achievable on a time-of-flight mass spectrometer (TOF-MS). [27] Bier et al 33 at Thermo Finnigan (San Jose, Ca, USA), report attainable mass range of Da using their LCQ instrument by lowering ion ejection voltages, this led to reduced resolution and sensitivity but analysis of m 9+ ions at 5000 Da was possible. Ion trap analysis at high resolution (Δm/m = 10,000 at m/z 2000) has also been reported by the same group using reduced scanning speeds and supplementing the scan with an appropriate resonance-ejection voltage. This approach has been used to determine a charge state of 4 at m/z 2000 with a resolution of Charge states greater than 7 require resolution higher than is normally achievable with ion trap mass analysers due to S/N limitations, relatively slow scan speeds (<200 Da/s) and the susceptibility of ions to space charge and fragmentation effects. Crawford Scientific 46
48 The above figures is a full scan spectrum of a mixture of Ultramark 1621 (flourinated phosphazines), tetrapeptide MRFA (523.3 Da) and caffeine (194.2 Da) from a solution of 1% acetic acid in 50:25:25 acetonitrile, methanol, water. The spectrum shows tenth unit mass resolution over a 2000 Da mass range, highlighting the utility of the ion trap mass analysers. [33] Magnetic Sector Mass Analysers Introduction Magnet / electric sector instruments are employed for mass analysis using the principle that charged species can be deflected in magnetic and electric fields. The degree of ion deflection in a magnetic field is proportional to the square root of their m/z ratio and the potential through which they are accelerated prior to mass analysis, making the measurements of mass-to-charge ratio very accurate when using this type of mass analyser. [29,30] Electric fields are used in conjunction with magnetic fields to focus a fast moving beam of ions created in the API source according to the kinetic energy of each ion, allowing each m/z value to be sharply focussed prior to deflection in the magnetic field. This focussing action helps to improve the resolution of the magnetic sector mass analyser so that measurements can be made between ions whose mass to charge ratio differs by only a few parts per million. The intensity of the magnetic field in magnetic sector mass analysers usually comprised between 0.4 and 0.6 Tesla (T). Remember: Tesla (T): is the SI derived unit of magnetic flux density (or magnetic induction). It is used to define the intensity (density) of a magnetic field. 1 T = 1 Wb m 2 = 1 kg s 2 A 1 1 = 1 kg s 1 C Crawford Scientific 47
49 i Equations of Ion Motion Ion trajectories in the magnetic sector mass analysser The kinetic energy of an ion with mass m and charge z accelerated by a potential difference V s is: E 2 mv 2 k zv S If the magnetic field (B) is perpendicular to the velocity (v), the ion follows a circular trajectory with a radius r Remember: mv r zb The magnetic field (B): The magnetic field (represented by the letter B) is usually measured in Tesla. Crawford Scientific 48

50 From the last two equations the velocity can be eliminated to give the resulting equation: m z 2 B r 2 V s 2 If only ions with single charge are considered, then with a constant field strength and constant accelerating voltage, the radius of the arc depends upon mass. Therefore it is possible to separate ions of different m/z values. This equation shows that the m/z ratio of the ions that reach the detector can be varied by changing the magnetic field (B) or the applied voltage Vs. i B 1 B 2 In the representation note that B 2 > B 1. Crawford Scientific 49
51 Consider the equation: m z 2 B r 2V s 2 r 2V m / z s B This equation shows that the m/z ratio of the ions that reach the detector can be varied by changing the magnetic field (B) or the applied voltage V s. In most modern instruments it is more convenient for all ions to arrive at a single point for detection and so r is kept constant, notice that the bigger the magnetic field (B) used the heavier the ion mass analyzed. Mass Scanning / Selected Ion Monitoring Magnetic scanning is advantageous in that the entire mass range may be scanned whilst the instrument remains at optimum V s. A minor disadvantage is related to the quadratic dependence of m/z on the value of B, resulting in high mass peaks appearing to be closer together in the scan than those at low mass. At high mass, a small change in B will result in a much larger shift in the mass calibration than at the low mass values of B and as such the magnet has to be very well stabilised in terms of magnetic current supply for effective operation. In practice, mass scanning is normally carried out using magnetic rather than voltage scanning techniques. In order to carry out single (or specific) ion monitoring experiments the magnetic field strength of the analyser may be tuned to the required m/z value and only ions of the specified value will be allowed to pass through the magnet, all other ions will be lost to the walls of the analyser. Crawford Scientific 50
52 Crawford Scientific 51 i

53 Electrostatic Analysers An electrostatic analyser (ESA) is a directional (or angular) focussing device and is also energy dispersive, allowing it to focus ions of the same mass to charge ratio, but different kinetic energies. [30] The kinetic energy gained by ions accelerated through a voltage V from the ion source is: E 2 mv 2 c zv s The centrifugal force on the ions is given by: ze mv R 2 From the above equations: R 2V E s Where: E = electric potential between the inner and outer ESA plates R = radius of the ion trajectory. Ion beam focusing In an electrostatic analyzer, the radius of deflection is not dependent on mass or charge and therefore in the electric sector, the ion flight path is deviated through an arc that is only dependent upon accelerating voltage V s and the ESA voltage E. By manipulating values of E it is possible to bring ions of differing energy to the same focal plane prior to entry into the mass spectrometer. Crawford Scientific 52
54 Double Focussing Instruments The ion beam is collimated when a magnetic analyser is combined with an ESA and this combination can be made both energy and mass focussing the ion beam being collimated in the ESA and properly mass focussed in the magnetic field. This combination is called double focussing because it is both direction (angular) and energy focussing. The double focussing instrument is designed in such a way that ions of different energies (but of the same mass), converge at the collector. [31] The double focussing instruments are designed to accomplish at least two major objectives: Provide sufficient resolving power to separate various ionic species that share the same nominal mass so that each can be separately managed. Focus the ion beams so carefully that the exact mass of the ions can be determined to six significant figures. In instruments with double focussing Forward Geometry the ESA is placed before the magnet sector analyser. The double focussing Reverse Geometry optics instrument is a combination in which the magnet is placed before the ESA. The order of the electric and magnetic segments of the instrument becomes highly important when considering tandem and MS n applications. Ion Optics When changing the strength in the magnetic field the ability of the instrument to resolve ions is affected, this is because of a change in the position of the final focal point of the beam will shift from the collector slit. Modern instruments use an electric field (the y-focus), to compensate for these beam deviations and will focus the ions at the same position (the collector slit), throughout the mass range. Z-focus lenses are used to compensate for divergences in the ion beam. Y-deflection and Z-deflection lenses are used to move the ion beam from side to side or up and down to ensure that the focus remains the collector slit. Crawford Scientific 53
, of an electromagnet, limiting the rate at which it can be forced to change field strength.")
55 Ion beam focusing Performance limitations Advances in the speed of LC separations continue to impose demands for faster scan rates on the mass spectrometer in hyphenated applications. [32] The scan rate of a magnetic sector instrument is limited by the reluctance (or inertia), of an electromagnet, limiting the rate at which it can be forced to change field strength. Laminated magnets permit more rapid changes in the magnetic field such that the mass range may be scanned at rates approaching 0.1 s/decade mass (70-700, m/z etc.). Problems with hysteresis (path X-Y is not the same as path Y-X) of the magnet are minimised by discharging the magnet completely between scans, adding a settling time interval between scan cycles and only scanning unidirectional for data collection all of which will improve the precision of the scan function. The ion should experience a homogeneous field strength during its transit through the magnetic field. If scan speeds are too high, the field strength may change during the transit of the ion through the analyser, causing the radius of deflection curvature to change. This causes the emergent ion beam to defocus away from the collector slit and lower resolution and sensitivity will result (up to 2% at scan rates of 0.1 sec / decade mass). [33] Crawford Scientific 54

56 Mass Accuracy & Resolution Mass spectrum ( Da mass range) Double-focussing magnetic / electric sector mass analysers can achieve 1000 resolution with little or no loss in sensitivity. Using the resolution of +10 lysozyme and its oxidative degradant previously studied with the quadrupole mass analyser the two overlapping components may be resolved at 1000 resolution, however, some mass error will be incurred with either centroid or peak top measurements. Increasing the resolution to 2000, with only a slight loss in sensitivity, is sufficient to provide only minimal peak broadening beyond the isotope contributions allowing the measurement of the average chemical mass. [4] Quadrupole versus magnetic sector mass analyser Crawford Scientific 55
57 The resolution of the instrument may be increased to as much as 10,000 in order to resolve the individual isotope peaks, however, sensitivity may be significantly compromised and identification of the monoisotopic peak can give significant problems. Performance figures There are a wide variety of mass spectrometers each with different resolution, mass range and mass accuracy characteristics. The table opposite presents typical values of resolution, mass range and mass accuracy for selected mass analysers. When performing quantitative analyses it is especially important to know the limits of detection of the mass analyser being used as well as the linear ramge where sample concentrations are expected to vary over a wide range. It is also important to know the dynamic range, which can be defined as the ratio of the largest to smallest detectable signal with the instrument operating under the same conditions. Table 4. Resolution, range and accuracy in selected mass analysers Resolution Mass Range Mass Accuracy Quadrupole amu Ion Trap amu Time of Flight , x amu Magnetic Sector , , amu Table 5. Detection level and dynamic range in selected mass analysers Quadrupole Optimal Detection Level pg (scanning) 500fg-5pg (SIM) Dynamic Range 10 5 Ion Trap 1-10pg 10 4 TOF 1-10pg 10 4 Magnetic sector pg (Scanning) 0.1-1pg (SIM) 10 6 Crawford Scientific 56
58 Mass analysers selection This table will help you to select the correct mass analyser according to your application requirements. Table 6. Benefits and limitations in selected mass analysers Mass Analyser Benefits Limitations Quadrupole Ion Trap Time of Flight Magnetic Sector Reproducibility Low cost High sensitivity Detection limit High ion transmission Highest practical mass range of all MS analyzers Detection limit High reproducibility Detection limit High resolution High sensitivity Tandem Mass Spectrometry High dynamic range Low resolution Mass discrimination. Peak height vs. mass response must be 'tuned' Poor quantitation Low scan rate Poor dynamic range Subject to space charge effects and ion molecule reactions Many parameters (excitation, trapping, detection conditions) define the quality of the mass spectrum Fast digitizers used in TOF can have limited dynamic range Expensive A tandem mass spectrometer has more than one analyser (usually two in practice), that are separated by a collision cell into which an inert gas (Ar, Xe, He) is admitted to provide fragmentation of selected sample ions through collision induced dissociation. The collision cell is usually a hexapole or octapole operating in rf-only mode to allow the passage of all ions. The gas pressure used in the collision cell can be varied to alter the degree of fragmentation produced (higher gas pressures giving rise to a higher degree of fragmentation). In practice many combinations of analyser are possible and each combination lends specific qualities to the analysis, such as high resolution and/or the ability to make accurate mass measurements. Some possible analyser combinations for tandem mass spectrometry are shown. MS/MS can also be achieved either by coupling multiple analysers (of the same or different kind) or, with a single ion trap, by doing various experiments within the trap. Crawford Scientific 57

59 MS/MS is the combination of two or more MS experiments. The aim is either to get structural information by fragmenting the ions isolated during the first experiment, and/or to achieve better selectivity and sensitivity for quantitative analysis. MS n (should read MS to the n) is an acronym that refers to multiple ion filtering within a single instrument. MS/MS (or MS 2 ) is usually termed product ion scanning. References 1. W. Paul & H. Steinwedel. Zeitschrift für Naturforschung. 8A; (1953), p P. E. Miller, M. B. Denton. Operating Concepts of the Quadrupole MS. J. Chem. Educ. 63, (1986), P. H. Dawson. Quadrupole Mass Analysers. Mass Spectrom. Rev. 5, (1986), March R. E. and Hughes R. J. Quadrupole Storage Mass Spectrometry. Wiley, New York M. Hail and I. C. Mylchreest. Presented at the 41 st ASMS Conference on Mass Spectrometry and Allied Topics. May 31 st. June 4, (1993), San Francisco, CA, C. N. McEwen and B. S. Larsen. Rapid commun. Mass Spectrom. 6, (1992), E. F. Barnett, W. S. W. Tandler, W. R. Turner. Quadrupole Mass Filter with Fringe Field Penetrating Structure. US Patent 3, (1971), W. M. Brubaker. Quadrupole MS, in Advances in Mass Spectrometry, Vol 4. Institute of Petroleum, London, (1968), W. C. Wiley and J. B. McLaren. Rev. Sci. Instrum. 26, (1955), M. Guilhaus. Principles and Instrumentation for TOF-MS. Int. J. Mass Spectrom. Ion Proc. 131, (1994), D. Ioanoviciu. Ion Optics in TOF-MS. Int. J. Mass Spectrom. Ion Proc. 131, (1994), A. A. Makarov. E. N. Raptakis. P. F. Derrick. Pitfalls on the road to the ideal TOF mirror. Int. J. Mass Spectrom. Ion Proc. 146/147, (1995), Crawford Scientific 58
Mass Analyzers. Principles of the three most common types magnetic sector, quadrupole and time of flight - will be discussed herein.
 Mass Analyzers After the production of ions in ion sources, the next critical step in mass spectrometry is to separate these gas phase ions according to their mass-to-charge ratio (m/z). Ions are extracted
Mass Spectrometry in MCAL
 Mass Spectrometry in MCAL Two systems: GC-MS, LC-MS GC seperates small, volatile, non-polar material MS is detection devise (Agilent 320-MS TQ Mass Spectrometer) Full scan monitoring SIM single ion monitoring
CEE 772: Instrumental Methods in Environmental Analysis
 Updated: 10 December 2014 Print version CEE 772: Instrumental Methods in Environmental Analysis Lecture #21 Mass Spectrometry: Mass Filters & Spectrometers (Skoog, Chapt. 20, pp.511-524) (Harris, Chapt.
CEE 772 Lecture #27 12/10/2014. CEE 772: Instrumental Methods in Environmental Analysis
 Updated: 10 December 2014 Print version CEE 772: Instrumental Methods in Environmental Analysis Lecture #21 Mass Spectrometry: Mass Filters & Spectrometers (Skoog, Chapt. 20, pp.511 524) (Harris, Chapt.
CHAPTER D3 TOF ION OPTICS
 Back to Basics Section D: Ion Optics CHAPTER D3 TOF ION OPTICS TABLE OF CONTENTS QuickGuide...399 Summary...401 Background...403 EquationsofMotionofIons...403 Resolution...405 Reflectron...407 Comparison
Mass Analyzers. mass measurement accuracy/reproducibility. % of ions allowed through the analyzer. Highest m/z that can be analyzed
 Mass Analyzers Double Focusing Magnetic Sector Quadrupole Mass Filter Quadrupole Ion Trap Linear Time-of-Flight (TOF) Reflectron TOF Fourier Transform Ion Cyclotron Resonance (FT-ICR-MS) Mass Analyzers
Quattro Micro - How does it work?
 Quattro Micro - How does it work? 1 Introduction This document is designed to familiarise you with the principles behind how the Quattro Micro works. The level of this document is designed as Level One
Chemistry Instrumental Analysis Lecture 35. Chem 4631
 Chemistry 4631 Instrumental Analysis Lecture 35 Principle components: Inlet Ion source Mass analyzer Ion transducer Pumps Signal processor Mass analyzers Quadrupole Time of Flight Double Focusing Ion
Types of Analyzers: Quadrupole: mass filter -part1
 16 Types of Analyzers: Sector or double focusing: magnetic and electric Time-of-flight (TOF) Quadrupole (mass filter) Linear ion trap Quadrupole Ion Trap (3D trap) FTICR fourier transform ion cyclotron
Introduction to the Q Trap LC/MS/MS System
 www.ietltd.com Proudly serving laboratories worldwide since 1979 CALL +1.847.913.0777 for Refurbished & Certified Lab Equipment ABI Q Trap LC/MS/MS Introduction to the Q Trap LC/MS/MS System The Q Trap
Ion traps. Quadrupole (3D) traps. Linear traps
 traps. Linear traps") Ion traps Quadrupole (3D) traps Linear traps 3D-Ion traps A 3D-ion trap can be considered the tridimensional analogue of the linear quadrupole mass analyzer: B A C D The central ring electrode of the 3D-ion
Ion traps Quadrupole (3D) traps Linear traps 3D-Ion traps A 3D-ion trap can be considered the tridimensional analogue of the linear quadrupole mass analyzer: B A C D The central ring electrode of the 3D-ion
Lecture 8: Mass Spectrometry
 intensity Lecture 8: Mass Spectrometry Relative abundance m/z 1 Ethylbenzene CH 2 CH 3 + m/z = 106 CH 2 + m/z = 91 C 8 H 10 MW = 106 CH + m/z = 77 + 2 2 What information can be obtained from a MS spectrum?
Lecture 8: Mass Spectrometry
 intensity Lecture 8: Mass Spectrometry Relative abundance m/z 1 Ethylbenzene experiment CH 2 CH 3 + m/z = 106 CH 2 + m/z = 91 C 8 H 10 MW = 106 CH + m/z = 77 + 2 2 What information can we get from MS spectrum?
CHAPTER D4 ORTHOGONAL TIME OF FLIGHT OPTICS
 Back to Basics Section D: Ion Optics CHAPTER D4 ORTHOGONAL TIME OF FLIGHT OPTICS TABLE OF CONTENTS QuickGuide...413 Summary...415 Introduction...417 The physical basis of orthogonal TOF....... 419 Pulsedmainbeamsofions...421
TANDEM MASS SPECTROSCOPY
 TANDEM MASS SPECTROSCOPY 1 MASS SPECTROMETER TYPES OF MASS SPECTROMETER PRINCIPLE TANDEM MASS SPECTROMETER INSTRUMENTATION QUADRAPOLE MASS ANALYZER TRIPLE QUADRAPOLE MASS ANALYZER TIME OF FLIGHT MASS ANALYSER
GRADUATE COURSE IN MASS SPECTROMETRY: LECTURE 2
 DEPARTMENTS OF CHEMISTRY AND BIOCHEMISTRY GRADUATE COURSE IN MASS SPECTROMETRY: LECTURE 2 Mass Analysers Shabaz Mohammed October 20, 2015 High Vacuum System Turbo pumps Diffusion pumps Rough pumps Rotary
ICPMS Doherty Lecture 1
 ICPMS Doherty Lecture 1 Mass Spectrometry This material provides some background on how to measure isotope abundances by means of mass spectrometry. Mass spectrometers create and separate ionized atoms
(Refer Slide Time 00:09) (Refer Slide Time 00:13)
 (Refer Slide Time 00:13)") (Refer Slide Time 00:09) Mass Spectrometry Based Proteomics Professor Sanjeeva Srivastava Department of Biosciences and Bioengineering Indian Institute of Technology, Bombay Mod 02 Lecture Number 09 (Refer
(Refer Slide Time 00:09) Mass Spectrometry Based Proteomics Professor Sanjeeva Srivastava Department of Biosciences and Bioengineering Indian Institute of Technology, Bombay Mod 02 Lecture Number 09 (Refer
Harris: Quantitative Chemical Analysis, Eight Edition
 Harris: Quantitative Chemical Analysis, Eight Edition CHAPTER 21: MASS SPECTROMETRY CHAPTER 21: Opener 21.0 Mass Spectrometry Mass Spectrometry provides information about 1) The elemental composition of
Mass Spectrometry and Proteomics - Lecture 2 - Matthias Trost Newcastle University
 Mass Spectrometry and Proteomics - Lecture 2 - Matthias Trost Newcastle University matthias.trost@ncl.ac.uk Previously: Resolution and other basics MALDI Electrospray 40 Lecture 2 Mass analysers Detectors
Fundamentals of Mass Spectrometry. Fundamentals of Mass Spectrometry. Learning Objective. Proteomics
 Mass spectrometry (MS) is the technique for protein identification and analysis by production of charged molecular species in vacuum, and their separation by magnetic and electric fields based on mass
Mass Spectrometry. What is Mass Spectrometry?
 Mass Spectrometry What is Mass Spectrometry? Mass Spectrometry (MS): The generation of gaseous ions from a sample, separation of these ions by mass-to-charge ratio, and measurement of relative abundance
Ion trap. 3D Quadrupole Trap. -Mass spectrometer -Ion trap (Quadrupol Ion Storage, Quistor) 18. April
 18. April") Ion trap 3D Quadrupole Trap -Mass spectrometer -Ion trap (Quadrupol Ion Storage, Quistor) 18. April 011 1 The trajectories of the ions can be given: They form Mathieu differential equations: with r + Ion
Ion trap 3D Quadrupole Trap -Mass spectrometer -Ion trap (Quadrupol Ion Storage, Quistor) 18. April 011 1 The trajectories of the ions can be given: They form Mathieu differential equations: with r + Ion
Instrumental Analysis. Mass Spectrometry. Lecturer:! Somsak Sirichai
 303351 Instrumental Analysis Mass Spectrometry Lecturer:! Somsak Sirichai Mass Spectrometry What is Mass spectrometry (MS)? An analytic method that employs ionization and mass analysis of compounds in
MASS ANALYSER. Mass analysers - separate the ions according to their mass-to-charge ratio. sample. Vacuum pumps
 ION ANALYZERS MASS ANALYSER sample Vacuum pumps Mass analysers - separate the ions according to their mass-to-charge ratio MASS ANALYSER Separate the ions according to their mass-to-charge ratio in space
Mass Analyzers. Ion Trap, FTICR, Orbitrap. CU- Boulder CHEM 5181: Mass Spectrometry & Chromatography. Prof. Jose-Luis Jimenez
 Mass Analyzers Ion Trap, FTICR, Orbitrap CU- Boulder CHEM 5181: Mass Spectrometry & Chromatography Prof. Jose-Luis Jimenez Last Update: Oct. 014 Some slides from Dr. Joel Kimmel (007) MS Interpretation
Translational Biomarker Core
 Translational Biomarker Core Instrumentation Thermo Scientific TSQ Quantum Triple Quadrupole Mass Spectrometers. There are two TSQ Quantum Ultra AM instruments available in the TBC. The TSQ Quantum Ultra
Courtesy of ESS and TheRGA web pages part of a series of application and theory notes for public use which are provided free of charge by ESS.
 ESS The RGA freenotes Theory page 1 of 14 RGA Theory Notes Courtesy of ESS and TheRGA web pages part of a series of application and theory notes for public use which are provided free of charge by ESS.
MS Goals and Applications. MS Goals and Applications
 MS Goals and Applications 3 Several variations on a theme, three common steps Form gas-phase ions choice of ionization method depends on sample identity and information required Separate ions on basis
MS Goals and Applications. MS Goals and Applications
 MS Goals and Applications 1 Several variations on a theme, three common steps Form gas-phase ions choice of ionization method depends on sample identity and information required Separate ions on basis
Interface (backside) & Extraction Lens
 & Extraction Lens") Plasma Interface Interface (backside) & Extraction Lens Extraction Lens (-2000 volts) ION OPTICS Tip of the sampler cone is positioned to be in the region of maximum ionization Ions no longer under control
Plasma Interface Interface (backside) & Extraction Lens Extraction Lens (-2000 volts) ION OPTICS Tip of the sampler cone is positioned to be in the region of maximum ionization Ions no longer under control
Time-of-Flight Mass Analyzers
 Time-of-Flight Mass Analyzers Jonathan Karty C613 lecture 1 March 6, 8 (Section 4. in Gross, pages 115-18) TOF Overview Time-of-flight (TOF) is the least complex mass analyzer in terms of its theory Ions
1. The range of frequencies that a measurement is sensitive to is called the frequency
 CHEM 3 Name Exam 1 Fall 014 Complete these problems on separate paper and staple it to this sheet when you are finished. Please initial each sheet as well. Clearly mark your answers. YOU MUST SHOW YOUR
Fourier Transform Ion Cyclotron Resonance Mass Spectrometry (FT-ICR-MS)
") Fourier Transform Ion Cyclotron Resonance Mass Spectrometry (FT-ICR-MS) The first steps along the way to FT- ICR-MS date back to the 1930s, when Ernest Lawrence, at the University of California - Berkeley,
Fourier Transform Ion Cyclotron Resonance Mass Spectrometry (FT-ICR-MS) The first steps along the way to FT- ICR-MS date back to the 1930s, when Ernest Lawrence, at the University of California - Berkeley,
This is the total charge on an ion divided by the elementary charge (e).
.") 12.2 Fundamentals and general terms Accelerator mass spectrometry An ultra-sensitive technique using tandem accelerators employed mainly for the study of long-lived radioisotopes, and stable isotopes at
12.2 Fundamentals and general terms Accelerator mass spectrometry An ultra-sensitive technique using tandem accelerators employed mainly for the study of long-lived radioisotopes, and stable isotopes at
The Analyzer. We will deal mainly with magnetic sector instruments here although we will talk briefly about other separation methods later.
 The Analyzer The analyzer is where the beam of ions generated in the ion source is separated into multiple beams each representing a single charge to mass ratio (ideally). We will deal mainly with magnetic
Mass spectrometry.
 Mass spectrometry Mass spectrometry provides qualitative and quantitative information about the atomic and molecular composition of inorganic and organic materials. The mass spectrometer produces charged
MS/MS .LQGVRI0606([SHULPHQWV
 0DVV6SHFWURPHWHUV Tandem Mass Spectrometry (MS/MS) :KDWLV0606" Mass spectrometers are commonly combined with separation devices such as gas chromatographs (GC) and liquid chromatographs (LC). The GC or
Secondary Ion Mass Spectroscopy (SIMS)
") Secondary Ion Mass Spectroscopy (SIMS) Analyzing Inorganic Solids * = under special conditions ** = semiconductors only + = limited number of elements or groups Analyzing Organic Solids * = under special
Secondary Ion Mass Spectroscopy (SIMS) Analyzing Inorganic Solids * = under special conditions ** = semiconductors only + = limited number of elements or groups Analyzing Organic Solids * = under special
1) Introduction. 2) Types of Mass Analyzers - Overview. Assigned Reading: Nier mass spectrometry paper Extra Reading:
 Introduction. 2) Types of Mass Analyzers - Overview. Assigned Reading: Nier mass spectrometry paper Extra Reading:") Assigned Reading: Nier mass spectrometry paper Extra Reading: 1) Introduction a) We are now on to the heart of the mass spectrometer. How do you separate ions of different mass, so that you can detect/quantify
Assigned Reading: Nier mass spectrometry paper Extra Reading: 1) Introduction a) We are now on to the heart of the mass spectrometer. How do you separate ions of different mass, so that you can detect/quantify
Introduction to GC/MS
 Why Mass Spectrometry? Introduction to GC/MS A powerful analytical technique used to: 1.Identify unknown compounds 2. Quantify known materials down to trace levels 3. Elucidate the structure of molecules
The Theory of HPLC. Quantitative and Qualitative HPLC
 The Theory of HPLC Quantitative and Qualitative HPLC i Wherever you see this symbol, it is important to access the on-line course as there is interactive material that cannot be fully shown in this reference
Analysis of Polar Metabolites using Mass Spectrometry
 Analysis of Polar Metabolites using Mass Spectrometry TransMed Course: Basics in Clinical Proteomics and Metabolomics. Oct 10-19, 2012 dd.mm.yyyy Vidya Velagapudi, Ph.D, Adjunct Professor Head of the Metabolomics
Tendenze nell innovazione della strumentazione in spettrometria di massa:
 Tendenze nell innovazione della strumentazione in spettrometria di massa: Trappola lineare, orbitrap, ion mobility e nuova strumentazione René Magritte La Condition Humaine 1 Ion Trap Mass Spectrometry
Application Note GA-301E. MBMS for Preformed Ions. Extrel CMS, 575 Epsilon Drive, Pittsburgh, PA I. SAMPLING A CHEMICAL SOUP
 Application Note MBMS for Preformed Ions, 575 Epsilon Drive, Pittsburgh, PA 15238 (Poster Presented at 45th ASMS Conference on Mass Spectrometry, June 1-5, 1997) In order to accurately characterize a plasma
Chemistry 311: Topic 3 - Mass Spectrometry
 Mass Spectroscopy: A technique used to measure the mass-to-charge ratio of molecules and atoms. Often characteristic ions produced by an induced unimolecular dissociation of a molecule are measured. These
Week 5: Fourier Tranform-based Mass Analyzers: FT-ICR and Orbitrap
 Week 5: Fourier Tranform-based Mass Analyzers: FT-ICR and Orbitrap 1 Last Time Mass Analyzers; CAD and TOF mass analyzers: 2 Fourier Transforms A transform is when you change your analytical space without
LECTURE-11. Hybrid MS Configurations HANDOUT. As discussed in our previous lecture, mass spectrometry is by far the most versatile
 LECTURE-11 Hybrid MS Configurations HANDOUT PREAMBLE As discussed in our previous lecture, mass spectrometry is by far the most versatile technique used in proteomics. We had also discussed some of the
- A spark is passed through the Argon in the presence of the RF field of the coil to initiate the plasma
 THE PLASMA Inductively Coupled Plasma Mass Spectrometry (ICP-MS) What is a Plasma? - The magnetic field created by a RF (radio frequency) coil produces a current within a stream of Argon (Ar) gas, which
MASS SPECTROMETRY. Topics
 MASS SPECTROMETRY MALDI-TOF AND ESI-MS Topics Principle of Mass Spectrometry MALDI-TOF Determination of Mw of Proteins Structural Information by MS: Primary Sequence of a Protein 1 A. Principles Ionization:
Principles of Quadrupole and Ion Trap Mass Analyzers
 Principles of Quadrupole and Ion Trap Mass Analyzers 2-1 Rev20040526 Bioanalytical LC-MS 2-1 The Mass Peak in the Quadrupole Mass Spectrum 2-2 A common phrase in texts on MS says, Examine the peaks in
Thermo Scientific LTQ Orbitrap Velos Hybrid FT Mass Spectrometer
 IET International Equipment Trading Ltd. www.ietltd.com Proudly serving laboratories worldwide since 1979 CALL +847.913.0777 for Refurbished & Certified Lab Equipment Thermo Scientific LTQ Orbitrap Velos
Accurate, High-Throughput Protein Identification Using the Q TRAP LC/MS/MS System and Pro ID Software
 www.ietltd.com Proudly serving laboratories worldwide since 1979 CALL +1.847.913.0777 for Refurbished & Certified Lab Equipment ABI Q Trap Pro LC/MS/MS Accurate, High-Throughput Protein Identification
ELEMENT2 High Resolution- ICP-MS INSTRUMENT OVERVIEW
 ELEMENT2 High Resolution- ICP-MS INSTRUMENT OVERVIEW Inductively Coupled Plasma Mass Spectrometry (ICP-MS) What is a Plasma? - The magnetic field created by a RF (radio frequency) coil produces
Screening of pesticides residues by the time of flight analyzer (ToF) : Myth or reality?
 : Myth or reality?") Screening of pesticides residues by the time of flight analyzer (ToF) : Myth or reality? Laure Joly & Vincent Hanot WIV-ISP, Juliette Wytsmanstraat 14, 15 Brussel The passengers pesticides are requested......
Screening of pesticides residues by the time of flight analyzer (ToF) : Myth or reality? Laure Joly & Vincent Hanot WIV-ISP, Juliette Wytsmanstraat 14, 15 Brussel The passengers pesticides are requested......
ICP-MS. High Resolution ICP-MS.
 ICP-MS attom ES High Resolution ICP-MS www.nu-ins.com Attom ES Enhanced Sensitivity Enhanced Speed Enhanced Selectivity Enhanced Software The Attom ES from Nu Instruments is a double focussing inductively
[ instrument specifications ]
![[ instrument specifications ]](/thumbs/95/122987442.jpg "[ instrument specifications ]") Designed for leading researchers working at the limits of conventional mass spectrometry capabilities who need to further characterize and define their samples the Waters SYNAPT High Definition MS (HDMS
Designed for leading researchers working at the limits of conventional mass spectrometry capabilities who need to further characterize and define their samples the Waters SYNAPT High Definition MS (HDMS
Basic structure of SEM
 Table of contents Basis structure of SEM SEM imaging modes Comparison of ordinary SEM and FESEM Electron behavior Electron matter interaction o Elastic interaction o Inelastic interaction o Interaction
Ionization Techniques Part IV
 Ionization Techniques Part IV CU- Boulder CHEM 5181 Mass Spectrometry & Chromatography Presented by Prof. Jose L. Jimenez High Vacuum MS Interpretation Lectures Sample Inlet Ion Source Mass Analyzer Detector
Technical Note # TN-24 Extending the Capacity in Modern Spherical High Capacity Ion Traps (HCT)
") Bruker Daltonics Technical Note # TN-24 Extending the Capacity in Modern Spherical High Capacity Ion Traps (HCT) During the last decade, RF ion traps have become a workhorse of the analytical laboratory
Bruker Daltonics Technical Note # TN-24 Extending the Capacity in Modern Spherical High Capacity Ion Traps (HCT) During the last decade, RF ion traps have become a workhorse of the analytical laboratory
Thermo Finnigan LTQ. Specifications
 IET International Equipment Trading Ltd. www.ietltd.com Proudly serving laboratories worldwide since 1979 CALL +847.913.0777 for Refurbished & Certified Lab Equipment Thermo Finnigan LTQ Specifications
Mass Selective Ejection by Axial Resonant Excitation from a Linear Ion Trap
 Mass Selective Ejection by Axial Resonant Excitation from a Linear Ion Trap Yuichiro Hashimoto, Hideki Hasegawa, Takashi Baba, and Izumi Waki Central Research Laboratory, Hitachi, Ld., Tokyo, Japan We
Assay Robustness Improvement for Drug Urinalysis Using FAIMS and H-SRM on a Triple- Quadrupole Mass Spectrometer
 38 Current Trends in Mass Spectrometry November 6 Assay Robustness Improvement for Drug Urinalysis Using FAIMS and H-SRM on a Triple- Quadrupole Mass Spectrometer This article demonstrates the improved
Extrel Application Note
 Extrel Application Note Real-Time Plasma Monitoring and Detection of Trace H 2 O and HF Species in an Argon Based Plasma Jian Wei, 575 Epsilon Drive, Pittsburgh, PA 15238. (Presented at the 191st Electrochemical
Simulation of External Ion Injection, Cooling and Extraction Processes with SIMION 6.0 for the Ion Trap/Reflectron Time-of-flight Mass Spectrometer
 RAPID COMMUNICATIONS IN MASS SPECTROMETRY, VOL. 11, 1467 1477 (1997) Simulation of External Ion Injection, Cooling and Extraction Processes with SIMION 6.0 for the Ion Trap/Reflectron Time-of-flight Mass
Finnigan LCQ Advantage MAX
 www.ietltd.com Proudly serving laboratories worldwide since 1979 CALL +847.913.0777 for Refurbished & Certified Lab Equipment Finnigan LCQ Advantage MAX The Finnigan LCQ Advantage MAX ion trap mass spectrometer
object objective lens eyepiece lens
 Advancing Physics G495 June 2015 SET #1 ANSWERS Field and Particle Pictures Seeing with electrons The compound optical microscope Q1. Before attempting this question it may be helpful to review ray diagram
Mass Spectrometry. Hyphenated Techniques GC-MS LC-MS and MS-MS
 Mass Spectrometry Hyphenated Techniques GC-MS LC-MS and MS-MS Reasons for Using Chromatography with MS Mixture analysis by MS alone is difficult Fragmentation from ionization (EI or CI) Fragments from
Physics 1308 Exam 2 Summer 2015
 Physics 1308 Exam 2 Summer 2015 E2-01 2. The direction of the magnetic field in a certain region of space is determined by firing a test charge into the region with its velocity in various directions in
EXPERIMENT 2-6. e/m OF THE ELECTRON GENERAL DISCUSSION
 Columbia Physics: Lab -6 (ver. 10) 1 EXPERMENT -6 e/m OF THE ELECTRON GENERAL DSCUSSON The "discovery" of the electron by J. J. Thomson in 1897 refers to the experiment in which it was shown that "cathode
vacuum analysis plasma diagnostics surface science gas analysis
 Hiden EQP Systems High Sensitivity Mass and Energy Analysers for Monitoring, Control and Characterisation of Ions, Neutrals and Radicals in Plasma. vacuum analysis surface science gas analysis plasma diagnostics
Mass Spectroscopy. Base peak. Molecular Ion peak. The positively charged fragments produced are separated, based on their mass/charge (m/z) ratio. M+.
 ratio. M+.") Mass spectrometry is the study of systems causing the formation of gaseous ions, with or without fragmentation, which are then characteried by their mass to charge ratios (m/) and relative abundances.
Mass spectrometry is the study of systems causing the formation of gaseous ions, with or without fragmentation, which are then characteried by their mass to charge ratios (m/) and relative abundances.
CHARGED PARTICLES IN FIELDS
 The electron beam used to study motion of charged particles in electric and/or magnetic fields. CHARGED PARTICLES IN FIELDS Physics 41/61 Fall 01 1 Introduction The precise control of charged particles
Proudly serving laboratories worldwide since 1979 CALL for Refurbished & Certified Lab Equipment
 www.ietltd.com Proudly serving laboratories worldwide since 1979 CALL +1.847.913.0777 for Refurbished & Certified Lab Equipment Applied Biosystems QStar Pulsar i Features of the API QSTAR Pulsar i The
Lecture 22 Ion Beam Techniques
 Lecture 22 Ion Beam Techniques Schroder: Chapter 11.3 1/44 Announcements Homework 6/6: Will be online on later today. Due Wednesday June 6th at 10:00am. I will return it at the final exam (14 th June).
Live Webinar : How to be more Successful with your ACQUITY QDa Detector?
 Live Webinar : How to be more Successful with your ACQUITY QDa Detector? Q&A Transcript ---------------- Q - How do you generate multiple charges reproductively? A - If you use the same settings on the
Asymmetrical features of mass spectral peaks produced by quadrupole mass filters
 RAPID COMMUNICATIONS IN MASS SPECTROMETRY Rapid Commun. Mass Spectrom. 2003; 17: 1051 1055 Published online in Wiley InterScience (www.interscience.wiley.com). DOI: 10.1002/rcm.1017 Asymmetrical features
Mass Analysers for LC MS
 Mass Analysers for LC MS Filip Lemière, Dept of Chemistry, University of Antwerp, Belgium. Image courtesy of Bruker Daltonik GmbH Introduction The major technical challenge in LC MS is interfacing the
Lab 6 - ELECTRON CHARGE-TO-MASS RATIO
 101 Name Date Partners OBJECTIVES OVERVIEW Lab 6 - ELECTRON CHARGE-TO-MASS RATIO To understand how electric and magnetic fields impact an electron beam To experimentally determine the electron charge-to-mass
Laser Dissociation of Protonated PAHs
 100 Chapter 5 Laser Dissociation of Protonated PAHs 5.1 Experiments The photodissociation experiments were performed with protonated PAHs using different laser sources. The calculations from Chapter 3
v = E B FXA 2008 UNIT G485 Module Magnetic Fields BQv = EQ THE MASS SPECTROMETER
 UNIT G485 Module 1 5.1.2 Magnetic Fields 11 Thus, in order for the particle to suffer NO DEFLECTION and so exit the device at Y : From which : MAGNETIC FORCE UP = ELECTRIC FORCE DOWN BQv = EQ THE MASS
LIQUID CHROMATOGRAPHY-MASS SPECTROMETRY (LC/MS) Presented by: Dr. T. Nageswara Rao M.Pharm PhD KTPC
 Presented by: Dr. T. Nageswara Rao M.Pharm PhD KTPC") LIQUID CHROMATOGRAPHY-MASS SPECTROMETRY (LC/MS) Presented by: Dr. T. Nageswara Rao M.Pharm PhD KTPC INTRODUCTION Principle: LC/MS is a technique that combines physical separation capabilities of liquid
LIQUID CHROMATOGRAPHY-MASS SPECTROMETRY (LC/MS) Presented by: Dr. T. Nageswara Rao M.Pharm PhD KTPC INTRODUCTION Principle: LC/MS is a technique that combines physical separation capabilities of liquid
Mass Spectrometry. Fundamental LC-MS. Electrospray Ionisation Instrumentation
 Mass Spectrometry Fundamental LC-MS Electrospray Ionisation Instrumentation i Wherever you see this symbol, it is important to access the on-line course as there is interactive material that cannot be
Chemistry Instrumental Analysis Lecture 37. Chem 4631
 Chemistry 4631 Instrumental Analysis Lecture 37 Most analytes separated by HPLC are thermally stable and non-volatile (liquids) (unlike in GC) so not ionized easily by EI or CI techniques. MS must be at
PARTICLE ACCELERATORS
 VISUAL PHYSICS ONLINE PARTICLE ACCELERATORS Particle accelerators are used to accelerate elementary particles to very high energies for: Production of radioisotopes Probing the structure of matter There
Hiden HPR60 Molecular Beam Mass Spectrometer System
 Hiden HPR60 Molecular Beam Mass Spectrometer System vacuum analysis surface science plasma diagnostics gas analysis HPR60 MBMS Overview The Hiden HPR60 Molecular Beam Mass Spectrometer (MBMS) is a compact,
Introduction to LC-MS
 Wednesday April 5, 2017 10am Introduction to LC-MS Amy Patton, MS Laboratory Manager, Pinpoint Testing, LLC Little Rock, AR DESCRIPTION: Amy Patton, laboratory manager for Pinpoint Testing, will begin
Abstract. 1. Introduction. 2. Methodology
 Abstract When a transverse electric field between a pair of closely spaced slits is used to deflect an ion beam, the length of the field region along the beam axis directly affects the length of time required
Physics 1308 Exam 2 Summer Instructions
 Name: Date: Instructions All Students at SMU are under the jurisdiction of the Honor Code, which you have already signed a pledge to uphold upon entering the University. For this particular exam, you may
Ion Trajectories in the Injection Quadrupole for SIFT-MS
 WDS' Proceedings of Contributed Papers, Part II, 44 48, 0. ISBN 978-80-7378-5- MATFYZPRESS Ion Trajectories in the Injection Quadrupole for SIFT-MS A. Spesyvyi Charles University Prague, Faculty of Mathematics
Questions on Electric Fields
 Questions on Electric Fields 1. The diagram shows a positively charged oil drop held at rest between two parallel conducting plates A and B. Oil drop A B 2.50 cm The oil drop has a mass 9.79 x 10 15 kg.
LC-MS Based Metabolomics
 LC-MS Based Metabolomics Analysing the METABOLOME 1. Metabolite Extraction 2. Metabolite detection (with or without separation) 3. Data analysis Metabolite Detection GC-MS: Naturally volatile or made volatile
Photoelectron spectroscopy Instrumentation. Nanomaterials characterization 2
 Photoelectron spectroscopy Instrumentation Nanomaterials characterization 2 RNDr. Věra V Vodičkov ková,, PhD. Photoelectron Spectroscopy general scheme Impact of X-ray emitted from source to the sample
Theory English (Official)
") Q3-1 Large Hadron Collider (10 points) Please read the general instructions in the separate envelope before you start this problem. In this task, the physics of the particle accelerator LHC (Large Hadron
Q3-1 Large Hadron Collider (10 points) Please read the general instructions in the separate envelope before you start this problem. In this task, the physics of the particle accelerator LHC (Large Hadron
Photoelectron Spectroscopy using High Order Harmonic Generation
 Photoelectron Spectroscopy using High Order Harmonic Generation Alana Ogata Yamanouchi Lab, University of Tokyo ABSTRACT The analysis of photochemical processes has been previously limited by the short
Mass spectrometry gas phase transfer and instrumentation
 Objectives of the Lecture spectrometry gas phase transfer and instrumentation Matt Renfrow January 15, 2014 1. Make ions 2. Separate/Analyze 3. Detect ions 4. What is mass resolution and mass accuracy?
ELECTROSTATIC FIELDS
 ELECTROSTATIC FIELDS Electric charge Ordinary matter is made up of atoms which have positively charged nuclei and negatively charged electrons surrounding them. A body can become charged if it loses or
Lab 5 - ELECTRON CHARGE-TO-MASS RATIO
 81 Name Date Partners Lab 5 - ELECTRON CHARGE-TO-MASS RATIO OBJECTIVES To understand how electric and magnetic fields impact an electron beam To experimentally determine the electron charge-to-mass ratio
SEAMLESS INTEGRATION OF MASS DETECTION INTO THE UV CHROMATOGRAPHIC WORKFLOW
 SEAMLESS INTEGRATION OF MASS DETECTION INTO THE UV CHROMATOGRAPHIC WORKFLOW Paula Hong, John Van Antwerp, and Patricia McConville Waters Corporation, Milford, MA, USA Historically UV detection has been
Space Charge Effects in Linear. Quadrupole Ion Traps
 Space Charge Effects in Linear Quadrupole Ion Traps by Cong Gao B.Sc., Peking University, 2010 A THESIS SUBMITTED IN PARTIAL FULFILLMENT OF THE REQUIREMENTS FOR THE DEGREE OF DOCTOR OF PHILOSOPHY in The