INHERITANCE OF PHOTOPERIOD- INDUCED FLOWERING AND A GLABROUS-STEM MARKER GENE IN Aeschynomene americana CHRISTOPHER W. UNIVERSITY OF FLORIDA DEREN
|
|
|
- Myrtle Robinson
- 5 years ago
- Views:
Transcription

1 INHERITANCE OF PHOTOPERIOD- INDUCED FLOWERING AND A GLABROUS-STEM MARKER GENE IN Aeschynomene americana BY CHRISTOPHER W. DEREN A DISSERTATION PRESENTED TO THE GRADUATE SCHOOL OF THE UNIVERSITY OF FLORIDA IN PARTIAL FULFILLMENT OF THE REQUIREMENTS FOR THE DEGREE OF DOCTOR OF PHILOSOPHY UNIVERSITY OF FLORIDA 1986

2 ACKNOWLEDGMENTS Several people have helped me carry out this project. I thank my advisor. Dr. Quesenberry, for providing assistance so that I could study here at Florida. He has given very generous support and been an active participant throughout the program. My committee members, Drs. Horner, Popenoe, Moore, and Lyrene, have each contributed from their own areas of expertise, providing valuable opinions from different perspectives. Finally, I thank Dr. Kretchner, Tom Wilson, and Maude Macquarrie for all their help at Ft. Pierce.

3 TABLE OF CONTENTS PAGE ACKNOWLEDGMENTS ABSTRACT li iv CHAPTERS I INTRODUCTION 1 II GLABROUS/PUBESCENT STEM: A SEEDLING MARKER GENE 4 Introduction 4 Materials and Methods 4 Results and Discussion 6 Conclusion 9 III INHERITANCE OF PHOTOPERIOD INDUCED FLOWERING 12 Introduction 12 Literature Review of Photoperiod Induced Flowering 12 Materials and Methods 16 Results and Discussion 22 Photoinsensitive Allele 22 Analysis of Crosses 55 x 206 and 232 x IV CONCLUSION 79 APPENDICES A FREQUENCY DISTRIBUTIONS OF 55 x 206 AND 232 x B CHI-SQUARE CONTINGENCY TABLES OF 55 x 232 AND 232 x 206 F^s 88 C CHI-SQUARE CONTINGENCY TABLES OF BACKCROSSES 94 LITERATURE CITED 100 BIOGRAPHICAL SKETCH 103

4 Abstract of Dissertation Presented to the Graduate School of the University of Florida in Partial Fulfillment of the Requirements for the Degree of Doctor of Philosophy INHERITANCE OF PHOTOPERIOD-INDUCED FLOWERING AND A GLABROUS-STEM MARKER GENE IN Aeschynomene americana By CHRISTOPHER W. DEREN December 1986 Chairman: K. H. Quesenberry Major Department: Agronomy A study of the inheritance of photoperiod-induced flowering and a glabrous/pubescent stem character was conducted on the tropical forage legume Aeschynomene americana L. A pubescent, photoperiod-insensitive line and a glabrous, late-flowering, photoperiod-sensitive line were crossed with two pubescent lines, each of which was photoperiod sensitive and flowered at about mid-range. Parents, F, F, and reciprocal backcrosses of each cross were grown at two "Florida locations, Gainesville and Ft. Pierce. Approximately 2000 plants were planted at each location in a randomized complete block design with five replications. Individual plants were classified as pubescent or glabrous, and date of first flowering was recorded. Analysis of the pubescent x glabrous crosses revealed that this trait is controlled at one locus with a glabrous allele completely dominant over a pubescent allele. In crosses of the photoperiod-insensitive parent x the two mid-range, photoperiod-sensitive parents, sensitivity to photoperiod was completely dominant to insensitivity in a one locus, two allele
5 system. Mather and Jinks ' s scaling test and method of partitioning components of variation were employed in initial analysis of the crosses between the two mid-range parents and the late flowering line, The data fit an additive-dominance model with most genetic variance being additive. After further analysis with Powers ' s partitioning method, it was concluded that a completely additive genetic system involving two loci, each with two alleles, was primarily responsible for induction of flowering by photoperiod. Expression appeared to be modified by minor genes and environment.

6 CHAPTER I GENERAL INTRODUCTION Much of the world's crop production is concentrated on a relatively small number of plant species such as wheat, rice, maize, and beans. But as demand for agricultural products increases, the potential contributions of many of the countless other crop plants that are cultivated, including those in the tropics, are being more intensively investigated. Associated with increased interest in evaluation and conservation of cultivated germplasm is the parallel enterprise of collecting and evaluating wild species for potential use as domesticated plants. Most agricultural research has been conducted on temperate climate crops; research on management and improvement of many tropical species is, by comparison, an untouched area of study. Due to its unique geography and climate, Florida is well suited both for the study of tropical/subtropical plants and for their inclusion in local agricultural production. A good example of this is the forage research presently being carried out in the state. As a major beef producer, Florida grows a substantial amount of forage, making it one of the state's major agronomic crops. Yet the poor nutritive quality of native range and pastures has prompted interest m the possibility of using various exotic tropical plants as forage resources. One such plant is Aeschynomene americana L., also commonly known by its genus name aeschynomene or as American ]ointvetch.
.")
7 Aeschynomene is a woody tropical/subtropical legume distributed throughout much of Central and South America as well as the eastern gulf coastal states of the U.S. (24). Although it is considered undomesticated, in Florida the plant is grown as a reseeding annual forage to supplement grass pastures which are of low quality during late summer and fall (9). Aeschynomene ' s main attributes for Florida are its relatively high nutrient quality, and the fact that it is particularly well adapted to the periodically flooded flatwoods soils that are common in the cattle producing areas of the state (1,9,15). Recognizing the potential of aeschynomene, forage workers have recently begun collecting and evaluating plant introductions from diverse origins, with the objective of developing an improved cultivar. Development of a cultivar from a wild plant is both exciting for its potential and risky due to the unknown genetic nature of the material. Aeschynomene has many characteristics that show promise for its use as a forage, yet genetic studies are entirely lacking. Although a breeding program does not by any means require genetic definition of every plant character being manipulated, understanding the genetics of some major traits can facilitate development of prudent and efficient breeding plans and thereby help avoid wasted effort. In addition, a knowledge of the genetics of certain characters can aid in defining the genetics of other traits. Initial characterization of aeschynomene accessions showed a great deal of variation in several traits, including growth habit, plant size, pubescence, flower color, nematode tolerance, and


8 . flowering response to photoperiod (23). The latter is of particular concern in Florida and other subtropical areas where annual fluctuation of daylength can be great. As mentioned, aeschynomene is grown as a reseeding annual; thus ample seed must be produced to establish the subsequent year's crop. However, flowering drastically reduces foliage production, so ideally it must take place as late as possible in the growing season to assure maximum forage yield yet soon enough before the first killing frost to provide the seed necessary for the following year's stand. An understanding of the inheritance of photoperiod induced flowering can aid the breeder in determining if and how he can manipulate this character to maximize forage production Another character of interest was the glabrous/pubescent stem. Most aeschynomene lines are pubescent, yet one was distinctly glabrous. While no agronomic benefit can be attributed to either condition, the interest in this character is m its potential value as a marker gene. After traits of practical importance were identified, the following specific objectives of this research were formulated: 1) Attempt to define the genetics of inheritance of the glabrous/pubescent stem character. 2) Investigate the inheritance of photoperiod-induced flowering in aeschynomene.

9 CHAPTER II GLABROUS/PUBESCENT STEM: A SEEDLING MARKER GENE Introduction Simply inherited, easily discerned marker genes can be valuable in a variety of genetic studies, ranging from biochemical genetics to practical plant breeding. For the breeder, a seedling marker can be especially useful in that it facilitates early classification of phenotypes, thus eliminating the necessity of growing plants to maturity before evaluation. One objective of our preliminary work on Aeschynomene americana genetics conducted in Florida, was to identify the inheritance of a glabrous/pubescent stem character that appeared to be simply inherited and potentially useful as a seedling marker gene. Materials and Methods In 1985 two pubescent accessions identified as 55 and 232 were grown in the greenhouse and crossed with the glabrous accession 206 (Table 2-1). Single F plants, one from each of the two crosses, were grown in the greenhouse, allowed to self -pollinate to set F_ seed, and were also backcrossed to both of their respective parents. In the summer of 1985 seed from the P p f^, F, BC,, and BC _ generations of each cross were planted in pet pellets. Three week old seedlings, 15 to 20 cm high, were evaluated for the presence or
10 Table 2-1. Accessions of Aeschynomene americana used as parents. Accession no. Phenotype Origin 55 pubescent Florida 206 glabrous Panama 232 pubescent Brazil

11 absence of stem pubescence. Next, samples of plants were randomly selected from each generation and planted into the field where they were again observed for pubescence as mature plants of about 150 days age. Results and Discussion Seedlings The definite classification of a seedling as either pubescent or glabrous is difficult until it is about 15 to 20 cm high or at the fifth to seventh node stage of growth. The results of classification at this growth stage are given in Table 2-2. All offspring arising from self-pollination of the pubescent parent accessions 55 and 232 were pubescent, and all progeny from the selfed glabrous 206 plant were glabrous. The F s were all glabrous m both the 55 x 206 and 232 x 206 crosses, evidence that glabrousness is completely dominant. However, in a few plants which were almost completely glabrous, a very few hairs could be seen on the distal ends of some branches, frequently in a row running along the axis of the stem. These plants were noted for the possibility of their constituting an intermediate class. The F generations of both crosses were observed to segregate rather distinctly into a larger glabrous class and a smaller pubescent class. Again, in evaluation of the F^, there was some incidence of what appeared to be glabrous plants with a very low level of pubescence. The degree of this was noted as above for the possibility of intermediate classes. When these plants were totaled as an intermediate class, however, the results were inconclusive. When they

12 Table 2-2. Seedling data and chi-squares of glabrous/pubescent stem character in Aeschynomene americana. No. No. glabrous pubescent Observed Expected Generation Pedigree plants plants ratio ratio 2 X Parent

 x 206 and (232 x 206) x 206, all progeny were glabrous, but in these populations too there were some plants with very low levels of pubescence near")
13 were pooled with the totally glabrous group, there was a 3:1 segregation of glabrous to pubescent. This was true for both the 232 X 206 F^ and the 55 x 206 F ^j data of the latter cross fit the expected ratio exactly. The data for 232 x 206 also showed a good fit, with a chi-square probability of 0.30 to Backcrosses behaved as expected based on the performance of the F^ and F generations. In backcrosses to the glabrous parent (55 X 206) x 206 and (232 x 206) x 206, all progeny were glabrous, but in these populations too there were some plants with very low levels of pubescence near the branch tips. The backcrosses to the pubescent parents, (55 x 206) x 55 and ( 232 x 206) x 232, segregated in a 1:1 ratio, again with some glabrous plants showing some tip pubescence. The (55 X 206) x 55 backcross fit a 1:1 ratio almost exactly. The chi-square for (232 x 206) x 232 also showed good fit, with a probability of 0.30 to Mature Plants Smaller numbers of mature plants were classified in the field after 150 days to determine if the seedling classification would be similar to that of mature plants. This was found to be so. In the mature plants, those glabrous types with some pubescence by the branch tips were observed more closely than in the seedlings. These plants \^7ere then classified as follows: G was completely glabrous; Gl had very few hairs (less than 10) near the tip; and G2 had up to 100 hairs scattered on the branch but still far fewer than a true pubescent type of plant would have. When classified thus, no general trend or


14 modality was obvious. However, when these subcategories of glabrousness were ignored and all these plants were classified simply as glabrous, very distinct ratios were obvious, ]ust as m the seedling data. The F^s were all glabrous, and the F s segregated at 3:1 glabrous to pubescent. The backcrosses to the glabrous parent were all glabrous and the backcrosses to the pubescent parent segregated at 1:1. Chi-square values and probabilities are listed in Table 2-3. Conclusion From the data on both seedlings and mature plants, it appears that there is a simple one gene-two allele system controlling the glabrous/pubescent character, where the glabrous allele, Gl, is completely dominant over the recessive pubescent allele, ^l^. There does appear to be, however, variable expressivity of this character which results in some plants of the glabrous phenotype having a very slight pubescence, but this is so minimal that it does not interfere with plants being classified simply and quickly as pubescent or glabrous. Therefore, from a practical standpoint, this expressivity should not be a problem in using the glabrous/pubescent character as a marker gene in either seedlings or mature plants. From a theoretical standpoint, this characteristic is something to ponder. Although there are some other glabrous aeschynomene accessions, they are uncommon (24). Since they are of such low frequency in the specie, they could be termed mutant. Now it is sometimes said that all or most mutations are recessive, yet
x55 26 28 26:28 27:27 0,074 0.8-0.")
15 . 10 Table 2-3. Mature plant data and chi-squares of glabrous/pubescent stem character in Aeschynomene americana No. No. glabrous pubescent Observed Expected Generation Pedigree plants plants ratio ratio x F]^ 55x no segregation 113:35 111: BCp^ (55x206)x :28 27:27 0, BCp2 ( 55x206 )x no segregation F-. 232x no segregation ^2 232x : : BCp^ ( 232x206 )x no segregation BCp2 (232x206)x : : 'For generations that did not segregate or segregated exactly as expected, no chi-square was calculated.
16 11 here is an example of a dominant mutant, and it is of low frequency. From our observations, the glabrous plant does not seem to be particularly favored by cattle or insects; herbivory seems identical to that on the pubescent plants. Perhaps geographic isolation has kept the glabrous types from becoming more prevalent, but we have no information on this. One could speculate any number of reasons for glabrousness being uncommon, but nevertheless, its peculiarity lies in its being a dominant mutant allele.

17 CHAPTER III INHERITANCE OF PHOTOPERIOD- INDUCED FLOWERING Introduction As already outlined in the general introduction, several aeschynomene accessions appeared to be induced to flower by photoperiod. In aeschynomene, as in so many other crops, the timing of flowering can be crucial to yield. To maximize forage production, flowering must be delayed as long as possible, yet still occur at least five weeks before frost to allow ample seed set. To investigate the genetics of flowering, a study employing four parent lines was conducted from 1983 through 1985, culminating in a field experiment at two locations involving approximately 4000 plants. Literature Review of Photoperiod-Induced Flowering Since there are virtually no genetic studies published on Aeschynomene, there is little work to refer to for this investigation. On the other hand, studies of the flowering response to photoperiod in other papilionaceous legumes are extensive and can indicate the various modes of inheritance of this character, as well as possible methodologies for experimental design and analysis. Examples of photoperiod induced flowering in Pisum, Phaseolus and Vigna are reviewed below. 12
 on the variance (Vr) to test the stability of flowering response of Pisum sativum under what he hypothesized as polygenic control")
18 13 Flowering in Pisum Control of flowering response in Pisum appears to vary from readily identifiable major genes to polygenic systems, depending on the cultivar and environment. Watts et a_l. employed Jinks 's regression of the parent-offspring covariance (Wr) on the variance (Vr) to test the stability of flowering response of Pisum sativum under what he hypothesized as polygenic control (32). He concluded that the genetic system was primarily addil^ive in effect, with dominance insignificant. No major genes were identified. A similar investigation by Snoad and Arthur (26) utilized seven pea cultivars, which were crossed in a diallel and analyzed by various methods as described by Mather and Jinks (14). Conclusions from these analyses were in agreement that dominance was unimportant in the genetic system controlling flowering. For the cultivars studied, this character appeared to be controlled entirely by a simple additive system. Snoad and Arthur performed another experiment of similar design but included primitive and wild Pisum accessions in the diallel (27). Since many cultivars may have been developed from a relatively narrow genetic base, this study's inclusion of wild Pisum afforded an opportunity to investigate flowering response in a wider segment of the genome. And, as might be expected, different genetic mechanisms were observed in this set of data. Early flowering resulted from an accumulation of dominant alleles, in contrast to the conclusion reached in the study of seven cultivars mentioned above. Thus, there

19 14 was strong evidence of more than one qenetic system controlling early flowering in peas. A more complex genetic system was elucidated by I.C. Murfret (16,17,18). His work identified loci, alleles and their interactions. Relationships involving major genes, dominance, additivity, epistasis, and even pleiotrophy were described. Dominance was definitely important in some systems. Significantly, it was emphasized that what had at first appeared to be quantitatively inherited was actually under qualitative genetic control. Choice of appropriate environmental conditions, large enough populations and following a cross for a number of generations made it possible to recognize and identify ma3or gene systems. One may conclude from the extent and number of studies of flowering in Pisum that there are a series of genetic systems influencing expression of this character, ranging from quantitative inheritance to identifiable ma^or genes. Therefore, it would be difficult to describe a general genetic model for flowering in the genus, since the hypothesized models frequently vary according to the lineage of the crosses. These genetic systems may indeed be related, but information at this time does not allow for development of a single model that encompasses all described inheritance. Flowering in Phaseolus Inheritance of flowering response to photoperiod in beans is similar to that of Pisum in that there seems to be a number of systems ranging from simple inheritance to polygenic (31). And, like peas.
. High nighttime temperatures interacted with long photoperiod to greatly delay flowering. Early flowering was found to be determined by a dominant allele in a monogenic system.")
20 . 15 expression of flowering in Phaseolus is sometimes modified by environment By using growth chambers, the effect of temperature on flowering response in Phaseolus vulgaris was investigated by Coyne in Nebraska (4). High nighttime temperatures interacted with long photoperiod to greatly delay flowering. Early flowering was found to be determined by a dominant allele in a monogenic system. In a different set of crosses involving another set of parents, Coyne found expression of flowering response was again affected by temperature. What appeared to be quantitatively controlled at one location showed more obvious modality in a different environment. In the latter, late flowering was found to be controlled by two complementary dominant genes. Such results further illustrate that identification of genetic systems for flowering may be very dependent upon the environmental background of the experiment and that conclusions may hold for only the parents involved in the study, not the whole genome. Flowering in Vigna Interaction of temperature and flowering was evident in mungbean, Vigna radiata, which is classified as a short-day plant (30). In a study at Missouri using growth chambers, this interaction was controlled so that the genetics of flowering could be identified in crosses between various plant introductions. A dominant or partially dominant gene for photosensitivity v\ras observed in growth chambers
, so it is unnecessary to attempt to duplicate that work here.")
21 16 with photoperiods of 14 hours or greater. It was not expressed in the field at Missouri or at 12 hour photoperiods in the growth chamber. Summary A thorough review of the genetics of flowering was presented by Murfret (19), so it is unnecessary to attempt to duplicate that work here. What is of primary interest for our study of aeschynomene is not the specific genetics controlling flowering in other legumes but rather what the trends are. From this brief review of Pisum, Phaseolus, and Vigna we may conclude that with each species there appears to be a number of different genetic systems governing flowering. Generalizations are difficult, and conclusions reached for one set of crosses may not hold true for another, let alone for all members of the species. Although polygenic or quantitative inheritance was invoked as an explanation of some flowering genetics, there were also a number of ma]or gene systems identified. Since environmental variables, particularly temperature, greatly influence expression of the flowering character, a major gene system could be masked as a quantitative character until adequate environmental background or more sensitive methods of analysis are employed. Materials and Methods Four plant introductions of A. americana were selected for use as parents in a series of crosses. These parents were chosen for their collective range of flowering dates at Gainesville, Florida based upon


22 17 previous years' observations (Table 3-1). Parent 197 was a very early (long day) flowering plant with an upright, open growth habit and distinctively small, purplish-blue flowers. T'^o mid-range parents, 55 and 232, were not only similar in flowering date but also in flower color and general growth habit. The fourth parent, P.I. 206 flowered very late at Gainesville and had a procumbent growth habit, glabrous stems and large, yellow-orange flowers. In December 1983, seeds were scarified with sandpaper and germinated in petri dishes containing moistened filter paper. Seedlings were then transplanted into 15 cm diameter, black plastic pots, each filled with a mixture of 50% potting soil and 50% fumigated field soil. Plants were grown in greenhouses, where they were fertilized and watered as needed. Observations were made for uniformity of phenotype within each P. I., based upon various characteristics such as flower color, plant architecture, pubescence and general appearance. A single plant from each accession was then chosen for use as a parent in crossing. All four parent plants were crossed in a half -diallel, creating six crosses (Table 3-2). Artificial pollinations were made by emasculating the female plant in the late afternoon or evening and pollinating these flowers with donor pollen the next morning. As seeds matured at five to six weeks, they were harvested, bagged and labelled. In the winter of , seed for the backcross and F 2 generations were grown. Seeds of the F^ were germinated and planted in the manner described above. At least six or more F plants from each cross were observed for various morphological characteristics to

23 Table 3-1. Aeschynomene accessions used as parents in study of inheritance of photoperiod-induced flowering. PI no. Origin Flowering date at Gainesville based on initial observations Distinguishing characteristics 55 Florida Late September 197 Argentina? Before September 206 Panama November (after frost) Prolific foliage; upright; pubescent stem; pale yellow flower; yellow pollen Very open; upright; sparse foliage; pale green; pubescent; very small purple flower; white pollen Procumbent; glabrous stem; large yellow-orange flower; yellow pol len 232 Brazil Early October Similar to 55 Argentina was our source of germplasm but location of original collection is unknown.
24 19 Table 3-2. Half diallel crossing scheme of aeschynomene parents x197 55x x55 ^^"^ x206"^ 232x x206 + F^ of 197x206 and the reciprocal 206x197 died as seedlings and so were eliminated from the experiment.


25 20 ascertain that they were indeed F^s and not the result of accidental self-pollination. Then a single F^ plant was selected from each cross to be backcrossed to its original parents, which had been maintained through the summer. Cuttings of the parents and F s were grown to provide additional material for crossing. In addition, the F s were allowed to self -pollinate, creating seed for the F generation. Selfpollmated seed was also harvested from each original parent plant for later use in the field. F^ seedlings from the cross between parents with the most extreme flowering dates, 197x206, died for unknown reasons on three separate plantings. Thus this cross was eliminated from the experiment, leaving five crosses for analysis. On May 10, 1985, seeds from the P, P, F, F BC and BC ' PI' P2 generations of each cross were scarified and germinated. Seedlings were transplanted three to four days later into commercial peat pellets. When plants were about six weeks old and roots had protruded well through the peat pellets, they were transplanted into the field at two locations, Gainesville and Ft. Pierce, Florida. Gainesville is at approximately 29 N. latitude and Ft. Pierce is at about 27 N. latitude. The soil at the Gainesville site was a well drained Kendrick fine sand (loamy, siliceous, hyperthermic Arenic Paleudult), which was fertilized preplant with 30 kg ha'""" of P O and 60 kg ha~"^ ^20. Plants were set out in an randomized complete block design with five replications. Each replicate was divided into five equal-sized units, one for each of the five crosses. Within each unit P p f 1' 2' '^l' ^2' ^""Pl' ^'^^ ^^p2 generations were planted in 16 five-plant rows; that IS, each unit contained a family. Each family unit contained one


26 21 row of P^, one row of P^, two rows of F-j^, six rows of F, and three rows of each backcross generation. Plants were spaced 1. 5 m apart within and between the rows and there were 2 m alleys between units. Irrigation was applied as needed and weeds were controlled by hand. An outbreak of Rhizoctonia was noticed in approximately 15% of the field on about August 12. Benlate was applied twice with a backpack sprayer and once as a drench at the rate of 1 kg ha""^. The Ft. Pierce location was approximately 320 km south of Gainesville on Florida's Atlantic coast. The soil there was an Oldsmar fine sand (sandy, siliceous, hyperthermic family of Alfic Arenic Haplaquods ) and very prone to prolonged flood. Two separate but adjacent fields were planted. Two replications of the experiment were established m a field that had been fertilized and used for growing tomatoes three months earlier. The other three replications were planted in a field that had been in bahia ( Paspalum notatum ) grass for several years and had not been fertilized. Because of residual fertilizer in the old tomato field, no fertilizer was applied at the Ft. Pierce location. Layout of plants was a duplicate of that at Gainesville. Every plant was observed for the day of the year on which it first flowered; this date was then converted into hours of daylight for that particular day (7). Separate conversions were done for each location to account for the difference in duration of daylight between the two latitudes. Data that appeared to segregate in distinct classes were analyzed with chi-square goodness-of -f it. Where inheritance appeared quantitative, generation means were analyzed with Mather's scaling
.")

27 . 22 test (13,14). Estimates of broad sense heritability, number of effective factors and components of variance were calculated by Mather and Jinks's partitioning components of variation method (13,14). Powers 's partitioning method was employed to further analyze these data (20,21,22). Details of the methods are in the following discussion Results and Discussion Photoinsensitive Allele After observing the flowering behavior of these parent accessions for two seasons both m the field and in the greenhouse, it became apparent that P.I. 197, initially identified as early flowering, may be uninfluenced by photoperiod, at least under daylength of 14 hours or less. As a six to eight week old plant, this accession was observed to flower in very early July, ]ust after the summer solstice. Plants of the same age grown in the greenhouse flowered in late December, just after the winter solstice. Since these two dates are the maximum and minimum of natural photoperiods, it appears that 197 can flower under any photoperiod after it has reached a certain physiological maturity at about eight weeks of age. Therefore, for the daylength conditions in Florida, this parent may be considered photoperiod insensitive. Analysis of data The various generations of crosses between 197 and the two midrange parents, 55 and 232, were plotted in frequency distributions

28 23 with ten-day intervals constituting a class (Tables 3-3 through 3-8). Days of the year rather than hours of daylight were the data analyzed because of our observation that 197 was not induced to flower by daylength, but rather by age of the plant. It was therefore unnecessary to convert the days of the year to hours of daylight. With the data displayed m such a fashion there appeared to be a definite pattern; this was particularly obvious in the 55 x 197 cross at Gainesville (Table 3-3). The F^ flowered at the same time as did parent 55, an indication of dominance. In the F^ there was a flush of flowering at about the same time as the flowering of the 197 parent, then a break, and then a second, larger flush, the majority of which coincided with the flowering of 55. The backcrosses had the same trend, with the backcross to 197 having two definite modes and the backcross to 55 showing no obvious segregation. Similar, but less distinct, patterns were evident m the other frequency distributions. Based upon these observations, it appeared that a simple major gene system may have influenced flowering in crosses 55 x ~197 and 232 X 197. A single gene model having a completely dominant allele, Pr, for photoperiod responsive, and a recessive allele, pr, for photoperiod insensitivity was tested with a Chi-square goodness-of-f it statistic. Classes in the segregating populations were not always perfectly distinct, so they were separated at day 230. All plants flowering before that date were classified as photoperiod insensitive,, and those after that date as photoperiod responsive, PrPr, or Pr r. That particular day was chosen for separating the classes for

29 24 Table 3-3. Frequency distributions of generations from 55x197 at Gainesville Data are numbers of individual plants observed to flower in a given lo-day period. Days of year Gen P^ (55)


30 25 two reasons: it was the latest date at which 197 flowered, and it was frequently where an obvious modal break occurred. The model was tested for each cross at each location and also for each cross with data from both locations pooled. The pooled tests were run with the idea that larger populations may provide a better sample, and that a primarily Mendelian character should manifest itself the same in two environments that are not greatly dissimilar. Noting that the generation means of the crosses were very similar at both locations, pooling seemed reasonable. VJhen generation means were plotted at each location there was some evidence of genotype by environment interaction (G x E), particularly in the crosses involving 197 (Figures 3-1 through 3-3 and Table 3-9) (12). Even though some means indicated the presence of G x E, conclusions drawn from the pooled data were in agreement with those drawn from individual location data. Thus the G x E was not so great in these two environments that it prevented consistent conclusions from the pooled data. Most chi-square probabilities for the expected 3:1 PR :pr prof the F^ generation ranged from.20 to.50 (Table 3-10) (6). The single exception was the 55 x 197 F^ which had a probability of.05 to.02 when data from both locations were pooled. This is not particularly disconcerting since all of the other 15 segregating generations tested fit the model well. A possible reason for lack of fit may be the arbitrary division of these distributions into ten day classes. It is conceivable that a few r r plants could have been classified as Pr if they were recorded as flowering on day 231


31 _ _ 13.0_ _
32 x > CO T3 55x197 o x x ^ Gainesville h Ft. Pierce Figure 3-2. F means at Gainesville and Ft. Pierce.


33 _ > CO

34 Table 3-4. Frequency distributions of generations from 55x197 at Ft. Pierce. Data are numbers of plants observed to flower in a given 10-day period Days of year Gen n X ^1 (55) ^2 (1^^^ ^ ^ BCp^ BCp
35 30 Table 3-5. Frequency distribution of generations from 232 x 197 at Gainesville. Data are numbers of plants observed to flower in a given 10-day period. Days of year Gen P^ (197) ^2 '232) ^ ^ ^^pl ^Cp
36 31 Table 3-6. Frequency distribution of generations from 232 x 197 at Ft. Pierce. Data are numbers of plants observed to flower in a given 10-day period. Days of year Gen n X P-L (197)
 7 43 48 47 1 2 1 149 255.54 94.60 P2 (197) 39 25 33 3 100 206.82 53.20 P-^ 7 31 45 2 85 261.31 36.")
37 32 Table 3-7. Frequency distributions of generations from 55 x 197, data from locations combined. Days of year Gen n X a^ P-[_ (55) P2 (197) P-^ ^ BC BC
 39 25 33 3 100 206.82 53.20 ^2 (232) 13 27 53 38 11 3 4 149 257.48 155,87 F^ 2 8 40 41 6 97 260.10 53.")
38 33 Table 3-8. Frequency distribution of generations from 232 x 197 with location data combined. Days of year Gen n X Cf^ P^ (197) ^2 (232) ,87 F^ F^ BC ' BC p2

. Gainesville Ft. Pierce Generation Mean Std.")
39 34 Table 3-9. Generation means in hours of daylight at Gainesville and Ft. Pierce, and test for genotype by environment interaction (G X E). Gainesville Ft. Pierce Generation Mean Std. error Mean Std. error G x E hours of daylight Parent


40 35 Table Summary of chi-squares of segregating generations from crosses 55x197 and 232x197.

41 36 rather than on 230. Four plants were, in fact, recorded on day 231, and if they had been recorded on day 230, the data would have fit the expected 3:1 at P>.05. Backcrosses also fit the model well, with no segregation in the backcrosses to the dominant 55 or 232 parents and a 1:1 segregation in backcrosses to the recessive 197 parent. Means of the non-segregating backcrosses were similar to those of the dominant parent and F. Probabilities of Chi-squares ranged from about.10 to.50, indicating a good fit between the data and the genetic model. Although there is substantial evidence to support the contention that a major gene system is involved in controlling flowering in these crosses, it is apparent that other genetic or environmental factors may also influence this behavior. The fact that there was a relatively large range of flowering dates in the parental and F generations indicated that environment could be involved. There is ample evidence that environment, particularly temperature, affects flowering in several legumes (4,10,19), although one would not expect great variation in temperature over a one hectare field. Environmental variability due to flooding, disease, rabbit herbivory, and fertility was observed. Part of the spread in 197 may also be due to disuniform germination, resulting in staggered maturation. Conclusion A single locus with a completely dominant and a completely recessive allele appeared to be controlling photoperiod response in these three aeschynomene lines, but there are probably other


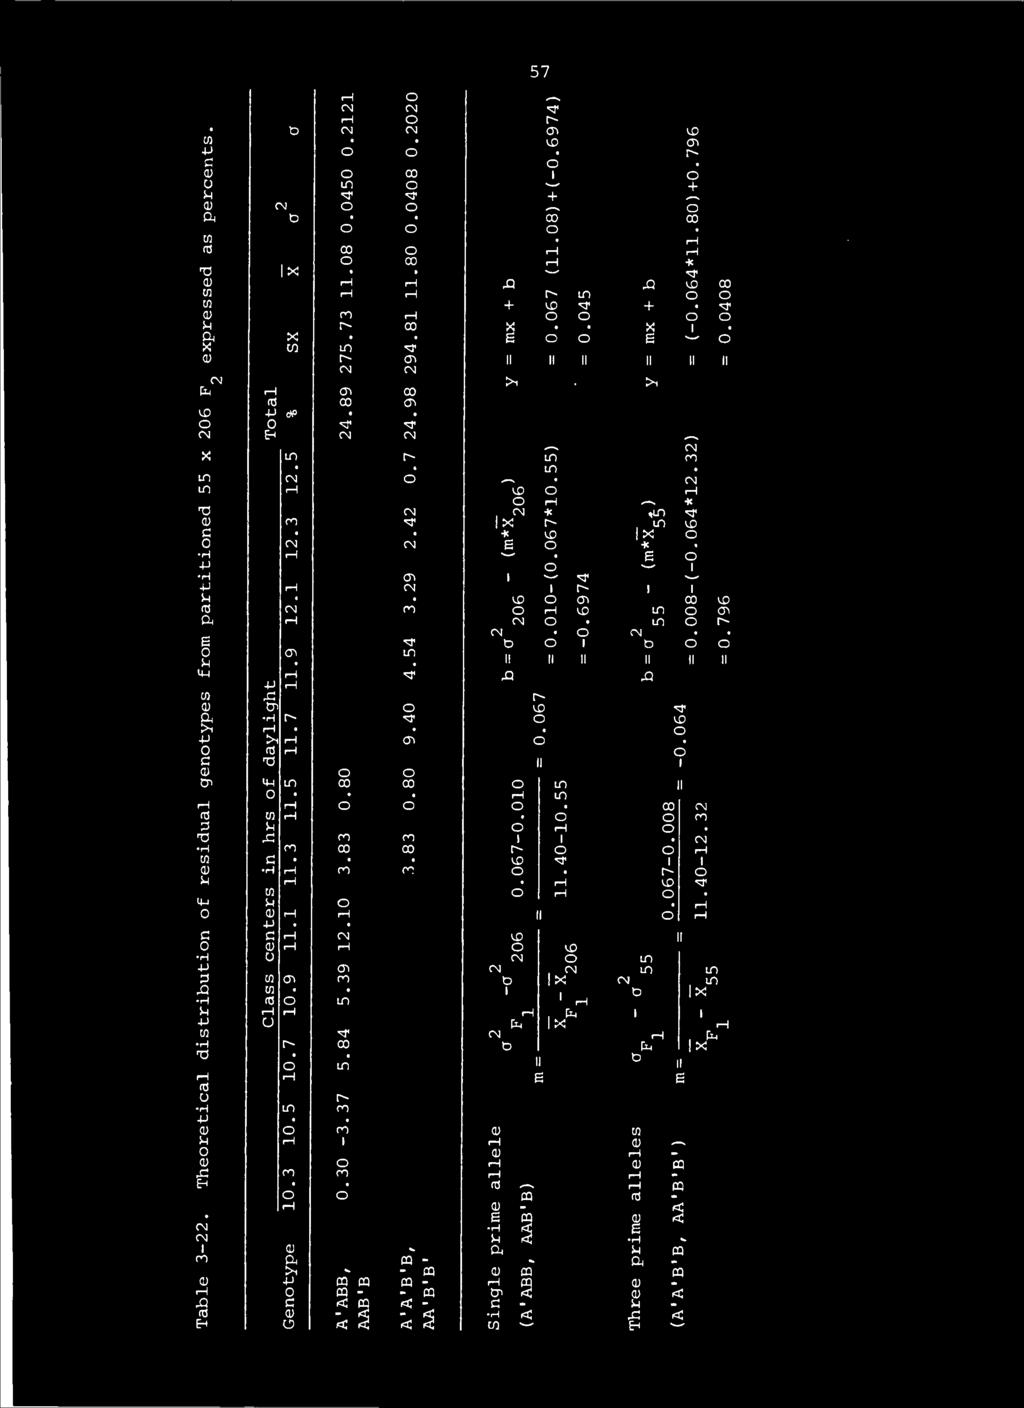
42 37 environmental and genetic factors influencing this character as well. Different genetic and environmental backgrounds may alter the expression of this gene, as indicated by the G x E observed. Analysis of Crosses 55 x 206 and 232 x 206 Preliminary analyses Parents of cross 232 x 55 were too similar in their flowering behavior to provide the variability necessary for genetic evaluation. Therefore this cross was not analyzed and will not be discussed further, When data from the crosses. 55 x 206 and 232 x 206 were displayed in frequency distributions, no obvious modality was observed in the segregating populations, indicating the possibility of quantitative inheritance. Refer to table 3-11 for an example; all other frequency distributions are in Appendix A. The generation means showed a trend for additive gene effects. That is, if genes for a character are primarily additive in effect, the mean of the F should be approximately equal to the average of the means of the two parents. The F^ mean should be equal to the F mean and the backcross means should be equal to the average of the mean of the respective parent and F^ (22). When these theoretical means were calculated, they were indeed very similar to the means observed (Tables 3-12, 3-13). From this it could be concluded that one of two possible modes of inheritance was affecting flowering date. The genetics of this character could be quantitative, with a series of minor genes which together have additive effects. This hypothesis of quantitative inheritance would be supported by the lack of obvious modality in the

43 >1 38

44 39 Table Comparison of F and F means with calculated average of parent means. Cross Location F f Avg. of parent means 55 X 206 hrs of daylight
 BC (F,+P) BC (F,+P) 2^- 2^1- hrs of daylight (55x206)x55 11.95 11.86 11.85 11.96 11.90 11.91 (55x206)x206 10.92 10.98 11.22 11.13 11.07 11.05 (232x206)x206 11.")
45 40 Table Backcross means compared to average of F mean plus parent Location Gainesville Ft. Pierce Loc. combined Cross BC (F +P) BC (F,+P) BC (F,+P) 2^- 2^1- hrs of daylight (55x206)x (55x206)x (232x206)x (232x206)x232)
.")

46 41 segregating populations. The alternative hypothesis is one of simpler inheritance, where major gene action is additive and gene numbers are very few. Scaling Test. To further test these ideas, the data were subjected to Mather's scaling test (13,14,28,29). The basis of this test IS similar to the ideas just discussed, that the mean of the backcross is equal to the average of the parent and F means, or BC = 1/2(P+F^). Likewise, the same basis allows for a similar calculation for the F^ mean. Formulas are given in Table If the means perform as predicted m the equation, then their effect is additive on the average, i.e., the additive-dominance model is adequate. It should be emphasized that this does not necessarily mean solely additive gene action; m fact, there will be additive average effects if there is dominance or linkage. Failure of this test implies either that epistasis is a factor and an alternative model is required, or that an alternative scale must be sought to fit the data to the additive-dominance model. Results of the scaling test were not consistent. At Gainesville, both 55 X 206 and 232 x 206 gave insignificant values for A, B, and C, indicating that the additive-dominance model was appropriate (Tables 3-15, 3-16). However, the Ft. Pierce data yielded three significant t tests, an indication of epistasis or that the scale was not adequate for the model. When the data from both locations were combined, again two tests showed a significant deviation from zero, both in the 232 x 206 cross. But these did so only by a very slight margin and, in fact, are not significant at the.01 probability level. If this were


47 " 42 Table Formulas for Mather's scaling test (26, 21). BC is the symbol for backcross generations. Subscripts on on BC^ and BC2 refer to the parent backcrossed to. P stands for parent. BC = 1/2 P + 1/2 F F^ = 1/4 (P^+P2+2F^) = 1/2 BC^ + 1/2 BC^ A = 2 BC^ - P^ - F^ B = 2 BC^ - p - F C=2F^-2F -P -P 2 ^1 "^^1 ""l V = 4 V + V + V A BCl PI Fl V = 4 V + V + V B BC2 P2 Fl V = 16 V + 4 V + V + V C F2 Fl PI P2 + It should be noted that in the reference this formula contains the typographical error "4. V ^ F2

48 43 Table Mather's scaling test applied to data of cross 55 x 206 to test adequacy of additive-dominance model. Gainesville Ft. Pierce loc. combined ^A =

49 44 Table Mather's scaling test applied to data of 232 x 206 cross to test adequacy of additive-dominance model. Gainesville Ft. Pierce loc. combined A = A = A = B = B = B = C = C = C = V^ = Vg = Vg = Vg = V = V = V = '- c c ^A

.")
50 45 acceptable, the scaling tests would prove the model adequate for both crosses at Gainesville and for both crosses when the data from both locations were combined. The Ft. Pierce data do show significant deviations from zero for B and C of 55 x 206. Since there was good indication that the gene effects are additive in the other data sets, it IS likely that the significance of these tests is due to scaling rather than some mterallelic interaction. Partitioning of Components of Variation. Further testing of the data was done using Mather's and Jinks 's methods of partitioning components of variation (3,14,28,29). By manipulation of the means and variances of the various generations, it was possible to estimate the genetic and environmental components that make up those variances. Formulas are given in Table As the results m Table 3-18 demonstrate, the environmental variance for both crosses was relatively low, meaning that the majority of the total variation was genetic. The dominance component of the genetic variation was negligible, being zero m four of the calculations. Thus most of the genetic variance was additive. Again, additive variance does not necessarily imply additive gene action. But since the genotypic variance was nearly all additive, that is, there was little or no dominance, then we may conclude that genes showed neither dominance nor epistasis (5). Therefore, if there was no or very little dominance or epistasis, then we may also conclude that the gene action was additive.
51 46 Table Formulae for Mather's and Jinks 's partitioning components of variation (21). Environmental variance (V + v + V 1 PI ^P2 Vl^ E = Dominance variance H=4(V +v -F - p BCl BC2 2 Additive variance D = 2(V - 1/4 h - E) F2 Genetic variability (D + H) (broad sense heritability V = (D + H + E) ' Number effective factors (loci) (P - p ) ^1 = 4D

52 47 Table Values for components of variance of crosses 55 x 206 and 232 x 206 using Mather's and Jinks 's partitioning method. Cross Location E 55x206 Gainesville x206 Ft, Pierce x206 Loc. combined x206 Gainesville x206 Ft. Pierce x206 Loc. combined Refer to Table 3-17 for definitions of E, H, and D.


53 48 Estimates of the number of effective factors, which may be interpreted as the number of loci, were also calculated (Table 3-18). Although there were two high estimates for 55 x 206, most numbers ranged between two and three. If these estimates were at all accurate, then it appears that flowering in aeschynomene may be controlled by a few major genes. Summary of preliminary tests on data. The results of the tests ]ust discussed showed a definite trend. The means showed additivity both in simple observation and in Mather's scaling test. This additivity was further defined as additive gene action by partitioning the components of variance. And finally, an estimate of the number of effective factors indicated the possibility of a few major genes being responsible for most of the control of this character. All of this evidence leads to a reasonable argument that a major gene model with additive gene action should be tested on the data. Powers 's partitioning method of analysis applied to data With reasonably strong evidence suggesting that inheritance of flowering response was controlled by a few genes, the data were tested for fit to a two gene model, each locus with two alleles which act additively and with equal effect. Since no obvious modality was observed in the segregating generations' frequency distributions. Powers 's partitioning technique was employed to analyze the data. This method of analysis is based on the premise that if the homogeneous populations (parents, F^ ) are normally distributed, the effect of environment is normally distributed, since there is no

![In other words, a few ma]or genes are primarily responsible for control of the character.](/docs-images/94/121355209/images/54-2.jpg "In contrast, quantitative inheritance would have many genes, each with minor effects, and the resulting distributions would be expected to be normal (11,20,22). Tests for Normality.")
54 49 genetic variability. Lack of normality in the distributions of segregating populations, then, is due to the genetic makeup of the population. Powers envisions populations so distributed as being composed of various genotypes, each of which has its own normal distribution around its own mean. In other words, a few ma]or genes are primarily responsible for control of the character. In contrast, quantitative inheritance would have many genes, each with minor effects, and the resulting distributions would be expected to be normal (11,20,22). Tests for Normality. The first step in Powers' analysis then is to test for normality in all generations. This is done by creating a theoretical normal distribution from the normal probability table based upon the frequency distributions of the observed data (6). The two distributions are then tested with a chi-square goodness-of -f it statistic. Again, parental and F^ generations are expected to be normally distributed if they are homogeneous. If major genes are controlling the character under study, the F and backcross generations should not be normally distributed. F-^ and parent generations. Results of the tests for normality are in Table An example of a distribution tested is in Table 3-19; others can be found in Appendix B. In general, the parental and F^ generations were distributed as expected. Most flowered fairly uniformly, that is, within the range of only a few classes. Following the example of Powers and others, classes with a few outlying plants were combined to get at least ten plants per class (11,20,22,25). Because of the uniformity of flowering and the low number of classes.


55 (^ 50

56 Table Chi-squares of goodness-of -f it test for normality of parent, F-,, F, and backcross generations of crosses 55 x 206 and 232 X


57 52 degrees of freedom were frequently too few to test the distributions with a chi-square. Thus it may be assumed that since there was a narrow range, the plants in those generations were homogeneous and that any variation was due to environment. In the three parental populations that could be statistically evaluated, one population of 55 had a probability of less than 0.001, indicating a distribution that was not normal. Parent 232 also had one population that had a probability of 0.05 to 0.02, indicating another poor fit. However, the uniformity evidenced m the other parental populations leads me to believe that these deviations from expected behavior were probably due to environmental effects not being normally distributed rather than heterozygosity of the parent genotypes. These two exceptions notwithstanding, evidence clearly demonstrated that the environment was normally distributed. Segregating generations. For the most part the segregating generations were not normally distributed. All of the F tests had high chi-square values, with probabilities of less than 0.001, but backcrosses were not as consistent in their distribution (Table 3-20). Although most did have high Chi-square values which indicated a lack of normality, there were three backcrosses that had normal distributions. Since the majority were not normal, these may be ignored and further testing of the hypothesis continued. It may be appropriate at this point to at least question and discuss the assumptions of normality as they apply to this method. Just because a segregating population does or does not fit the normal distribution as it is expected to, must further testing be abandoned?


58 53 I think not, partly because of some examples which come to mind. First of all, if a character were controlled by an additive gene system at any number of loci, it seems that the distribution could be normal, rather than abnormal, if alleles had equal absolute effects and broad sense heritability were low (Figure 3-4) (2). For example, a 1:2:1 or 1:4:6:4:1 F^ segregation could be normally distributed, even when that distribution itself is composed of other normal distributions. Therefore it seems that, in some situations where major genes were suspected, one could accept a normal curve in the F 2 distribution and still be justified to test it. However, since the aeschynomene data sets show little environmental variance and high broad sense heritability, a multi-modal distribution could be expected. To restate the argument, the point of this example is that distributions of a data set should be interpreted only as an indicator of the type of inheritance. I believe that Powers is often read as stating that homogeneous populations must always be normally distributed and segregating populations must be not normal. But broad sense heritability (i.e., amount of environmental variance) and type of gene action greatly influence the distributions of segregating populations, as illustrated in Figure 3-4. So those distributions which do not conform to these generalities about normality should not necessarily be considered inappropriate for partitioning. Indeed, if major genes are suspected, partitioning may be recommended even if some tests for normality in segregating populations do not perform as predicted. With the aeschnomene flowering data, we hypothesized an
")

59 54 No Dominance HERITABiLITY Dominance Figure 3-4. Theoretical distributions in F. The model postulates monogenic inheritance, and that the effect of environment varies from nil (100 per cent heritability) to the point where environmental effects account for three fourths of the total variability (25 per cent heritability) The left column depicts no dominance; the right column, full dominance. Source: Allard, R.W Principles of plant breeding. John Wiley and Sons, Inc., New York.

60 55 additive major gene system with relatively high heritability, so the segregating populations should be abnormally distributed for the most part. However, occasional departures from what is expected may occur due to experimental error. In data sets which demonstrate a clear lack of normality in the homogeneous populations, other iterative methods can be employed (21). Partitioning of the F ^ 2 Method. With the hypothesized two locus, additive model, the F should segregate into ratios of 1:4:6:4:1. Following Powers 's detailed procedure and Sage and Isturiz's example of its application to an additive system, the F^ ' s of 55 x 206 and 232 x 206 were partitioned into component genotypes (11,21,25). Details of the method can be found in the references, but a general outline of procedure will be presented here. Refer to Tables 3-21 through 3-24 of the 55 X 206 cross at Gainesville as the method is described. Frequency distributions were created for P, P, F, and F generations (Table 3-11) and then converted to percents (Table 3-21). For example, the ratio 1:4:6:4:1 converted to percents as 6.25:25:37.5:25:6.25. The parental phenotypes therefore should each have made up 6.25 percent of the F^ population. In this model parent 206 was designated as genotype AABB and parents 55 and 232 as A'A'B'B'. The F^, then, was of the A ' AB ' B (two prime) genotype. Since alleles are assumed to have equal effect, all other two prime genotypes (A'A'BB, AAB B ' ' ) also had the F phenotype. Therefore the F- ^ phenotype made up 37.5 percent of the F When this 37.5 percent and the two parental 6.25 percents were subtracted from the F a 50

61 56 ^ -H

62 a, 57
 0) ih")
63 58 En CM ^ 3 C A O H a - E H 0) 0) ih
' 10.3 li 0.82' 0.63 10.5 4' 6. 78 9.55, 0.")

64 I 59 Table Chi-square contingency table of 55 x 206 at Gainesville. Class center in hrs daylight Observed Expected Theoretical (0-E)' 10.3 li 0.82' ' , , ] , ' /2 X^ = X^ = df = 5 P = 0.70 to 0.50


65 60 percent residual made up of the A'ABB, AAB'B (single prime) and A'A'B'B, AA'B'B' (triple prime) genotypes remained. Single prime and triple prime genotypes each made up 25 percent of the F To obtain actual values for the residual distribution, parent F 1 and F^ distributions were converted to percents withm each class or cell of the distribution. For example, the distribution of the 206 parent was converted to percents so that the sum of all cells of the distribution equaled The same was done for the other generations. Then the F^ and parent distributions were subtracted from the F^, leaving a residual distribution that had percents in each cell, which m total equaled 50. The residual distribution was then partitioned into its two component distributions, one for single prime genotypes A'ABB, AAB'B and one for triple prime genotypes A'A'B'B, AA'B'B' (Table 3-22). The assumption was that those entries falling on one side of the F mean were of the single prime genotypes and those on the other side had triple prime genotypes. Since the classes were arbitrary, tails of the two distributions could fall into the same cells. Hence the values in the two cells on either side of the F mean were divided equally between the two distributions. Next means and variances were calculated for these theoretical distributions using the formula y = mx + b. The resulting parameters were necessary to construct theoretical normal curves for both the single prime and triple prime genotypes. To do so, means were subtracted from the higher value of each cell and divided by the standard deviation, i.e., the usual procedures for building normal
 (Table 3-23).")
66 61 curves from means and variances. These values were then looked up in a normal probability table and the percentages entered into a theoretical distribution containing all possible genotypes (6) (Table 3-23). Note that in this table frequencies for each cell of the parent and F^ distributions were converted to percentages. Finally a theoretical F^ was created by multiplying the individual cell frequencies of each genotype by the genotype's theoretical percentage. For example, if cell 10.8 had a frequency of percent for the parent 206 genotype, AABB, then was multiplied times 6.25 percent, the theoretical percent of the F made up of the 206 genotype. The same procedure was repeated for each distribution with an entry m the 10.8 cell. These values were then summed and entered as the percent of the theoretical F that fell into that particular cell. Theoretical F distributions so constructed were then tested for homogeneity against the observed F using a Chi-square statistic. A contingency table was built by dividing the total number of F observations by 100 and multiplying this number by the percent in each class of the theoretical F (Table 3-24). These calculations gave a theoretical number of plants for each class. A subtotal of the observed plus theoretical values for each class was calculated and divided by two, producing the expected value for each class to be tested against the observed. As in the test for normality, outlying individuals in the tails were pooled until the last cell contained at least ten plants.


67 62 Degrees of freedom m contingency tables are calculated as (rows- 1) (columns-1 ). But since means were calculated for the two theoretical distributions of A'ABB, AABB' and A'A'B'B, AA'B'B',- two more degrees of freedom were lost. So the final degrees of freedom was equivalent to n-3 where n equaled the number of classes. Both the observed and the theoretical values had to be tested against the expected. Since the expected values were half way between the observed and theoretical, testing the observed against the expected and multiplying the resulting chi -square by two gave the same result as separately testing both the observed and theoretical separately. It is not clear to me why Powers chose to test the data with a Chi-square test for homogeneity rather than a goodness-of -f it test. In building and testing the contingency table, the expected is halfway between the observed and theoretical values, which, of course, favors a good fit. While the procedure is correct, the appropriateness of its application to this type of data has not been justified in the references that I have followed or criticized in discussion of the method (8). So, even though I do question the method, I have employed it exactly as described by the authors. Results of F ^. Chi-square probabilities listed in Table 3-25 demonstrated that the genetic model fits the data fairly well. Contingency tables and calculations are m Appendix C. All probabilities were 0.05 or greater except for 232 x 206 at Gainesville. When the tails of the distribution were combined to give ten or more plants per cell, the calculated Chi-square of this cross

68 . 63 had a probability of <0.01. The lack of fit cannot be attributed to inadequate scale because the data for 232 x 206 at Gainesville tested satisfactorily m Mather's scaling test (Table 3-16). Epistasis can also be ruled out if we accept the scaling test conclusion that the additive-dominance model was adequate. The data also were distributed as expected m tests for normality. We might then conclude that the flowering dates for this cross at Gainesville were slightly more affected by errors in taking data or environment, and thus did not have the background to fully reveal the genetically controlled behavior The relatively high probabilities of the other five data sets were strong evidence that flowering response to photoperiod in crosses 55 X 206 and 232 x 206 was primarily under the genetic control of two loci, each with two alleles with additive gene action. It should be emphasized that these two ma^or loci appear to be a predominant genetic feature but by no means the sole factor affecting induction of flowering. To further test the model analysis was done on backcross data. Partitioning the Backcrosses Method. The general procedure for the backcross analysis was the same as that of the F^. Again the hypothesized genetic model was that 206 was of genotype AABB, 55 and 232 were A'A'B'B', and that each of the four alleles had equal absolute effect with additive gene action. Using Tables 3-26 and 3-27 of the (232 x 206) x 206 backcross at Gainesville as an example, one can see that plants were expected to segregate phenotypically m a 1:2:1 or 25:50:25 percent ratio. In
. In the backcross to the 232 parent, ratios were identical but the genotypes were 25 percent A'A'B'B'; 25 percent A'AB'B; and 50 percent triple prime A'A'B'B or AA'B'B'.")

69 64 other words 25 percent should be of the 206 parental genotype AABB; 25 percent should be of the F^ AA'BB' genotype; and 50 percent should have single prime genotypes A ' ABB or AAB ' B (Table 3-26). In the backcross to the 232 parent, ratios were identical but the genotypes were 25 percent A'A'B'B'; 25 percent A'AB'B; and 50 percent triple prime A'A'B'B or AA'B'B'. Since the 50 percent group was theoretically unlike either the parent or F in genotype, it made up the residual frequency distribution, which was then used in creating the theoretical backcross distribution. Testing of the observed backcross frequencies against the theoretical was done the same as in testing the F. The one difference was that since only one set of parameters was calculated for each backcross, degrees of freedom were equivalent to n-2. Again tails were combined until they had data from at least ten plants (Table 3-28). Results of backcrosses. At first glance the backcross data did not support the proposed hypothesis quite as definitively as did the F^. As can be seen m the summary of backcross Chi-squares in Table 3-29, there were six tests that fit the genetic model. These results lend strong support to the conclusion reached after analysis of the F that the gene model was adequate. However, there were also six backcrosses with P = <0.01, indicating lack of homogenity. Two main reasons may be suggested as causes of poor fit between the observed and theoretical data in those six backcrosses. One is cell size which is compounded by environmental effects. Although there appears to be a major gene system at work, there are also other

70 65 Table Chi-squares of test for homogeneity between F data and theoretical distributions. Cross Probability 0.70 to to to < to to 0.10

71 66

72 (0 67
 x 206 at Gainesville Class center in hrs daylight")

73 . ( 68 Table Chi-square contingency table for (232 x 206) x 206 at Gainesville Class center in hrs daylight Observed Expected Theoretical (0-e: \ ' ; 12.42] 1C.83J 11.7 o) 1.06; 2.13) /2 X = X = df = to 0.05
![69 factors, probably both genetic and environmental, which blur the effects of the ma]or genes.](/docs-images/94/121355209/images/74-2.jpg "That environment can affect expression of ma^or genes controlling photoperiod induced flowering is well established (3,10,17,19).")
74 69 factors, probably both genetic and environmental, which blur the effects of the ma]or genes. That environment can affect expression of ma^or genes controlling photoperiod induced flowering is well established (3,10,17,19). it is conceivable then that plants with similar but different genotypes such as A'AB'B and A'ABB may occasionally be classed as the same phenotype (that is, they may fall into the same cell) if some other factor has blurred the distinction between the two. Distributions could have been influenced by environmental conditions such as Rhizoctonia, herbivory by rabbits, flooding, and soil fertility, which were observed in localized areas of the experiment. Larger populations or more and smaller cells in the frequency distribution may facilitate partitioning and minimize the effect of these factors. A second suggestion as to the cause of poor fit in these six backcrosses is that the total range of the parents is too narrow. Backcrosses by definition are narrower in range than the F and contain fewer genotypes. All genotypes lie between the F and the parent. For example, possible genotypes in (55x206)x206 are AABB, A'AB'B, and A'ABB or AAB'B. The latter genotypes, A'ABB and AAB'B, differ from the parent and F^ by only one allele. If the effect of each allele is slight, the effects of environment or minor genes may blur the distinction between phenotypes. If two parents represented the two extremes of the character under study, the effects of these alleles would be greater and classifications would be easier. But these aeschynomene accessions used as parents represented perhaps less
 (55x206)x55 Ft. Pierce 3.12 0.70 to 0.50 (55x206)x55 Loc. combined 24.89 (7.73) <0.01 (0.10) (55x206)x206 Gainesville 0.93 0.50 to 0.30 (55x206)x206 Ft. Pierce 0.57 0.50 to 0.30 ( 55x206 )x206 Loc.")
75 70 Table Chi-squares from test of homogeneity between backcross data and theoretical distributions. Cross Location Chi-square Probability (55x206)x55 Gainesville (1.20) <0.01 (0.70 to 0.50) (55x206)x55 Ft. Pierce to 0.50 (55x206)x55 Loc. combined (7.73) <0.01 (0.10) (55x206)x206 Gainesville to 0.30 (55x206)x206 Ft. Pierce to 0.30 ( 55x206 )x206 Loc. combined to 0.20 (232x206 )x206 Gainesville to 0.05 (232x206)x206 Ft. Pierce <0.01 ( 232x206 )x206) Loc. combined to 0.30 (232x206)x232 Gainesville (2.58) <0.01 (0.20 to 0.10) (232x206)x232 Ft. Pierce (12.46) <0.01 (0.05 to 0.01) (232x206)x232 Loc. combined (4.41) <0.01 (0.20 to 0.10) Note: Chi-squares and probabilities in parentheses are calculated by combining two adjacent cells to account for environmental error. See text for discussion.

76 71 than half the observed range of initiation of flowering. Greater variation would facilitate a more conclusive backcross analysis. Some examples taken from Tables 3-30 through 3-33 can be used to illustrate how environmental factors may have resulted in some backcrosses failing the homogeneity test. It is interesting to note that in four of the six backcross distributions that did not fit the model, very low observed values were in cells with class center 11.9, and higher than expected values were observed for cells with class center The low values in 11.9 resulted in high Chi-squares for those cells and the subsequent failure of the observed distribution to fit the theoretical. But if values in cells 11.9 and 11.7 were combined, Chi-squares were greatly reduced and, in fact, three of those four distributions would statistically fit the theoretical (see values in parentheses Table 3-29). Only (232 x 206)x232 at Ft. Pierce did not and then ]ust barely with a P = 0.05 to It is conceivable that some environmental factor occurring at the daylength period around 11.9 hours delayed flowering in several plants so that they fell into the 11.7 cell. These daylengths occurred during the first fifteen days of October, a time of year known to have erratic and variable weather. Of course, weather conditions would be equal over the general area of a one hectare field, and not so localized as to affect one area differently than another. But weather conditions interacting with minor genes of some segregants or compounding other environmental factors such as flooding could quite possibly affect the physiology of flowering, causing a delay. Therefore the combining of
 x 232, data")
' 10,9")
77 72 Table Chi-square contingency table for (232 x 206) x 232, data from locations combined. Class center in hrs daylight Observed Expected (O-E)' 10, ] 0) 12' j o\ 1

78 . 73 Table Chi-square contingency table for (232 x 206) x 232 at Gainesville Class center (0-E) in hrs daylight Observed Expected Theoretical E ' ^ -^^^^ + ^ O.U Combined classes: 1/2 X = X^ = df = 3 P = h Combined classes 11.7 and 11.9: 1/2 X = X = df = 2 P = 0.20 to 0.10
 5.25> 0.0238 12.9 0' l.oo' 2.00' 9.")
79 74 Table Chi-square contingency table for (232 x 206) x 232 at Ft. Pierce. Class center (0-E)^ in hrs daylight Observed Expected Theoretical i ^^-^2^ '^ > i > 5.13) 5.25> ' l.oo' 2.00' Combined classes: 1/2 X^ = X^ = df = 5 P = <0.01 h Combined classes 11.7 and 11.9: 1/2 X = X = df = 4 P = 0.05 to 0,01
 10.5 0.66 10.7 10.9 0.66 ^ 0.1283 11.1 11.3 1.33 11.")

80 75 Table Chi-square contingency table for (55 x 206) x 55 at Gainesville. Class center in hrs daylight Observed Expected Theoretical (0-E) ^ i 10.6 J , 11.9 i '(0.2143) , J Combined classes: 1/2 X = X = df = 3 P = 0.01 to Combined classes 11.7 and 11.9: 1/2 X = X = df = to 0.50
x55 data in Table 3-34 for cells 11.3 and 11.5. Pooling these two classes results in a Chi-square probability of 0.10.")
81 76 two adjacent cells may be justified in order to overcome this environmentally caused error. If this proposition is acceptable it could also be applied to (55 X 206)x55 data in Table 3-34 for cells 11.3 and Pooling these two classes results in a Chi-square probability of Since cells 11.3 and 11.5 occurred about October 16 through October 25, it is quite possible this backcross was affected by environment in a manner similar to that described above. Accounting for this source of error then would result in eleven of the twelve backcross populations supporting the model. Attempts to explain the poor fit of some of the backcrosses should not be construed as an attempt to make the data conform to a preconceived idea. There is considerable evidence from the F and other backcrosses that the model is plausible. It is imperative, then, to look for possible reasons why certain segregating populations behaved differently than expected. Acknowledging some of the possible sources of error described above, it can be concluded that, as a whole, the backcross data support the hypothesized genetic model. Summary. Initial observations of the generation means of crosses 55 X 206 and 232 x 206 indicated that genes controlling photoperiod induced flowering were additive m effect. Testing the data with Mather's scaling test supported this contention; most tests showed the additive-dominance model was adequate. Further testing revealed little or no dominance variance and suggested that the number of effective factors was two or three. Hence it seemed reasonable to propose that inheritance of flowering in these crosses might be
' 10.3 10.5 10.7 3.24E 10.9 11.1 11.3 11.")

82 77 Table Chi-square contingency table for (55 x 206) x 55 data from locations combined. Class center m hrs daylight Observed Expected Theoretical (0-E)' E (0.0166) Combined classes; 1/2 X = With 11.5 combined: 1/2 x^ = X = df = 5 P = <0.01 X = df = 4 P = 0.10

83 78 controlled at two loci, each with two alleles and all alleles acting additively with equal absolute effect. The late flowering parent 206 was designated AABB. Parents 55 and 232, which both flowered in late mid-season, were designated A'A'B'B', Since segregating generations showed no obvious modality. Powers 's partitioning method was used to test the genetic model F 2 data sets fit the model well in five of the six analyses performed. Chi-square probabilities were generally in the 0.20 to 0.30 range. Backcrosses also supported the model in half of the data sets analyzed. Since most evidence fit the model, it was suspected that the six backcrosses that did not fit were affected by minor genetic or environmental effects, small populations, flowering dates of the parents being too similar, and the arbitrary nature of the frequency distribution cells. Minor manipulation of the data resulted in eleven of twelve backcrosses tested fitting the model. Despite the fact that some analyses did not support the hypothesis, the majority of the evidence demonstrates that flowering in these two crosses is controlled primarily by an additive genetic system with two loci, each with two alleles of equal effect.

84 CHAPTER IV CONCLUSION In this study the genetics controlling stem pubescence and photoperiod-induced flowering were examined. The interest in stem pubescence lies in its potential use as a marker gene which is detectable in seedlings. Evidence from crosses between one glabrous and two pubescent parents showed that this trait is governed by two alleles at one locus. Glabrousness, Gl _, is dominant over pubescence, al gl. Vj'ith such simple inheritance and easily classified phenotypes, the glabrous trait can be readily incorporated into other genetic backgrounds and employed in further genetic studies. The genetics of the effect of photoperiod on flowering induction appeared to involve two separate genetic systems. At one level was the responsiveness (or lack of it) to photoperiod. The F generations from crosses between two photoperiod responsive genotypes and a photoperiod insensitive genotype segregated in a 3:1 ratio of photoperiod responsive to insensitive, indicating complete dominance at one locus. The backcross data confirmed this. Thus, responsiveness to photoperiod appeared to be controlled by a dominant allele Pr and the lack of photoperiod response was conditioned by the homozygous recessive r r genotype. Although there was clearly a ma^or gene system involved in expression of this trait, the breadth of each class in the segregating generation indicated that other minor genetic factors or environment may also affect flowering. 79


85 . At the second level was the genetics controlling those genotypes that were photoperiod responsive. Means and variances of segregating generations from crosses between mid-range and late flowering parents indicated additive gene action. Further analysis demonstrated that two loci, each with two alleles, controlled the initiation of flowering as induced by duration of daylight. Although there was no clear division of classes, due in part to the limited range of the parents involved, partitioning analysis indicated that the data fit an additive gene model and that all four alleles had equal effect. Even though there appeared to be a major, genetic system, minor genes and environment surely modify its expression. It should be emphasized that the conclusions reached in this study are only for the accessions involved. While the identified genetics apply to other aeschynomene lines, by no means is it implied that inheritance of photoperiod response is limited to these genetic systems. As is so frequently demonstrated in other studies of this trait, several additional genetic mechanisms may be identified from other sources of germplasm. Because environment, particularly temperature, frequently modifies genetic expression of flowering, a study using growth chambers could help define this interaction. Although the data generated in this experiment yielded fairly well defined conclusions, the presence of an environmental effect was evident. Controlled temperature and exposure to light could help clarify the relationship between environment and genetics and how they affect flowering in aeschynomene

86 APPENDIX A FREQUENCY DISTRIBUTIONS OF 55 x 206 AND 232 x 206

87 ko ro rh 1X> KD I r-~ rr I O O CM kd CO un I m rh o ^ in (N ih (N U U &, h Cm CQ 03 82

88 (0 83

89 84 ro ro ro r~ CN U U


90 85 CO 00 I Ln \D I ^ r~ cn (nor-

91 86 \x m is> CO O <0 (N rn CM CM cu (^ h b a m

92 APPENDIX B CHI-SQUARE CONTINGENCY TABLES OF 55 x 232 AND 232 x 206 F,


93 Table B-1. Chi-square contingency table for 55 x 206 at Ft. Pierce Class center
 in hrs daylight Observed Expected Theoretical E 10.3 ll 10.5 10.7 10.9 11.1 11.3 11.5 11.7 11.")
94 89 Table B-2. Chi-square contingency table for 55 x 206 data from both locations combined. Class center (0-E) in hrs daylight Observed Expected Theoretical E 10.3 ll
![. 90 Table B-3. Contingency table for Chi-squares of 232 x 206 at Gainesville Class center (0-E) in hrs daylight Observed Expected Theoretical E 10.3 0.29 0.58, 10-5 3J 4.59] 6.U 10.7 6\ 4.1o\ 2.](/docs-images/94/121355209/images/95-2.jpg "19\ -^'^^ 10.9 10 7.53 5.05' 11.1 10 16.45 22.90 2.5290 11-3 31 27.33 23.46 0.5219 11.5 33 33.10 33.19 0.0003 11.7 11 12.27 13.53 0.1315 11-9 7 12.56 18.11 2.4613 12.1 15 12.72 10.44 0.4086 12.")
95 . 90 Table B-3. Contingency table for Chi-squares of 232 x 206 at Gainesville Class center (0-E) in hrs daylight Observed Expected Theoretical E , J 4.59] 6.U \ 4.1o\ 2.19\ -^'^^ ' J 3.I0J o\ 0.3l\ ,1514 1/2 X = X^ = df = 5 P = <0.01

96 91 Table B-4. Chi-square contingency table for 232 x 206 at Ft. Pierce. Class center in hrs daylight Observed Expected Theoretical (0-E) /2 X = X = df 0.20 to 0.10
 in hrs daylight Observed Expected Theoretical E 10.3 10.5 10.7 10.9 11.1 11.3 11.5 11.7 11.")
97 92 Table B-5. Chi-square contingency table of 232 x 206 data from locations combined. Class center (0-E) in hrs daylight Observed Expected Theoretical E

98 APPENDIX C CHI-SQUARE CONTINGENCY TABLES OF BACKCROSSES

99 Table C-1. Chi-square contingency table of (55 x 206) x 55 at Ft. Pierce Class ce


100 95 Table C-2. Chi-square contingency table of (55 x 206) x 206, data from locations combined. Class center
101 . 96 Table C-3. Chi-square contingency table of (55 x 206) x 206 at Gainesville Class center (0-E)' in hrs daylight Observed Expected Theoretical E 10,
102 97 Table C-4. Chi-square contingency table of (55 x 206) x 206 at Ft. Pierce. Class center in hrs daylight Observed Theoretical (0-E)' ^ ; /2 X = X = df 0.50 to 0.30
103 Table C-5. Chi-square contingency table of (232 x 206) x 206 at Ft. Pierce. Class center m hrs daylight Observed Expected Theoretical (0-E)'
104 99 Table C-6. Chi-square contingency table of (232 x 206) x 206, location data combined. Class center (0-E)^ m hrs daylight Observed Expected Theoretical E , ,

105 LITERATURE CITED 1. Albrecht, S. L., J. M. Bennett, and K. H. Quesenberry Growth and nitrogen fixation of Aeschynomene under water stressed conditions. Plant and Soil 60: Allard, R. W Principles of plant breeding. John Wiley and Sons, Inc., New York. 3. Benepal, P. S., and C. V. Hall Genetic basis of varietal resistance of Cucurbita pepo L. to squash bug Anasa tristis DeGreer. Proc. Am. Soc. Hort. Sci. 90: '. 4. Coyne, D. P Phot ope riod ism: Inheritance and linkage studies in Phaseolis vulgaris. J. Heredity 58: Falconer, D. S Introduction to quantitative genetics. 2nd edition. Longman Publishers, New York. 6. Fisher, R. A., and F. Yates Statistical tables for biological, agricultural and medical research. Hafner Pub. Co., New York 7. Gate Research Co Sunrise and sunset tables for key cities and weather stations of the U.S. Compiled by Gate Research Co., Detroit. 8. Gates, C. E Discussion: some considerations m variance component and partitioning methods of genetic analysis. In W.D. Hanson and H.F. Robinson (eds.), Statistical genetics and~plant breeding. NAS, NRC Publ. 982: Hodges, E. M., A. E. Kretschmer, Jr., P. Mislevy, R. D. Roush, O. C. Ruelke, and G. H. Snyder Production and utilization of the tropical legume aeschynomene. Circular S-290. University of Florida, Gainesville. 10. Ison, R. L. Climatic control of Stylosanthes guianensis flowering. J. Aust. Inst. Agri. Sci, 49: Leonard, W. H., H. O. Mann, and L. Powers Partitioning method of genetic analysis applied to plant-height inheritance in barley. Colo. Agri. Expt. Sta. Tech Bull. 60: Little, T. M., and F. J. Hills Agricultural experimentation design and analysis. John Wiley and Sons, Inc., New York. 100


106 Mather, K Biometrical genetics. Dover Publications, Inc., New York. 14. Mather, K., and J. L. Jinks Biometrical genetics. Cornell University Press, Ithaca, New York. 15 Miller, I. L., and W.T. Williams Tolerance of some tropical legumes to six months of simulated waterlogging. Tropical Grasslands 15: Murfret, I. C Flowering in Pisum: Three distinct phenotypic classes determined by the interaction of a dominant early and a dominant late gene. Heredity 26: Murfret, I. C Flowering in Pisum : Hr, a gene for high response to photoperiod. Heredity 31: Murfret, I. C Flowering in Pisum ; Multiple alleles at the If locus. Heredity 35: Murfret, I. C Environmental interaction and the genetics of flowering. Ann. Rev. Plant Physio. 28: Powers, L Components of variance method and partitioning method of genetic analysis applied to weight per fruit of tomato hybrid and parental populations. USDA Tech. Bull. No Powers, L The partitioning method of genetic analysis and some aspects of its application to plant breeding. In W.D. Hanson and H.F. Robinson (eds.). Statistical genetics and plant breeding. NAS, NRC Publ. 982: Powers, L., and L. F. Locke Partitioning method of genetic analysis applied to quantitative characters of tomato crosses. USDA Tech. Bull. No Quesenberry, K. H., and W. R. Ocumpaugh Forage potential of Aeschynomene species in northcentral Florida. Proc. from Soil and Crop Soc. of Fla. 40: Rudd, V. E Leguminosae. Bulletin of the U.S. National Museum. vol Sage, G. M. C, and M. J. de Isturiz The inheritance of anther extrusion in two spring wheat varieties. Theor. Appl Genetics 45: Snoad, B., and A. E. Arthur Genetical studies of quantitative characters in peas. I. A seven-parent diallel cross of cultivars. Euphytica 22:

107 Snoad, B., and A. E. Arthur, Genetical studies of quantitative characters in peas. II. A six-parent diallel cross of cultivars and primitive forms. Euphytica 22: Stevens, M. A Inheritance of viscosity potential m tomato. J. Amer. Soc. Hort. Sci. 101: Stevens, H. A., and K. N. Paulson Phosphorous concentration in tomato fruits: inheritance and maturity effects. J. Amer. Soc. Hort. Sci. 98: Swindell, R. E,. and J. M. Poehlman Inheritance of photoperiod response in mungbean ( Vigna radiata [L.] Wilczek). Euphytica 27: Tsao, S. J., and R. W. Hartmann Inheritance of photoperiodism in snapbean. Hortscience 10: Watts, L. E., E. Stevenson, and M. J. Crampton, Inheritance of flowering time in six pea cultivars ( Pisum sativum L.), Euphytica 19:

108 . BIOGRAPHICAL SKETCH Christopher W. Deren was born m Illinois in After completing two years of college m the late 1960s, he spent two and one-half years in Asia and Europe, He then worked in land survey, masonry and as a farrier until he continued his education in He received his B.S. in agronomy at the University of Arkansas in 1980, and an M.S., also at Arkansas, in 1983, with specialization in cotton breeding 103


109 I certify that I have read this study and that m my opinion it conforms to acceptable standards of scholarly presentation and is fully adequate, in scope and quality, as a dissertation for the degree of Doctor of Philosophy. Kenneth H. Quesenberry, Chairman Professor of Agronomy I certify that I have read this study and that in my opinion it conforms to acceptable standards of scholarly presentation and is fully adequate, m scope and quality, as a dissertation for the degree of Doctor of Philosophy, Earl S. Horner Professor of Agronomy I certify that I have read this study and that m my opinion it conforms to acceptable standards of scholarly presentation and is fully adequate, in scope and quality, as a dissertation for the degree of Doctor of Philosophy. Paul M. Lyrene Professor of Fruit Crops


110 I certify that I have read this study and that in my opinion it conforms to acceptable standards of scholarly presentation and is fully adequate, in scope and quality, as a dissertation for the degree of Doctor of Philosophy. VWfO0_i2^ Gloria A. Moore Associate Professor of Fruit Crops I certify that I have read this study and that in my opinion it conforms to acceptable standards of scholarly presentation and is fully adequate, m scope and quality, as a dissertation for the degree of Doctor of Philosophy. Jll Hugh L. Popenoe / Profes^ctr of Soil Science X This dissertation was submitted to the Graduate Faculty of the College of Agriculture and to the Graduate School and was accepted as partial fulfillment of the requirements for the degree of Doctor of Philosophy. December 1986 X (K^ ^ «-^ Dean, C^/lege of Agric(ij/ture Dean, Graduate School


111 UNIVERSITY OF FLORIDA
QUANTITATIVE ANALYSIS OF PHOTOPERIODISM OF TEXAS 86, GOSSYPIUM HIRSUTUM RACE LATIFOLIUM, IN A CROSS AMERICAN UPLAND COTTON' Received June 21, 1962
 THE GENETICS OF FLOWERING RESPONSE IN COTTON. IV. QUANTITATIVE ANALYSIS OF PHOTOPERIODISM OF TEXAS 86, GOSSYPIUM HIRSUTUM RACE LATIFOLIUM, IN A CROSS WITH AN INBRED LINE OF CULTIVATED AMERICAN UPLAND COTTON'
2 Numbers in parentheses refer to literature cited.
 A Genetic Study of Monogerm and Multigerm Characters in Beets V. F. SAVITSKY 1 Introduction Monogerm beets were found in the variety Michigan Hybrid 18 in Oregon in 1948. Two of these monogerm plants,
I to the renewed scientific interest in the introduction of cotton stocks from
 THE GENETICS OF FLOWERING RESPONSE IN COTTON. 11. INHERITANCE OF FLOWERING RESPONSE IN A GOSSYPIUM BARBADENSE CROSS1 C. F. LEWIS' AND T. R. RICHMOND Plant Industry Station, Beltsville, Maryland, and Dept.
Managing segregating populations
 Managing segregating populations Aim of the module At the end of the module, we should be able to: Apply the general principles of managing segregating populations generated from parental crossing; Describe
PRINCIPLES OF MENDELIAN GENETICS APPLICABLE IN FORESTRY. by Erich Steiner 1/
 PRINCIPLES OF MENDELIAN GENETICS APPLICABLE IN FORESTRY by Erich Steiner 1/ It is well known that the variation exhibited by living things has two components, one hereditary, the other environmental. One
Research Notes: G. B. Pant University of Agriculture and Technology
 Volume 1 Article 6 4-1-1974 Research Notes: G. B. Pant University of Agriculture and Technology G. B. Pant University of Agriculture and Technology G. B. Pant University of Agriculture and Technology G.
Mendel and the Gene Idea. Biology Exploring Life Section Modern Biology Section 9-1
 Mendel and the Gene Idea Biology Exploring Life Section 10.0-10.2 Modern Biology Section 9-1 Objectives Summarize the Blending Hypothesis and the problems associated with it. Describe the methods used
Evolution of phenotypic traits
 Quantitative genetics Evolution of phenotypic traits Very few phenotypic traits are controlled by one locus, as in our previous discussion of genetics and evolution Quantitative genetics considers characters
Exam 1 PBG430/
 1 Exam 1 PBG430/530 2014 1. You read that the genome size of maize is 2,300 Mb and that in this species 2n = 20. This means that there are 2,300 Mb of DNA in a cell that is a. n (e.g. gamete) b. 2n (e.g.
You are required to know all terms defined in lecture. EXPLORE THE COURSE WEB SITE 1/6/2010 MENDEL AND MODELS
 1/6/2010 MENDEL AND MODELS!!! GENETIC TERMINOLOGY!!! Essential to the mastery of genetics is a thorough knowledge and understanding of the vocabulary of this science. New terms will be introduced and defined
Introduction to Genetics
 Introduction to Genetics The Work of Gregor Mendel B.1.21, B.1.22, B.1.29 Genetic Inheritance Heredity: the transmission of characteristics from parent to offspring The study of heredity in biology is
Heinrich Grausgruber Department of Crop Sciences Division of Plant Breeding Konrad-Lorenz-Str Tulln
 957.321 Sources: Nespolo (2003); Le Rouzic et al. (2007) Heinrich Grausgruber Department of Crop Sciences Division of Plant Breeding Konrad-Lorenz-Str. 24 3430 Tulln Zuchtmethodik & Quantitative Genetik
Transferring Powdery Mildew Resistance Genes from Wild Helianthus into Cultivated Sunflower. Pilar Rojas-Barros, Chao-Chien Jan, and Thomas J.
 Transferring Powdery Mildew Resistance Genes from Wild Helianthus into Cultivated Sunflower Pilar Rojas-Barros, Chao-Chien Jan, and Thomas J. Gulya USDA-ARS, Northern Crop Science Laboratory, Fargo, ND
Genetic Analysis for Heterotic Traits in Bread Wheat (Triticum aestivum L.) Using Six Parameters Model
 Using Six Parameters Model") International Journal of Current Microbiology and Applied Sciences ISSN: 2319-7706 Volume 7 Number 06 (2018) Journal homepage: http://www.ijcmas.com Original Research Article https://doi.org/10.20546/ijcmas.2018.706.029
International Journal of Current Microbiology and Applied Sciences ISSN: 2319-7706 Volume 7 Number 06 (2018) Journal homepage: http://www.ijcmas.com Original Research Article https://doi.org/10.20546/ijcmas.2018.706.029
Genetics and Genetic Prediction in Plant Breeding
 Genetics and Genetic Prediction in Plant Breeding Which traits will be most responsive to selection? What stage will be best to select for specific characters? What environments are most suited to the
Deterioration of Crop Varieties Causes and Maintenance
 Deterioration of Crop Varieties Causes and Maintenance Deterioration of Genetic Purity The genetic purity of a variety or trueness to its type deteriorates due to several factors during the production
Hairy s Inheritance: Investigating Variation, Selection, and Evolution with Wisconsin Fast Plants
 Introduction Hairy s Inheritance: Investigating Variation, Selection, and Evolution with Wisconsin Fast Plants Daniel Lauffer Wisconsin Fast Plants Program University of Wisconsin - Madison Since the dawn
Chapter 2: Extensions to Mendel: Complexities in Relating Genotype to Phenotype.
 Chapter 2: Extensions to Mendel: Complexities in Relating Genotype to Phenotype. please read pages 38-47; 49-55;57-63. Slide 1 of Chapter 2 1 Extension sot Mendelian Behavior of Genes Single gene inheritance
Essential Questions. Meiosis. Copyright McGraw-Hill Education
 Essential Questions How does the reduction in chromosome number occur during meiosis? What are the stages of meiosis? What is the importance of meiosis in providing genetic variation? Meiosis Vocabulary
HEREDITY: Objective: I can describe what heredity is because I can identify traits and characteristics
 Mendel and Heredity HEREDITY: SC.7.L.16.1 Understand and explain that every organism requires a set of instructions that specifies its traits, that this hereditary information. Objective: I can describe
Germplasm. Introduction to Plant Breeding. Germplasm 2/12/2013. Master Gardener Training. Start with a seed
 Introduction to Plant Breeding Master Gardener Training Start with a seed Germplasm Germplasm The greatest service which can be rendered to any country is to add a useful plant to its culture -Thomas Jefferson
Introduction to Plant Breeding. Master Gardener Training
 Introduction to Plant Breeding Master Gardener Training Start with a seed Germplasm Germplasm The greatest service which can be rendered to any country is to add a useful plant to its culture -Thomas Jefferson
How are traits passed from one generation to the next?
 How are traits passed from one generation to the next? Since the dawn of agriculture, humans have been trying to improve and increase their food supply. Historically, this was done by selecting the best
Interest Grabber. Analyzing Inheritance
 Interest Grabber Section 11-1 Analyzing Inheritance Offspring resemble their parents. Offspring inherit genes for characteristics from their parents. To learn about inheritance, scientists have experimented
INEA HYBRIDISATION PROTOCOLS 2011
 INEA HYBRIDISATION PROTOCOLS 2011 Anton Ivancic Hybridisation of taro (Colocasia esculenta) Floral characteristics of taro Colocasia esculenta is an allogamous, protogynous species, for which the main
Genetics_2011.notebook. May 13, Aim: What is heredity? Homework. Rd pp p.270 # 2,3,4. Feb 8 11:46 PM. Mar 25 1:15 PM.
 Aim: What is heredity? LE1 3/25/11 Do Now: 1.Make a T Chart comparing and contrasting mitosis & meiosis. 2. Have your lab out to be collected Homework for Tuesday 3/29 Read pp. 267 270 p.270 # 1,3 Vocabulary:
Research Notes: Inheritance of photoperiod insensitivity to flowering in Glycine max
 Volume 4 Article 6 4-1-1977 Research Notes: Inheritance of photoperiod insensitivity to flowering in Glycine max S. Shanmugasundaram Asian Vegetable Research and Development Center Follow this and additional
CYTOPLASMIC INHERITANCE
 CYTOPLASMIC INHERITANCE Inheritance of most of the characters in eukaryotic organisms shows the following characteristic features. 1. The contributions by both male and female parents are equal so that
Lecture WS Evolutionary Genetics Part I 1
 Quantitative genetics Quantitative genetics is the study of the inheritance of quantitative/continuous phenotypic traits, like human height and body size, grain colour in winter wheat or beak depth in
Plant Propagation PLS 3223/5222
 Plant Propagation PLS 3223/5222 Dr. Sandra Wilson Dr. Mack Thetford Principles and Practices of Seed Selection Chapter 5 1 Chapter 5 Objectives are to Understand: Self and cross pollination Sexual incompatibility
Inheritance of plant and tuber traits in diploid potatoes
 Inheritance of plant and tuber traits in diploid potatoes Mosquera, V. 1, Mendoza, H. A. 1, Villagómez. V. 1 and Tay, D. 1 National Agrarian University Peru; International Potato Center (CIP) E-mail: roni_atenea@yahoo.com
C.v. Dr. Mohammed Ali Hussein
 C.v. Dr. Mohammed Ali Hussein - Dr Mohammed Ali Hussien Al- Falahe Email: dr.mohammed1953@yahoo.com Tele : 07507718671. - Was born in Baghdad Iraq 1953. - Graduated from Al-Nasar primary school in 1966.
Variance Components: Phenotypic, Environmental and Genetic
 Variance Components: Phenotypic, Environmental and Genetic You should keep in mind that the Simplified Model for Polygenic Traits presented above is very simplified. In many cases, polygenic or quantitative
Guided Notes Unit 6: Classical Genetics
 Name: Date: Block: Chapter 6: Meiosis and Mendel I. Concept 6.1: Chromosomes and Meiosis Guided Notes Unit 6: Classical Genetics a. Meiosis: i. (In animals, meiosis occurs in the sex organs the testes
Class 10 Heredity and Evolution Gist of lesson
 Class 10 Heredity and Evolution Gist of lesson Genetics : Branch of science that deals with Heredity and variation. Heredity : It means the transmission of features / characters/ traits from one generation
GENETIC ANALYSES OF ROOT SYSTEM DEVELOPMENT IN THE TOMATO CROP MODEL
 GENETIC ANALYSES OF ROOT SYSTEM DEVELOPMENT IN THE TOMATO CROP MODEL Kelsey Hoth 1 Dr. Maria Ivanchenko 2 Bioresourse Research 1, Department of Botany and Plant Physiology 2, Oregon State University, Corvallis,
Chromosome duplication and distribution during cell division
 CELL DIVISION AND HEREDITY Student Packet SUMMARY IN EUKARYOTES, HERITABLE INFORMATION IS PASSED TO THE NEXT GENERATION VIA PROCESSES THAT INCLUDE THE CELL CYCLE, MITOSIS /MEIOSIS AND FERTILIZATION Mitosis
Outline for today s lecture (Ch. 14, Part I)
") Outline for today s lecture (Ch. 14, Part I) Ploidy vs. DNA content The basis of heredity ca. 1850s Mendel s Experiments and Theory Law of Segregation Law of Independent Assortment Introduction to Probability
Outline for today s lecture (Ch. 14, Part I) Ploidy vs. DNA content The basis of heredity ca. 1850s Mendel s Experiments and Theory Law of Segregation Law of Independent Assortment Introduction to Probability
Class Copy! Return to teacher at the end of class! Mendel's Genetics
 Class Copy! Return to teacher at the end of class! Mendel's Genetics For thousands of years farmers and herders have been selectively breeding their plants and animals to produce more useful hybrids. It
9-1 The Work of Gregor
 9-1 The Work of Gregor 11-1 The Work of Gregor Mendel Mendel 1 of 32 11-1 The Work of Gregor Mendel Gregor Mendel s Peas Gregor Mendel s Peas Genetics is the scientific study of heredity. Gregor Mendel
1. they are influenced by many genetic loci. 2. they exhibit variation due to both genetic and environmental effects.
 October 23, 2009 Bioe 109 Fall 2009 Lecture 13 Selection on quantitative traits Selection on quantitative traits - From Darwin's time onward, it has been widely recognized that natural populations harbor
INTERNATIONAL UNION FOR THE PROTECTION OF NEW VARIETIES OF PLANTS
 ORIGINAL: English DATE: October 30, 2008 INTERNATIONAL UNION FOR THE PROTECTION OF NEW VARIETIES OF PLANTS GENEVA E Associated Document to the General Introduction to the Examination of Distinctness, Uniformity
Inbred line development in landraces. Vijay Chaikam Sarah Hearne
 Inbred line development in landraces Vijay Chaikam Sarah Hearne Inbred line development by recurrent selfing Generation Landrace Homozygosity 50% Months S1 75% 6 S2 87.5% 12 S3 93.75% 18 S4 96.875% 24
Prediction and Validation of Three Cross Hybrids in Maize (Zea mays L.)
") International Journal of Current Microbiology and Applied Sciences ISSN: 2319-7706 Volume 7 Number 01 (2018) Journal homepage: http://www.ijcmas.com Original Research Article https://doi.org/10.20546/ijcmas.2018.701.183
International Journal of Current Microbiology and Applied Sciences ISSN: 2319-7706 Volume 7 Number 01 (2018) Journal homepage: http://www.ijcmas.com Original Research Article https://doi.org/10.20546/ijcmas.2018.701.183
Untitled Document. A. antibiotics B. cell structure C. DNA structure D. sterile procedures
 Name: Date: 1. The discovery of which of the following has most directly led to advances in the identification of suspects in criminal investigations and in the identification of genetic diseases? A. antibiotics
Reinforcement Unit 3 Resource Book. Meiosis and Mendel KEY CONCEPT Gametes have half the number of chromosomes that body cells have.
 6.1 CHROMOSOMES AND MEIOSIS KEY CONCEPT Gametes have half the number of chromosomes that body cells have. Your body is made of two basic cell types. One basic type are somatic cells, also called body cells,
Chapter 1: Mendel s breakthrough: patterns, particles and principles of heredity
 Chapter 1: Mendel s breakthrough: patterns, particles and principles of heredity please read pages 10 through 13 Slide 1 of Chapter 1 One of Mendel s express aims was to understand how first generation
Laboratory III Quantitative Genetics
 Laboratory III Quantitative Genetics Genetics Biology 303 Spring 2007 Dr. Wadsworth Introduction Mendel's experimental approach depended on the fact that he chose phenotypes that varied in simple and discrete
Name Class Date. Pearson Education, Inc., publishing as Pearson Prentice Hall. 33
 Chapter 11 Introduction to Genetics Chapter Vocabulary Review Matching On the lines provided, write the letter of the definition of each term. 1. genetics a. likelihood that something will happen 2. trait
Quantitative Genetics I: Traits controlled my many loci. Quantitative Genetics: Traits controlled my many loci
 Quantitative Genetics: Traits controlled my many loci So far in our discussions, we have focused on understanding how selection works on a small number of loci (1 or 2). However in many cases, evolutionary
4/26/18. Domesticated plants vs. their wild relatives. Lettuce leaf size/shape, fewer secondary compounds
 The final exam: Tuesday, May 8 at 4:05-6:05pm in Ruttan Hall B35. 75 multiple choice questions for 150 points 50 questions from Lecture 20 27 25 questions directly from the first two exams. Key for exam
You are encouraged to answer/comment on other people s questions. Domestication conversion of plants or animals to domestic uses
 The final exam: Tuesday, May 8 at 4:05-6:05pm in Ruttan Hall B35. 75 multiple choice questions for 150 points 50 questions from Lecture 20 27 25 questions directly from the first two exams. Key for exam
CHARACTER ASSOCIATION AND PATH ANALYSIS IN GARLIC (Allium sativum L) FOR YIELD AND ITS ATTRIBUTES
 FOR YIELD AND ITS ATTRIBUTES") SAARC J. Agri., 11(1): 45-52 (2013) CHARACTER ASSOCIATION AND PATH ANALYSIS IN GARLIC (Allium sativum L) FOR YIELD AND ITS ATTRIBUTES S. R. Singh, N. A. Ahmed, S. Lal, Asima Amin 1, Mudasir Amin 5 S. A.
SAARC J. Agri., 11(1): 45-52 (2013) CHARACTER ASSOCIATION AND PATH ANALYSIS IN GARLIC (Allium sativum L) FOR YIELD AND ITS ATTRIBUTES S. R. Singh, N. A. Ahmed, S. Lal, Asima Amin 1, Mudasir Amin 5 S. A.
Mutation, Selection, Gene Flow, Genetic Drift, and Nonrandom Mating Results in Evolution
 Mutation, Selection, Gene Flow, Genetic Drift, and Nonrandom Mating Results in Evolution 15.2 Intro In biology, evolution refers specifically to changes in the genetic makeup of populations over time.
Pitahayas: introduction, agrotechniques and breeding
 Pitahayas: introduction, agrotechniques and breeding The French Associates Institute for Agriculture and Biotechnology of Drylands May 8 Noemi Tel-Zur The J. Blaustein Institutes for Desert Research Ben-Gurion
The Chromosomal Basis of Inheritance
 The Chromosomal Basis of Inheritance Mitosis and meiosis were first described in the late 800s. The chromosome theory of inheritance states: Mendelian genes have specific loci (positions) on chromosomes.
Unit 2 Lesson 4 - Heredity. 7 th Grade Cells and Heredity (Mod A) Unit 2 Lesson 4 - Heredity
 Unit 2 Lesson 4 - Heredity") Unit 2 Lesson 4 - Heredity 7 th Grade Cells and Heredity (Mod A) Unit 2 Lesson 4 - Heredity Give Peas a Chance What is heredity? Traits, such as hair color, result from the information stored in genetic
Unit 2 Lesson 4 - Heredity 7 th Grade Cells and Heredity (Mod A) Unit 2 Lesson 4 - Heredity Give Peas a Chance What is heredity? Traits, such as hair color, result from the information stored in genetic
THE USE OF DOUBLED-HAPLOIDS IN CASSAVA BREEDING
 150 THE USE OF DOUBLED-HAPLOIDS IN CASSAVA BREEDING Hernan Ceballos 1, J.C. Pérez 1, C. Iglesias 2, M. Fregene 1, F. Calle 1, G. Jaramillo 1, N. Morante 1 and J. López 1 ABSTRACT Cassava breeding is difficult
Genetic Divergence Studies for the Quantitative Traits of Paddy under Coastal Saline Ecosystem
 J. Indian Soc. Coastal Agric. Res. 34(): 50-54 (016) Genetic Divergence Studies for the Quantitative Traits of Paddy under Coastal Saline Ecosystem T. ANURADHA* Agricultural Research Station, Machilipatnam
I. GREGOR MENDEL - father of heredity
 GENETICS: Mendel Background: Students know that Meiosis produces 4 haploid sex cells that are not identical, allowing for genetic variation. Essential Question: What are two characteristics about Mendel's
Observing Patterns in Inherited Traits
 Observing Patterns in Inherited Traits Chapter 10 Before you go on Review the answers to the following questions to test your understanding of previous material. 1. Most organisms are diploid. What does
Genetics (patterns of inheritance)
") MENDELIAN GENETICS branch of biology that studies how genetic characteristics are inherited MENDELIAN GENETICS Gregory Mendel, an Augustinian monk (1822-1884), was the first who systematically studied
MENDELIAN GENETICS branch of biology that studies how genetic characteristics are inherited MENDELIAN GENETICS Gregory Mendel, an Augustinian monk (1822-1884), was the first who systematically studied
Legend: S spotted Genotypes: P1 SS & ss F1 Ss ss plain F2 (with ratio) 1SS :2 WSs: 1ss. Legend W white White bull 1 Ww red cows ww ww red
 1SS :2 WSs: 1ss. Legend W white White bull 1 Ww red cows ww ww red") On my honor, this is my work GENETICS 310 EXAM 1 June 8, 2018 I. Following are 3 sets of data collected from crosses: 1. Spotted by Plain gave all spotted in the F1 and 9 spotted and 3 plain in the F2.
On my honor, this is my work GENETICS 310 EXAM 1 June 8, 2018 I. Following are 3 sets of data collected from crosses: 1. Spotted by Plain gave all spotted in the F1 and 9 spotted and 3 plain in the F2.
Biology Chapter 11: Introduction to Genetics
 Biology Chapter 11: Introduction to Genetics Meiosis - The mechanism that halves the number of chromosomes in cells is a form of cell division called meiosis - Meiosis consists of two successive nuclear
YOM KAKIZAKI SAITAMAGRICULTURAL EXPERIMENT STATION, URAWA, SAITANA
 A THE FLOWERING HABIT AND NATURAL CROSSING IN THE EGG-PLANT YOM KAKIZAKI SAITAMAGRICULTURAL EXPERIMENT STATION, URAWA, SAITANA In regard to the frequency of natural crossing in the egg-plant,. Solauum
Directed Reading B. Section: Traits and Inheritance A GREAT IDEA
 Skills Worksheet Directed Reading B Section: Traits and Inheritance A GREAT IDEA 1. One set of instructions for an inherited trait is a(n) a. allele. c. genotype. d. gene. 2. How many sets of the same
ESTIMATION OF GERMINATION POSSIBILITIES OF SOME PEAS STORAGES ACCESSIONS AND THE EVALUATION OF SOME QUALITATIVE INDICATORS ON ALBANIAN PLANT GENE BANK
 ESTIMATION OF GERMINATION POSSIBILITIES OF SOME PEAS STORAGES ACCESSIONS AND THE EVALUATION OF SOME QUALITATIVE INDICATORS ON ALBANIAN PLANT GENE BANK Conference on Biotechnological Developments 21 November
$25 per bin, minimum $50 per on-site visit
 Adopted 2/11/2014 Revised 2/16/2015 Application and Fees Field applications must be submitted through the Oregon Seed Certification Service e-certification website at www.seedcert.oregonstate.edu. All
Science Unit Learning Summary
 Learning Summary Inheritance, variation and evolution Content Sexual and asexual reproduction. Meiosis leads to non-identical cells being formed while mitosis leads to identical cells being formed. In
Picture from "Mendel's experiments: Figure 3," by Robert Bear et al
 Plant Genetics Learning Objectives: Understand the basics o genetics Understand how genetics is used in Plant Science today Learn the basics o extracting DNA Learn how to make crosses between plants and
Name Class Date. KEY CONCEPT Gametes have half the number of chromosomes that body cells have.
 Section 1: Chromosomes and Meiosis KEY CONCEPT Gametes have half the number of chromosomes that body cells have. VOCABULARY somatic cell autosome fertilization gamete sex chromosome diploid homologous
THE WORK OF GREGOR MENDEL
 GENETICS NOTES THE WORK OF GREGOR MENDEL Genetics-. - Austrian monk- the father of genetics- carried out his work on. Pea flowers are naturally, which means that sperm cells fertilize the egg cells in
-Genetics- Guided Notes
 -Genetics- Guided Notes Chromosome Number The Chromosomal Theory of Inheritance genes are located in specific on chromosomes. Homologous Chromosomes chromosomes come in, one from the male parent and one
A species of plants. In maize 20 genes for male sterility are listed by
 THE INTERRELATION OF PLASMAGENES AND CHROMO- GENES IN POLLEN PRODUCTION IN MAIZE DONALD F. JONES Connecticut Agricultural Experiment Station, New Haven, Connecticut Received January 24, 195 IV INHERITED
Section 11 1 The Work of Gregor Mendel
 Chapter 11 Introduction to Genetics Section 11 1 The Work of Gregor Mendel (pages 263 266) What is the principle of dominance? What happens during segregation? Gregor Mendel s Peas (pages 263 264) 1. The
Family resemblance can be striking!
 Family resemblance can be striking! 1 Chapter 14. Mendel & Genetics 2 Gregor Mendel! Modern genetics began in mid-1800s in an abbey garden, where a monk named Gregor Mendel documented inheritance in peas
Kentucky Seed Certification Standards. I. Explanation of General Standards as Applied to Corn Hybrids
 Kentucky Seed Certification Standards H Y B R I D C O R N I. Explanation of General Standards as Applied to Corn Hybrids A. The General Seed Certification Standards as adopted are basic and, together with
Mendelian Genetics. Introduction to the principles of Mendelian Genetics
 + Mendelian Genetics Introduction to the principles of Mendelian Genetics + What is Genetics? n It is the study of patterns of inheritance and variations in organisms. n Genes control each trait of a living
Solutions to Problem Set 4
 Question 1 Solutions to 7.014 Problem Set 4 Because you have not read much scientific literature, you decide to study the genetics of garden peas. You have two pure breeding pea strains. One that is tall
CHAPTER 23 THE EVOLUTIONS OF POPULATIONS. Section C: Genetic Variation, the Substrate for Natural Selection
 CHAPTER 23 THE EVOLUTIONS OF POPULATIONS Section C: Genetic Variation, the Substrate for Natural Selection 1. Genetic variation occurs within and between populations 2. Mutation and sexual recombination
Labs 7 and 8: Mitosis, Meiosis, Gametes and Genetics
 Biology 107 General Biology Labs 7 and 8: Mitosis, Meiosis, Gametes and Genetics In Biology 107, our discussion of the cell has focused on the structure and function of subcellular organelles. The next
those in Arizona. This period would extend through the fall equinox (September 23, 1993). Thus, pending variation due to cloudiness, total light flux
. Thus, pending variation due to cloudiness, total light flux") PERFORMANCE OF KENTUCKY BLUEGRASS SEED TREATED WITH METHANOL Fred J. Crowe, D. Dale Coats, and Marvin D. Butler, Central Oregon Agricultural Research Center Abstract Foliar-applied methanol was purported
PERFORMANCE OF KENTUCKY BLUEGRASS SEED TREATED WITH METHANOL Fred J. Crowe, D. Dale Coats, and Marvin D. Butler, Central Oregon Agricultural Research Center Abstract Foliar-applied methanol was purported
Genetic variability, Heritability and Genetic Advance for Yield, Yield Related Components of Brinjal [Solanum melongena (L.
 Available online at www.ijpab.com DOI: http://dx.doi.org/10.18782/2320-7051.5404 ISSN: 2320 7051 Int. J. Pure App. Biosci. 5 (5): 872-878 (2017) Research Article Genetic variability, Heritability and Genetic
Model plants and their Role in genetic manipulation. Mitesh Shrestha
 Model plants and their Role in genetic manipulation Mitesh Shrestha Definition of Model Organism Specific species or organism Extensively studied in research laboratories Advance our understanding of Cellular
Sporic life cycles involve 2 types of multicellular bodies:
 Chapter 3- Human Manipulation of Plants Sporic life cycles involve 2 types of multicellular bodies: -a diploid, spore-producing sporophyte -a haploid, gamete-producing gametophyte Sexual Reproduction in
Abstract approved (Major Professor)
") AN ABSTRACT OF THE THESIS OF Warren Ervind Kronstad for the Doctor of Philosophy Degree in Farm Crops Date thesis is presented May 10v 1963 Title COMBINING ABILITY MP GAME ACTION ESTIMTES MP THE ASSOCIATION
AN ABSTRACT OF THE THESIS OF Warren Ervind Kronstad for the Doctor of Philosophy Degree in Farm Crops Date thesis is presented May 10v 1963 Title COMBINING ABILITY MP GAME ACTION ESTIMTES MP THE ASSOCIATION
SELECTING NEW Brachiaria FOR BRAZILIAN PASTURES. 2 CNPq fellow. Abstract
 ID # 13 14 SELECTING NEW Brachiaria FOR BRAZILIAN PASTURES C.B. do Valle 1,2, V.P.B. Euclides 1,2, M.C.M. Macedo 1,2, J R. Valério 1,2 and S. Calixto 1 1 Embrapa Gado de Corte, Caixa Postal 154, 79002-970
Problem Set 3 10:35 AM January 27, 2011
 BIO322: Genetics Douglas J. Burks Department of Biology Wilmington College of Ohio Problem Set 3 Due @ 10:35 AM January 27, 2011 Chapter 4: Problems 3, 5, 12, 23, 25, 31, 37, and 41. Chapter 5: Problems
Sexual Reproduction and Genetics
 Chapter Test A CHAPTER 10 Sexual Reproduction and Genetics Part A: Multiple Choice In the space at the left, write the letter of the term, number, or phrase that best answers each question. 1. How many
Situation of corn in Myanmar
 Situation of corn in Myanmar Phyu Phwe New Plant Variety Protection Unit Department of Agricultural Research(DAR) (2. 8.2016) Introduction Maize - second mandate cereal in Myanmar after rice Mainly utilized
1 Mendel and His Peas
 CHAPTER 3 1 Mendel and His Peas SECTION Heredity BEFORE YOU READ After you read this section, you should be able to answer these questions: What is heredity? How did Gregor Mendel study heredity? National
11-1 The Work of Gregor Mendel. The Work of Gregor Mendel
 11-1 The Work of Gregor Mendel The Work of Gregor Mendel Gregor Mendel s Peas! Gregor Mendel s Peas Genetics is the scientific study of heredity. " Gregor Mendel was an Austrian monk. His work was important
Q1) Explain how background selection and genetic hitchhiking could explain the positive correlation between genetic diversity and recombination rate.
 Explain how background selection and genetic hitchhiking could explain the positive correlation between genetic diversity and recombination rate.") OEB 242 Exam Practice Problems Answer Key Q1) Explain how background selection and genetic hitchhiking could explain the positive correlation between genetic diversity and recombination rate. First, recall
OEB 242 Exam Practice Problems Answer Key Q1) Explain how background selection and genetic hitchhiking could explain the positive correlation between genetic diversity and recombination rate. First, recall
Bahiagrass Breeding at the University of Florida
 Bahiagrass Breeding at the University of Florida Ann Blount 1, Paul Mislevy 2, Ken Quesenberry 3, Tom Sinclair 3, Cheryl Mackowiak 1, Bob Myer 1, and Richard Sprenkel 1 1. Univ. of Florida, North Florida
Advance Organizer. Topic: Mendelian Genetics and Meiosis
 Name: Row Unit 8 - Chapter 11 - Mendelian Genetics and Meiosis Advance Organizer Topic: Mendelian Genetics and Meiosis 1. Objectives (What should I be able to do?) a. Summarize the outcomes of Gregor Mendel's
Flower Species as a Supplemental Source of Pollen for Honey Bees (Apis mellifera) in Late Summer Cropping Systems
 in Late Summer Cropping Systems") Flower Species as a Supplemental Source of Pollen for Honey Bees (Apis mellifera) in Late Summer Cropping Systems Rhonda Simmons, Ramesh Sagili, and Bruce Martens Abstract Honey bee forager preference
Flower Species as a Supplemental Source of Pollen for Honey Bees (Apis mellifera) in Late Summer Cropping Systems Rhonda Simmons, Ramesh Sagili, and Bruce Martens Abstract Honey bee forager preference
MIXED MODELS THE GENERAL MIXED MODEL
 MIXED MODELS This chapter introduces best linear unbiased prediction (BLUP), a general method for predicting random effects, while Chapter 27 is concerned with the estimation of variances by restricted
A recipe for the perfect salsa tomato
 The National Association of Plant Breeders in partnership with the Plant Breeding and Genomics Community of Practice presents A recipe for the perfect salsa tomato David Francis, The Ohio State University
Studies on the Light Controlling Flower Initiation of Pharbitis Nil. VI. Effect of Natural Twilight. by Atsushi TAKIMOTO* and Katsuhiko IKEVA*
 Studies on the Light Controlling Flower Initiation of Pharbitis Nil. Received September 9, 1959 VI. Effect of Natural Twilight by Atsushi TAKIMOTO* and Katsuhiko IKEVA* Many investigators consider that
REVISION: GENETICS & EVOLUTION 20 MARCH 2013
 REVISION: GENETICS & EVOLUTION 20 MARCH 2013 Lesson Description In this lesson, we revise: The principles of Genetics including monohybrid crosses Sex linked traits and how to use a pedigree chart The