Bioinformatics: Network Analysis
|
|
|
- Grace Cummings
- 5 years ago
- Views:
Transcription
 - Fall 2013 Luay Nakhleh, Rice University")
1 Bioinformatics: Network Analysis Comparative Network Analysis COMP 572 (BIOS 572 / BIOE 564) - Fall 2013 Luay Nakhleh, Rice University 1

2 Biomolecular Network Components 2

3 Accumulation of Network Components 3

4 (Statistics downloaded March 18, 2008) 4
5 (Statistics downloaded March 18, 2008) 5
6 How do we make sense of all this data? 6

7 Nothing in Biology Makes Sense Except in the Light of Evolution Theodosius Dobzhansky ( ) 7
8 Work over the past 50 years has revealed that molecular mechanisms underlying fundamental biological processes are conserved in evolution and that models worked out from experiments carried out in simple organisms can often be extended to more complex organisms This observation forms the basis for using interaction networks derived from experiments in model organisms to obtain information about interactions that may occur between the ortholog proteins in different organisms Further the observation allows for identifying functional modules based on conservation of network components 8
9 Comparative Interactomics 9

10 10


11 Evolutionary Models for PPI and Metabolic Networks 11


12 Evolutionary Models for PPI and Metabolic Networks 12
13 The Network Alignment Problem Given a set {N1,N2,...,Nk} of PPI networks from k organisms, find subnetworks that are conserved across all k networks The problem in general is NP-hard (even for k=2), generalizing subgraph isomorphism Several heuristics have been developed 13
14 The Network Alignment Problem In general, the output of the network alignment problem is a conserved subnetwork In particular: a conserved linear path may correspond to a signaling pathway a conserved cluster of interactions may correspond to a protein complex 14

15 Matching proteins are linked by dotted lines, and yellow, green or blue links represent measured protein-protein interactions between yeast, worm or fly proteins, respectively. 15
 Link attachment and detachment occur through mutations in a gene encoding an existing protein.")
16 Evolutionary Processes Shaping Protein Interaction Networks Evolutionary processes shaping protein interaction networks. The progression of time is symbolized by arrows. (a) Link attachment and detachment occur through mutations in a gene encoding an existing protein. These processes affect the connectivity of the protein whose coding sequence undergoes mutation (shown in black) and of one of its binding partners (shown in white). Empirical data shows that attachment occurs preferentially towards partners of high connectivity. (b) Gene duplication produces a new protein (black square) with initially identical binding partners (gray square). Empirical data suggest that duplications occur at a much lower rate than link attachment/ detachment and that redundant links are lost subsequently (often in an asymmetric fashion), which affects the connectivities of the duplicate pair and of all its binding partners. 16

17 Challenges in Comparative Interactomics 17
18 The Rest of This Lecture Pairwise network alignment Multiple network alignment 18


19 Pairwise Network Alignment One heuristic approach creates a merged representation of the two networks being compared, called a network alignment graph, and then applies a greedy algorithm for identifying the conserved subnetworks embedded in the merged representation 19
 with a network of successive enzymes in metabolic pathways The source code (Perl) and data are available at:")
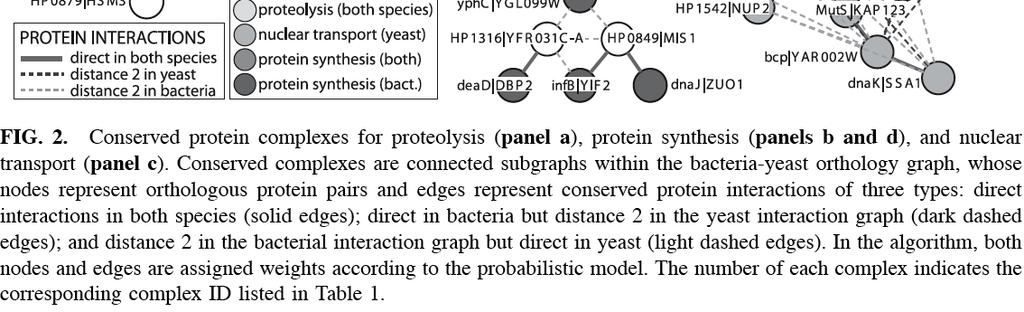
20 They searched for correspondence between reactions of specific metabolic pathways and the genomic locations of the genes encoding the enzymes catalyzing those reactions Their network alignment graph combined the genome ordering information (network of genes arranged in a path) with a network of successive enzymes in metabolic pathways The source code (Perl) and data are available at: 20

21 PathBLAST Kelley et al. applied the concept of network alignment to the study of PPI networks. They translated the problem of finding conserved pathways to that of finding highscoring paths in the alignment graph The algorithm, PathBLAST, identified five regions that were conserved across the PPI networks of S. cerevisiae and H. pylori 21
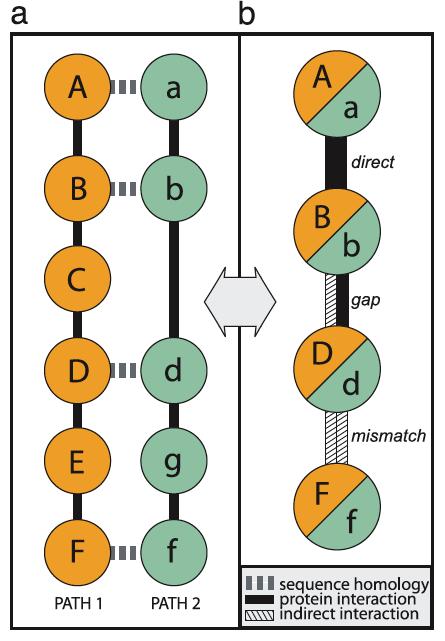
22 Gaps and Mismatches 22
23 Global Alignment and Scoring To perform the alignment of two PPI networks, the two networks are combined into a global alignment graph (figure on previous slide), in which each vertex represents a pair of proteins (one from each network) having at least weak sequence similarity (BLAST E value 10-2 ) and each edge represents a conserved interaction, gap, or mismatch A path through this graph represents a pathway alignment between the two networks A log probability score S(P) is formulated where p(v) is the probability of true homology within the protein pair represented by v, given its pairwise protein sequence similarity expressed as BLAST E value, and q(e) is the probability that the PPIs represented by e are real Protein sequence alignments and associated E values were computed by using BLAST 2.0 with parameters b=0, e=1x10 6, f= C;S, and v=6x10 5. Unalignable proteins were assigned a maximum E value of 5 23
24 Optimal Pathway Alignment and Significance Once the alignment graph was built, optimal pathway alignment were searched for The authors considered simple paths of length 4, and used a dynamic programming algorithm that finds the highest-scoring path of length L in linear time (in acyclic graphs) Because the global alignment graph may contain cycles, the authors generated a sufficient number, 5L!, of acyclic subgraphs by random removal of edges from the global alignment graph and then aggregated the results of running dynamic programming on each 24
25 Optimal Pathway Alignment and Significance Because conserved regions of the network could be highly interconnected, it was sometimes possible to identify a large number of distinct paths involving the same small set of proteins Rather than enumerate each of these, PathBLAST was used in stages For each stage k, the authors recorded the set of 50 highest-scoring pathway alignments (with average score <Sk>) and then removed their vertices and edges from the alignment graph before the next stage The p value of each stage was assessed by comparing <Sk> to the distribution of average scores <S1> observed over 100 random global alignment graphs and assigned to every conserved network region resulting from that stage 25
26 Experimental Results Yeast vs. Bacteria: orthologous pathways between the networks of S. cerevisiae and H. pylori Yeast vs. Yeast: paralogous pathways within the network of S. cerevisiae 26

27 Top-scoring pathway alignments between bacteria and yeast 27

28 Paralogous pathways within yeast (Proteins were not allowed to pair with themselves or their network neighbors) 28

29 Querying the yeast network with specific pathways 29
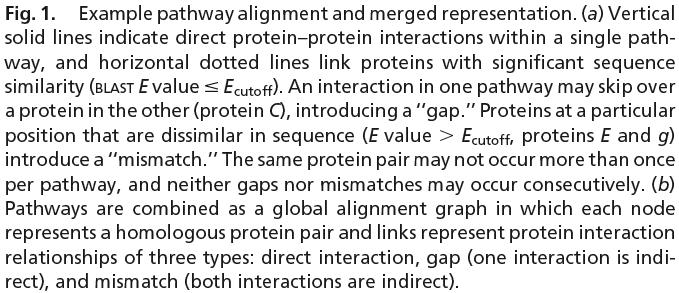
30 Sharan et al. extended PathBLAST to detect conserved protein clusters The extended method identified eleven complexes that were conserved across the PPI networks of S. cerevisiae and H. pylori 30
31 The method defines a probabilistic model for protein complexes, and search for conserved high probability, high density subgraphs (subnetworks) 31
32 A Probabilistic Model for Protein Complexes Define two models The protein complex model, M c: assumes that every two proteins in a complex interact with some high probability β The null model, M n: assumes that each edge is present with the probability that one would expect if the edges of G were randomly distributed but respected the degrees of the vertices 32
33 A complicating factor in constructing the interaction graph is that we do not know the real protein interactions, but rather have partial, noisy observations of them Let T uv denote the event that two proteins u and v interact, and Fuv the event that they do not interact Denote by O uv the (possibly empty) set of available observations on the proteins u and v, that is, the set of experiments in which u and v were tested for interaction and the outcome of these tests 33
34 Using prior biological information, one can estimate for each protein pair the probability Pr(Ouv Tuv) of the observations on this pair, given that it interacts, and the probability Pr(Ouv Fuv) of those observations, given that this pair does not interact Further, one can estimate the prior probability Pr(Tuv) that two random proteins interact 34
35 Scoring for Single Species Given a subset U of the vertices, we wish to compute the likelihood of U under a proteincomplex model and under a null model Denote by O U the collection of all observations on vertex pairs in U. Then [(1) follows from the assumption that all pairwise interactions are independent] [(2) is obtained from the law of complete probability] [(3) follows by noting that given the hidden event of whether u and v interact, Ouv is independent of any model] 35
36 Next, Pr(O U Mn) needs to be computed Let d 1,d2,...,dn denote the expected degrees of the vertices in G, rounded to the closest integer In order to compute d 1,...,dn, apply Bayes rule to derive the expectation of Tuv for any pair u,v, given the observations on this vertex pair: Hence, d i =[ j Pr(T ij O ij )] where [.] denotes rounding 36
37 The refined null model assumes that G is drawn uniformly at random from the collection of all graphs whose degree sequences is d1,...,dn This induces a probability p uv for every vertex pair (u,v), from which we can calculate the probability of OU according to the null model Finally, the log likelihood ratio that we assign to a subset of vertices U is 37
38 Scoring for Two Species Consider now the case of data on two species 1 and 2, denoted throughout by an appropriate superscript Consider two subsets U1 and V 2 of vertices and some many-to-many mapping ϴ:U 1 V 2 between them Assuming the interaction graphs of the two species are independent of each other, the log likelihood ratio score for these two sets is simply 38
39 However, this score does not take into account the degree of sequence conservation among the pairs of proteins associated by ϴ In order to include such information, we have to define a conserved complex model and a null model for pairs of proteins from two species The conserved complex model assumes that pairs of proteins associated by ϴ are orthologous The null model assumes that such pairs consist of two independently chosen proteins 39
40 Let E uv denote the BLAST E-value assigned to the similarity between proteins u and v, and let huv, h uv denote the events that u and v are orthologous or nonorthologous, respectively The likelihood ratio corresponding to a pair of proteins (u,v) is therefore and the complete score of U 1 and V 2 under the mapping ϴ is (k1 is the number of vertices in U 1 ) ( = Pr(h ) uv E uv ) Pr(h) prior probability that two proteins are orthologous 40
41 Searching for Conserved Complexes Using the model just described for comparative interaction data, the problem of identifying conserved protein complexes reduces to the problem of identifying a subset of proteins in each species, and a correspondence between them, such that the score of these subsets exceeds a threshold 41
42 The Orthology Graph Define a complete edge- and node-weighted orthology graph Denote by the superscripts p and y the model parameters corresponding to bacteria and yeast, respectively For two proteins y 1 and y2 define Similarly, for two bacterial proteins p1 and p2 define Every pair (y 1,p1) of yeast and bacterial proteins is assigned a node whose weight reflects the similarity of the proteins: 42
43 The Orthology Graph Every two distinct nodes (y 1,p1) and (y2,p2) are connected by an edge, which is associated with a pair of weights If y 1=y2 (p1=p2), set the first (second) weight to 0 By construction, an induced subgraph of the orthology graph corresponds to two subsets of proteins, one from each species, and many-to-many correspondence between them 43
44 The Orthology Graph Define the z-score of an induced subgraph with vertex sets U 1 and V 2 and a mapping ϴ between them as the log likelihood ratio score Sϴ(U 1,V 2 ) for the subgraph, normalized by subtracting its mean and dividing by its standard deviation The node and edge weights are assumed to be independent, so the mean and variance of Sϴ(U 1,V 2 ) are obtained by summing the sample means and variances of the corresponding nodes and edges In order to reduce the complexity of the graph and focus on biologically plausible conserved complexes, certain nodes were filtered from the graph 44
45 The problem of searching heavy subgraphs in a graph is NP-hard The Search Strategy A bottom-up heuristic search is instead performed (in the alignment graph), by starting from high-weight seeds, refining them by exhaustive enumeration, and then expanding them using local search An edge in the alignment graph is strong if the sum of its associated weights (the weights within each species graph) is positive 45
46 The Search Strategy 1. Compute a seed around each node v, which consists of v and all its neighbors u such that (u,v) is a strong edge 2. If the size of the seed is above a specified threshold, iteratively remove from it the node whose contribution to the subgraph score is minimum, until a desired size is reached 3. Enumerate all subsets of the seed that have size at least 3 and contain v. Each such subset is a refined seed on which a local search heuristic is applied 4. Local search: iteratively add a node whose contribution to the current seed is maximum, or remove a node, whose contribution to the current seed is minimum, as long as this operation increases the overall score of the seed. Throughout the process, the original refined seed is preserved and nodes are not deleted from it 5. For each node in the alignment graph, record up to k heaviest subgraphs that were discovered around that node 46
47 The Search Strategy The resulting subgraphs may overlap considerably, so the authors used a greedy algorithm to filter subgraphs whose percentage of intersection is above a threshold (60%) The algorithm iteratively finds the highest weight subgraph, adds it to the final output list, and removes all other highly intersecting subgraphs 47
48 Evaluating the Complexes Compute two kinds of p-values The first is based on the z-scores that are computed for each subgraph and assumes a normal approximation to the likelihood ratio of a subgraph. The approximation relies on the assumption that the subgraph s nodes ad edges contribute independent terms to the score. The latter probability is Bonferroni corrected for multiple testing. The second is based on empirical runs on randomized data. The randomized data are produced by random shuffling of the input interaction graphs of the two species, preserving their degree sequences, as well as random shuffling of the orthology relations, preserving the number of orthologs associated with each protein. For each randomized dataset, the authors used their heuristic search to find the highest-scoring conserved complex of a given size. Then, they estimated the p-value of a suggested complex of the same size, as the fraction of random runs in which the output complex had larger score. 48
49 Experimental Setup Yeast vs. Bacteria: orthologous complexes between the networks of S. cerevisiae and H. pylori The yeast network contained 14,848 pairwise interactions among 4,716 proteins The bacterial network contained 1,403 pairwise interactions among 732 proteins All interactions were extracted from the DIP database 49
50 Experimental Setup Protein sequences for both species were obtained from PIR Alignments and associated E-values were computed using BLAST 2.0, with parameters b=0; e=1e6; f= C;S ; v=6e5 Unalignable proteins were assigned a maximum E-value of 5 Altogether, 1,909 protein pairs had E-value below 0.01, out of which 822 pairs contained proteins with some measured interaction Adding 1,242 additional pairs with weak homology and removing nodes with no incident strong edges resulted in a final orthology graph G with 866 nodes and 12,420 edges In total, 248 distinct bacterial proteins and 527 yeast proteins participated in G 50
51 Experimental Setup The authors used a maximum likelihood method to estimate the reliability of observed interactions in yeast The reliability of the interactions in H. pylori was estimated at 0.53 For each species, the probabilities of observing each particular edge in a random graph with the same degree sequence was computed by Monte Carlo simulations The authors set β (the probability of observing an interaction in a complex model) to 0.95 The prior probability of a true interaction was set to The prior probability that a pair of proteins are orthologous was computed as the frequency of protein pairs from both species that are in the same COG cluster, with a value of Pr(h)=
52 Experimental Results The algorithm identified 11 nonredundant complexes, whose p-values were smaller than 0.05, after correction for multiple testing These complexes were also found to be significant when scored against empirical runs on randomized data (p < 0.05) 52
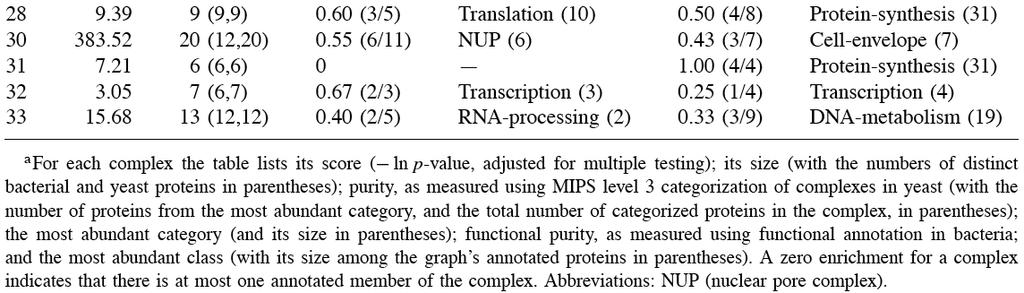
53 Experimental Results 53
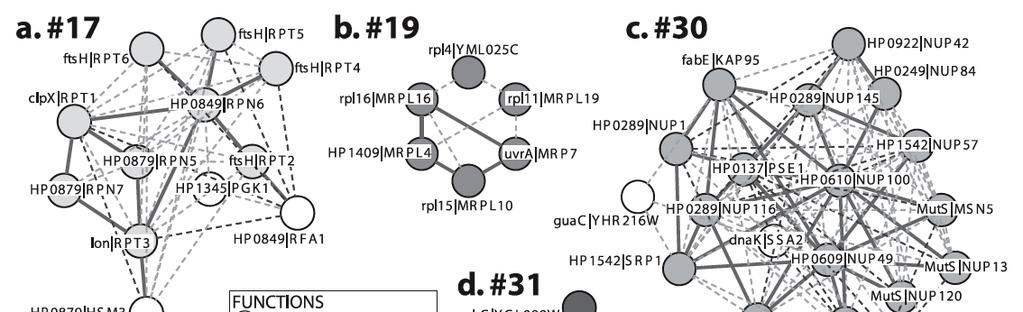
54 Experimental Results 54
55 MaWISh Koyuturk et al. developed an evolution-based scoring scheme to detect conserved protein clusters, which takes into account interaction insertion/deletion and protein duplication events The algorithm, MaWISh, identified conserved subnetworks in the PPI networks of human and mouse, as well as conserved sub-networks across S. cerevisiae, C. elegans, and D. melanogaster 55
56 The authors propose a framework for aligning PPI networks based on the duplication/divergence evolutionary model that has been shown to be promising in explaining the power-law nature of PPI networks 56
57 Like the work of Sharan and colleagues (PathBLAST), the authors here construct an alignment (or, product) graphs by matching pairs of orthologous nodes (proteins) Unlike Sharan and colleagues, the authors define matches, mismatches, and duplications, and weight edges in order to reward or penalize these evolutionary events 57
58 The authors reduce the resulting alignment problem to a graph-theoretic optimization problem and propose efficient heuristics to solve it 58
59 Outline of the Rest of This Part Theoretical models for evolution of PPI networks Pairwise local alignment of PPI networks Experimental results 59
60 Theoretical Models for Evolution of PPI Networks Barabasi and Albert (1999) proposed a network growth model based on preferential attachment, which is able to generate networks with degree distribution similar to PPI networks According to the BA model, networks expand continuously by addition of new nodes, and these new nodes prefer to attach to wellconnected nodes when joining the network 60
61 Theoretical Models for Evolution of PPI Networks A common model of evolution that explains preferential attachment is the duplication/ divergence model, which is based on gene duplications According to this model, when a gene is duplicated in the genome, the node corresponding to the product of this gene is also duplicated together with its interactions 61
62 Theoretical Models for Evolution of PPI Networks 62
63 Theoretical Models for Evolution of PPI Networks A protein loses many aspects of its functions rapidly after being duplicated This translates to divergence of duplicated (paralogous) proteins in the interactome through elimination and emergence of interactions 63
64 Theoretical Models for Evolution of PPI Networks Elimination of an interaction in a PPI network implies the loss of an interaction between two proteins due to structural and/or functional changes Similarly, emergence of an interaction in a PPI network implies the introduction of a new interaction between two noninteracting proteins caused by mutations that change protein surfaces 64
65 Theoretical Models for Evolution of PPI Networks Since the elimination of interactions is related to sequence-level mutations, one can expect a positive correlation between similarity of interaction profiles and sequence similarity for paralogous proteins The interaction profiles of duplicated proteins tend to almost totally diverge in about 200 million years, as estimated on the yeast interactome 65
66 Theoretical Models for Evolution of PPI Networks On the other hand, the correlation between interaction profiles of duplicated proteins is significant for up to 150 million years after duplication, with more than half of the interactions being conserved for proteins that are duplicated less than 50 million yeas back 66
67 Theoretical Models for Evolution of PPI Networks Consequently, when PPI networks that belong to two separate species are considered, the in-paralogs are likely to have more common interactions than out-paralogs 67
68 Pairwise Local Alignment of PPI Networks Three items: Define the PPI network alignment problem Formulate the problem as a graph optimization problem Describe an efficient heuristic for solving the problem 68
69 The PPI Network Alignment Problem Undirected graph G(U,E) The homology between a pair of proteins is quantified by a similarity measure S, where S(u,v) measures the degree of confidence in u and v being orthologous, where 0 S(u,v) 1 If u and v belong to the same species, then S(u,v) quantifies the likelihood that the two proteins are inparalogs S is expected to be sparse (very few orthologs for each protein) 69
70 The PPI Network Alignment Problem For PPI networks G(U,E) and H(V,F), a protein subset pair is defined as a pair of protein subsets and Any protein subset pair P induces a local alignment A(G,H,S,P)={M,N,D} of G and H with respect to S, characterized by a set of duplications D, a set of matches M, and a set of mismatches N Each duplication is associated with a score that reflects the divergence of function between the two proteins, estimated using their similarity A match corresponds to a conserved interaction between two orthologous protein pairs (an interlog), which is rewarded by a match score that reflects confidence in both protein pairs being orthologous 70
71 The PPI Network Alignment Problem A mismatch is the lack of an interaction in the PPI network of one organism between a pair of proteins whose orthologs interact in the other organism Mismatches are penalized to account for the divergence from the common ancestor 71
72 The PPI Network Alignment Problem 72
73 Scoring Match, Mismatch, and Duplications For scoring matches and mismatches, define the similarity between two protein pairs as where quantifies the likelihood that the interactions between u and v, and u and v are orthologous Consequently, a match that corresponds to a conserved pair of orthologous interactions is rewarded as follows: Here, is the match coefficient that is used to tune the relative weight of matches against mismatches and duplications, based on the evolutionary distance between the species that are being compared 73
74 Scoring Match, Mismatch, and Duplications A mismatch may correspond to the functional divergence of either interacting partner after speciation It might also be due to a false positive or negative in one of the networks that is caused by incompleteness of the data or experimental error It has been observed that after a duplication event, duplicate proteins that retain similar functions in terms of being part of similar processes are likely to be part of the same subnet Moreover, since conservation of proteins in a particular module is correlated with interconnectedness, it is expected that interacting partners that are part of a common functional module will at least be linked by short alternative paths 74
75 Scoring Match, Mismatch, and Duplications Based on the aforementioned observations, mismatches are penalized for possible divergence in functions as follows: As for match score, mismatch penalty is also normalized by a coefficient that determines the relative weight of mismatches w.r.t. matches and duplications With the expectation that recently duplicated proteins, which are more likely to be in-paralogs, show more significant sequence similarity than older paralogs, duplication score is defined as follows: Here is the cutoff for being considered in-paralogs 75
76 Scoring Match, Mismatch, and Duplications 76
77 77
78 Estimating Similarity Scores The similarity score S(u,v) quantifies the likelihood that proteins u and v are orthologous This likelihood is approximated using the BLAST E-value taking existing ortholog databases as point of reference (similar to the work of Sharan and colleagues) Let O be the set of all orthologous protein pairs derived from an orthology database (e.g., COG) For proteins u and v with BLAST E-value, estimated as S is where Ouv represents that u and v are orthologous 78
79 Alignment Graph and the Maximumweight Induced Subgraph Problem 79
80 80
81 Alignment Graph and the Maximumweight Induced Subgraph Problem The construction of the alignment graph allows to formulate the alignment problem as a graph optimization problem: This problem is equivalent to the decision version of the local alignment problem defined on previous slides. More formally, 81
82 Algorithms for Local Alignment of PPI networks As in the work of Sharan and colleagues, the authors propose a heuristic that greedily grows a subgraph seeded at heavy nodes 82
83 83
84 Statistical Significance To evaluate the statistical significance of discovered highscoring alignments, the authors compare them with a reference model generated by a random source In the reference model, it is assumed that the interaction networks of the two organisms are independent of each other To accurately capture the power-law nature of PPI networks, it is assumed that the interactions are generated randomly from a distribution characterized by a given degree sequence If proteins u and u are interacting with d u and du proteins, respectively, then the probability of observing an interaction between u and u can be estimated as 84
85 Statistical Significance In the reference model, the expected value of the score of an alignment induced by is, where is the expected weight of an edge in the alignment graph With the simplifying assumption of independence of interactions, we have, which enables computing the z-score to evaluate the statistical significance of each discovered high-scoring alignment 85
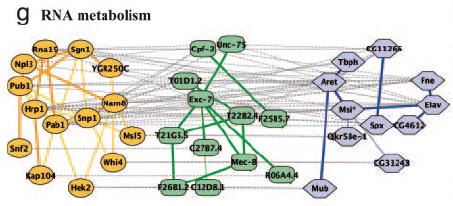
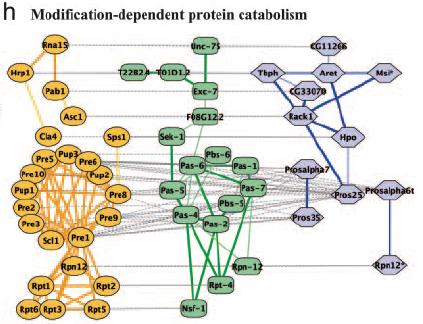
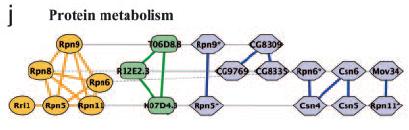
86 Experimental Results Data from BIND and DIP Aligned every pair 86
87 Experimental Results 87
88 Experimental Results 88
89 Experimental Results 89
90 Experimental Results 90
91 91
92 Multiple Network Alignment 92
93 The authors considered alignments of three PPI networks (C. elegans, D. melanogaster, and S. cerevisiae) Their method is almost the same as that for aligning two networks to identify conserved protein complexes, with the only difference that nodes in the alignment graph contain one protein from each of the three species, and an edge between two nodes contains information about interactions among the proteins in the families at both endpoints of the edge 93

94 Schematic of the multiple network comparison pipeline. Raw data are preprocessed to estimate the reliability of the available protein interactions and identify groups of sequence-similar proteins. A protein group contains one protein from each species and requires that each protein has a significant sequence match to at least one other protein in the group (BLAST E value < 10-7 ; considering the 10 best matches only). Next, protein networks are combined to produce a network alignment that connects protein similarity groups whenever the two proteins within each species directly interact or are connected by a common network neighbor. Conserved paths and clusters identified within the network alignment are compared to those computed from randomized data, and those at a significance level of P < 0.01 are retained. A final filtering step removes paths and clusters with >80% overlap. 94
95 Experimental Setup Data was downloaded from DIP Yeast: 14,319 interactions among 4,389 proteins Worm: 3,926 interactions among 2,718 proteins Fly: 20,720 interactions among 7,038 proteins Protein sequences obtained from the Saccharomyces Genome Database, WormBase, and FlyBase were combined with the protein interaction data to generate a network alignment of 9,011 protein similarity groups and 49,688 conserved interactions for the three networks 95
96 Experimental Results A search over the network alignment identified 183 protein clusters and 240 paths conserved at a significance level of P<0.01 These covered a total of 649 proteins among yeast, worm, and fly 96

97 yeast worm fly 97

98 yeast worm fly 98

99 yeast worm fly 99

100 yeast worm fly 100
101 In addition to the three-way comparison, the authors performed all possible pairwise alignments: yeast/worm, yeast/fly, and worm/fly The process identified 220 significant conserved clusters for yeast/worm, 835 for yeast/fly, and 132 for worm/fly 101
102 Work described so far is limited to two (or three) PPI networks Graemlin is capable of multiple alignment of an arbitrary number of networks, searches for conserved functional modules, and provides a probabilistic formulation of the topology-matching problem Available from: 102
103 Graemlin s Features Multiple alignment Local and global Network-to-network alignment (an exhaustive list of conserved modules) and query-to-network alignment (matches to a particular module within a database of interaction networks) 103
104 The Alignment Problem Each interaction network is represented as a weighted graph Gi=(Vi,Ei), where nodes correspond to proteins and each weighted edge specifies the probability that two proteins interact A network alignment is a set of subgraphs chosen from the interaction networks of different species, together with a mapping between aligned proteins The mapping is required to be transitive (if protein A is aligned to proteins B and C, then protein B must also be aligned to protein C) It follows that the groups of aligned proteins are disjoint, and are referred to as equivalence classes 104
105 The Alignment Problem It is also required that all aligned proteins be homologous, hence all proteins in the same equivalence class are in general members of the same protein family In other words, an alignment is a collection of protein families whose interactions are conserved across a given set of species Because the members of a protein family descend from a common ancestor, this allows to reconstruct the evolutionary events leading from each ancestral protein to its extant descendants 105
106 The Alignment Problem Two elements are needed: A scoring framework that captures the knowledge about module evolution An algorithm to rapidly identify high-scoring alignments 106
107 Scoring an Alignment Define two models that assign probabilities to the evolutionary events leading from the hypothesized ancestral module to modules in the extant species The alignment model, M, posits that the module is subject to evolutionary constraint The random model, R, assumes that the proteins are under no constraints The score of an alignment is the log-ratio of the two probabilities 107


108 An Overview of the Scoring Scheme 108
109 Node Scoring To score an equivalence class, Graemlin uses a scheme that reconstructs the most parsimonious ancestral history of an equivalence class, based on five types of evolutionary events: protein sequence mutations, proteins insertions and deletions, protein duplications, and protein divergences The models M and R give each of these events a different probability Graemlin uses weighted sum-of-pairs scoring to determine the probabilities for sequence mutations 109

110 Node Scoring 110
111 Edge Scoring Each edge e is assigned a score S e=log(prm(e)/prr(e)) The random model R assigns each edge a probability parametrized by its weight and degrees of its endpoints (captures the notion that two nodes of high degree are more likely to interact by chance than two nodes of low degree) The alignment model M is more involved 111
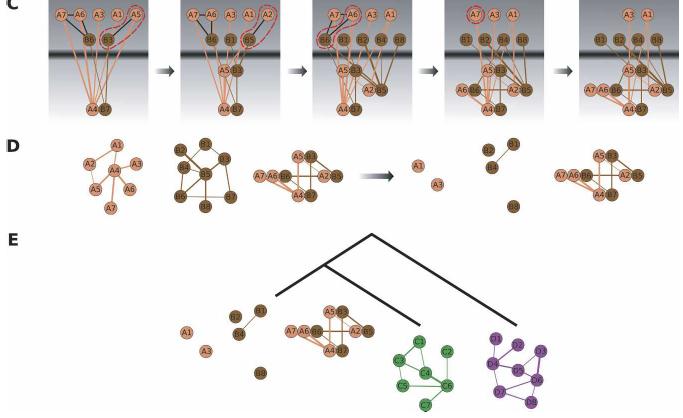
112 Edge Scoring The alignment model M uses an Edge Scoring Matrix, or ESM, to encapsulate the desired module structure into a symmetric matrix An ESM has a set of labels by which its rows and columns are indexed, and each cell in the matrix contains a probability distribution over edge weights To score edges in an alignment, Graemlin first assigns to each equivalence class one of the labels from the ESM. Then, it scores each edge e using the cell in the matrix indexed by the labels of the two equivalence classes to which its endpoints belong: the function in the cell maps the weight of the edge to a probability PrM(e), which is used to compute the score Se 112
113 Edge Scoring To search for conserved protein complexes, Graemlin uses a Complex ESM, which consists of a single label with an alignment distribution assigning high probabilities to high edge weights A Pathway ESM has one label for each protein in the pathway and rewards high edge weights between adjacent proteins; between all other proteins, the alignment and random distributions are the same, so that Graemlin neither rewards nor penalizes edges connected nonadjacent proteins A Module ESM is used for query searching: it has a label for each node in the query and generates the alignment distribution based on the edges that are present or absent in the query 113

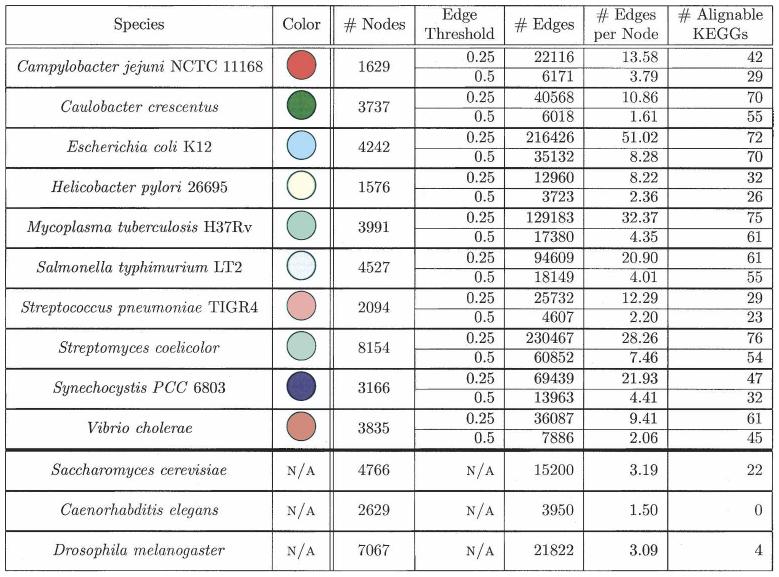
114 Edge Scoring 114
115 Alignment Algorithm Graemlin uses slightly different methodologies for pairwise and multiple alignments 115
116 Pairwise Alignment Algorithm To search for high-scoring alignments between a pair of networks, Graemlin first generates a set of seeds (d-clusters), which it uses to restrict the size of the search space The seeds consist of d proteins that are close together in a network For each network, Greamlin constructs one d-cluster for each node by finding the d-1 nearest neighbors of that node, where the length of an edge is the negative logarithm of its weight 116
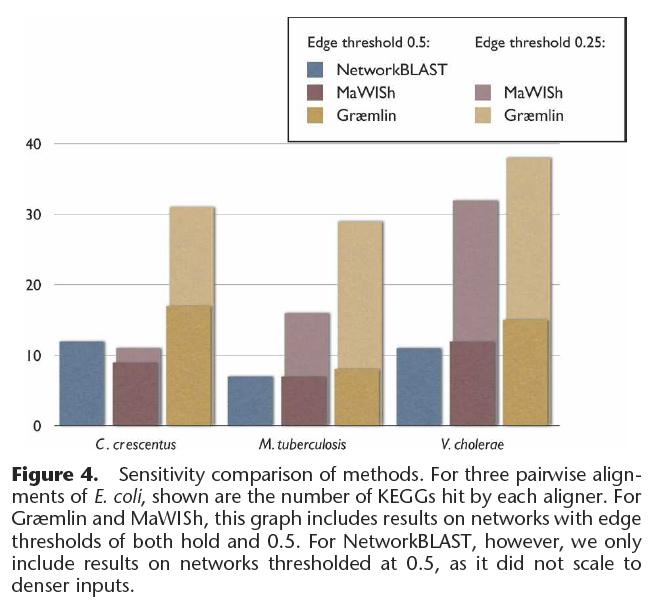
117 Pairwise Alignment Algorithm Graemlin compares two d-clusters D 1 and D2 by mapping a subset of nodes in D1 to a subset of nodes in D2 and reporting a score equal to the sum of all pairwise scores induced by the mapping; the score of two d-clusters is the highest-scoring such mapping Graemlin identifies pairs of d-clusters, one from each network, that score higher than a threshold T and uses these as seeds 117
118 Pairwise Alignment Algorithm Benefits of using d-clusters: Graemlin can compare them rapidly, since the comparison neglects edge scores The parameters d and T allow for a speed-sensitivity tradeoff High-scoring alignments are likely to contain high-scoring d-clusters, since a high node score of an alignment is usually a prerequisite to a high overall score 118
119 Pairwise Alignment Algorithm Given two networks, Graemlin enumerates the set of seeds between them and tries to transform each, in turn, into a highscoring alignment The seed extension phase is greedy and occurs in successive rounds At each step, all proteins adjacent to some node in the alignment constitute the frontier, which contains candidates to be added to the alignment 119
120 Pairwise Alignment Algorithm Graemlin selects from the frontier the pair of proteins that, when added to the alignment, yields the maximal increase in score The extension phase stops when no pair of proteins on the frontier can increase the score of the alignment Graemlin uses several heuristics to control for the exponential increase in the size of the frontier as it adds more nodes to the alignment 120
121 121
122 Multiple Alignment Algorithm Graemlin performs multiple alignment using an analog of the progressive alignment technique commonly used in sequence alignment Using a phylogenetic tree, it successively aligns the closest pair of networks, constructing several new networks from the resulting alignments Graemlin places each new network at the parent of the pair of networks that it just aligned The constructed networks contain nodes that are no longer proteins but equivalence classes Graemlin continues this process until the only remaining networks are at the root of the phylogenetic tree 122
123 Multiple Alignment Algorithm To enable comparisons of unaligned parts of a network to more distant species as it traverses the phylogenetic tree, rather than construct a network only from the high-scoring alignments, Graemlin also maintains two additional networks composed of the unaligned nodes from the two original networks The end result is that after completion of the entire multiple alignment, Graemlin produces multiple alignments of all possible subsets of species Graemlin avoids exponential running time in practice because after each pairwise alignment, the networks it constructs have small overlaps (the total number of nodes in all networks therefore does not increase significantly) 123
124 Experimental Setup Graemlin was tested on a set of 10 microbial protein interaction networks constructed via the SRINI algorithm They also used PPI networks from S. cerevisiae, C. elegans, and D. melanogaster, to compare the performance of the method to other methods that had used these three species 124
125 Experimental Setup 125
126 Experimental Setup 126
127 Experimental Setup The sensitivity (TP/(TP+FN)) of a method was assessed by counting the number of KEGG pathways that it aligned between two species (a hit occurs if the method aligns at least three proteins in the pathway to their counterparts in the other species) The coverage of a pathway is the fraction of proteins correctly aligned within that pathway 127
128 Experimental Setup To measure the specificity (TN/(FP+TN)) of a method, the authors computed the number of enriched alignments To calculate enrichment, the authors first assign to each protein all of its annotations from level eight or deeper in the GO hierarchy Given an alignment, the authors then discarded unannotated proteins and calculated its enrichment using the GO TermFinder They considered an alignment to be enriched if the P-value of its enrichment was <
129 Experimental Setup An alternative measure of specificity counts the fraction of nodes that have KEGG orthologs but were aligned to any nodes other than their KEGG orthologs 129
130 Experimental Results 130
131 Experimental Results 131
132 Experimental Results 132
133 Experimental Results 133
134 Experimental Results 134
135 Experimental Results 135
136 Experimental Results 136
137 Experimental Results 137
Network alignment and querying
 Network biology minicourse (part 4) Algorithmic challenges in genomics Network alignment and querying Roded Sharan School of Computer Science, Tel Aviv University Multiple Species PPI Data Rapid growth
Network Alignment 858L
 Network Alignment 858L Terms & Questions A homologous h Interolog = B h Species 1 Species 2 Are there conserved pathways? What is the minimum set of pathways required for life? Can we compare networks
Protein-protein Interaction: Network Alignment
 Protein-protein Interaction: Network Alignment Lecturer: Roded Sharan Scribers: Amiram Wingarten and Stas Levin Lecture 7, May 6, 2009 1 Introduction In the last few years the amount of available data
Comparative Network Analysis
 Comparative Network Analysis BMI/CS 776 www.biostat.wisc.edu/bmi776/ Spring 2016 Anthony Gitter gitter@biostat.wisc.edu These slides, excluding third-party material, are licensed under CC BY-NC 4.0 by
Algorithms and tools for the alignment of multiple protein networks
 Tel-Aviv University School of Computer Science Algorithms and tools for the alignment of multiple protein networks This thesis is submitted in partial fulfillment of the requirements toward the M.Sc. degree
Sequence Alignment: A General Overview. COMP Fall 2010 Luay Nakhleh, Rice University
 Sequence Alignment: A General Overview COMP 571 - Fall 2010 Luay Nakhleh, Rice University Life through Evolution All living organisms are related to each other through evolution This means: any pair of
Evolutionary Tree Analysis. Overview
 CSI/BINF 5330 Evolutionary Tree Analysis Young-Rae Cho Associate Professor Department of Computer Science Baylor University Overview Backgrounds Distance-Based Evolutionary Tree Reconstruction Character-Based
Algorithms in Bioinformatics FOUR Pairwise Sequence Alignment. Pairwise Sequence Alignment. Convention: DNA Sequences 5. Sequence Alignment
 Algorithms in Bioinformatics FOUR Sami Khuri Department of Computer Science San José State University Pairwise Sequence Alignment Homology Similarity Global string alignment Local string alignment Dot
Dr. Amira A. AL-Hosary
 Phylogenetic analysis Amira A. AL-Hosary PhD of infectious diseases Department of Animal Medicine (Infectious Diseases) Faculty of Veterinary Medicine Assiut University-Egypt Phylogenetic Basics: Biological
Amira A. AL-Hosary PhD of infectious diseases Department of Animal Medicine (Infectious Diseases) Faculty of Veterinary Medicine Assiut
 Faculty of Veterinary Medicine Assiut") Amira A. AL-Hosary PhD of infectious diseases Department of Animal Medicine (Infectious Diseases) Faculty of Veterinary Medicine Assiut University-Egypt Phylogenetic analysis Phylogenetic Basics: Biological
Amira A. AL-Hosary PhD of infectious diseases Department of Animal Medicine (Infectious Diseases) Faculty of Veterinary Medicine Assiut University-Egypt Phylogenetic analysis Phylogenetic Basics: Biological
Phylogenetic Analysis of Molecular Interaction Networks 1
 Phylogenetic Analysis of Molecular Interaction Networks 1 Mehmet Koyutürk Case Western Reserve University Electrical Engineering & Computer Science 1 Joint work with Sinan Erten, Xin Li, Gurkan Bebek,
Biological Networks: Comparison, Conservation, and Evolution via Relative Description Length By: Tamir Tuller & Benny Chor
 Biological Networks:,, and via Relative Description Length By: Tamir Tuller & Benny Chor Presented by: Noga Grebla Content of the presentation Presenting the goals of the research Reviewing basic terms
Module: Sequence Alignment Theory and Applications Session: Introduction to Searching and Sequence Alignment
 Module: Sequence Alignment Theory and Applications Session: Introduction to Searching and Sequence Alignment Introduction to Bioinformatics online course : IBT Jonathan Kayondo Learning Objectives Understand
Computational approaches for functional genomics
 Computational approaches for functional genomics Kalin Vetsigian October 31, 2001 The rapidly increasing number of completely sequenced genomes have stimulated the development of new methods for finding
RODED SHARAN, 1 TREY IDEKER, 2 BRIAN KELLEY, 3 RON SHAMIR, 1 and RICHARD M. KARP 4 ABSTRACT
 JOURNAL OF COMPUTATIONAL BIOLOGY Volume 12, Number 6, 2005 Mary Ann Liebert, Inc. Pp. 835 846 Identification of Protein Complexes by Comparative Analysis of Yeast and Bacterial Protein Interaction Data
Graph Alignment and Biological Networks
 Graph Alignment and Biological Networks Johannes Berg http://www.uni-koeln.de/ berg Institute for Theoretical Physics University of Cologne Germany p.1/12 Networks in molecular biology New large-scale
Sara C. Madeira. Universidade da Beira Interior. (Thanks to Ana Teresa Freitas, IST for useful resources on this subject)
") Bioinformática Sequence Alignment Pairwise Sequence Alignment Universidade da Beira Interior (Thanks to Ana Teresa Freitas, IST for useful resources on this subject) 1 16/3/29 & 23/3/29 27/4/29 Outline
Bioinformática Sequence Alignment Pairwise Sequence Alignment Universidade da Beira Interior (Thanks to Ana Teresa Freitas, IST for useful resources on this subject) 1 16/3/29 & 23/3/29 27/4/29 Outline
Supplementary text for the section Interactions conserved across species: can one select the conserved interactions?
 1 Supporting Information: What Evidence is There for the Homology of Protein-Protein Interactions? Anna C. F. Lewis, Nick S. Jones, Mason A. Porter, Charlotte M. Deane Supplementary text for the section
Pairwise & Multiple sequence alignments
 Pairwise & Multiple sequence alignments Urmila Kulkarni-Kale Bioinformatics Centre 411 007 urmila@bioinfo.ernet.in Basis for Sequence comparison Theory of evolution: gene sequences have evolved/derived
BMI/CS 776 Lecture #20 Alignment of whole genomes. Colin Dewey (with slides adapted from those by Mark Craven)
") BMI/CS 776 Lecture #20 Alignment of whole genomes Colin Dewey (with slides adapted from those by Mark Craven) 2007.03.29 1 Multiple whole genome alignment Input set of whole genome sequences genomes diverged
BMI/CS 776 Lecture #20 Alignment of whole genomes Colin Dewey (with slides adapted from those by Mark Craven) 2007.03.29 1 Multiple whole genome alignment Input set of whole genome sequences genomes diverged
Computational Genomics. Systems biology. Putting it together: Data integration using graphical models
 02-710 Computational Genomics Systems biology Putting it together: Data integration using graphical models High throughput data So far in this class we discussed several different types of high throughput
Comparative Genomics II
 Comparative Genomics II Advances in Bioinformatics and Genomics GEN 240B Jason Stajich May 19 Comparative Genomics II Slide 1/31 Outline Introduction Gene Families Pairwise Methods Phylogenetic Methods
Learning in Bayesian Networks
 Learning in Bayesian Networks Florian Markowetz Max-Planck-Institute for Molecular Genetics Computational Molecular Biology Berlin Berlin: 20.06.2002 1 Overview 1. Bayesian Networks Stochastic Networks
Protein function prediction via analysis of interactomes
 Protein function prediction via analysis of interactomes Elena Nabieva Mona Singh Department of Computer Science & Lewis-Sigler Institute for Integrative Genomics January 22, 2008 1 Introduction Genome
3. SEQUENCE ANALYSIS BIOINFORMATICS COURSE MTAT
 3. SEQUENCE ANALYSIS BIOINFORMATICS COURSE MTAT.03.239 25.09.2012 SEQUENCE ANALYSIS IS IMPORTANT FOR... Prediction of function Gene finding the process of identifying the regions of genomic DNA that encode
Basic Local Alignment Search Tool
 Basic Local Alignment Search Tool Alignments used to uncover homologies between sequences combined with phylogenetic studies o can determine orthologous and paralogous relationships Local Alignment uses
Analysis of Biological Networks: Network Robustness and Evolution
 Analysis of Biological Networks: Network Robustness and Evolution Lecturer: Roded Sharan Scribers: Sasha Medvedovsky and Eitan Hirsh Lecture 14, February 2, 2006 1 Introduction The chapter is divided into
SUPPLEMENTARY INFORMATION
 Supplementary information S1 (box). Supplementary Methods description. Prokaryotic Genome Database Archaeal and bacterial genome sequences were downloaded from the NCBI FTP site (ftp://ftp.ncbi.nlm.nih.gov/genomes/all/)
17 Non-collinear alignment Motivation A B C A B C A B C A B C D A C. This exposition is based on:
 17 Non-collinear alignment This exposition is based on: 1. Darling, A.E., Mau, B., Perna, N.T. (2010) progressivemauve: multiple genome alignment with gene gain, loss and rearrangement. PLoS One 5(6):e11147.
Computational methods for predicting protein-protein interactions
 Computational methods for predicting protein-protein interactions Tomi Peltola T-61.6070 Special course in bioinformatics I 3.4.2008 Outline Biological background Protein-protein interactions Computational
Introduction to Bioinformatics
 Introduction to Bioinformatics Lecture : p he biological problem p lobal alignment p Local alignment p Multiple alignment 6 Background: comparative genomics p Basic question in biology: what properties
Lecture 4: Evolutionary Models and Substitution Matrices (PAM and BLOSUM)
") Bioinformatics II Probability and Statistics Universität Zürich and ETH Zürich Spring Semester 2009 Lecture 4: Evolutionary Models and Substitution Matrices (PAM and BLOSUM) Dr Fraser Daly adapted from
Bioinformatics II Probability and Statistics Universität Zürich and ETH Zürich Spring Semester 2009 Lecture 4: Evolutionary Models and Substitution Matrices (PAM and BLOSUM) Dr Fraser Daly adapted from
Phylogenetic Tree Reconstruction
 I519 Introduction to Bioinformatics, 2011 Phylogenetic Tree Reconstruction Yuzhen Ye (yye@indiana.edu) School of Informatics & Computing, IUB Evolution theory Speciation Evolution of new organisms is driven
BLAST. Varieties of BLAST
 BLAST Basic Local Alignment Search Tool (1990) Altschul, Gish, Miller, Myers, & Lipman Uses short-cuts or heuristics to improve search speed Like speed-reading, does not examine every nucleotide of database
10-810: Advanced Algorithms and Models for Computational Biology. microrna and Whole Genome Comparison
 10-810: Advanced Algorithms and Models for Computational Biology microrna and Whole Genome Comparison Central Dogma: 90s Transcription factors DNA transcription mrna translation Proteins Central Dogma:
Græmlin: General and robust alignment of multiple large interaction networks
 Græmlin: General and robust alignment of multiple large interaction networks Jason Flannick, Antal Novak, Balaji S. Srinivasan, Harley H. McAdams and Serafim Batzoglou Genome Res. 2006 16: 1169-1181; originally
 Tree of Life iological Sequence nalysis Chapter http://tolweb.org/tree/ Phylogenetic Prediction ll organisms on Earth have a common ancestor. ll species are related. The relationship is called a phylogeny
Quantifying sequence similarity
 Quantifying sequence similarity Bas E. Dutilh Systems Biology: Bioinformatic Data Analysis Utrecht University, February 16 th 2016 After this lecture, you can define homology, similarity, and identity
Example of Function Prediction
 Find similar genes Example of Function Prediction Suggesting functions of newly identified genes It was known that mutations of NF1 are associated with inherited disease neurofibromatosis 1; but little
Phylogenetic Networks, Trees, and Clusters
 Phylogenetic Networks, Trees, and Clusters Luay Nakhleh 1 and Li-San Wang 2 1 Department of Computer Science Rice University Houston, TX 77005, USA nakhleh@cs.rice.edu 2 Department of Biology University
A PARSIMONY APPROACH TO ANALYSIS OF HUMAN SEGMENTAL DUPLICATIONS
 A PARSIMONY APPROACH TO ANALYSIS OF HUMAN SEGMENTAL DUPLICATIONS CRYSTAL L. KAHN and BENJAMIN J. RAPHAEL Box 1910, Brown University Department of Computer Science & Center for Computational Molecular Biology
Phylogenetic inference
 Phylogenetic inference Bas E. Dutilh Systems Biology: Bioinformatic Data Analysis Utrecht University, March 7 th 016 After this lecture, you can discuss (dis-) advantages of different information types
EECS730: Introduction to Bioinformatics
 EECS730: Introduction to Bioinformatics Lecture 07: profile Hidden Markov Model http://bibiserv.techfak.uni-bielefeld.de/sadr2/databasesearch/hmmer/profilehmm.gif Slides adapted from Dr. Shaojie Zhang
Detecting Conserved Interaction Patterns in Biological Networks
 Detecting Conserved Interaction Patterns in Biological Networks Mehmet Koyutürk 1, Yohan Kim 2, Shankar Subramaniam 2,3, Wojciech Szpankowski 1 and Ananth Grama 1 1 Department of Computer Sciences, Purdue
Interaction Network Analysis
 CSI/BIF 5330 Interaction etwork Analsis Young-Rae Cho Associate Professor Department of Computer Science Balor Universit Biological etworks Definition Maps of biochemical reactions, interactions, regulations
9/30/11. Evolution theory. Phylogenetic Tree Reconstruction. Phylogenetic trees (binary trees) Phylogeny (phylogenetic tree)
 Phylogeny (phylogenetic tree)") I9 Introduction to Bioinformatics, 0 Phylogenetic ree Reconstruction Yuzhen Ye (yye@indiana.edu) School of Informatics & omputing, IUB Evolution theory Speciation Evolution of new organisms is driven by
I9 Introduction to Bioinformatics, 0 Phylogenetic ree Reconstruction Yuzhen Ye (yye@indiana.edu) School of Informatics & omputing, IUB Evolution theory Speciation Evolution of new organisms is driven by
An Efficient Algorithm for Protein-Protein Interaction Network Analysis to Discover Overlapping Functional Modules
 An Efficient Algorithm for Protein-Protein Interaction Network Analysis to Discover Overlapping Functional Modules Ying Liu 1 Department of Computer Science, Mathematics and Science, College of Professional
Protein Complex Identification by Supervised Graph Clustering
 Protein Complex Identification by Supervised Graph Clustering Yanjun Qi 1, Fernanda Balem 2, Christos Faloutsos 1, Judith Klein- Seetharaman 1,2, Ziv Bar-Joseph 1 1 School of Computer Science, Carnegie
Lecture 10: May 19, High-Throughput technologies for measuring proteinprotein
 Analysis of Gene Expression Data Spring Semester, 2005 Lecture 10: May 19, 2005 Lecturer: Roded Sharan Scribe: Daniela Raijman and Igor Ulitsky 10.1 Protein Interaction Networks In the past we have discussed
MULE: An Efficient Algorithm for Detecting Frequent Subgraphs in Biological Networks
 MULE: An Efficient Algorithm for Detecting Frequent Subgraphs in Biological Networks Mehmet Koyutürk, Ananth Grama, & Wojciech Szpankowski http://www.cs.purdue.edu/homes/koyuturk/pathway/ Purdue University
Genome Annotation. Bioinformatics and Computational Biology. Genome sequencing Assembly. Gene prediction. Protein targeting.
 Genome Annotation Bioinformatics and Computational Biology Genome Annotation Frank Oliver Glöckner 1 Genome Analysis Roadmap Genome sequencing Assembly Gene prediction Protein targeting trna prediction
Overview of IslandPick pipeline and the generation of GI datasets
 Overview of IslandPick pipeline and the generation of GI datasets Predicting GIs using comparative genomics By using whole genome alignments we can identify regions that are present in one genome but not
Michael Yaffe Lecture #5 (((A,B)C)D) Database Searching & Molecular Phylogenetics A B C D B C D
C)D) Database Searching & Molecular Phylogenetics A B C D B C D") 7.91 Lecture #5 Database Searching & Molecular Phylogenetics Michael Yaffe B C D B C D (((,B)C)D) Outline Distance Matrix Methods Neighbor-Joining Method and Related Neighbor Methods Maximum Likelihood
7.91 Lecture #5 Database Searching & Molecular Phylogenetics Michael Yaffe B C D B C D (((,B)C)D) Outline Distance Matrix Methods Neighbor-Joining Method and Related Neighbor Methods Maximum Likelihood
EVOLUTIONARY DISTANCES
 EVOLUTIONARY DISTANCES FROM STRINGS TO TREES Luca Bortolussi 1 1 Dipartimento di Matematica ed Informatica Università degli studi di Trieste luca@dmi.units.it Trieste, 14 th November 2007 OUTLINE 1 STRINGS:
Computational Biology
 Computational Biology Lecture 6 31 October 2004 1 Overview Scoring matrices (Thanks to Shannon McWeeney) BLAST algorithm Start sequence alignment 2 1 What is a homologous sequence? A homologous sequence,
SUPPLEMENTARY INFORMATION
 Supplementary information S3 (box) Methods Methods Genome weighting The currently available collection of archaeal and bacterial genomes has a highly biased distribution of isolates across taxa. For example,
Homology Modeling. Roberto Lins EPFL - summer semester 2005
 Homology Modeling Roberto Lins EPFL - summer semester 2005 Disclaimer: course material is mainly taken from: P.E. Bourne & H Weissig, Structural Bioinformatics; C.A. Orengo, D.T. Jones & J.M. Thornton,
networks in molecular biology Wolfgang Huber
 networks in molecular biology Wolfgang Huber networks in molecular biology Regulatory networks: components = gene products interactions = regulation of transcription, translation, phosphorylation... Metabolic
Algorithms in Bioinformatics
 Algorithms in Bioinformatics Sami Khuri Department of omputer Science San José State University San José, alifornia, USA khuri@cs.sjsu.edu www.cs.sjsu.edu/faculty/khuri Pairwise Sequence Alignment Homology
Modular Algorithms for Biomolecular Network Alignment
 Graduate Theses and Dissertations Graduate College 2011 Modular Algorithms for Biomolecular Network Alignment Fadi George Towfic Iowa State University Follow this and additional works at: http://lib.dr.iastate.edu/etd
Towards Detecting Protein Complexes from Protein Interaction Data
 Towards Detecting Protein Complexes from Protein Interaction Data Pengjun Pei 1 and Aidong Zhang 1 Department of Computer Science and Engineering State University of New York at Buffalo Buffalo NY 14260,
2 Genome evolution: gene fusion versus gene fission
 2 Genome evolution: gene fusion versus gene fission Berend Snel, Peer Bork and Martijn A. Huynen Trends in Genetics 16 (2000) 9-11 13 Chapter 2 Introduction With the advent of complete genome sequencing,
3 : Representation of Undirected GM
 10-708: Probabilistic Graphical Models 10-708, Spring 2016 3 : Representation of Undirected GM Lecturer: Eric P. Xing Scribes: Longqi Cai, Man-Chia Chang 1 MRF vs BN There are two types of graphical models:
Network Biology: Understanding the cell s functional organization. Albert-László Barabási Zoltán N. Oltvai
 Network Biology: Understanding the cell s functional organization Albert-László Barabási Zoltán N. Oltvai Outline: Evolutionary origin of scale-free networks Motifs, modules and hierarchical networks Network
Evidence for dynamically organized modularity in the yeast protein-protein interaction network
 Evidence for dynamically organized modularity in the yeast protein-protein interaction network Sari Bombino Helsinki 27.3.2007 UNIVERSITY OF HELSINKI Department of Computer Science Seminar on Computational
The Minimal-Gene-Set -Kapil PHY498BIO, HW 3
 The Minimal-Gene-Set -Kapil Rajaraman(rajaramn@uiuc.edu) PHY498BIO, HW 3 The number of genes in organisms varies from around 480 (for parasitic bacterium Mycoplasma genitalium) to the order of 100,000
Multiple Whole Genome Alignment
 Multiple Whole Genome Alignment BMI/CS 776 www.biostat.wisc.edu/bmi776/ Spring 206 Anthony Gitter gitter@biostat.wisc.edu These slides, excluding third-party material, are licensed under CC BY-NC 4.0 by
hsnim: Hyper Scalable Network Inference Machine for Scale-Free Protein-Protein Interaction Networks Inference
 CS 229 Project Report (TR# MSB2010) Submitted 12/10/2010 hsnim: Hyper Scalable Network Inference Machine for Scale-Free Protein-Protein Interaction Networks Inference Muhammad Shoaib Sehgal Computer Science
Predicting Protein Functions and Domain Interactions from Protein Interactions
 Predicting Protein Functions and Domain Interactions from Protein Interactions Fengzhu Sun, PhD Center for Computational and Experimental Genomics University of Southern California Outline High-throughput
Gene Ontology and Functional Enrichment. Genome 559: Introduction to Statistical and Computational Genomics Elhanan Borenstein
 Gene Ontology and Functional Enrichment Genome 559: Introduction to Statistical and Computational Genomics Elhanan Borenstein The parsimony principle: A quick review Find the tree that requires the fewest
Tools and Algorithms in Bioinformatics
 Tools and Algorithms in Bioinformatics GCBA815, Fall 2015 Week-4 BLAST Algorithm Continued Multiple Sequence Alignment Babu Guda, Ph.D. Department of Genetics, Cell Biology & Anatomy Bioinformatics and
Bioinformatics and BLAST
 Bioinformatics and BLAST Overview Recap of last time Similarity discussion Algorithms: Needleman-Wunsch Smith-Waterman BLAST Implementation issues and current research Recap from Last Time Genome consists
COMPARATIVE ANALYSIS OF BIOLOGICAL NETWORKS. A Thesis. Submitted to the Faculty. Purdue University. Mehmet Koyutürk. In Partial Fulfillment of the
 COMPARATIVE ANALYSIS OF BIOLOGICAL NETWORKS A Thesis Submitted to the Faculty of Purdue University by Mehmet Koyutürk In Partial Fulfillment of the Requirements for the Degree of Doctor of Philosophy December
Supplementary Information
 Supplementary Information For the article"comparable system-level organization of Archaea and ukaryotes" by J. Podani, Z. N. Oltvai, H. Jeong, B. Tombor, A.-L. Barabási, and. Szathmáry (reference numbers
Bioinformatics (GLOBEX, Summer 2015) Pairwise sequence alignment
 Pairwise sequence alignment") Bioinformatics (GLOBEX, Summer 2015) Pairwise sequence alignment Substitution score matrices, PAM, BLOSUM Needleman-Wunsch algorithm (Global) Smith-Waterman algorithm (Local) BLAST (local, heuristic) E-value
Bioinformatics (GLOBEX, Summer 2015) Pairwise sequence alignment Substitution score matrices, PAM, BLOSUM Needleman-Wunsch algorithm (Global) Smith-Waterman algorithm (Local) BLAST (local, heuristic) E-value
A Multiobjective GO based Approach to Protein Complex Detection
 Available online at www.sciencedirect.com Procedia Technology 4 (2012 ) 555 560 C3IT-2012 A Multiobjective GO based Approach to Protein Complex Detection Sumanta Ray a, Moumita De b, Anirban Mukhopadhyay
ALGORITHMS FOR BIOLOGICAL NETWORK ALIGNMENT
 ALGORITHMS FOR BIOLOGICAL NETWORK ALIGNMENT A DISSERTATION SUBMITTED TO THE DEPARTMENT OF COMPUTER SCIENCE AND THE COMMITTEE ON GRADUATE STUDIES OF STANFORD UNIVERSITY IN PARTIAL FULFILLMENT OF THE REQUIREMENTS
Association Analysis-based Transformations for Protein Interaction Networks: A Function Prediction Case Study
 Association Analysis-based Transformations for Protein Interaction Networks: A Function Prediction Case Study Gaurav Pandey Dept of Comp Sc & Engg Univ of Minnesota, Twin Cities Minneapolis, MN, USA gaurav@cs.umn.edu
An Introduction to Bioinformatics Algorithms Hidden Markov Models
 Hidden Markov Models Outline 1. CG-Islands 2. The Fair Bet Casino 3. Hidden Markov Model 4. Decoding Algorithm 5. Forward-Backward Algorithm 6. Profile HMMs 7. HMM Parameter Estimation 8. Viterbi Training
Comparative Genomics: Sequence, Structure, and Networks. Bonnie Berger MIT
 Comparative Genomics: Sequence, Structure, and Networks Bonnie Berger MIT Comparative Genomics Look at the same kind of data across species with the hope that areas of high correlation correspond to functional
Graph Theory and Networks in Biology
 Graph Theory and Networks in Biology Oliver Mason and Mark Verwoerd Hamilton Institute, National University of Ireland Maynooth, Co. Kildare, Ireland {oliver.mason, mark.verwoerd}@nuim.ie January 17, 2007
BLAST Database Searching. BME 110: CompBio Tools Todd Lowe April 8, 2010
 BLAST Database Searching BME 110: CompBio Tools Todd Lowe April 8, 2010 Admin Reading: Read chapter 7, and the NCBI Blast Guide and tutorial http://www.ncbi.nlm.nih.gov/blast/why.shtml Read Chapter 8 for
Motivating the need for optimal sequence alignments...
 1 Motivating the need for optimal sequence alignments... 2 3 Note that this actually combines two objectives of optimal sequence alignments: (i) use the score of the alignment o infer homology; (ii) use
THEORY. Based on sequence Length According to the length of sequence being compared it is of following two types
 Exp 11- THEORY Sequence Alignment is a process of aligning two sequences to achieve maximum levels of identity between them. This help to derive functional, structural and evolutionary relationships between
Sequence Alignment (chapter 6)
") Sequence lignment (chapter 6) he biological problem lobal alignment Local alignment Multiple alignment Introduction to bioinformatics, utumn 6 Background: comparative genomics Basic question in biology:
Sequence lignment (chapter 6) he biological problem lobal alignment Local alignment Multiple alignment Introduction to bioinformatics, utumn 6 Background: comparative genomics Basic question in biology:
Orthologs Detection and Applications
 Orthologs Detection and Applications Marcus Lechner Bioinformatics Leipzig 2009-10-23 Marcus Lechner (Bioinformatics Leipzig) Orthologs Detection and Applications 2009-10-23 1 / 25 Table of contents 1
Genomics and bioinformatics summary. Finding genes -- computer searches
 Genomics and bioinformatics summary 1. Gene finding: computer searches, cdnas, ESTs, 2. Microarrays 3. Use BLAST to find homologous sequences 4. Multiple sequence alignments (MSAs) 5. Trees quantify sequence
Phylogenetics. Applications of phylogenetics. Unrooted networks vs. rooted trees. Outline
 Phylogenetics Todd Vision iology 522 March 26, 2007 pplications of phylogenetics Studying organismal or biogeographic history Systematics ating events in the fossil record onservation biology Studying
Chapter 5. Proteomics and the analysis of protein sequence Ⅱ
 Proteomics Chapter 5. Proteomics and the analysis of protein sequence Ⅱ 1 Pairwise similarity searching (1) Figure 5.5: manual alignment One of the amino acids in the top sequence has no equivalent and
Sequence analysis and comparison
 The aim with sequence identification: Sequence analysis and comparison Marjolein Thunnissen Lund September 2012 Is there any known protein sequence that is homologous to mine? Are there any other species
CSE 417T: Introduction to Machine Learning. Final Review. Henry Chai 12/4/18
 CSE 417T: Introduction to Machine Learning Final Review Henry Chai 12/4/18 Overfitting Overfitting is fitting the training data more than is warranted Fitting noise rather than signal 2 Estimating! "#$
Integrative Protein Function Transfer using Factor Graphs and Heterogeneous Data Sources
 Integrative Protein Function Transfer using Factor Graphs and Heterogeneous Data Sources Antonina Mitrofanova New York University antonina@cs.nyu.edu Vladimir Pavlovic Rutgers University vladimir@cs.rutgers.edu
Practical considerations of working with sequencing data
 Practical considerations of working with sequencing data File Types Fastq ->aligner -> reference(genome) coordinates Coordinate files SAM/BAM most complete, contains all of the info in fastq and more!
Phylogenetic trees 07/10/13
 Phylogenetic trees 07/10/13 A tree is the only figure to occur in On the Origin of Species by Charles Darwin. It is a graphical representation of the evolutionary relationships among entities that share
BIOINFORMATICS. Improved Network-based Identification of Protein Orthologs. Nir Yosef a,, Roded Sharan a and William Stafford Noble b
 BIOINFORMATICS Vol. no. 28 Pages 7 Improved Network-based Identification of Protein Orthologs Nir Yosef a,, Roded Sharan a and William Stafford Noble b a School of Computer Science, Tel-Aviv University,
Hidden Markov Models
 Hidden Markov Models Outline 1. CG-Islands 2. The Fair Bet Casino 3. Hidden Markov Model 4. Decoding Algorithm 5. Forward-Backward Algorithm 6. Profile HMMs 7. HMM Parameter Estimation 8. Viterbi Training
Haploid & diploid recombination and their evolutionary impact
 Haploid & diploid recombination and their evolutionary impact W. Garrett Mitchener College of Charleston Mathematics Department MitchenerG@cofc.edu http://mitchenerg.people.cofc.edu Introduction The basis
Introduction to protein alignments
 Introduction to protein alignments Comparative Analysis of Proteins Experimental evidence from one or more proteins can be used to infer function of related protein(s). Gene A Gene X Protein A compare
V 5 Robustness and Modularity
 Bioinformatics 3 V 5 Robustness and Modularity Mon, Oct 29, 2012 Network Robustness Network = set of connections Failure events: loss of edges loss of nodes (together with their edges) loss of connectivity
Bioinformatics 2. Yeast two hybrid. Proteomics. Proteomics
 GENOME Bioinformatics 2 Proteomics protein-gene PROTEOME protein-protein METABOLISM Slide from http://www.nd.edu/~networks/ Citrate Cycle Bio-chemical reactions What is it? Proteomics Reveal protein Protein