Measuring semantic similarities by combining gene ontology annotations and gene co-function networks
|
|
|
- Lorraine Mathews
- 5 years ago
- Views:
Transcription
1 BMC Bioinformatics This Provisional PDF corresponds to the article as it appeared upon acceptance. Fully formatted PDF and full text (HTML) versions will be made available soon. Measuring semantic similarities by combining gene ontology annotations and gene co-function networks BMC Bioinformatics Sample 5102() 16:4 doi: /s Jiajie Peng Sahra Uygun Taehyong Kim Yadong Wang Seung Y Rhee (srhee@carnegiescience.edu) Jin Chen (jinchen@msu.edu) Sample ISSN Article type Methodology article Submission date 25 June 2014 Acceptance date 26 January 2015 Article URL Like all articles in BMC journals, this peer-reviewed article can be downloaded, printed and distributed freely for any purposes (see copyright notice below). Articles in BMC journals are listed in PubMed and archived at PubMed Central. For information about publishing your research in BMC journals or any BioMed Central journal, go to Peng et al.; licensee BioMed Central. This is an Open Access article distributed under the terms of the Creative Commons Attribution License ( which permits unrestricted use, distribution, and reproduction in any medium, provided the original work is properly credited. The Creative Commons Public Domain Dedication waiver ( applies to the data made available in this article, unless otherwise stated.
2 Measuring semantic similarities by combining gene ontology annotations and gene co-function networks Jiajie Peng 1,2 Sahra Uygun 2,3 Taehyong Kim 4 thkim04@gmail.com Yadong Wang 1* * Corresponding author ydwang@hit.edu.cn Seung Y Rhee 4* * Corresponding author srhee@carnegiescience.edu Jin Chen 2,5,* * Corresponding author jinchen@msu.edu 1 School of Computer Science and Technology, Harbin Institute of Technology, Harbin, China 2 Department of Energy Plant Research Laboratory, Michigan State University, East Lansing, MI 48824, USA 3 Genetics Program, Michigan State University, East Lansing, MI 48824, USA Abstract Background 4 Department of Plant Biology, Carnegie Institution for Science, 260 Panama St, Stanford, CA 94305, USA 5 Department of Computer Science and Engineering, Michigan State University, East Lansing, MI 48824, USA Gene Ontology (GO) has been used widely to study functional relationships between genes. The current semantic similarity measures rely only on GO annotations and GO structure. This limits the power of GO-based similarity because of the limited proportion of genes that are annotated to GO in most organisms.
3 Results We introduce a novel approach called NETSIM (network-based similarity measure) that incorporates information from gene co-function networks in addition to using the GO structure and annotations. Using metabolic reaction maps of yeast, Arabidopsis, and human, we demonstrate that NETSIM can improve the accuracy of GO term similarities. We also demonstrate that NETSIM works well even for genomes with sparser gene annotation data. We applied NETSIM on large Arabidopsis gene families such as cytochrome P450 monooxygenases to group the members functionally and show that this grouping could facilitate functional characterization of genes in these families. Conclusions Using NETSIM as an example, we demonstrated that the performance of a semantic similarity measure could be significantly improved after incorporating genome-specific information. NETSIM incorporates both GO annotations and gene co-function network data as a priori knowledge in the model. Therefore, functional similarities of GO terms that are not explicitly encoded in GO but are relevant in a taxon-specific manner become measurable when GO annotations are limited. Supplementary information and software are available at Keywords Co-Function Network, Gene Ontology, Semantic Similarity, Gene Function Annotation Background Gene Ontology (GO) is a popular vocabulary system for systematically describing the attributes of biological entities in three key domains that are shared by all organisms: molecular function (e.g. biochemical function of the gene product), biological process (e.g. the biological goal to which the gene product contributes) and cellular component (e.g. location of the gene product in the cell) [1]. In each domain, the ontology is structured as a directed acyclic graph to reflect the complex hierarchy of biological events and locations (Figure 1A). Functional analysis based on the similarity of GO terms can lead to new insights about gene functional studies [2], such as gene clustering [3], high-throughput data quality assessment [4], and gene function inference [5,6]. Figure 1 An example of GO structure and annotation, gene co-function network, and the functional distance. (A) GO structure and annotation. t a t j and root are GO terms, edges are the is-a (solid line) or part-of (dashed line) relations between these terms, and {g 1 g 13 } in boxes are the sets of genes annotated to the corresponding terms. (B) An example of a co-function network. Each node and edge represents a gene and a functional association between the genes, respectively. The number at each edge represents a confidence score that measures the probability of an interaction to represent a true functional linkage between the genes. (C) An example of the functional distance between two gene sets. G a (or G b ) is the set of genes annotated to t a (or t b ) or its descendants. The number at each edge represents the functional distance between the genes where 0 = functional identity and 1 = no functional relationship.
4 Despite considerable progress on GO based semantic measurements [7-13], our understanding of the semantic relationships between GO terms is still limited. For example, the process response to water deprivation (GO: ) is intimately related to the following processes in plants: photosynthesis (GO: ); anthocyanin biosynthesis (GO: ); stomatal closure (GO: ); leaf development (GO: ); and root development (GO: ). However, none of these terms are linked to response to water deprivation in GO nor should they be, since these processes are not likely to be associated with response to water deprivation in non-plant organisms. By combining GO with genome specific information such as the co-occurrences of GO annotations in genomes [14], similarities between functions with genome-specific relationships, which are not explicitly represented in GO, may be more accurately scored. We hypothesize that by incorporating a co-function network of genes as additional biological knowledge, we can develop novel insights into GO term relationships. A gene co-function network is built with omics data using a confidence score that measures the probability of an interaction to represent a true functional linkage between two genes based on benchmarked data (Figure 1B) [15-17]. To test this hypothesis, we developed a novel approach called NETSIM (network-based similarity measure) that measures functional similarities between GO terms by incorporating information from gene co-function networks in addition to using the GO structure and annotations. Semantic similarity measures have been applied on GO [7-11]. However, these approaches are limited to the topology of the GO structure and the number of annotations to GO terms [14,18]. To date, most genomes have limited functional annotations. For example, only 37% of the Arabidopsis genes are annotated to all three domains of GO based on experimental evidence [19]. Consequently, these approaches may suffer from the limited knowledge encoded in the GO and the limited amount of annotations to GO for most organisms. NETSIM addresses these problems by incorporating gene co-function networks in measuring GO-term based similarities. Using metabolic reaction maps of yeast, Arabidopsis, and human, we demonstrate that GO term relationships can be better scored by incorporating additional biological information from gene co-function networks. We also demonstrate that NETSIM works well even for genomes with sparser gene annotation data. We applied NETSIM on large Arabidopsis gene families such as cytochrome P450 monooxygenases to group the members functionally and show that this grouping could facilitate functional characterization of genes in these families. Methods NETSIM: A new approach to study GO term relationships NETSIM measures the similarity between a pair of GO terms within a category in three steps. First, it calculates the functional distance between a pair of gene sets that are annotated to a pair of GO terms using a gene co-function network. Second, it calculates GO term similarity based on the annotations to the common parent term, but propagates only the annotations to the terms that lie on the paths from the two GO terms to the common parent term. Third, it computes similarity between the two GO terms based on the functional distance of annotated genes from co-function networks and the path-constrained GO annotation.
5 Step 1: Functional distance between gene sets Given any two terms t a and t b within a GO category (e.g. in Figure 1A), we define the Gene Set Distance D(t a, t b ) to measure the relationship between the sets of genes annotated to t a and t b in a gene co-function network by a modified Czekanovski-Dice distance [20]. The Gene Set Distance D(t a, t b ) represents the functional distance between two GO terms t a and t b based on the functional distances of their annotated gene sets G a and G b in the gene cofunction network. D(t a, t b ) is defined as: ( ) D t, t a b = d + dij g G g G ij g G g G i a j b i b j a 2 G G d d a b g G g G ij g G g G ij i a j b i b j a (1) where G a G b is the union of G a and G b, d represents the distance between g i and gene g j G ij b set G b. For any two genes g i and g j in a co-function network NET, d ij is defined as: 0; i = j d ij = 1; < g i, g j > NET and i j 1 conf ( g i, g j ); else (2) where < g i, g j > is an edge between g i and g j in a gene co-function network NET, and conf(g i, g j ) is the confidence score of edge < g i, g j > in NET, conf(g i, g j ) [0, 1]. In the illustrative example in Figure 1C, the distance between g 1 and G b is Π 1j = = 0, indicating g 1 and G b are strongly associated because g 1 is one of the genes in G b. Likewise, because g 2 does not connect to any of the genes in G b in the gene co-function network, the distance between g 2 and G b is Π 2j = 1 1 1= 1, meaning that g 2 is not related to G b. d gj G b Step 2: Path-constrained annotation In the LCA (lowest common ancestor)-based measures [7,8], all of the descendants of LCA are considered. However, any term that lies outside of the paths leading from the terms being compared to the LCA may not directly contribute to the similarity of the two terms. To relate terms to each other more specifically, we defined Path-Constrained Annotation U(t a,t b,p) to use a subset of the terms most relevant to the terms being compared, i.e., the union of three subsets: the genes annotated to the two given terms t a and t b, and the genes annotated to a common parent term p and its descendants that reside only on the paths from t a or t b to the parent term. In the example given in Figure 1A, t i is the LCA of t a and t b. To measure the similarity between t a and t b, NETSIM considers only the most relevant terms rather than counting all of the descendants of the LCA, i.e., {t a, t b, t c, t e, t h, t i }, as all other LCA based measures do. For the common ancestor t i, NETSIM counts the terms on the path from t a or t b to t i and all the descendants of t a and t b, i.e., {t a, t b, t c, t e, t h, t i }. Similarly, for the common ancestor t j, NETSIM counts {t a, t b, t c, t f, t j }. Therefore, U(t a, t b, t j ) = {g 1, g 2, g 3, g 5, g 6, g 7, g 10, g 11 } does not contain any genes annotated to t d or t g. Removing such genes reduces less relevant information and helps increase the performance of a term similarity measure. d g j G b
6 Step 3: Term-to-Term similarity Given two GO terms t a and t b and their common ancestor p, the NETSIM similarity between the two terms, S(t a, t b, p), is defined as: 2log G 2log f ( t,, ) (, ) a tb p h ta t G b p S( t a,t b,p ) = (1 ) 2log G (log G + log G ) G G a b (3) where G p (or G) is the set of genes annotated to p (or the root term) and its descendants, f(t a, t b, p) measures the importance of the path-constrained annotation, and h(t a, t b ) weights the specificity of the common parent p: and ( ) ( ) f t, t, p = D(t, t ) U t, t, p + (1 D(t, t ) ) G G (4) 2 2 a b a b a b a b a b ( ) 2 2 h t a, t b D(t a, t b ) G (1 D(t a,t b ) ) max( Ga, Gb ) = + (5) In Equation 3, the first part measures the relative distance from t a and t b to p, and the second part (representing the specificity of p) measures the distance from the root to p in the GO structure. Unlike the existing measures, NETSIM incorporates both GO and gene co-function network data. In Equation 4, D(t a, t b ) measures the functional distance between two sets of genes annotated to t a and t b in the gene co-function network. If the two sets of genes are not tightly associated in the gene co-function network, D(t a, t b ) is close to 1, leading to small similarity scores. Equation 5 measures the effect of D(t a, t b ) on the distance between p and the root. If D(t a, t b ) is close to 1, then h(t a, t b ) is close to G, resulting in a shorter distance between p and the root. If D(t a, t b ) is close to 0, then h(t a, t b ) is close to max( G a, G b ), leading to longer distance between p and the root. Mathematically, the Schlicker and Resnik measures [7,8] are two special cases of NETSIM. When the gene co-function network data is not available, G a G b, and U(t a, t b, p) = G p. Therefore, D(t a, t b ) = 1 and S(t a, t b, p) = 2IC(p)/(IC(t a ) + IC(t b )) (1 G p / G ), which is identical to the Schlicker measure. On the other hand, if t a = t b, then G a = G b and D(t a, t b ) = 0. Therefore, S(t a, t b, p) = 1 G p 2 / G 2, which is proportional to the Resink measure where S(t a, t b, p) is determined solely by the specificity of p in the GO structure. NETSIM implementation and data preparation NETSIM was implemented with Java JDK 1.6 and JUNG library (jung.sourceforge.net) [21] (see Additional file 1 for pseudo code and efficiency improvement). GO data was downloaded from the GO website in June 2011 ( In this paper, we used non-iea annotations for performance evaluation, and only the is-a and part-of relationships were used. In the software, the user can choose to include IEA annotations. Gene co-function networks were downloaded from YeastNet ( [15], AraNet ( [16], and
7 HumanNet ( [17] in July YeastNet has 102,803 linkages among 5,483 yeast genes, AraNet has 1,062,222 linkages among 19,647 genes and HumanNet has 476,399 linkages among 16,243 genes. The metabolic networks were constructed by extracting reactions, enzymes, genes, and compounds from metabolic pathway databases YeastCyc 15.0 (993 reactions) [22], AraCyc 8.0 (2689 reactions) [23], and HumanCyc 16.1 (2140 reactions) [24]. All three databases were generated using the PathoLogic software, which does not rely on GO annotations [25]. Briefly, proteins that are annotated to Enzyme Commission (EC) numbers are used as input to predict pathways from a reference pathway database called MetaCyc [26]. For HumanCyc, the enzyme data were compiled from the Ensembl database, the LocusLink database and GenBank [24]. AraCyc annotations are derived from manual curation of experimental data or based on sequence-similarity to reference enzyme sequences [23]. Although the initial YeastCyc build was based on GO molecular function annotations, each pathway in YeastCyc has been manually reviewed and the predicted pathways that did not have any experimental evidence were removed ( We converted the reactions in the pathway databases into metabolic networks by connecting the reactions if they shared at least one compound. We did not use 24 currency compounds to reconstruct the metabolic network because they create biologically unrealistic shortcuts on link-based analyses by interconnecting many reactions in the network (Additional file 2). We then created a gene map by pairing genes if their encoding enzymes catalyzed the same reaction or directly adjacent reactions in the metabolic network. We downloaded high-confidence genetic interaction (GI) network of yeast containing 194 positive GIs and 529 negative GIs ( [27]. We built two non-gi sets by randomly choosing 194 and 529 non-gi pairs from the same website which have the same number of gene pairs as the positive GI set and negative GI set respectively, retaining the same portion of the GI pairs belonging to the same pathway in YeastCyc (Additional files 3 and 4). Arabidopsis gene family cytochrome P450 monooxygenases (P450) [28] was downloaded from TAIR ( Receptor-like kinase gene families (RLK) were downloaded from [29], and transcription factor families (TF) were downloaded from Plant TFDB ( [30]. Performance evaluation criteria While there are numerous methods to evaluate gene-to-gene relationships [31], there is still no objective way to assess GO term-to-term relationships. Therefore, we evaluated the performance of NETSIM using biological knowledge at the gene level. The same evaluation method is also used in the existing GO term similarity assessments such as Schlicker et al and Wang et al [8,9]. Specifically, for all the measures to compare, we adopted the same method to aggregate the term-to-term similarities to gene-to-gene similarities and compared them with the prior knowledge. Once the similarities between all GO term pairs have been computed in an organism, the functional similarity between any two genes can be calculated based on the aggregation of the similarities between the GO terms that are annotated to them. Given two genes g i and g j and their GO term annotation sets T i and T j, we compute the gene-to-gene similarity using the leave-one-out approach to avoid the circular use of data. For example, to compute the gene
8 similarity between g 6 and g 7 in Figure 1A, we first remove the two genes from the gene sets annotated to terms t b, t e, t f. The gene sets that are annotated to terms t b, t e, t f are then {g 1, g 5 }, {g 1, g 5, g 8 }, and {g 1, g 2, g 3, g 4 } respectively. To compute the gene similarity, we aggregate all the relevant term similarities by adopting the gene similarity measure in [9]: ( i j ) G S g, g = (, j ) + Sim ( t, Ti ) Sim t T t Ti t T j T i + T j (6) where for each t T x, Sim ( t, T y ) = max (, t ) y T S t t y y representing the highest similarity between t and term set T y, and only the non-zero Sim(t, T y ) values are counted. S(t, t y ) is the maximum value of S(t, t y,p) for all the common ancestor (p) of t and t y. The efficiency calculation of S(t, t y,p) is described in Additional file 1. We evaluated the performance of NETSIM by comparing the GO-based distances between the genes in non-adjacent metabolic reactions (inter-distance) and the GO-based distances between the genes in adjacent reactions (intra-distance) in a metabolic reaction map. A biological process such as the synthesis of an amino acid (amino acid biosynthesis pathway) usually contains multiple reactions. The genes in two adjacent reactions should have similar biological process annotations, because the product of one reaction is the substrate of the other reaction, whereas the genes in non-adjacent reactions are more likely to be involved in different biological processes. With this criterion, we evaluated the performance of NETSIM by comparing the GO-based distances between the genes in non-adjacent reactions (interdistance) and the GO-based distances between the genes in adjacent reactions (intradistance). The difference in the distance between the former and the latter was used as a benchmark to evaluate the performance of the six selected gene similarity measures quantitatively. Mathematically, we borrowed the concept of the logged fold change (LFC) from gene expression studies [32] and defined it as follows: let g be a gene involved in the reaction r, G(r) be set of genes involved in r, the LFC score of r is computed with following equation: LFC ( r ) = (, ) lfc g r g G ( r ) G ( r ) (7) where for every gene g G(r), lfc(g,r) is computed as the logged ratio between its distances to every gene in the set of genes involved in adjacent reactions of r (G adj (r)) and its distances to every gene in the set of genes involved in non-adjacent reactions of r(g non (r)): (, ) lfc g r adj g * Gadj ( r ) ' ( ) * ( ) 1/ G non ( r ) (1 GS g, g + c) g ' Gnon ( r ) = ln 1/ G ( r ) (1 GS g, g + c) (8) where inter is the average distance from g to every gene in G non (r), and intra is the average distance from g to every other gene in G adj (r), and c is a small positive constant. If the LFC score is greater than 0, then the intra-distances are, on average, smaller than the interdistances. To reduce ambiguity, the genes that belong to both G adj (r) and G non (r) were removed from both G adj (r) and G non (r) before the computation of LFC. Similarly, the overlapping genes between G(r) and G adj (r) or between G(r) and G non (r) were removed from
9 G adj (r) or G non (r), respectively. Based on the definition of LFC in Equation 7, the higher the LFC score, the better the corresponding GO gene-to-gene measure is. Genome-specificity measurement In order to test whether adding co-function networks make the GO term similarities more genome-specific, we developed a genome-specificity measurement. First, we generated NETSIM term-to-term similarity scores with and without the co-function network. Second, we computed the ratio between the NETSIM scores with or without co-function data. Mathematically, given k organisms O = {o 1, o 2,, o k }, we defined the average of GO term similarity difference between any two species as the inter-genome GO similarity difference of term pair (t i, t j ) using co-function network: Diff ( t, t ) = S ( t, t, o ) S ( t, t, o ). Similarly, the inter-genome GO net i j net i j m net i j n 1 m, n k, m n similarity difference of term pair (t i, t j ) without co-function network is Diff ( t, t ) = S ( t, t, o ) S ( t, t, o ). The genome-specificity nonet i j nonet i j m nonet i j n 1 m, n k, m n measurement Diff ( t, t ) = S ( t, t, o ) S ( t, t, o ) S ( t, t, o ) S ( t, t, o ). i j net i j m net i j n nonet i j m nonet i j n 1 mn, k, m n 1 mn, k, m n is Other GO-based semantic similarity measures used for comparison Mathematically, a GO term is a direct child of another term if and only if the former term is a subtype (is-a relationship), a component (part-of relationship), or a regulator (regulates relationship) of the latter one (e.g. in Figure 1A t a is a direct child of t f with is-a relationship). The explicitly defined and structured representation of biological terms of GO allows the measurement of similarities between two terms and between two genes that are annotated to the terms. By combining Information Content (IC) with the ontology structure, Resnik defined a taxonomic similarity as the IC of the lowest common ancestor (LCA) [7], which is then widely used as a similarity measure for GO terms. Let t be a GO term, the information content of t is defined as IC(t) = -log( G t / G ), where G t and G are sets of genes annotated to t and the root term (and all its descendants). Let t a and t b be two GO terms in the same category and G LCA be the set of gene products annotated to LCA of t a and t b, the similarity between t a and t b is defined as the information content of LCA: GLCA Sim Resnik ( ta, tb ) = IC ( LCA) = log (9) G The Resnik measure considers the specificity of the LCA but not the distance from the two terms to their LCA. As a result, pairs of terms that share the same LCA but from different levels of the GO hierarchy can yield the same semantic similarities. Such pairs are therefore not distinguishable from the term pairs that are both close to the LCA. To incorporate distances from two given terms to their LCA and the distance from LCA to the root,
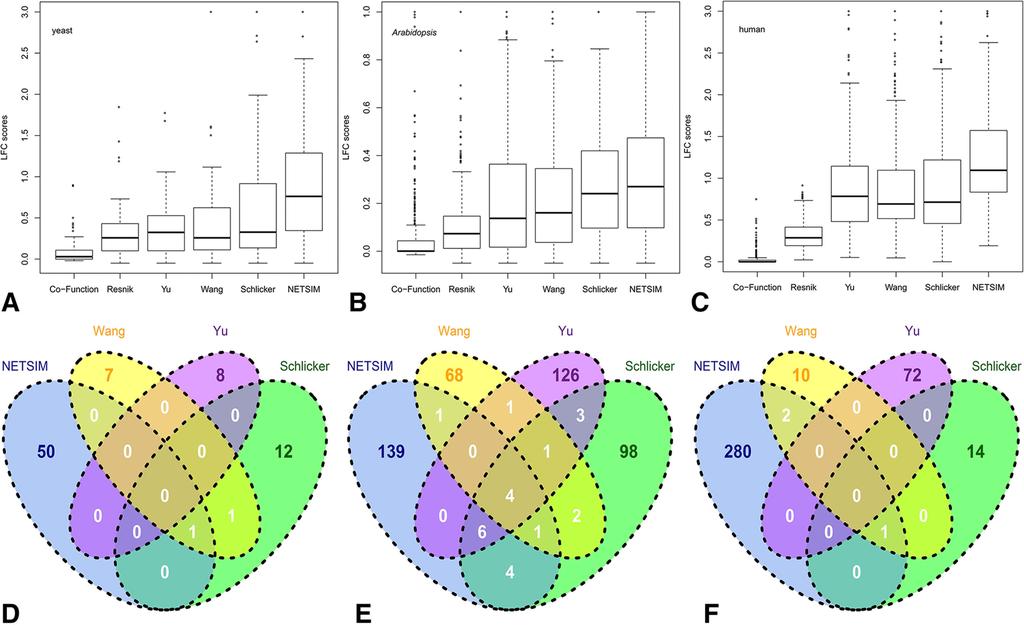
10 Schlicker et al. normalized the Resnik measure based on the information content of t a and t b, and adjusted the overall score with a weighting function: 2 IC( LCA) GLCA Sim Schlicker ( ta, tb ) = (1 ) IC t + IC( t ) G ( ) a b (10) The first part of Equation 10 measures the relative distance from t a and t b to their LCA, and the second part (weighting function) measures the specificity of LCA in an ontology [8]. Functional similarities of yeast genes using the Schlicker measure correlated well with the established protein sequence similarity approaches [8]. In addition to the LCA based measures, Wang et al. proposed a measure that considers the topology of the GO graph by taking into account all of the parent terms (instead of just the LCA), but not the gene annotations [9]. Given a term t a and its parent term p in the GO, the semantic contribution of p to t a, denoted as S ta,p, is defined as the maximal semantic contribution of the paths from t a to p. Equation 11 defines the GO term similarity in the Wang measure where P a (or P b ) are the sets of all the parents of t a (or t b ). This measure performed significantly better than the Resnik measure on yeast genes [9]. Wang ( t t ) Sim, a b = ( St + S ) p Pa Pb a, p tb, p S + S t P t a a, p t P t b b, p (11) In summary, the existing GO term similarity measures are purely dependent on the GO structure, and cannot integrate GO with other biological information for providing more accurate term-to-term similarity measures. Results and discussion Performance evaluation using metabolic reaction maps We evaluated the performance NETSIM by comparing the GO-based distances between the genes annotated to non-adjacent reactions (inter-distance) or between the genes annotated to adjacent reactions (intra-distance) of the metabolic networks of yeast (2,718 links between 546 reactions), Arabidopsis (10,105 links between 1,196 reactions), and human (17,469 links between 1,652 reactions) (Additional files 5, 6 and 7). Reactions with only one gene were removed, resulting in 85 yeast, 493 Arabidopsis, and 379 human reactions. We used logged fold change (LFC) between intra- and inter-distance as a benchmark to compare the performance of six gene similarity measures quantitatively. We subjected 223 yeast, 1,769 Arabidopsis, and 2,049 human genes with at least one non- IEA GO annotation in the biological process category and associated to a reaction in the metabolic reaction maps to NETSIM, previously published measures [7-9,33], and the confidence scores directly obtained from the gene co-function networks to generate gene-togene functional similarities. In all the tests, NETSIM performed the best and this improvement was robust to the abundance of gene co-function network data. In yeast, the median LFC score of NETSIM was
11 higher than that of all the other measures (Figure 2A, Table 1), indicating that functional similarities determined by NETSIM corroborated the best with the reaction map. NETSIM also showed the highest first and third quartile LFC scores. Comparing the LFC scores from the six measures for each reaction showed that NETSIM performed the best in 50 out of 85 reactions with the Schlicker measure as the runner-up, being the best in 12 reactions (Figure 2D). We also tested NETSIM on Arabidopsis and human reaction maps that have fewer GO annotations and smaller and sparser co-function networks. In Arabidopsis, the median LFC score of NETSIM was also higher than that of all the other measures (Figure 2B, Table 1). NETSIM showed the highest first and third quartile LFC scores, performing the best in 139 out of total 493 reactions, while the Yu measure performs the best in 126 reactions (Figure 2E). For the human data, the median LFC scores of NETSIM was 1.10, distinctly higher than the median scores of all other measures (Figure 2C, Table 1). NETSIM performed the best in 280 out of 379 reactions while Yu measure was the runner-up, being the best in 72 reactions (Figure 2F). Furthermore, NETSIM s performance was significantly higher from the performances of all the other measures (Tukey multiple comparison test, adjusted p-value < 0.05, Additional files 8 and 9) in all the analyses, except for the Schlicker measure on Arabidopsis. To test the effect of including IEA annotations, we compared all the measures using all the GO annotations including IEA on yeast data. Additional file 10 showed both NETSIM and Yu performed better than the other measures on yeast. Figure 2 Performance comparison on Log-transformed Fold Change (LFC) scores of similarity measures on GO s biological process terms in yeast, Arabidopsis, and human. Distributions of Log-transformed Fold Change (LFC) scores of similarity measures on GO s biological process terms in yeast (A), Arabidopsis (B), and human (C). The top and bottom of the boxes represent 75 th and 25 th percentiles, dark lines are the median, top and bottom whiskers represent greatest and lowest values except outliers. Circles represent outliers that are larger than the sum of 75 th and 1.5 interquartile range. Number of reactions for which NETSIM, Wang, Yu, and Schlicker measures performed the best for yeast (D), Arabidopsis (E), and human (F). Table 1 Comparison of NETSIM s performance to other similarity measures Similarity Data type used Median (25th Percentile) LFC score Measure Yeast Arabidopsis human co-function Co-function network 0.03(0.00) 0.00(0.00) 0.00(0.00) Resnik GO annotation 0.26(0.10) 0.07(0.01) 0.29(0.19) Yu GO annotation 0.32(0.10) 0.14(0.02) 0.78(0.48) Wang GO annotation 0.26(0.11) 0.16(0.04) 0.69(0.52) Schlicker GO annotation 0.33(0.14) 0.24(0.10) 0.71(0.46) NETSIM GO annotation, 0.76(0.35) 0.27(0.10) 1.10(0.83) co-function network Comparison of NETSIM s performance to other similarity measures based on the median and the first quartile of Log-transformed Fold Change (LFC) scores. Numbers in bold indicate the best performance for each species. In this evaluation, we compared the adjacent and non-adjacent reactions of metabolic networks. However, a biological process, generally composed of larger groups of molecular functions, may contain more than two reactions and therefore genes responsible for close but non-adjacent reactions may also have similar biological process annotations. Therefore, we examined the performance of all the measures between various distances of the reactions. Additional file 11 showed that the averaged LFC scores of all the measures increase proportionally with reaction path length, and NETSIM has the highest LFC score at every
12 reaction path length. In summary, NETSIM is a reliable term-term measure that performed the best in the majority of the reactions for all three species. Performance evaluation using yeast genetic interaction We further tested the performance of NETSIM using genetic interaction (GI) data of yeast metabolic enzymes [27]. A genetic interaction is a phenomenon where mutations in two genes produce a non-additive phenotype in light of each mutation s individual effects and can reveal functional relationships between genes and pathways [34]. GI can be calculated based on the deviation of the double-mutant phenotype from the product of the corresponding single-mutant phenotypes [27]. We tested whether the gene-to-gene similarity computed with NETSIM would correlate with the GI interaction scores. We used 82 genes that are involved in 32 positive GIs or 28 negative GIs [27], in which two genes in a GI are in the same metabolic pathways in YeastCyc. We also used 307 genes involved in 162 positive GIs or 501 negative GIs, in which two genes in a GI are in different pathways. The distributions of NETSIM similarity scores were far from random in both the positive (alleviating) and negative (aggravating) GI sets (p-value 5e-06 (positive GIs vs. random) and p-value 8e-08 (negative GIs vs. random), Kolmogorov-Smirnov test [35], Figure 3A and B). In addition, there is a strong correlation between the genetic interaction and gene-to-gene similarity computed with NETSIM for both positive and negative GI pairs (polynomial model with R-squared 0.97 for both positive and negative GI pairs, Figure 3C and D). This suggests that NETSIM could be used to predict genetic interactions in genomes that lack genetic interaction information. Figure 3 Performance comparison on yeast genetic interaction data. Cumulative distributions of NETSIM-based gene similarity scores of positive (A) and negative (B) genetic interactions in yeast. The blue line represents randomly selected non-interaction pairs. The red line represents positive or negative genetic interactions. Correlation between NETSIMbased gene similarity scores and positive (C) or negative (D) genetic interactions in yeast. In C and D, the y-axis is percentage of genetic interaction pairs in the selected gene pairs with their NETSIM scores larger than a given threshold which varies in the x-axis. The red line is the polynomial model fitting line. Performance evaluation of each step of NETSIM In order to evaluate the performance of each step of NETSIM, we compared NETSIM with three versions of NETSIM, each with a different approach in step 1, 2 or 3, on yeast data. To test the performance of our co-function integration scheme, we created NETSIM_v1where the summed weights of all the edges in a co-function network between two gene sets G a and G b were normalized with Equation 12 (to compare with Equation 1). To test the effect of pathconstrained annotations, we created NETSIM_v2 that uses all the GO annotations without path-based annotation filtering. To test the performance of our scoring scheme in step 3, we created NETSIM_v3 that uses a scoring function similar to the Schlicker measure with Equation 13 (to compare with Equation 3): ( ) D t, t a b = gi Ga G a g j Gb G b d ij (12)
13 2log G 2log f ( t,, ) a tb p Gp S( t a, t b, p ) = (1 ) 2 log G (log G + log G ) G a b (13) Figure 4 shows that NETSIM is clearly better than all the three versions, indicating that each step in NETSIM contributes to NETSIM s performance and have been appropriately designed. It also shows that the noise reduction by constraining the annotation information (Step 2) is the most important step in improving NETSIM performance. Figure 4 Performance evaluation by modifying each step of NETSIM. Three different versions of NETSIM (v1, v2 and v3) are compared on yeast. The three versions correspond to the different approaches in NETSIM step 1 Functional Distance between Gene Sets (v1), step 2 Path-Constrained Annotation (v2) and step 3 Term-to-Term Similarity respectively (v3). Effects of NETSIM components NETSIM relies on the co-function network, GO structure, and GO annotations. To determine the factors that control NETSIM s performance, we re-ran NETSIM by varying the GO annotation and co-function network sizes of yeast, which has the most comprehensive annotation and co-function network. We tested whether changing the gene annotation coverage (number of annotations per GO term) would affect NETSIM s performance by randomly deleting the biological process annotations. To change the gene annotation coverage (number of annotations per GO term), we randomly deleted yeast BP gene annotations. The random process was repeated 1,000 times at each tested coverage level. For every gene we kept at least one annotation during the random deletion process, in order to use the same set of genes to compare different coverage levels. We varied the co-function network density by randomly deleting edges. The random deletion process was repeated 1,000 times at each tested density level. We varied the co-function network quality by randomly swapping the edges in the original network. To generate a low quality network, we randomly swapped half of the existing edges in the original network. A fully randomized network was generated by swapping the edges until none of the original edges existed. Each type of network was generated 1,000 times. The performance of NETSIM decreased steadily with the reduction of gene annotations, but there was no significant difference among different sizes (p-value > 0.05, Tukey s multiple comparison test, Figure 5A, Additional file 12). In addition, the median LFC score of NETSIM at 50% annotation coverage was still higher than the score from the best available measure (Schlicker), indicating that the co-function network is substitutable to GO annotations to a certain degree. This is important because the gene annotation coverage is usually low for the less-studied genomes, but the co-function networks learned from omics data are rapidly increasing [36]. Figure 5 Distribution of NETSIM-based LFC scores on different input network data. Distribution of NETSIM-based LFC scores using the yeast co-function network and GO biological process annotation data on different GO annotation coverage (A), co-function network density (B), and co-function network quality (C). Low quality network means 50% of the links were randomized, and Randomized means 100% of the links were randomized.
14 Since the co-function network was substitutable to GO annotations, we looked for network factors on which the performance of NETSIM depended the most. We tested network density (proportion of selected connections to all connections in the network) and network quality (proportion of original connections to randomized connections), by manipulating the yeast co-function network. We varied the yeast co-function network density by randomly deleting the edges from the full net (100%) to no net (0%), and then applied NETSIM on the sparser networks. Decreasing the network density reduced the LFC scores of NETSIM. However, the difference in performance was not significant (adjusted p-value > 0.05, Tukey multiple comparison test, Figure 5B and Additional file 12), which indicates that the network density was not a key factor on which the performance of NETSIM depended the most. Next, we examined the effect of varying the yeast co-function network quality on NETSIM s performance. The low quality network (half of the existing edges swapped) and the fully randomized network affected NETSIM s performance significantly (adjusted p-value < 0.05, Tukey multiple comparison test, Figure 5C and Additional file 12), which indicates that the network quality is a key factor on which the performance of NETSIM depended the most. In summary, the co-function network is substitutable to GO annotations to a certain degree and the network quality is a key feature that affects the performance of NETSIM. For the lessstudied genomes, NETSIM, which relies on both the GO infrastructure and co-function network data, can take advantage of both the limited but precious GO knowledge and abundant co-function network data to provide higher quality term-to-term relationships. To test the extent of information redundancy between GO annotations and co-function networks, we calculated the number of the connected genes in a co-function network that share the same GO annotations, and divided it by the total number of edges in the network. The information redundancy ratio of YeastNet, AraNet, and HumanNet is 51.6%, 35.0% and 43.2%, respectively. This indicates that a co-function network can provide a substantial amount of extra information that is not contained in the GO. This explains why NETSIM performance drops significantly if the co-function network is removed from it (Figure 5B). Adding more orthogonal datasets such as physical interaction data [37,38] will likely improve the performance of NETSIM. Genome-specific GO term relationships We explored whether using co-function networks not only increase the performance of GO term similarities, but also enables the identification of genome-specific GO term relationships. Genome-specificity of GO term similarity is defined as the difference in GO term similarity between organisms. We generated the NETSIM GO similarity scores with and without the co-function network in the three organisms, yeast, Arabidopsis, and human. We then computed the genome-specificity scores for all GO term pairs to test whether adding cofunction networks makes the GO term similarities more genome-specific. A GO term pair was deemed genome-specific if its genome-specificity score is significantly different from the averaged genome-specificity score of all GO term pairs. Using t-test, 15,296 significant genome-specific term pairs (FDR < 0.01) were identified (Additional file 13). Categorizing Arabidopsis genes using NETSIM Semantic similarity measures have wide-ranging applications, including analyzing clusters of genes and proteins from omics experiments [3], assessing the quality of high-throughput data [4], and inferring functions of genes [4]. Here, we used NETSIM to functionally categorize Arabidopsis genes belonging to three large families: cytochrome P450
15 monooxygenases (P450) [28], receptor-like kinase gene families [29], or transcription factor families (TF) [39]. First, NETSIM was applied to all gene pairs of Arabidopsis gene family P450 and the resulting similarity matrix was used to generate a similarity tree using hierarchical clustering [40] function called hclust in R (version 2.15) with default parameters. For comparison, a dendrogram for P450 gene family was generated based on protein sequence similarities with the same clustering software. The protein sequence similarities were calculated using bl2seq in BLAST [41]. P450 is a large and diverse group of enzymes involved in many pathways including drug metabolism in animals [42] and specialized metabolism in plants [28]. Despite their importance, only few genes have been characterized experimentally. In Arabidopsis, over 70% of P450s still await functional characterization [28]. We asked whether functional similarities measured with NETSIM could help infer functions of the P450s that have not yet been assigned to a specific metabolic pathway. There are 272 P450 genes in Arabidopsis, 73 of which have non-iea GO annotations to biological process terms [19]. These 73 genes are grouped into 31 families and 46 subfamilies based on sequence similarity [28]. However, 17 of the 73 genes have not yet been assigned a biochemical function and placed in the Arabidopsis metabolic network AraCyc [43]. To infer functions of the 17 genes, we computed functional similarities for all the 73 genes with GO biological process terms using NETSIM and grouped them into clusters using a hierarchical clustering algorithm [44] (Figure 6). In addition, a sequence based tree was generated using the same clustering algorithm (Additional file 14). Six types of secondary metabolism are represented in these trees (Figure 6). The function-based and sequence-based trees reveal some similarities but mostly striking differences. Both trees group the genes into four large clusters, but with different members in each cluster. For example, members of the auxin/camalexin/glucosinolate pathways are clustered in the function-based tree (Figure 6, letter F) whereas they are scattered in the sequence-based tree (Additional file 14). Similarly, genes involved in glucosinolate synthesis from tryptophan and methionine are grouped together in the function-based tree whereas they are separated in the sequence-based tree (T and V in Figure 6 and Additional file 14). An exception is brassinosteroid pathway whose members are clustered both in the function-based and sequence-based trees (D in Figure 6 and Additional file 14). In addition, the sequence-based tree typically groups genes belonging to the same biochemical pathway only at the leaf nodes (the two most closely related sequences) whereas the function-based tree shows larger consistencies of grouping members of the same biochemical pathway. Figure 6 Hierarchical clustering of Arabidopsis P450 genes with distsances based on NETSIM similarity. The y-axis is 1 minus NETSIM-based gene-to-gene similarity score. The color and letter coding are based on metabolic pathways annotated in AraCyc version 8.0 and are shown in the table. In the function-based P450 tree, 17 genes have not yet been assigned to a metabolic pathway. We can devise different hypotheses from the two trees. For example, CYP81D8 is closest to a known enzyme involved in jasmonic acid metabolism (clustering with CYP94C1 that is involved in this pathway) in the function-based tree, whereas it is most similar to genes
16 involved in glucosinolate metabolism from tryptophan in the sequence-based tree (CYP81F members). Experimental testing of these uncharacterized genes will reveal the true power of these similarity measures to infer function. Adjusted Rand Index (ARI) is a frequently used cluster validation measure that measures the amount of agreement between the clusters and some external, often gold-standard, data [45,46]. ARI assumes the generalized hypergeometric distribution as the model of randomness, so that the expected ARI value of two random clustering results is constant (0.0) [45,46]. ARI can therefore be used to compare the results of different clustering methods. Higher ARI values reflect higher cluster quality with respect to the external criteria. In this paper, we used the metabolic pathways that the experimentally characterized P450s belong to as the external criteria to compare NETSIM based clustering and sequence similarity based clustering. Figure 7 reveals that the ARI scores of NETSIM are consistently higher than the ARI scores of the sequence similarity based clustering results. The best ARI score for NETSIM (0.27) is achieved when the number of the NETSIM based clusters is 15, clearly higher than the corresponding ARI score for sequence similarity based clusters (0.17). The results indicate that NETSIM is better at grouping functions than sequence similarity. Figure 7 Adjusted Rand Index (ARI) scores for NETSIM and sequence based similarities. Comparison of ARI scores for NETSIM and sequence based similarities where the x-axis is the number of clusters that have at least two genes, and the y-axis is the ARI scores. When NETSIM was applied to the other two large families RLK (Additional file 15) and TF (Additional file 16), it produced gene clusters that were distinct from sequence-based clusters as well (Additional files 17 and 18). In summary, the application of NETSIM on Arabidopsis gene families shows that it can redefine subfamilies by dividing or merging sequence-based subfamilies, which may bring new knowledge in gene function discovery. Conclusions GO annotation data has been used widely to measure functional similarity between genes based on GO term similarities, which helps infer functions of uncharacterized genes. However, existing algorithms only use the GO structure and annotations, both of which have much missing information, leading to less accurate term similarity scores. We developed NETSIM based on the notion that incorporating additional biological information may improve the performance of these measures. Incorporation of gene co-function network data clearly helps to improve the performance of the GO term similarity measures when there is abundant gene co-function data. In comparison with the existing algorithms, NETSIM has two advantages. First, both GO annotation and gene co-function network are adopted as a priori knowledge in our model, while existing measures incorporate only GO annotations. Therefore, the functional similarities of GO terms that are not explicitly encoded in GO but are relevant in a taxonspecific manner become measurable when GO annotations are limited. Second, only the annotations to the GO terms that lie on the paths from the given terms to the common parent term are propagated, excluding less relevant information from the GO terms that are children of the LCA but branch out from the paths to the LCA. The existing node-based measures propagate all the descendant annotations to the parent.
17 To demonstrate the advantages of NETSIM over the existing measures, we compared NETSIM with the Resnik, Schlicker, Wang, and Yu measures. We found that NETSIM performed the best in all the tests for yeast, Arabidopsis, and human. We chose these three species for two reasons. First, they have different amounts of annotation; yeast is one of the best annotated organisms based on experimental evidence (85%) [18], while the annotations for Arabidopsis and human (37% and 49%) are still far from saturation [19,47]. Second, they have different sizes and densities of the co-function network data; the density of yeast cofunction network is and the network includes 95% of yeast genes [15], while the density of Arabidopsis co-function network is (10-fold lower than that of yeast) and the network includes 73% of Arabidopsis genes [16]. The density of human co-function network is and the network includes 87% of human genes [17]. In summary, using NETSIM as an example, we demonstrated that the performance of a semantic similarity measure could be significantly improved after incorporating genomespecific information. NETSIM incorporates both GO annotations and gene co-function network data as a priori knowledge in the model. Therefore, functional similarities of GO terms that are not explicitly encoded in GO but are relevant in a taxon-specific manner become measurable when GO annotations are limited. Competing interests The authors declare that they have no competing interests. Authors contributions JC, SR and YW conceived the project. JP, YW, SR, JC designed the algorithm and experiments and prepared the manuscript. JP implemented the algorithm and finished the experiments. SU and TK prepared the experiment data. All authors read and approved the final manuscript. Acknowledgements The authors wish to thank Dr. See-Kiong Ng for useful discussions. This work is supported in part by Chemical Sciences, Geosciences and Biosciences Division, Office of Basic Energy Sciences, Office of Science, U.S. Department of Energy (grant no. DE-FG02-91ER20021) to JC; National Science Foundation (grants IOS , DBI , and MCB ) and U.S. Department of Energy (grant no. BER65472) to SYR; the National High Technology Research and Development Program of China (grant no. 2012AA020404, 2012AA02A602 and 2012AA02A604) to YW; and China Scholarship Council to JP. References 1. Ashburner M, Ball CA, Blake JA, Botstein D, Butler H, Cherry JM, et al. Gene ontology: tool for the unification of biology, The Gene Ontology Consortium. Nat Genet. 2000;25(1): Falcon S, Gentleman R. Using GOstats to test gene lists for GO term association. Bioinformatics. 2007;23(2):257 8.
18 3. Chen JL, Liu Y, Sam LT, Li J, Lussier YA. Evaluation of high-throughput functional categorization of human disease genes. BMC Bioinformatics. 2007;8 Suppl 3:S7. 4. Kemmeren P, Kockelkorn TTJP, Bijma T, Donders R, Holstege FCP. Predicting gene function through systematic analysis and quality assessment of high-throughput data. Bioinformatics. 2005;21(8): Zhu MZ, Gao L, Guo Z, Li YH, Wang D, Wang J, et al. Globally predicting protein functions based on co-expressed protein-protein interaction networks and ontology taxonomy similarities. Gene. 2007;391(1 2): Verspoor K, Cohn J, Mniszewski S, Joslyn C. A categorization approach to automated ontological function annotation. Protein Science. 2006;15(6): Resnik P. Semantic similarity in a taxonomy: An information-based measure and its application to problems of ambiguity in natural language. J Art Intel Res. 1999;11: Schlicker A, Domingues FS, Rahnenfuhrer J, Lengauer T. A new measure for functional similarity of gene products based on Gene Ontology. BMC Bioinformatics. 2006;7: Wang JZ, Du ZD, Payattakool R, Yu PS, Chen CF. A new method to measure the semantic similarity of GO terms. Bioinformatics. 2007;23(10): Teng Z, Guo M, Liu X, Dai Q, Wang C, Xuan P. Measuring gene functional similarity based on group-wise comparison of GO terms. Bioinformatics. 2013;29(11): Wu X, Pang E, Lin K, Pei ZM. Improving the measurement of semantic similarity between gene ontology terms and gene products: insights from an edge- and IC-based hybrid method. PloS one. 2013;8(5):e Pesquita C, Faria D, Falcao AO, Lord P, Couto FM. Semantic similarity in biomedical ontologies. PLoS computational biology. 2009;5(7):e Joslyn CA, Mniszewski SM, Fulmer A, Heaton G. The gene ontology categorizer. Bioinformatics. 2004;20 Suppl 1:i Hawkins T, Luban S, Kihara D. Enhanced automated function prediction using distantly related sequences and contextual association by PFP. Protein Science. 2006;15(6): Lee I, Li ZH, Marcotte EM. An improved, bias-reduced probabilistic functional gene network of baker s yeast. Saccharomyces cerevisiae. PLoS ONE. 2007;2(10):e Lee I, Ambaru B, Thakkar P, Marcotte EM, Rhee SY. Rational association of genes with traits using a genome-scale gene network for Arabidopsis thaliana. Nat Biotechnol. 2010;28(2): Lee I, Blom UM, Wang PI, Shim JE, Marcotte EM. Prioritizing candidate disease genes by network-based boosting of genome-wide association data. Genome Res. 2011;21(7):
19 18. Rhee SY, Wood V, Dolinski K, Draghici S. Use and misuse of the gene ontology annotations. Nat Rev Genet. 2008;9(7): Lamesch P, Berardini TZ, Li DH, Swarbreck D, Wilks C, Sasidharan R, et al. The Arabidopsis Information Resource (TAIR): improved gene annotation and new tools. Nucleic Acids Res. 2012;40(D1):D Brun C, Chevenet F, Martin D, Wojcik J, Guenoche A, Jacq B. Functional classification of proteins for the prediction of cellular function from a protein-protein interaction network. Genome Biol. 2003;5(1):R O Madadhain J, Fisher D, Smyth P, White S, Boey YB. Analysis and visualization of network data using JUNG. J Stat Software. 2005;10(2): Cherry JM, Hong EL, Amundsen C, Balakrishnan R, Binkley G, Chan ET, et al. Saccharomyces Genome Database: the genomics resource of budding yeast. Nucleic Acids Res. 2012;40(Database issue):d Zhang P, Foerster H, Tissier CP, Mueller L, Paley S, Karp PD, et al. MetaCyc and AraCyc. Metabolic pathway databases for plant research. Plant Physiol. 2005;138(1): Romero P, Wagg J, Green ML, Kaiser D, Krummenacker M, Karp PD. Computational prediction of human metabolic pathways from the complete human genome. Genome Biol. 2005;6(1):R Karp PD, Paley S, Romero P. The Pathway Tools software. Bioinformatics. 2002;18 Suppl 1:S Caspi R, Altman T, Billington R, Dreher K, Foerster H, Fulcher CA, et al. The MetaCyc database of metabolic pathways and enzymes and the BioCyc collection of Pathway/Genome Databases. Nucleic Acids Res. 2014;42(Database issue):d Szappanos B, Kovacs K, Szamecz B, Honti F, Costanzo M, Baryshnikova A, et al. An integrated approach to characterize genetic interaction networks in yeast metabolism. Nat Genet. 2011;43(7): Mizutani M, Ohta D. Diversification of P450 Genes During Land Plant Evolution. Annu Rev Plant Biol. 2010;61: Chae L, Sudat S, Dudoit S, Zhu T, Luan S. Diverse transcriptional programs associated with environmental stress and hormones in the Arabidopsis receptor-like kinase gene family. Molecular plant. 2009;2(1): Jin J, Zhang H, Kong L, Gao G, Luo J. PlantTFDB 3.0: a portal for the functional and evolutionary study of plant transcription factors. Nucleic Acids Res. 2014;42(Database issue):d Pesquita C, Pessoa D, Faria D, Couto FM. CESSM : Collaborative Evaluation of Semantic Similarity Measures. In: JB2009: Challenges in Bioinformatics
20 32. Allison DB, Cui X, Page GP, Sabripour M. Microarray data analysis: from disarray to consolidation and consensus. Nat Rev Genet. 2006;7(1): Yu HY, Jansen R, Stolovitzky G, Gerstein M. Total ancestry measure: quantifying the similarity in tree-like classification, with genomic applications. Bioinformatics. 2007;23(16): Mani R, Onge RPS, Hartman JL, Giaever G, Roth FP. Defining genetic interaction. P Natl Acad Sci USA. 2008;105(9): Wang J, Tsang WW, Marsaglia G. Evaluating Kolmogorov s Distribution. J Stat Softw. 2003;8:i Rhee SY, Mutwil M. Towards revealing the functions of all genes in plants. Trends Plant Sci. 2014;19(4): Pagel P, Kovac S, Oesterheld M, Brauner B, Dunger-Kaltenbach I, Frishman G, et al. The MIPS mammalian protein-protein interaction database. Bioinformatics. 2005;21(6): Franceschini A, Szklarczyk D, Frankild S, Kuhn M, Simonovic M, Roth A, et al. STRING v9.1: protein-protein interaction networks, with increased coverage and integration. Nucleic acids research. 2013;41(Database issue):d Riechmann JL, Heard J, Martin G, Reuber L, Jiang C, Keddie J, et al. Arabidopsis transcription factors: genome-wide comparative analysis among eukaryotes. Science. 2000;290(5499): Gordon AD. Classification. 2nd ed. Chapman & Hall/CRC: Boca Raton; Altschul SF, Gish W, Miller W, Myers EW, Lipman DJ. Basic local alignment search tool. Journal of molecular biology. 1990;215(3): Guengerich FP. Cytochrome p450 and chemical toxicology. Chem Res Toxicol. 2008;21(1): Zhang PF, Dreher K, Karthikeyan A, Chi A, Pujar A, Caspi R, et al. Creation of a Genome-Wide Metabolic Pathway Database for Populus trichocarpa Using a New Approach for Reconstruction and Curation of Metabolic Pathways for Plants. Plant Physiol. 2010;153(4): Murtagh F. Multidimensional clustering algorithms. Compstat Lectures, Vienna: Physika Verlag. 1985;1: Hubert L, Arabie P. Comparing Partitions. J Classif. 1985;2(2 3): Romano S, James B, Vinh N, Karin V. Standardized Mutual Information for Clustering Comparisons: One Step Further in Adjustment for Chance. In: Proceedings of the 31st International Conference on Machine Learning p
21 47. Binns D, Dimmer E, Huntley R, Barrell D, O Donovan C, Apweiler R. QuickGO: a webbased tool for Gene Ontology searching. Bioinformatics. 2009;25(22):
22
23
24
25
26

27
Biological Networks: Comparison, Conservation, and Evolution via Relative Description Length By: Tamir Tuller & Benny Chor
 Biological Networks:,, and via Relative Description Length By: Tamir Tuller & Benny Chor Presented by: Noga Grebla Content of the presentation Presenting the goals of the research Reviewing basic terms
2 GENE FUNCTIONAL SIMILARITY. 2.1 Semantic values of GO terms
 Bioinformatics Advance Access published March 7, 2007 The Author (2007). Published by Oxford University Press. All rights reserved. For Permissions, please email: journals.permissions@oxfordjournals.org
Francisco M. Couto Mário J. Silva Pedro Coutinho
 Francisco M. Couto Mário J. Silva Pedro Coutinho DI FCUL TR 03 29 Departamento de Informática Faculdade de Ciências da Universidade de Lisboa Campo Grande, 1749 016 Lisboa Portugal Technical reports are
Computational approaches for functional genomics
 Computational approaches for functional genomics Kalin Vetsigian October 31, 2001 The rapidly increasing number of completely sequenced genomes have stimulated the development of new methods for finding
Computational Genomics. Systems biology. Putting it together: Data integration using graphical models
 02-710 Computational Genomics Systems biology Putting it together: Data integration using graphical models High throughput data So far in this class we discussed several different types of high throughput
BMD645. Integration of Omics
 BMD645 Integration of Omics Shu-Jen Chen, Chang Gung University Dec. 11, 2009 1 Traditional Biology vs. Systems Biology Traditional biology : Single genes or proteins Systems biology: Simultaneously study
Gene Ontology and Functional Enrichment. Genome 559: Introduction to Statistical and Computational Genomics Elhanan Borenstein
 Gene Ontology and Functional Enrichment Genome 559: Introduction to Statistical and Computational Genomics Elhanan Borenstein The parsimony principle: A quick review Find the tree that requires the fewest
Protein function prediction via analysis of interactomes
 Protein function prediction via analysis of interactomes Elena Nabieva Mona Singh Department of Computer Science & Lewis-Sigler Institute for Integrative Genomics January 22, 2008 1 Introduction Genome
Identifying Signaling Pathways
 These slides, excluding third-party material, are licensed under CC BY-NC 4.0 by Anthony Gitter, Mark Craven, Colin Dewey Identifying Signaling Pathways BMI/CS 776 www.biostat.wisc.edu/bmi776/ Spring 2018
Gene Ontology and overrepresentation analysis
 Gene Ontology and overrepresentation analysis Kjell Petersen J Express Microarray analysis course Oslo December 2009 Presentation adapted from Endre Anderssen and Vidar Beisvåg NMC Trondheim Overview How
BMC Evolutionary Biology 2013, 13:6
 BMC Evolutionary Biology This Provisional PDF corresponds to the article as it appeared upon acceptance. Fully formatted PDF and full text (HTML) versions will be made available soon. Correction: Male-killing
CSCE555 Bioinformatics. Protein Function Annotation
 CSCE555 Bioinformatics Protein Function Annotation Why we need to do function annotation? Fig from: Network-based prediction of protein function. Molecular Systems Biology 3:88. 2007 What s function? The
Supplementary Information
 Supplementary Information For the article"comparable system-level organization of Archaea and ukaryotes" by J. Podani, Z. N. Oltvai, H. Jeong, B. Tombor, A.-L. Barabási, and. Szathmáry (reference numbers
Functional Characterization and Topological Modularity of Molecular Interaction Networks
 Functional Characterization and Topological Modularity of Molecular Interaction Networks Jayesh Pandey 1 Mehmet Koyutürk 2 Ananth Grama 1 1 Department of Computer Science Purdue University 2 Department
Predicting Protein Functions and Domain Interactions from Protein Interactions
 Predicting Protein Functions and Domain Interactions from Protein Interactions Fengzhu Sun, PhD Center for Computational and Experimental Genomics University of Southern California Outline High-throughput
BIOINFORMATICS: An Introduction
 BIOINFORMATICS: An Introduction What is Bioinformatics? The term was first coined in 1988 by Dr. Hwa Lim The original definition was : a collective term for data compilation, organisation, analysis and
Bioinformatics. Dept. of Computational Biology & Bioinformatics
 Bioinformatics Dept. of Computational Biology & Bioinformatics 3 Bioinformatics - play with sequences & structures Dept. of Computational Biology & Bioinformatics 4 ORGANIZATION OF LIFE ROLE OF BIOINFORMATICS
Supplementary text for the section Interactions conserved across species: can one select the conserved interactions?
 1 Supporting Information: What Evidence is There for the Homology of Protein-Protein Interactions? Anna C. F. Lewis, Nick S. Jones, Mason A. Porter, Charlotte M. Deane Supplementary text for the section
Written Exam 15 December Course name: Introduction to Systems Biology Course no
 Technical University of Denmark Written Exam 15 December 2008 Course name: Introduction to Systems Biology Course no. 27041 Aids allowed: Open book exam Provide your answers and calculations on separate
A New Method to Build Gene Regulation Network Based on Fuzzy Hierarchical Clustering Methods
 International Academic Institute for Science and Technology International Academic Journal of Science and Engineering Vol. 3, No. 6, 2016, pp. 169-176. ISSN 2454-3896 International Academic Journal of
Genome Annotation. Bioinformatics and Computational Biology. Genome sequencing Assembly. Gene prediction. Protein targeting.
 Genome Annotation Bioinformatics and Computational Biology Genome Annotation Frank Oliver Glöckner 1 Genome Analysis Roadmap Genome sequencing Assembly Gene prediction Protein targeting trna prediction
Networks & pathways. Hedi Peterson MTAT Bioinformatics
 Networks & pathways Hedi Peterson (peterson@quretec.com) MTAT.03.239 Bioinformatics 03.11.2010 Networks are graphs Nodes Edges Edges Directed, undirected, weighted Nodes Genes Proteins Metabolites Enzymes
Gene Ontology. Shifra Ben-Dor. Weizmann Institute of Science
 Gene Ontology Shifra Ben-Dor Weizmann Institute of Science Outline of Session What is GO (Gene Ontology)? What tools do we use to work with it? Combination of GO with other analyses What is Ontology? 1700s
Estimation of Identification Methods of Gene Clusters Using GO Term Annotations from a Hierarchical Cluster Tree
 Estimation of Identification Methods of Gene Clusters Using GO Term Annotations from a Hierarchical Cluster Tree YOICHI YAMADA, YUKI MIYATA, MASANORI HIGASHIHARA*, KENJI SATOU Graduate School of Natural
Dr. Amira A. AL-Hosary
 Phylogenetic analysis Amira A. AL-Hosary PhD of infectious diseases Department of Animal Medicine (Infectious Diseases) Faculty of Veterinary Medicine Assiut University-Egypt Phylogenetic Basics: Biological
Robust Community Detection Methods with Resolution Parameter for Complex Detection in Protein Protein Interaction Networks
 Robust Community Detection Methods with Resolution Parameter for Complex Detection in Protein Protein Interaction Networks Twan van Laarhoven and Elena Marchiori Institute for Computing and Information
Correlation Networks
 QuickTime decompressor and a are needed to see this picture. Correlation Networks Analysis of Biological Networks April 24, 2010 Correlation Networks - Analysis of Biological Networks 1 Review We have
Tandem Mass Spectrometry: Generating function, alignment and assembly
 Tandem Mass Spectrometry: Generating function, alignment and assembly With slides from Sangtae Kim and from Jones & Pevzner 2004 Determining reliability of identifications Can we use Target/Decoy to estimate
GENE ONTOLOGY (GO) Wilver Martínez Martínez Giovanny Silva Rincón
 Wilver Martínez Martínez Giovanny Silva Rincón") GENE ONTOLOGY (GO) Wilver Martínez Martínez Giovanny Silva Rincón What is GO? The Gene Ontology (GO) project is a collaborative effort to address the need for consistent descriptions of gene products in
GENE ONTOLOGY (GO) Wilver Martínez Martínez Giovanny Silva Rincón What is GO? The Gene Ontology (GO) project is a collaborative effort to address the need for consistent descriptions of gene products in
Amira A. AL-Hosary PhD of infectious diseases Department of Animal Medicine (Infectious Diseases) Faculty of Veterinary Medicine Assiut
 Faculty of Veterinary Medicine Assiut") Amira A. AL-Hosary PhD of infectious diseases Department of Animal Medicine (Infectious Diseases) Faculty of Veterinary Medicine Assiut University-Egypt Phylogenetic analysis Phylogenetic Basics: Biological
Amira A. AL-Hosary PhD of infectious diseases Department of Animal Medicine (Infectious Diseases) Faculty of Veterinary Medicine Assiut University-Egypt Phylogenetic analysis Phylogenetic Basics: Biological
Information Extraction from Biomedical Text. BMI/CS 776 Mark Craven
 Information Extraction from Biomedical Text BMI/CS 776 www.biostat.wisc.edu/bmi776/ Mark Craven craven@biostat.wisc.edu Spring 2012 Goals for Lecture the key concepts to understand are the following! named-entity
Cell biology traditionally identifies proteins based on their individual actions as catalysts, signaling
 Lethality and centrality in protein networks Cell biology traditionally identifies proteins based on their individual actions as catalysts, signaling molecules, or building blocks of cells and microorganisms.
Computational methods for predicting protein-protein interactions
 Computational methods for predicting protein-protein interactions Tomi Peltola T-61.6070 Special course in bioinformatics I 3.4.2008 Outline Biological background Protein-protein interactions Computational
SUPPLEMENTARY METHODS
 SUPPLEMENTARY METHODS M1: ALGORITHM TO RECONSTRUCT TRANSCRIPTIONAL NETWORKS M-2 Figure 1: Procedure to reconstruct transcriptional regulatory networks M-2 M2: PROCEDURE TO IDENTIFY ORTHOLOGOUS PROTEINSM-3
Integration of functional genomics data
 Integration of functional genomics data Laboratoire Bordelais de Recherche en Informatique (UMR) Centre de Bioinformatique de Bordeaux (Plateforme) Rennes Oct. 2006 1 Observations and motivations Genomics
Haploid & diploid recombination and their evolutionary impact
 Haploid & diploid recombination and their evolutionary impact W. Garrett Mitchener College of Charleston Mathematics Department MitchenerG@cofc.edu http://mitchenerg.people.cofc.edu Introduction The basis
Systematic prediction of gene function in Arabidopsis thaliana using a probabilistic functional gene network
 Systematic prediction of gene function in Arabidopsis thaliana using a probabilistic functional gene network Sohyun Hwang 1, Seung Y Rhee 2, Edward M Marcotte 3,4 & Insuk Lee 1 protocol 1 Department of
Supplementary Materials for
 advances.sciencemag.org/cgi/content/full/1/8/e1500527/dc1 Supplementary Materials for A phylogenomic data-driven exploration of viral origins and evolution The PDF file includes: Arshan Nasir and Gustavo
ATLAS of Biochemistry
 ATLAS of Biochemistry USER GUIDE http://lcsb-databases.epfl.ch/atlas/ CONTENT 1 2 3 GET STARTED Create your user account NAVIGATE Curated KEGG reactions ATLAS reactions Pathways Maps USE IT! Fill a gap
Analysis and visualization of protein-protein interactions. Olga Vitek Assistant Professor Statistics and Computer Science
 1 Analysis and visualization of protein-protein interactions Olga Vitek Assistant Professor Statistics and Computer Science 2 Outline 1. Protein-protein interactions 2. Using graph structures to study
2MHR. Protein structure classification is important because it organizes the protein structure universe that is independent of sequence similarity.
 Protein structure classification is important because it organizes the protein structure universe that is independent of sequence similarity. A global picture of the protein universe will help us to understand
Phylogenetic Analysis of Molecular Interaction Networks 1
 Phylogenetic Analysis of Molecular Interaction Networks 1 Mehmet Koyutürk Case Western Reserve University Electrical Engineering & Computer Science 1 Joint work with Sinan Erten, Xin Li, Gurkan Bebek,
A Multiobjective GO based Approach to Protein Complex Detection
 Available online at www.sciencedirect.com Procedia Technology 4 (2012 ) 555 560 C3IT-2012 A Multiobjective GO based Approach to Protein Complex Detection Sumanta Ray a, Moumita De b, Anirban Mukhopadhyay
Course plan Academic Year Qualification MSc on Bioinformatics for Health Sciences. Subject name: Computational Systems Biology Code: 30180
 Course plan 201-201 Academic Year Qualification MSc on Bioinformatics for Health Sciences 1. Description of the subject Subject name: Code: 30180 Total credits: 5 Workload: 125 hours Year: 1st Term: 3
Hiromi Nishida. 1. Introduction. 2. Materials and Methods
 Evolutionary Biology Volume 212, Article ID 342482, 5 pages doi:1.1155/212/342482 Research Article Comparative Analyses of Base Compositions, DNA Sizes, and Dinucleotide Frequency Profiles in Archaeal
Inferring Transcriptional Regulatory Networks from Gene Expression Data II
 Inferring Transcriptional Regulatory Networks from Gene Expression Data II Lectures 9 Oct 26, 2011 CSE 527 Computational Biology, Fall 2011 Instructor: Su-In Lee TA: Christopher Miles Monday & Wednesday
Distance-based test for uncertainty hypothesis testing
 Sampath and Ramya Journal of Uncertainty Analysis and Applications 03, :4 RESEARCH Open Access Distance-based test for uncertainty hypothesis testing Sundaram Sampath * and Balu Ramya * Correspondence:
A PARSIMONY APPROACH TO ANALYSIS OF HUMAN SEGMENTAL DUPLICATIONS
 A PARSIMONY APPROACH TO ANALYSIS OF HUMAN SEGMENTAL DUPLICATIONS CRYSTAL L. KAHN and BENJAMIN J. RAPHAEL Box 1910, Brown University Department of Computer Science & Center for Computational Molecular Biology
Supplementary material to Structure Learning of Linear Gaussian Structural Equation Models with Weak Edges
 Supplementary material to Structure Learning of Linear Gaussian Structural Equation Models with Weak Edges 1 PRELIMINARIES Two vertices X i and X j are adjacent if there is an edge between them. A path
Introduction to Evolutionary Concepts
 Introduction to Evolutionary Concepts and VMD/MultiSeq - Part I Zaida (Zan) Luthey-Schulten Dept. Chemistry, Beckman Institute, Biophysics, Institute of Genomics Biology, & Physics NIH Workshop 2009 VMD/MultiSeq
Supplementary Figure 3
 Supplementary Figure 3 a 1 (i) (ii) (iii) (iv) (v) log P gene Q group, % ~ ε nominal 2 1 1 8 6 5 A B C D D' G J L M P R U + + ε~ A C B D D G JL M P R U -1 1 ε~ (vi) Z group 2 1 1 (vii) (viii) Z module
hsnim: Hyper Scalable Network Inference Machine for Scale-Free Protein-Protein Interaction Networks Inference
 CS 229 Project Report (TR# MSB2010) Submitted 12/10/2010 hsnim: Hyper Scalable Network Inference Machine for Scale-Free Protein-Protein Interaction Networks Inference Muhammad Shoaib Sehgal Computer Science
Algorithms for Molecular Biology
 Algorithms for Molecular Biology BioMed Central Research A polynomial time biclustering algorithm for finding approximate expression patterns in gene expression time series Sara C Madeira* 1,2,3 and Arlindo
GOSAP: Gene Ontology Based Semantic Alignment of Biological Pathways
 GOSAP: Gene Ontology Based Semantic Alignment of Biological Pathways Jonas Gamalielsson and Björn Olsson Systems Biology Group, Skövde University, Box 407, Skövde, 54128, Sweden, [jonas.gamalielsson][bjorn.olsson]@his.se,
Supplementary Information
 Supplementary Information Supplementary Figure 1. Schematic pipeline for single-cell genome assembly, cleaning and annotation. a. The assembly process was optimized to account for multiple cells putatively
Some Problems from Enzyme Families
 Some Problems from Enzyme Families Greg Butler Department of Computer Science Concordia University, Montreal www.cs.concordia.ca/~faculty/gregb gregb@cs.concordia.ca Abstract I will discuss some problems
Learning in Bayesian Networks
 Learning in Bayesian Networks Florian Markowetz Max-Planck-Institute for Molecular Genetics Computational Molecular Biology Berlin Berlin: 20.06.2002 1 Overview 1. Bayesian Networks Stochastic Networks
OMICS Journals are welcoming Submissions
 OMICS Journals are welcoming Submissions OMICS International welcomes submissions that are original and technically so as to serve both the developing world and developed countries in the best possible
An introduction to SYSTEMS BIOLOGY
 An introduction to SYSTEMS BIOLOGY Paolo Tieri CNR Consiglio Nazionale delle Ricerche, Rome, Italy 10 February 2015 Universidade Federal de Minas Gerais, Belo Horizonte, Brasil Course outline Day 1: intro
Biological Systems: Open Access
 Biological Systems: Open Access Biological Systems: Open Access Liu and Zheng, 2016, 5:1 http://dx.doi.org/10.4172/2329-6577.1000153 ISSN: 2329-6577 Research Article ariant Maps to Identify Coding and
Module 5 EMBEDDED WAVELET CODING. Version 2 ECE IIT, Kharagpur
 Module 5 EMBEDDED WAVELET CODING Lesson 13 Zerotree Approach. Instructional Objectives At the end of this lesson, the students should be able to: 1. Explain the principle of embedded coding. 2. Show the
In order to compare the proteins of the phylogenomic matrix, we needed a similarity
 Similarity Matrix Generation In order to compare the proteins of the phylogenomic matrix, we needed a similarity measure. Hamming distances between phylogenetic profiles require the use of thresholds for
Ohio Tutorials are designed specifically for the Ohio Learning Standards to prepare students for the Ohio State Tests and end-ofcourse
 Tutorial Outline Ohio Tutorials are designed specifically for the Ohio Learning Standards to prepare students for the Ohio State Tests and end-ofcourse exams. Biology Tutorials offer targeted instruction,
METABOLIC PATHWAY PREDICTION/ALIGNMENT
 COMPUTATIONAL SYSTEMIC BIOLOGY METABOLIC PATHWAY PREDICTION/ALIGNMENT Hofestaedt R*, Chen M Bioinformatics / Medical Informatics, Technische Fakultaet, Universitaet Bielefeld Postfach 10 01 31, D-33501
CHAPTER-17. Decision Tree Induction
 CHAPTER-17 Decision Tree Induction 17.1 Introduction 17.2 Attribute selection measure 17.3 Tree Pruning 17.4 Extracting Classification Rules from Decision Trees 17.5 Bayesian Classification 17.6 Bayes
CS612 - Algorithms in Bioinformatics
 Fall 2017 Databases and Protein Structure Representation October 2, 2017 Molecular Biology as Information Science > 12, 000 genomes sequenced, mostly bacterial (2013) > 5x10 6 unique sequences available
The Role of Network Science in Biology and Medicine. Tiffany J. Callahan Computational Bioscience Program Hunter/Kahn Labs
 The Role of Network Science in Biology and Medicine Tiffany J. Callahan Computational Bioscience Program Hunter/Kahn Labs Network Analysis Working Group 09.28.2017 Network-Enabled Wisdom (NEW) empirically
DIA-Umpire: comprehensive computational framework for data independent acquisition proteomics
 DIA-Umpire: comprehensive computational framework for data independent acquisition proteomics Chih-Chiang Tsou 1,2, Dmitry Avtonomov 2, Brett Larsen 3, Monika Tucholska 3, Hyungwon Choi 4 Anne-Claude Gingras
Lecture 2. The Blast2GO annotation framework
 Lecture 2 The Blast2GO annotation framework Annotation steps Modulation of annotation intensity Export/Import Functions Sequence Selection Additional Tools Functional assignment Annotation Transference
A phylogenomic toolbox for assembling the tree of life
 A phylogenomic toolbox for assembling the tree of life or, The Phylota Project (http://www.phylota.org) UC Davis Mike Sanderson Amy Driskell U Pennsylvania Junhyong Kim Iowa State Oliver Eulenstein David
Chapter 5. Proteomics and the analysis of protein sequence Ⅱ
 Proteomics Chapter 5. Proteomics and the analysis of protein sequence Ⅱ 1 Pairwise similarity searching (1) Figure 5.5: manual alignment One of the amino acids in the top sequence has no equivalent and
AN EVIDENCE ONTOLOGY FOR USE IN PATHWAY/GENOME DATABASES
 AN EVIDENCE ONTOLOGY FOR USE IN PATHWAY/GENOME DATABASES Appears in Pacific Symposium on Biocomputing 2004 Pages 190-201, World Scientific Publishers, Singapore P.D. KARP, S. PALEY, C.J. KRIEGER SRI International,
SUPPLEMENTARY INFORMATION
 Supplementary information S3 (box) Methods Methods Genome weighting The currently available collection of archaeal and bacterial genomes has a highly biased distribution of isolates across taxa. For example,
Small RNA in rice genome
 Vol. 45 No. 5 SCIENCE IN CHINA (Series C) October 2002 Small RNA in rice genome WANG Kai ( 1, ZHU Xiaopeng ( 2, ZHONG Lan ( 1,3 & CHEN Runsheng ( 1,2 1. Beijing Genomics Institute/Center of Genomics and
Disease Ontology Semantic and Enrichment analysis
 Disease Ontology Semantic and Enrichment analysis Guangchuang Yu, Li-Gen Wang Jinan University, Guangzhou, China April 21, 2012 1 Introduction Disease Ontology (DO) provides an open source ontology for
A general co-expression network-based approach to gene expression analysis: comparison and applications
 BMC Systems Biology This Provisional PDF corresponds to the article as it appeared upon acceptance. Fully formatted PDF and full text (HTML) versions will be made available soon. A general co-expression
Motif Prediction in Amino Acid Interaction Networks
 Motif Prediction in Amino Acid Interaction Networks Omar GACI and Stefan BALEV Abstract In this paper we represent a protein as a graph where the vertices are amino acids and the edges are interactions
Investigation 3: Comparing DNA Sequences to Understand Evolutionary Relationships with BLAST
 Investigation 3: Comparing DNA Sequences to Understand Evolutionary Relationships with BLAST Introduction Bioinformatics is a powerful tool which can be used to determine evolutionary relationships and
Unravelling the biochemical reaction kinetics from time-series data
 Unravelling the biochemical reaction kinetics from time-series data Santiago Schnell Indiana University School of Informatics and Biocomplexity Institute Email: schnell@indiana.edu WWW: http://www.informatics.indiana.edu/schnell
Grundlagen der Bioinformatik Summer semester Lecturer: Prof. Daniel Huson
 Grundlagen der Bioinformatik, SS 10, D. Huson, April 12, 2010 1 1 Introduction Grundlagen der Bioinformatik Summer semester 2010 Lecturer: Prof. Daniel Huson Office hours: Thursdays 17-18h (Sand 14, C310a)
Computational Structural Bioinformatics
 Computational Structural Bioinformatics ECS129 Instructor: Patrice Koehl http://koehllab.genomecenter.ucdavis.edu/teaching/ecs129 koehl@cs.ucdavis.edu Learning curve Math / CS Biology/ Chemistry Pre-requisite
Types of biological networks. I. Intra-cellurar networks
 Types of biological networks I. Intra-cellurar networks 1 Some intra-cellular networks: 1. Metabolic networks 2. Transcriptional regulation networks 3. Cell signalling networks 4. Protein-protein interaction
A Study of Correlations between the Definition and Application of the Gene Ontology
 University of Nebraska - Lincoln DigitalCommons@University of Nebraska - Lincoln Theses, Dissertations, & Student Research in Computer Electronics & Engineering Electrical & Computer Engineering, Department
Graph Alignment and Biological Networks
 Graph Alignment and Biological Networks Johannes Berg http://www.uni-koeln.de/ berg Institute for Theoretical Physics University of Cologne Germany p.1/12 Networks in molecular biology New large-scale
objective functions...
 objective functions... COFFEE (Notredame et al. 1998) measures column by column similarity between pairwise and multiple sequence alignments assumes that the pairwise alignments are optimal assumes a set
2. Cellular and Molecular Biology
 2. Cellular and Molecular Biology 2.1 Cell Structure 2.2 Transport Across Cell Membranes 2.3 Cellular Metabolism 2.4 DNA Replication 2.5 Cell Division 2.6 Biosynthesis 2.1 Cell Structure What is a cell?
Nature Genetics: doi: /ng Supplementary Figure 1. Icm/Dot secretion system region I in 41 Legionella species.
 Supplementary Figure 1 Icm/Dot secretion system region I in 41 Legionella species. Homologs of the effector-coding gene lega15 (orange) were found within Icm/Dot region I in 13 Legionella species. In four
Introduction to Bioinformatics Online Course: IBT
 Introduction to Bioinformatics Online Course: IBT Multiple Sequence Alignment Building Multiple Sequence Alignment Lec1 Building a Multiple Sequence Alignment Learning Outcomes 1- Understanding Why multiple
Using Phylogenomics to Predict Novel Fungal Pathogenicity Genes
 Using Phylogenomics to Predict Novel Fungal Pathogenicity Genes David DeCaprio, Ying Li, Hung Nguyen (sequenced Ascomycetes genomes courtesy of the Broad Institute) Phylogenomics Combining whole genome
5/4/05 Biol 473 lecture
 5/4/05 Biol 473 lecture animals shown: anomalocaris and hallucigenia 1 The Cambrian Explosion - 550 MYA THE BIG BANG OF ANIMAL EVOLUTION Cambrian explosion was characterized by the sudden and roughly simultaneous
Last Lecture. Distinguish Populations from Samples. Knowing different Sampling Techniques. Distinguish Parameters from Statistics
 Last Lecture Distinguish Populations from Samples Importance of identifying a population and well chosen sample Knowing different Sampling Techniques Distinguish Parameters from Statistics Knowing different
Part 7: Glossary Overview
 Part 7: Glossary Overview In this Part This Part covers the following topic Topic See Page 7-1-1 Introduction This section provides an alphabetical list of all the terms used in a STEPS surveillance with
Molecular Biology: from sequence analysis to signal processing. University of Sao Paulo. Junior Barrera
 Molecular Biology: from sequence analysis to signal processing Junior Barrera University of Sao Paulo Layout Introduction Knowledge evolution in Genetics Data acquisition Data Analysis A system for genetic
Model Accuracy Measures
 Model Accuracy Measures Master in Bioinformatics UPF 2017-2018 Eduardo Eyras Computational Genomics Pompeu Fabra University - ICREA Barcelona, Spain Variables What we can measure (attributes) Hypotheses
QSAR Modeling of ErbB1 Inhibitors Using Genetic Algorithm-Based Regression
 APPLICATION NOTE QSAR Modeling of ErbB1 Inhibitors Using Genetic Algorithm-Based Regression GAINING EFFICIENCY IN QUANTITATIVE STRUCTURE ACTIVITY RELATIONSHIPS ErbB1 kinase is the cell-surface receptor
6.047 / Computational Biology: Genomes, Networks, Evolution Fall 2008
 MIT OpenCourseWare http://ocw.mit.edu 6.047 / 6.878 Computational Biology: Genomes, Networks, Evolution Fall 2008 For information about citing these materials or our Terms of Use, visit: http://ocw.mit.edu/terms.
Prediction and Classif ication of Human G-protein Coupled Receptors Based on Support Vector Machines
 Article Prediction and Classif ication of Human G-protein Coupled Receptors Based on Support Vector Machines Yun-Fei Wang, Huan Chen, and Yan-Hong Zhou* Hubei Bioinformatics and Molecular Imaging Key Laboratory,
Hierarchical Clustering
 Hierarchical Clustering Some slides by Serafim Batzoglou 1 From expression profiles to distances From the Raw Data matrix we compute the similarity matrix S. S ij reflects the similarity of the expression
86 Part 4 SUMMARY INTRODUCTION
 86 Part 4 Chapter # AN INTEGRATION OF THE DESCRIPTIONS OF GENE NETWORKS AND THEIR MODELS PRESENTED IN SIGMOID (CELLERATOR) AND GENENET Podkolodny N.L. *1, 2, Podkolodnaya N.N. 1, Miginsky D.S. 1, Poplavsky
Comparative Network Analysis
 Comparative Network Analysis BMI/CS 776 www.biostat.wisc.edu/bmi776/ Spring 2016 Anthony Gitter gitter@biostat.wisc.edu These slides, excluding third-party material, are licensed under CC BY-NC 4.0 by