University of Central Florida, USA
|
|
|
- Oswald Wheeler
- 5 years ago
- Views:
Transcription

1 Dr. Mohamed Abdel-Aty, PE Trustee Chair Pegasus Professor and Chair Department of Civil, Environmental & Construction Engineering University of Central Florida, USA Editor-in-Chief, Accident Analysis & Prevention
 congestion based on prevailing traffic conditions Benefits Maximize the efficiency of the facility Increase")
2 Challenges in the transportation system Increase in travel demand Growth in congestion Need to improve safety Reality of limited resources Solution: (Pro)Active Traffic Management Dynamically manage recurrent and non-recurrent (incident) congestion based on prevailing traffic conditions Benefits Maximize the efficiency of the facility Increase safety 2
3 Traditional Approach Where congestion/queues have formed Where the incident has occurred Where inclement weather has been detected Proactive Perspective Where the congestion/queues are about to form Where a crash is more likely to occur Where inclement weather is about to begin 3
 Systems Microwave Vehicle Detection Systems (MVDS) Weather Detection Systems Weather")
 Countermeasures Variable Speed Limit Ramp Metering strategies Queue Warning Dynamic Rerouting and")
4 Application of Intelligent Transportation Systems (ITS) Traffic Detection Systems Automatic Vehicle Identification (AVI) Systems Microwave Vehicle Detection Systems (MVDS) Weather Detection Systems Weather sensors (e.g. temperature, precipitation, visibility, fog, etc.) Countermeasures Variable Speed Limit Ramp Metering strategies Queue Warning Dynamic Rerouting and Traveler Information Adaptive Signals MVDS System AVI system 4


5 In general, there are five kinds of data sources will be utilized in this study. Central Server MAC ID: 123AB 07:01:05 Travel Time = 150 seconds Speed = 34 mph MAC ID: 123AB 07:03:35 Travel Time = 170 seconds Speed = 40 mph MAC ID: 123AB 07:07:05 Crash Data 1. Crash type 2. Crash severity 1.42 mile 1.89 mile Bluetooth Data 1. Travel time 2. Space-mean speed Data Sources Adaptive Signal Data 1. Signal timing 2. Lane-specific volume 3. Maximum queue length 4. Maximum waiting time Weather Data UAV Data 1.Weather type 2. Hourly precipitation 3. Visibility 4. Relative humitity 1. Vehicle trajectory 2. Speed 3. Acceleration 4. Deceleration 5. Headway distance 5/30/2018 5
6 Currently Available Data Source Characteristics Availability Contents Granularity Data Freeway & Arterial Source Agency TMS Expressway 1 SMS 2 Volume Incident MVDS 30s-60s CFX, RITIS AVI(Toll tag) Individual CFX BlueMAC 3 Individual Orange County Iteris 3 Individual Orange County BlueTOAD 3 Individual Seminole County, FTE InSync 15min Orange County SPM Individual 4 Seminole County HERE 1min RITIS INRIX 1min RITIS Twitter Congestion Only Twitter Mining 1 Time Mean Speed; 2 Space Mean Speed; 3 All are Bluetooth system, only BlueMAC provides raw log data; 4 SPM records individual count. 6
7 Size of Current Datasets In order to manage, store, and utilize the collected big data efficiently, the UCF research team has purchased two high-end computing severs with in-house funding Source CFX Seminole County Name of Dataset Monthly raw data size (Gbytes) Expected periods (Years) Expected Size (GB, as of 2017) Format Data collection period MVDS dat From 2013 to 2017 AVI csv From 2013 to 2017 DMS csv From 2013 to 2017 SPM MS SQL Server backup database From January 2015 BlueTOAD csv From 2014 to 2017 InSync csv From 2015 to 2017 Detector deployed Orange BlueMAC csv since Dec Still County under deployment. Iteris csv From 2015 to 2017 MVDS csv From 2014 to 2017 RITIS From Oct, 2013 till HERE csv now Total

8 8

9 MVDS Congestion Index Congestion Index CI = Free Flow Speed Speed Free Flow Speed Free Flow Speed = 85th percentile speed 9
10 Real-time safety analysis A crash Disruptive Implementations Understanding the microscopic crash mechanisms Estimating crash likelihood in real-time Improving traffic safety in real-time


11 Effects of traffic safety on operation Crash-leading congestion Real-time speed profile by lane Real-time speed variation 11
12 Traffic Parameter ( e.g., Speed) What patterns are we looking for? Developing a Hybrid Detailed Crash Prediction System Using ITS Data on I-4 and Evaluating the Application Strategies Speed profile before/after crash on I-4 Time of Crash Crash Precursor Before Crash After Crash Observation Time Slice Time


13 Distance Distance Real-time crash risk for I-4 Station H Station H Station G Station G Station F Station F Space (Direction of Traffic) Station E Station E Station D Station D Station Station C C Time and Location of the crash Time and Location of the crash Time and Location of the crash Time and Location of the crash Traffic Direction Traffic Traffic Direction Direction Station Station B B -30 min min. -25 min. min min. Time min min. -15 min min. -10 min. -5 min. -10 min. Time -5 min. of -5 the Time min. of Time the of the crash=0 crash=0 crash=0 Slice 6 6Slice Slice Slice Slice Slice 54 4Slice 3Slice 4 3Slice 2 Slice 3 Slice 2Slice 1 Slice 2 1Slice 1 Hazard Ratio: Slice Contour 6 Slice plots 5 Slice of hazard 4 Slice ratios 3 corresponding Slice 2 Slice 1 to coefficient of variation in speed (42 model outputs) Real-time Black Spot 13

14 Crash Precursor #1: Variation in speed upstream of crash location Upstream of crash location
15 Crash Precursor #2: Speed upstream differential of crash location with speed downstream Upstream of crash location Downstream of crash location

16 Crash Precursor #3: Covariance of volume across adjacent lanes upstream of crash location Upstream of crash location


17 Stabilization in 30-second speed profiles following ITS strategies implementation

18 Warning Message Variable Speed Limit
19 19 Arrangement of RTMS and AVI Segments The 15-mile on I-70 in Colorado is equipped with AVI, RTMS, and Weather Stations. There were five sets of data used in this study; roadway geometry data, crash data, and the corresponding AVI, RTMS and weather data. The crash data were obtained from CDOT for a 15-mile segment on I-70 for 13 months (from October 2010 to October 2011). Traffic data consists of space mean speed captured by 12 and 15 AVI detectors located on each east and west bounds, respectively along I-70. Volume, occupancy and time mean speed are collected by 15 RTMSs on each direction. AVI estimates SMS every 2-minute while RTMS provides traffic flow parameters every 30-second. Weather data were recorded by three automated weather stations along the roadway section for the same time period. The roadway data were extracted from Roadway Characteristics Inventory (RCI) and Single Line Diagrams (SLD).
20 AVI: RTMS: Lane1 RTMS: Lane2 RTMS: Lane1 RTMS: Lane2 RTMS: Lane1 RTMS: Lane AVI: RTMS: Lane1 RTMS: Lane2 RTMS: Lane1 RTMS: Lane2 RTMS: Lane Speed (mph) Normal Traffic Condition (No Crash) 13:00:00 13:15:00 13:30:00 13:45:00 14:00:00 14:15:00 14:30:00 14:45:00 15:00:00 Time (min) Normal Condition with no Crash Occurrence Speed (mph) PDO Crash 14:40:00 14:55:00 15:10:00 15:25:00 15:40:00 15:55:00 16:10:00 16:25:00 16:40:00 Time (min) Crash Location: Milepost Speed Standard Deviation (mph) AVI: RTMS: Lane1 RTMS: Lane1 Speed Variance (PDO) 14:40:00 14:50:00 15:00:00 15:10:00 15:20:00 15:30:00 15:40:00 Speed (mph) AVI: RTMS: Lane1 RTMS: Lane2 RTMS: Lane2 Fatal Crash 11:30:00 11:40:00 11:50:00 12:00:00 12:10:00 12:20:00 12:30:00 12:40:00 12:50:00 13:00:00 13:10:00 13:20:00 13:30:00 Time (min) Time (min) Crash Location: Milepost Crash Location: Milepost 217.5
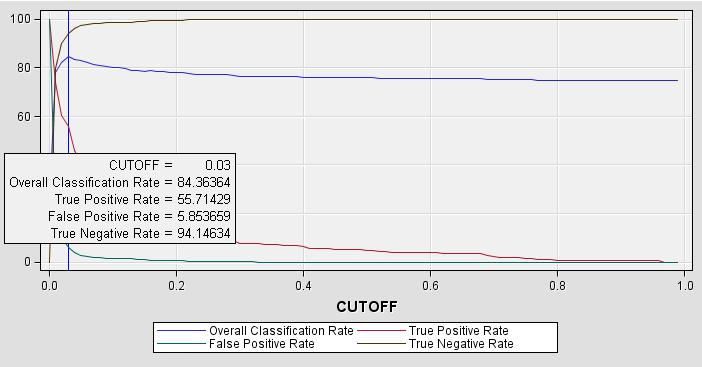
21 21 Model-1 (All Data) Variables Var. Import. Model-2 (RTMS) Variables Var. Import. Model-3 (AVI) Variables Var. Import. Model-4 (Weather) Variables Var. Import. Avg. Occ. Upstream1_Time Slice _ Avg. Occ. Upstream 2_Time slice_ Log. Coef. of Var. of Speed Crash Segment Time Slice_ Hour Visibility Avg. Occ. Upstream 2_Time slice_ Log. Coef. of Var. of Speed Upstream 1_Time Slice_ Avg. Speed Downstream Segment Time Slice_ Minute Precipitation Log. Coef. of Var. of Speed Crash Segment Time Slice_ Avg. Speed Upstream 2_Time Slice_ Avg. Speed Downstream Segment Time Slice_ Hour Precipitation Avg. Speed Downstream Segment Time Slice_ S.D. Occ. Upstream 2_Time Slice Avg. Speed upstream Segment Time Slice_ Hour Visibility Grade Avg. Speed Downstream 1_Time Slice_2 Avg. Speed Downstream 2_Time Slice_ S.D. Occ. Upstream 3_Time Slice Avg. Occ. Upstream1_Time Slice _ No. of Lanes Avg. Occ. Upstream2_Time Slice _ Avg. Speed Upstream 1_Time Slice_ Avg. Speed Downstream Segment, Time Slice_ Abs. Deg. of Curve Minute Precipitation Log. Coef. of Var. of Volume Downstream 2_Time Slice Log. Coef. of Var. of Volume Downstream 2_Time Slice_

22 22 Model Model Description Overall Classificatio n Rate True Positive Rate False Positive Rate True Negative Rate ROC Index Model-1 All Data % % 6.481% % Model-2 RTMS % % 7.154% % Model-3 AVI % % 6.393% % Model-4 Weather % % 5.854% % 0.675


23 23

24 24


25 Real-Time weather and traffic monitoring system on I-4 FMS 8 FMS 7 FMS 1 FMS 2 FMS 3 FMS 4 Weather Station Area Visibility FMS 5 FMS 6 RTMS 25
26 Real-time crash model for weaving segments Variables Mean Std. p-value Intercept Speed difference (Spddif) Log(Vehcnt) Weaving configuration (1=no lane change) Weaving influence length (Lmax) Road surface condition (1=Wet) Training ROC* Validation ROC Speed difference: 0 if Bm_spd < Em_spd; otherwise Bm_spd- Em_spd L max =5728(1 + VR) N WL Using VSL to reduce Using RM to reduce Then, improve safety of weaving segments in real-time
 g( k).")
27 Ramp metering (RM) Updated every 5 minutes based on occupancy and crash risk ) r( k) r( k 1) KR( o ok ) K ( ˆ s p pk 1) 1 Green-phase duration, g k, is calculated as follows, rk ( ) g( k). C rsat g g( k) g min max Queue Control g Queue 10 g 1 10 Queue 20 g g 2 20 Queue 30 g 3 Queue 30
")
28 Variable speed limit (VSL) When crash risk is higher than critical crash risk, VSLs at the upstream and the downstream of the congested weaving segment are activated RM-VSL RM is always active; When queue is more than 10 vehicles, VSL is activated to reduce speed limit on mainline to provide more gap for ramp vehicles In Microscopic Simulation VISSIM Through Component Object Model (COM) interface Coded by Visual Basic for Application
 5 Upstream 50 mph, Downstream remains N/A 6 Upstream 45 mph, Downstream remains N/A 7 Upstream remains, Downstream 60 mph N/A 8 Upstream remains, Downstream 65 mph N/A 9")
29 Case VSL RM 1 N/A # NA 2 N/A Ks= N/A Ks= (no Queue Control) 4 N/A Ks= (Queue Control) 5 Upstream 50 mph, Downstream remains N/A 6 Upstream 45 mph, Downstream remains N/A 7 Upstream remains, Downstream 60 mph N/A 8 Upstream remains, Downstream 65 mph N/A 9 Upstream 50 mph, Downstream 60 mph N/A 10 Upstream 45 mph, Downstream 60 mph N/A 11 Upstream 50 mph, Downstream 65 mph N/A 12 Upstream 45 mph, Downstream 65 mph N/A 13 Upstream 45 mph, Downstream 55 mph Ks= (Queue Control)

30 30

31 High risk 55 45
32 ATM results Weaving Non-weaving Description Case Conflict Conflict Average travel Conflict Change OR Conflict Change time for total % % N/A No ATM N/A N/A 98.3 Traditional RM No Queue Queue control Up Up DW VSL DW Up 50, Dw Up 45, Dw Up 50, Dw Up 45, Dw RM- VSL Queue control &Up

33 Four urban arterials in Orlando, Florida were chosen; Crash data were collected from March, 2017 to December, 2017; Space-mean speed data collected by 23 IterisVelocity Bluetooth detectors; Signal timing and traffic volume provided by 23 adaptive signal controllers; Weather characteristics collected from MCO. 5/30/

34 Matched case-control design with a control-tocase ratio of 4:1 was employed to select the corresponding non-crash events for each crash event; Three confounding factors, i.e., location, time of day, and day of the week, were selected as matching factors; The real-time travel speed data were extracted for a period of 20 minutes (divided into four 5- minute time slices) prior to crash occurrence. 5/30/
35 Bayesian Conditional Logistic Models Slice 1 Slice 2 Slice 3 Slice 4 Parameter Mean (95% BCI) Hazard Ratio Mean (95% BCI) Hazard Ratio Mean (95% BCI) Hazard Ratio Mean (95% BCI) Hazard Ratio Avg_speed (-0.071, ) (-0.048, ) Up_Vol_LT (0.007, 0.044) (0.005, 0.044) (0.006, 0.045) (0.014, 0.06) Down_GreenR atio (-0.075, ) Rainy ( , 1.065)* (0.055, 1.274) (0.037, 1.322) (0.078, 1.341) 2.054
36 UCF team has implemented the Real-Time risk estimation in the following: I-4, I-95 and CFX network in Orlando I-70 in Colorado Motorways in the Netherlands City streets in Cyprus Expressways in China Currently Orange county arterials 30 Km of an Expressway in Stockholm is currently operational 36
37 More Proactive (but data intensive) approaches / Real- Time Ever richer information Smartphones, sensors, onboard vehicle hardware, provide continuous data Traffic status, weather conditions in real-time Better operation and safety Bottleneck detection in real-time Crash risk evaluation and prediction in real-time More accurate prediction Formation of congestion, queue length, congestion duration Crash-prone conditions: unstable traffic flow, adverse weather Timely communication Media: smartphone, webpage, DMS, radio Suggested countermeasures: trip planning, route choice, travel time calculation, VSL, speed advice, RM, etc. 37


38 Dr. Mohamed Abdel-Aty, PE Center for Advanced Transportation Systems Simulation Department of Civil, Environmental & Construction Engineering University of Central Florida Orlando, FL
National Rural ITS Conference 2006
 National Rural ITS Conference 2006 Design of Automated Variable Speed Limits and Lane Assignments in Rural Areas Presented by: Tom Blaine P. E., POE New Mexico Department of Transportation Intelligent
Assessment of Interaction of Crash Occurrence, Mountainous Freeway Geometry, Real-Time Weather, and Traffic Data
 Assessment of Interaction of Crash Occurrence, Mountainous Freeway Geometry, Real-Time Weather, and Traffic Data Mohamed M. Ahmed, Mohamed Abdel-Aty, and Rongjie Yu This study investigated the effect of
Mohamed A. Abdel-Aty, Ph.D., P.E. Amr Oloufa, Ph.D., P.E. Yichuan Peng, Ph.D. Tsung-Sei Shen, Ph.D. Jaeyoung Lee, Ph.D.
 Mohamed A. Abdel-Aty, Ph.D., P.E. Amr Oloufa, Ph.D., P.E. Yichuan Peng, Ph.D. Tsung-Sei Shen, Ph.D. Jaeyoung Lee, Ph.D. Analyzing the effect of weather parameters on reduced visibility Investigating the
Traffic Surveillance from a Safety Perspective: An ITS Data Application
 Proceedings of the 8th International IEEE Conference on Intelligent Transportation Systems Vienna, Austria, September 13-16, 2005 WB4.2 Traffic Surveillance from a Safety Perspective: An ITS Data Application
Transportation and Road Weather
 Portland State University PDXScholar TREC Friday Seminar Series Transportation Research and Education Center (TREC) 4-18-2014 Transportation and Road Weather Rhonda Young University of Wyoming Let us know
Transportation Research Part C
 Transportation Research Part C 26 (2013) 203 213 Contents lists available at SciVerse ScienceDirect Transportation Research Part C journal homepage: www.elsevier.com/locate/trc A data fusion framework
Bayesian Updating Approach for Real-Time Safety Evaluation with Automatic Vehicle Identification Data
 Bayesian Updating Approach for Real-Time Safety Evaluation with Automatic Vehicle Identification Data Mohamed M. Ahmed, Mohamed Abdel-Aty, and Rongjie Yu Although numerous studies have attempted to use
WRTM and Active Transportation and Demand Management
 The Future of Transportation - 2010 APWA Annual Congress and Exposition WRTM and Active Transportation and Demand Management Weather Responsive Traffic Management Workshop October 7, 2011 Jim Hunt F d
EXAMINATION OF THE SAFETY IMPACTS OF VARYING FOG DENSITIES: A CASE STUDY OF I-77 IN VIRGINIA
 0 0 0 EXAMINATION OF THE SAFETY IMPACTS OF VARYING FOG DENSITIES: A CASE STUDY OF I- IN VIRGINIA Katie McCann Graduate Research Assistant University of Virginia 0 Edgemont Road Charlottesville, VA 0 --
VIRGINIA S I-77 VARIABLE SPEED LIMIT SYSTEM FOR LOW VISIBILITY CONDITIONS
 VIRGINIA S I-77 VARIABLE SPEED LIMIT SYSTEM FOR LOW VISIBILITY CONDITIONS Christopher D. McDonald, PE, PTOE Regional Operations Director, Southwest Region NRITS and ITS Arizona Annual Conference October
TMC Monthly Operational Summary
 TMC Monthly Operational Summary March Bureau of Transportation Systems Management & Operations (TSMO) NH Department of Transportation s Mission Transportation excellence enhancing the quality of life in
TMC Monthly Operational Summary
 TMC Monthly Operational Summary July 1 Bureau of Transportation Systems Management & Operations (TSMO) NH Department of Transportation s Mission Transportation excellence enhancing the quality of life
Active Traffic & Safety Management System for Interstate 77 in Virginia. Chris McDonald, PE VDOT Southwest Regional Operations Director
 Active Traffic & Safety Management System for Interstate 77 in Virginia Chris McDonald, PE VDOT Southwest Regional Operations Director Interstate 77 at Fancy Gap Mountain Mile markers 0-15 Built in late
A Proposed Driver Assistance System in Adverse Weather Conditions
 1 A Proposed Driver Assistance System in Adverse Weather Conditions National Rural ITS Conference Student Paper Competition Second runner-up Ismail Zohdy Ph.D. Student, Department of Civil & Environmental
Accident Analysis and Prevention
 Accident Analysis and Prevention 94 (2016) 59 64 Contents lists available at ScienceDirect Accident Analysis and Prevention journal homepage: www.elsevier.com/locate/aap Utilizing the eigenvectors of freeway
What is 511? Need for 511 Services. Development & Deployment of Regional Road and Weather Information Supporting 511 Traveler Services
 Development & Deployment of Regional Road and Weather Information Supporting 511 Traveler Services Leon F. Osborne University of North Dakota Regional Weather Information Center Grand Forks, ND David L.
Responsive Traffic Management Through Short-Term Weather and Collision Prediction
 Responsive Traffic Management Through Short-Term Weather and Collision Prediction Presenter: Stevanus A. Tjandra, Ph.D. City of Edmonton Office of Traffic Safety (OTS) Co-authors: Yongsheng Chen, Ph.D.,
Real-time Traffic Safety Evaluation Models And Their Application For Variable Speed Limits
 University of Central Florida Electronic Theses and Dissertations Doctoral Dissertation (Open Access) Real-time Traffic Safety Evaluation Models And Their Application For Variable Speed Limits 2013 Rongjie
CEE 320 Midterm Examination (50 minutes)
") CEE 320 Midterm Examination (50 minutes) Fall 2009 Please write your name on this cover. Please write your last name on all other exam pages This exam is NOT open book, but you are allowed to use one 8.5x11
CEE 320 Midterm Examination (50 minutes) Fall 2009 Please write your name on this cover. Please write your last name on all other exam pages This exam is NOT open book, but you are allowed to use one 8.5x11
Analysis of Travel Time Reliability on Indiana Interstates
 MN WI MI IL IN OH USDOT Region V Regional University Transportation Center Final Report NEXTRANS Project No 014PY01 Analysis of Travel Time Reliability on Indiana Interstates By Maria Martchouk Graduate
Active Traffic Management Case Study: Phase 1
 University of Nebraska - Lincoln DigitalCommons@University of Nebraska - Lincoln Nebraska Department of Transportation Research Reports Nebraska LTAP 3-2016 Active Traffic Management Case Study: Phase
Improving Traffic Safety And Drivers' Behavior In Reduced Visibility Conditions
 University of Central Florida Electronic Theses and Dissertations Doctoral Dissertation (Open Access) Improving Traffic Safety And Drivers' Behavior In Reduced Visibility Conditions 2011 Hany Mohamed Hassan
Research Needs for Weather-Responsive Traffic Management
 1 Research Needs for Weather-Responsive Traffic Management Paul A. Pisano, Team Leader Federal Highway Administration (FHWA), Office of Operations Road Weather Management 400 Seventh Street, S.W. HOTO-1,
Evaluation of fog-detection and advisory-speed system
 Evaluation of fog-detection and advisory-speed system A. S. Al-Ghamdi College of Engineering, King Saud University, P. O. Box 800, Riyadh 11421, Saudi Arabia Abstract Highway safety is a major concern
Long-Term Evaluation of the Operational Performance of Fixed Time Ramp Metering Control Strategy: A Freeway Corridor Study
 Canadian Journal of Civil Engineering Long-Term Evaluation of the Operational Performance of Fixed Time Ramp Metering Control Strategy: A Freeway Corridor Study Journal: Canadian Journal of Civil Engineering
Estimation Of Hybrid Models For Real-time Crash Risk Assessment On Freeways
 University of Central Florida Electronic Theses and Dissertations Doctoral Dissertation (Open Access) Estimation Of Hybrid Models For Real-time Crash Risk Assessment On Freeways 2005 anurag pande University
Effect of Environmental Factors on Free-Flow Speed
 Effect of Environmental Factors on Free-Flow Speed MICHAEL KYTE ZAHER KHATIB University of Idaho, USA PATRICK SHANNON Boise State University, USA FRED KITCHENER Meyer Mohaddes Associates, USA ABSTRACT
Relationship between Traffic Density, Speed and Safety and Its Implication on Setting Variable Speed Limits on Freeways
 1 1 1 1 1 1 1 1 0 1 0 1 0 1 Relationship between Traffic Density, Speed and Safety and Its Implication on Setting Variable Speed Limits on Freeways Jake Kononov, Ph.D., P.E. Colorado Department of Transportation
Organized Chain-Up and VSL
 Organized Chain-Up and VSL Jim Mahugh, PE WSDOT SC Region Traffic Engineer North/West Passage VSL Peer Exchange January 28, 2015 Snoqualmie Pass 2 Limits of VSL EB: MP 48.12 to 66.56 WB: MP 46.69 to 66.90
Using High-Resolution Detector and Signal Data to Support Crash Identification and Reconstruction. Indrajit Chatterjee Gary Davis May, 2011
 Using High-Resolution Detector and Signal Data to Support Crash Identification and Reconstruction Indrajit Chatterjee Gary Davis May, 2011 Introduction Road accidents are complex phenomenon. Causal factors
Adaptive Traffic Speed Estimation
 Boise State University ScholarWorks Civil Engineering Faculty Publications and Presentations Department of Civil Engineering 1-1-2014 Adaptive Traffic Speed Estimation Brian Portugais Boise State University
Chapter 5 Traffic Flow Characteristics
 Chapter 5 Traffic Flow Characteristics 1 Contents 2 Introduction The Nature of Traffic Flow Approaches to Understanding Traffic Flow Parameters Connected with Traffic Flow Categories of Traffic Flow The
Road Weather Management Program
 Road Weather Management Program AASHTO/TRB Joint Maintenance Conference: Highway Safety & Reliability (Winter Maintenance and Highway Safety and Reliability) 7/22/2015 Gabe Guevara. P.E. FHWA Office of
2.1 Traffic Stream Characteristics. Time Space Diagram and Measurement Procedures Variables of Interest
 2.1 Traffic Stream Characteristics Time Space Diagram and Measurement Procedures Variables of Interest Traffic Stream Models 2.1 Traffic Stream Characteristics Time Space Diagram Speed =100km/h = 27.78
The quality of loop data and the health of California s freeway loop detectors
 The quality of loop data and the health of California s freeway loop detectors Chao Chen, Jaimyoung Kwon and Pravin Varaiya PeMS Development Group University of California, Berkeley, CA 94720 Summary The
Temporal and Spatial Impacts of Rainfall Intensity on Traffic Accidents in Hong Kong
 International Workshop on Transport Networks under Hazardous Conditions 1 st 2 nd March 2013, Tokyo Temporal and Spatial Impacts of Rainfall Intensity on Traffic Accidents in Hong Kong Prof. William H.K.
DOES WEATHER AFFECT HIGHWAY CAPACITY?
 DOES WEATHER AFFECT HIGHWAY CAPACITY? Edward CHUNG Head of ITS LAVOC, EPFL, Station 18, Lausanne CH-1015, SWITZERLAND, edward@iis.utokyo.ac.jp Osamu OHTANI Graduate Student, Nihon University, Tokyo, JAPAN
What are Intelligent Transportation Systems? Major ITS Areas
 Intelligent Transportation Systems in Small Cities and Rural Areas Indiana Road School March 20, 2001 Steven Beningo Federal Highway Administration Midwestern Resource Center What are Intelligent Transportation
Accident Analysis and Prevention
 Accident Analysis and Prevention 64 (2014) 52 61 Contents lists available at ScienceDirect Accident Analysis and Prevention j ourna l h om epage: www.elsevier.com/locate/aap Surrogate safety measure for
NJDOT Pedestrian Safety Analysis Tool 2015 GIS T Conference
 NJDOT Pedestrian Safety Analysis Tool 2015 GIS T Conference NJDOT Pedestrian Safety Analysis Tool Justin Furch GIT Department Manager Michael Baker International Pedestrian Safety in NJ: Has the highest
DEVELOPING DECISION SUPPORT TOOLS FOR THE IMPLEMENTATION OF BICYCLE AND PEDESTRIAN SAFETY STRATEGIES
 DEVELOPING DECISION SUPPORT TOOLS FOR THE IMPLEMENTATION OF BICYCLE AND PEDESTRIAN SAFETY STRATEGIES Deo Chimba, PhD., P.E., PTOE Associate Professor Civil Engineering Department Tennessee State University
Background and Hong Kong Statistics. Background. Estimation of Network Reliability under Traffic Incidents for ITS Applications
 Estimation of Network Reliability under Traffic Incidents for ITS Applications Ir Prof. William H.K. Lam Chair Professor of Civil & Transportation Engineering and Head Department of Civil & Environmental
Weather Information for Road Managers
 Weather Information for Road Managers by Paul A. Pisano, Lynette C. Goodwin and Andrew D. Stern How Does Weather Affect Roads? The complex interactions between weather and roads have major affects on traffic
Transportation Management Center s Mission
 Bureau of Transportation Systems Management & Operations (TSMO) NH Department of Transportation s Mission Transportation excellence enhancing the quality of life in New Hampshire. Transportation Management
MnDOT Method for Calculating Measures of Effectiveness (MOE) From CORSIM Model Output
 From CORSIM Model Output") MnDOT Method for Calculating Measures of Effectiveness (MOE) From CORSIM Model Output Rev. April 29, 2005 MnDOT Method for Calculating Measures of Effectiveness (MOE) From CORSIM Model Output Table of
MnDOT Method for Calculating Measures of Effectiveness (MOE) From CORSIM Model Output Rev. April 29, 2005 MnDOT Method for Calculating Measures of Effectiveness (MOE) From CORSIM Model Output Table of
Examining travel time variability using AVI data
 CAITR 2004 Examining travel time variability using AVI data by Ruimin li ruimin.li@eng.monash.edu.au 8-10 December 2004 INSTITUTE OF TRANSPORT STUDIES The Australian Key Centre in Transport Management
Real-Time Crash Prediction Model for Application to Crash Prevention in Freeway Traffic
 Paper No. 032749 RealTime Crash Prediction Model for Application to Crash Prevention in Freeway Traffic Chris Lee Department of Civil Engineering University of Waterloo Waterloo, Ontario, Canada N2L 3G1
Real-Time Crash Prediction Model for the Application to Crash Prevention in Freeway Traffic
 Paper No. 032749 RealTime Crash Prediction Model for the Application to Crash Prevention in Freeway Traffic Chris Lee Department of Civil Engineering University of Waterloo Waterloo, Ontario, Canada N2L
Appendix BAL Baltimore, Maryland 2003 Annual Report on Freeway Mobility and Reliability
 (http://mobility.tamu.edu/mmp) Office of Operations, Federal Highway Administration Appendix BAL Baltimore, Maryland 2003 Annual Report on Freeway Mobility and Reliability This report is a supplement to:
EVALUATION OF SAFETY PERFORMANCES ON FREEWAY DIVERGE AREA AND FREEWAY EXIT RAMPS. Transportation Seminar February 16 th, 2009
 EVALUATION OF SAFETY PERFORMANCES ON FREEWAY DIVERGE AREA AND FREEWAY EXIT RAMPS Transportation Seminar February 16 th, 2009 By: Hongyun Chen Graduate Research Assistant 1 Outline Introduction Problem
Transportation Management Center s Mission
 Bureau of Transportation Systems Management & Operations (TSMO) NH Department of Transportation s Mission Transportation excellence enhancing the quality of life in New Hampshire. Transportation Management
Table of Contents Introduction... 4 Study Area... 5
 Table of Contents Introduction... 4 Study Area... 5 Streets and s... 5 Traffic Volumes... 8 Recent and Anticipated Development... 10 Crash Analysis... 10 Projected Traffic Volumes... 11 Trip Generation...
Development and Evaluation of Online Estimation Methods for a Feedback-Based Freeway Ramp Metering Strategy
 Development and Evaluation of Online Estimation Methods for a Feedback-Based Freeway Ramp Metering Strategy Kaan Ozbay, Ph.D. Associate Professor Rutgers University, Civil and Environmental Engineering,
Weather and Travel Time Decision Support
 Weather and Travel Time Decision Support Gerry Wiener, Amanda Anderson, Seth Linden, Bill Petzke, Padhrig McCarthy, James Cowie, Thomas Brummet, Gabriel Guevara, Brenda Boyce, John Williams, Weiyan Chen
Freeway Work Zone Lane Capacity
 Report Title Report Date: 2009 Freeway Work Zone Lane Capacity Principle Investigator Vendor Name and Address Name Drakopoulos, Alex «Vendor» Affiliation Marquette University Address 263 Haggerty Hall
FIELD EVALUATION OF SMART SENSOR VEHICLE DETECTORS AT RAILROAD GRADE CROSSINGS VOLUME 4: PERFORMANCE IN ADVERSE WEATHER CONDITIONS
 CIVIL ENGINEERING STUDIES Illinois Center for Transportation Series No. 15-002 UILU-ENG-2015-2002 ISSN: 0197-9191 FIELD EVALUATION OF SMART SENSOR VEHICLE DETECTORS AT RAILROAD GRADE CROSSINGS VOLUME 4:
Draft Final Report. SHRP2 Project L08 Incorporation of Travel Time Reliability into the Highway Capacity Manual. Prepared For: SHRP2
 SHRP2 Project L08 Incorporation of Travel Time Reliability into the Highway Capacity Manual Draft Final Report DISCLAIMER This report is furnished only for review by members of the SHRP2 project panel
Solar Powered Illuminated RPMs
 Report Title Report Date: 2000 Solar Powered Illuminated RPMs Principle Investigator Name Meyer, Eric Affiliation Meyer ITS Address 2617 W 27th Terrace Lawrence, KS 66047 Vendor Name and Address Interplex
Assessing the uncertainty in micro-simulation model outputs
 Assessing the uncertainty in micro-simulation model outputs S. Zhu 1 and L. Ferreira 2 1 School of Civil Engineering, Faculty of Engineering, Architecture and Information Technology, The University of
Estimating the vehicle accumulation: Data-fusion of loop-detector flow and floating car speed data
 Estimating the vehicle accumulation: Data-fusion of loop-detector flow and floating car speed data Paul B.C. van Erp (corresponding author) Victor L. Knoop Serge P. Hoogendoorn Department of Transport
AN INVESTIGATION INTO THE IMPACT OF RAINFALL ON FREEWAY TRAFFIC FLOW
 AN INVESTIGATION INTO THE IMPACT OF RAINFALL ON FREEWAY TRAFFIC FLOW Brian L. Smith Assistant Professor Department of Civil Engineering University of Virginia PO Box 400742 Charlottesville, VA 22904-4742
Investigation of Driver Speed Choice and Crash Characteristics During Low Visibility Events
 Investigation of Driver Speed Choice and Crash Characteristics During Low Visibility Events http://www.virginiadot.org/vtrc/main/online_reports/pdf/17-r4pdf KATIE McCANN Operations Planning Analyst Operations
MetConsole AWOS. (Automated Weather Observation System) Make the most of your energy SM
 Make the most of your energy SM") MetConsole AWOS (Automated Weather Observation System) Meets your aviation weather needs with inherent flexibility, proven reliability Make the most of your energy SM Automated Weather Observation System
MetConsole AWOS (Automated Weather Observation System) Meets your aviation weather needs with inherent flexibility, proven reliability Make the most of your energy SM Automated Weather Observation System
Cumulative Count Curve and Queueing Analysis
 Introduction Traffic flow theory (TFT) Zhengbing He, Ph.D., http://zhengbing.weebly.com School of traffic and transportation, Beijing Jiaotong University September 27, 2015 Introduction Outline 1 Introduction
Transportation Management Center s Mission
 Bureau of Transportation Systems Management & Operations (TSMO) NH Department of Transportation s Mission Transportation excellence enhancing the quality of life in New Hampshire. Transportation Management
HSIP FUNDING APPLICATION
 Page 1 Lucas County - Sylvania Ave at Centennial Rd DATE 5/1/2013 Project Information: COUNTY Lucas County LOCATION TYPE PROJECT SERVICE LIFE 20 years SEGMENT INFORMATION ROUTE BEGIN SLM END SLM PRESENT
Appendixx C Travel Demand Model Development and Forecasting Lubbock Outer Route Study June 2014
 Appendix C Travel Demand Model Development and Forecasting Lubbock Outer Route Study June 2014 CONTENTS List of Figures-... 3 List of Tables... 4 Introduction... 1 Application of the Lubbock Travel Demand
How GIS Can Help With Tribal Safety Planning
 How GIS Can Help With Tribal Safety Planning Thomas A. Horan, PhD Brian Hilton, PhD Arman Majidi, MAIS Center for Information Systems and Technology Claremont Graduate University Goals & Objectives This
A Data Driven Approach to Quantifying the Effect of Crashes
 A Data Driven Approach to Quantifying the Effect of Crashes Final Report (Year 2) SOUTHEASTERN TRANSPORTATION CENTER Obaidur Kazi, Xu Zhang, and Mei Chen February 2018 US DEPARTMENT OF TRANSPORTATION GRANT
Automated Delay Estimation at Signalized Intersections: Phase I Concept and Algorithm Development
 Brigham Young University BYU ScholarsArchive All Theses and Dissertations 2011-03-16 Automated Delay Estimation at Signalized Intersections: Phase I Concept and Algorithm Development Taylor R. Forbush
Comparison of Two Controllers for Variable Speed Limit Control
 Comparison of Two Controllers for Variable Speed Limit Control Krešimir Kušić, Nino Korent, Martin Gregurić, Edouard Ivanjko Faculty of Transport and Traffic Sciences/University of Zagreb Vukelićeva 4,
Identification of Regional Subcenters Using Spatial Data Analysis for Estimating Traffic Volume
 Identification of Regional Subcenters Using Spatial Data Analysis for Estimating Traffic Volume Fang Zhao and Nokil Park Lehman Center for Transportation Research Department of Civil & Env.. Engineering
Appendix C Final Methods and Assumptions for Forecasting Traffic Volumes
 Fairview Ave. and Main St. Improvements and Local Streets Plan Appendices Ada County Highway District Appendix C Final Methods and Assumptions for Forecasting Traffic Volumes January 3, 207 Appendices
Using PeMS Data to Empirically Diagnose Freeway Bottleneck Locations in Orange
 Using PeMS Data to Empirically Diagnose Freeway Bottleneck Locations in Orange County, California Robert L. Bertini Department of Civil and Environmental Engineering Portland State University P.O. Box
Traffic Profile Prediction
 Traffic Profile Prediction Collection, Cleansing, and Analysis of Traffic, Event, and Weather Data David Vickers Staff Engineer Adam Van Horn Research Analyst NATMEC 2016 Innovations in Traffic Data Collection
10/18/2016 The Hoosier Co. Inc W. 86th Street, Indianapolis, IN
 10/18/2016 The Hoosier Co. Inc. 5421 W. 86th Street, Indianapolis, IN 46268 1 Agenda What is RWIS? What options are available? Innovation/Improvement in Winter Operations & Maintenance Key RWIS sensing
2016 APWA Snow Conference. Web-based GIS for Municipal Snow Operations
 2016 APWA Snow Conference Web-based GIS for Municipal Snow Operations Christopher M. Cignoli, P.E. - Director of Public Works, Springfield, MA Bob Houldson - Director IT Services for the Department of
A Speed-Delay Study of Highway 401 in Toronto, Ontario
 A Speed-Delay Study of Highway 41 in Toronto, Ontario Bruce Hellinga and Michel Van Aerde Department of Civil Engineering Queen's University, Kingston, Ontario, Canada K7L 3N6 ABSTRACT Travel time is an
Evaluation of the City of Scottsdale Loop 101 Photo Enforcement Demonstration Program
 Evaluation of the City of Scottsdale Loop 101 Photo Enforcement Demonstration Program Draft Summary Report Prepared by: Simon Washington, Ph.D. Kangwon Shin Ida Van Shalkwyk Arizona State University Department
Current Practices in Transportation Management During Inclement Weather Lynette Goodwin and Paul Pisano
 Current Practices in Transportation Management During Inclement Weather Lynette Goodwin and Paul Pisano Abstract. The Road Weather Management Program of the Federal Highway Administration (FHWA) has documented
Impacts of the I-77 Variable Speed Limit System on Speed and Crash Characteristics During Low Visibility Conditions
 Impacts of the I-77 Variable Speed Limit System on Speed and Crash Characteristics During Low Visibility Conditions http://www.virginiadot.org/vtrc/main/online_reports/pdf/19-r6.pdf DANIELA E. GONZALES
structure of involved in these spot to transform data points B-1
 1 1 1 1 SUPPLEMENT B METHODOLOGICAL DETAILS INTRODUCTION This supplement augments Chapter by providing additionall details about how to analyze travel time reliability for segments, routes, and networks.
Xiaoguang Wang, Assistant Professor, Department of Geography, Central Michigan University Chao Liu,
 Xiaoguang Wang, Email: wang9x@cmich.edu Assistant Professor, Department of Geography, Central Michigan University Chao Liu, Email: cliu8@umd.edu Research Associate, National Center for Smart Growth, Research
Correlating Sun glare and Traffic Accidents
 Correlating Sun glare and Traffic Accidents ABSTRACT Kenneth A. Ryan, P.E., PTOE and Alisa Babler, P.E. The purpose of this effort is two fold: (1) To map out locations along Colorado State Highways where
Freeway Work Zone Lane Capacity
 Freeway Work Zone Lane Capacity Thomas Notbohm, P.E. Wisconsin Department of Transportation Thomas.Notbohm@dot.state.wi.us Alex Drakopoulos Department of Civil & Environmental Engineering Marquette University,
MDSS and Advanced Forecasting STSMO Weather Workshop Dave Huft, SDDOT Research Program Manager September 12, 2017
 Connecting South Dakota and the Nation MDSS and Advanced Forecasting STSMO Weather Workshop Dave Huft, SDDOT Research Program Manager September 12, 2017 1 Weather Impacts & Strategies Winter perceived
Traffic Flow Theory & Simulation
 Traffic Flow Theory & Simulation S.P. Hoogendoorn Lecture 4 Shockwave theory Shockwave theory I: Introduction Applications of the Fundamental Diagram February 14, 2010 1 Vermelding onderdeel organisatie
Use of Performance Measurement System Data to Diagnose Freeway Bottleneck Locations Empirically in Orange County, California
 Use of Performance Measurement System Data to Diagnose Freeway Bottleneck Locations Empirically in Orange County, California Robert L. Bertini and Aaron M. Myton To improve freeway modeling and operations,
TMC Monthly Operational Summary
 TMC Monthly Operational Summary January 8 Bureau of Transportation Systems Management & Operations (TSMO) NH Department of Transportation s Mission Transportation excellence enhancing the quality of life
I-95/I-85 INTERCHANGE ROADWAY SAFETY ASSESSMENT
 FINAL REPORT I-95/I-85 INTERCHANGE ROADWAY SAFETY ASSESSMENT Prepared for: Prepared by: 117306012.B MARCH 2013 Final Report March 2013 I-95/I-85 Interchange ROADWAY SAFETY ASSESSMENT Prepared for: Prepared
You Call That Good Data? How to Survive a Consent Decree Flow Monitoring Program
 Hampton Roads Sanitation District You Call That Good Data? How to Survive a Consent Decree Flow Monitoring Program September 2011 You Call That Good Data? How to Survive a Consent Decree Flow Monitoring
Session 6: and Evaluation. M c Farland Management, LLC
 Session 6: Performance Measurement and Evaluation State of the Practice Overview 1 Why Evaluate WRTM Strategies Understand system performance and benefits Specific benefits directly attributable to WRTM
Prioritization of Freeway Segments Based on Travel Time Reliability and Congestion Severity
 Prioritization of Freeway Segments Based on Travel Time Reliability and Congestion Severity A THESIS SUBMITTED TO THE FACULTY OF UNIVERSITY OF MINNESOTA BY Rudrakshi Biswas IN PARTIAL FULFILLMENT OF THE
Determining the minimum percentage of vehicles equipped with a ucan necessary to accurately estimate the traffic speed
 Delft University of Technology Faculty of Electrical Engineering, Mathematics and Computer Science Delft Institute of Applied Mathematics Determining the minimum percentage of vehicles equipped with a
10/18/2016 The Hoosier Co. Inc W. 86th Street, Indianapolis, IN
 10/18/2016 The Hoosier Co. Inc. 5421 W. 86th Street, Indianapolis, IN 46268 1 Today s Topics Weather impacts What is RWIS? How old is this tool? Key RWIS Technology/Innovation Key RWIS sensing parameters
Project Objectives/Outcomes
 Using TRANSIMS for On-line Transportation System Management during Emergencies Peer Exchange Meeting March 15, 2012 Project Objectives/Outcomes Further development of the Buffalo TRANSIMS model Modifying
CONGESTION REPORT 1 st Quarter 2016
 CONGESTION REPORT 1 st Quarter 2016 A quarterly update of the National Capital Region s traffic congestion, travel time reliability, top-10 bottlenecks and featured spotlight April 20, 2016 ABOUT TPB Transportation
FHWA Road Weather Management Program Update
 FHWA Road Weather Management Program Update 2015 Winter Maintenance Peer Exchange Bloomington, MN September 21-25, 2015 Gabe Guevara FHWA Office of Operations Road Weather Management Team 2015 Winter Maintenance
Effectiveness of Experimental Transverse- Bar Pavement Marking as Speed-Reduction Treatment on Freeway Curves
 Effectiveness of Experimental Transverse- Bar Pavement Marking as Speed-Reduction Treatment on Freeway Curves Timothy J. Gates, Xiao Qin, and David A. Noyce Researchers performed a before-and-after analysis
Accessing and Using Indiana Traffic Data
 Accessing and Using Indiana Traffic Data Purdue Road School March 6, 2013 Presented by: Gregory Katter, PE Asset Planning Indiana Traffic Data 1. Overview of Traffic Data Collection Program 2. Accessing