Computation of zonal (u) and meridional (v) components. Useful websites.
|
|
|
- Robert Joseph
- 5 years ago
- Views:
Transcription
1 UNIVERSITY OF NAIROBI COLLEGE OF BIOLOGICAL AND PHYSICAL SCIENCES School of Physical Sciences Bachelor of Science in Meteorology Weather Analysis (SMR 204) Practical Manual for Academic Year 2014/15 (ODL GROUP 3L) Written By: Prof. Ininda J. M Department of Meteorology University of Nairobi
2 INTRODUCTION TO PRACTICALS IN WEATHER ANALYSIS The series of practical in WEATHER ANALYSIS are aimed at equipping the students with practical skills in current practices of weather analysis and computational skills. PRACTICAL TIME TABLE (SMR /15) SERIAL NO. DESCRIPTION DATE DUE FOR HANDING IN Practical - 01 Computation of zonal (u) and meridional (v) components Allocation of percentage Marks Practical - 02 Practical - 03 Practical 04 Practical - 05 Practical - 06 Practical - 07 Practical - 08 Computation speed and direction Isogon Streamline Anaysis Streamline-Isotach Analysis Decoding the weather message Plotting SYNOP report on the weather Chart Coding upper air the weather message Plotting the sounding on a T CAT March 2015 TOTAL MARKS Useful websites (For upper air wind and Temperature coding)
3 PRACTICAL 1: COMPUTATION OF ZONAL (u) and MERIDIONAL (v) COMPONENTS Objective: The practical is aimed at enabling the student compute the zonal and meridional wind components given the speed and direction. Tools a) A table of speed and direction b) Lecture Notes c) Excel software Procedure: Compute the zonal and meridional wind component at various levels given in table 1 Procedure: Compute the zonal and meridional wind component at various levels given in table 1 The zonal and meridional components are given by u V sin(dir) v V cos(dir) Where V TABLE 1 DATA FOR PRACTICAL NO 1 TABLE 1: Speed and Direction Given station DIR SPEED U V station DIR SPEED U V S S S S S S S S S S S S S S S S S S S S S S S S S S S S
4 S S S S S S S S S S S S S S S S S S S S S S S S S S S S S S S S PRACTICAL 2: COMPUTATION SPEED AND DIRECTION Objective: The practical is aimed at enabling the student compute the speed and direction given the zonal and meridional wind components.. Tools a) A table of zonal and meridional wind components. b) Lecture Notes Procedure: Compute the speed and direction using the zonal and meridional wind component at various levels given in table 2. Use excel Software The speed is given by the equation 2 2 SP u v where SP is the speed, u the zonal wind and v the meridional wind. (a) Computation of Direction
5 The wind direction is define as the direction from where the wind is coming from. It is measure from the true north clockwise. When the wind is blowing from west (east), the u (zonal) component is positive (negative). While when the wind is blowing from south (north), the v (meridional) component is positive. To compute the direction were consider the four quadrants; Case 1: u<0 and v<0 The angle of the direction is between 0 o and 90 o and is given by 1 u dir tan ABS v or 1 v dir 90 tan ABS u Case 2: u<0 and v>0 The angle of the direction is between 90 o and 180 o and is given by 1 u dir 180 tan ABS v or 1 v dir 90 tan ABS u Case 3: u>0 and v>0 The angle of the direction is between 18 0 o and 270 o and is given by 1 u dir 180 tan ABS v or 1 v dir 270 tan ABS u Case 4: u>0 and v<0 The angle of the direction is between 270 o and 360 o and is given by
6 1 u dir 360 tan ABS v or 1 v dir 270 tan ABS u Table 2: Zonal and meridional components Given TIME 7.5N 7.5S U V SPEED DIRECTION U V SPEED DIRECTION Jan Feb Mar Apr May Jun Jul Aug Sep Oct Nov Dec Jan Feb Mar Apr May
7 PRACTICAL 03: ISOGONAL STREAMLINE ANALYSIS Objective: The practical is aimed at enabling the student gain skill in analysing wind using isogonstreamline method. Definition: Streamlines: Streamlines are lines that are tangential to the flow at a given instant of time Isogons: Isogons are lines joining points of equal direction Singular points: Singular points are points to which more than one streamlines can be drawn or about which streamlines form a closed curve. Tools: The data of wind direction is given on the chart (Figure 1) Procedure: (i) Draw isogons for 360 0,90 0, and (ii) Locate singular points (iii)draw intermediate isogons at 30 0 interval, smoothen the lines (iv) Refine the position of the singular points. (v) Draw short segments of streamlines along each isogon, (vi) Starting at the edge of the chart draw smooth streamlines, ensuring thsat each isogon is parallel to short segments (vii)where two streamlines diverge you may start another between them (viii) Where two streamline flow together join them smoothly

8 Figure 1. The spatial distribution of wind direction (DATA FOR PRACTICAL 03)
9 PRACTICAL 04: STREAMLINE-ISOTACH ANALYSIS Objective: The practical is aimed at enabling the student gain skill in analysing wind using streamlineisotach method. Definition: Isotach Isotach are lines joining points of equal wind speed Singular points: Tools: The wind data is given on the chart (Figure 2) Procedure: Draw two sets of lines, the streamlines and isotachs Streamline: Starting at the edge of the chart draw smooth streamlines, ensuring thsat each isogon is parallel to wind vector. Where two streamlines diverge you may start another between them Where two streamline flow together join them smoothly Identify singular points Isotach Determine a suitable interval and draw the isotachs.

10 Figure 2: The spatial distribution of wind (DATA FOR PRACTICAL 04)
11 PRACTICAL 5: DECODING THE WEATHER MESSAGE Objective: The practical is aimed at enabling the student decode the weather messages a) A table of coded weather messages b) The lecture notes Tools a) Extract the SYNOP REPORT for the station and date and time allocated to you.. For example to obtain data for 00GMT for 16 th April 2014 enter the information as shown.
12 Reg. No. Station TIME 1200GMT Lodwar Marsabit Kitale Wajir Kisumu Nyeri Embu Nairobi voi Mombasa Eldoret TIME 1500GMT Lodwar Marsabit Kitale Wajir Kisumu Nyeri Embu Nairobi voi Mombasa Eldoret PRACTICAL 6: PLOTTING THE WEATHER INFORMATION ON A CHART Objective: The practical is aimed at enabling the student plot on a weather chart. Tools a) A table of coded weather messages b) Lecture Notes
13 c) A chart (map) with station indicated on it Procedure: Plot the weather messages for the stations over Kenya date and time you were allocated REG. NO. & NAME MONTH, DATE AND TIME 12 GMT 15 TH APRIL GMT 15 TH APRIL GMT 16 TH APRIL GMT 16 TH APRIL GMT 17 TH APRIL GMT 17 TH APRIL GMT 18 TH APRIL GMT 18 TH APRIL GMT 19 TH APRIL GMT 19 TH APRIL GMT 20 TH APRIL GMT 20 TH APRIL GMT 21 ST APRIL GMT 21 ST APRIL GMT 22 ND APRIL GMT 22 ND APRIL GMT 23 RD APRIL GMT 23 RD APRIL GMT 24 TH APRIL GMT 24 TH APRIL GMT 25 TH APRIL GMT 25 TH APRIL GMT 27 TH APRIL GMT 27 TH APRIL GMT 28 TH APRIL GMT 28 TH APRIL GMT 29 TH APRIL GMT 29 TH APRIL GMT 30 TH APRIL GMT 30 TH APRIL 2014 (N B. You will need to print out the figure1)
14 Figure 3: The Synoptic stations over Kenya
15 PRACTICAL 7: CODING THEUPPER AIR OBSERVED WEATHER Objective: The practical is aimed at enabling the student code the observed weather a) A table of observed weather b) The lecture notes Procedure: Code the weather message give in table 2 TABLE 2 Sounding for station n at 15hr local time and the station is located at 75 O E. The radio sonde launched at 14hr 30min local time. Pressure level(mb) Geopotential Height (m) Temperature o C Dew point Temp C Wind speed Kt Direction
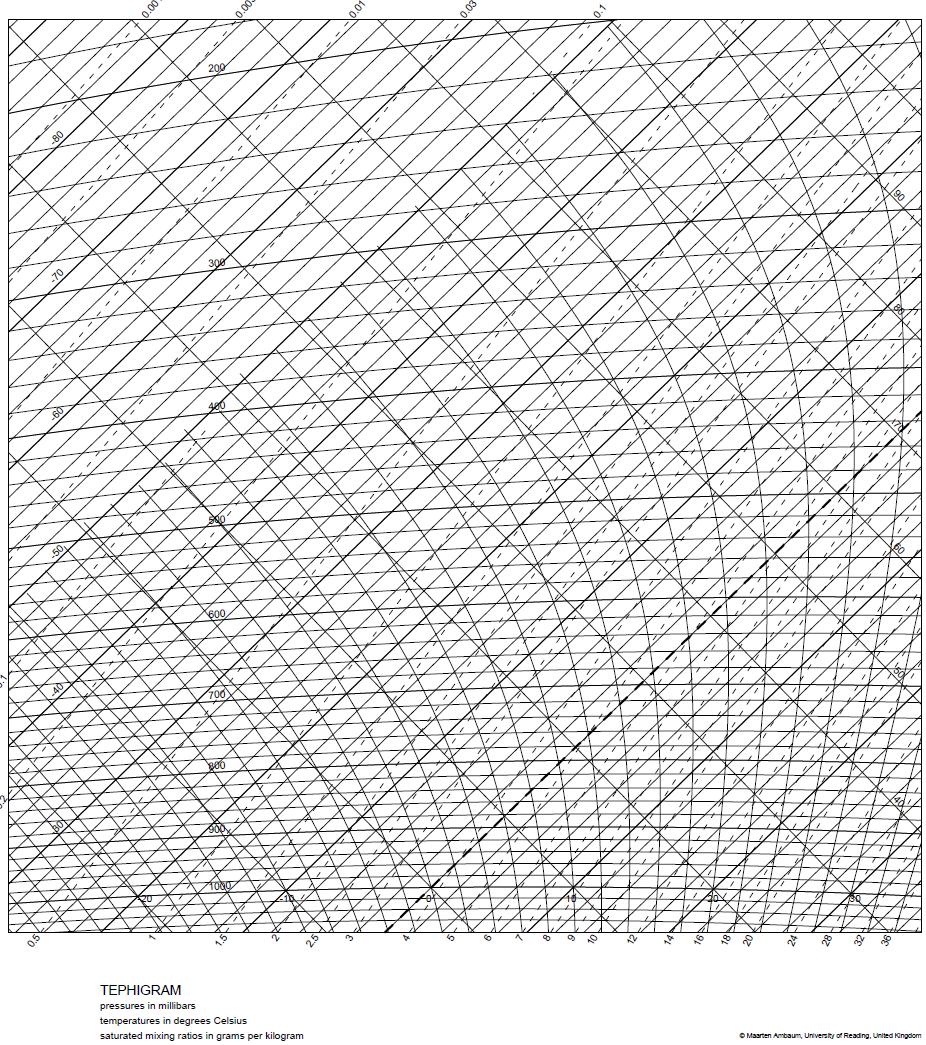
16 PRACTICAL NO. 8: PLOTTING THE SOUNDING ON A T Objective: The practical is aimed at enabling the student to plot the sounding on T And compute the convective parameters. Tools a) Extract the TEMP data for the station and date allocated to you at 00 GMTor 23 GMT For example to obtain data for 23GMT for 14 th April 2010 enter the information as shown. a) Using a T (i) Plot the given temperature and dew point temperature a T gram and Indicate the layers that experienced warming/ cooling and moistening / drying. (ii) Determine the LCL, equivalent potential temperature, lifted Index. (iii) Find the mixing ratio, specific humidity,,relative humidity and vapour pressure at surface, 800mb,700mb, 600mb, 500mb, and 400mb
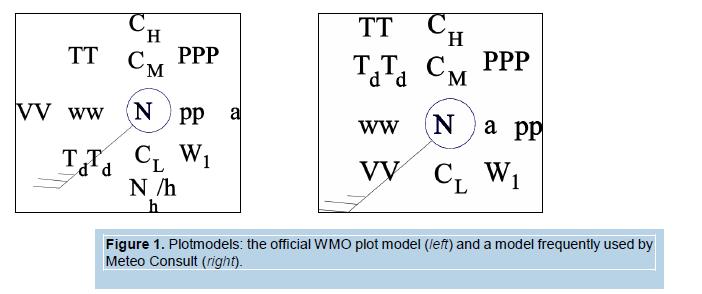
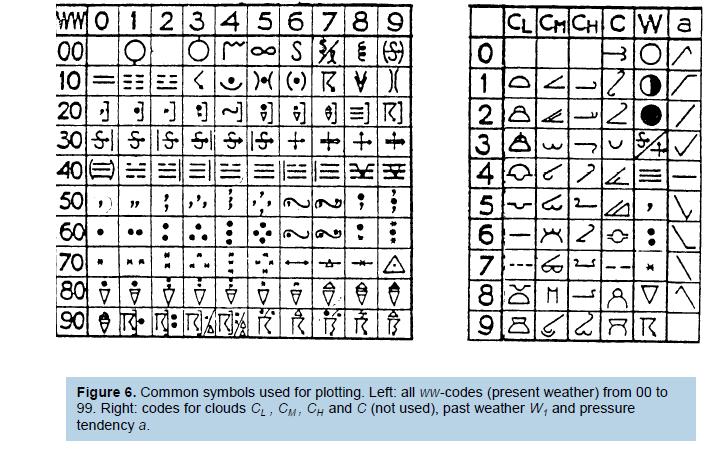
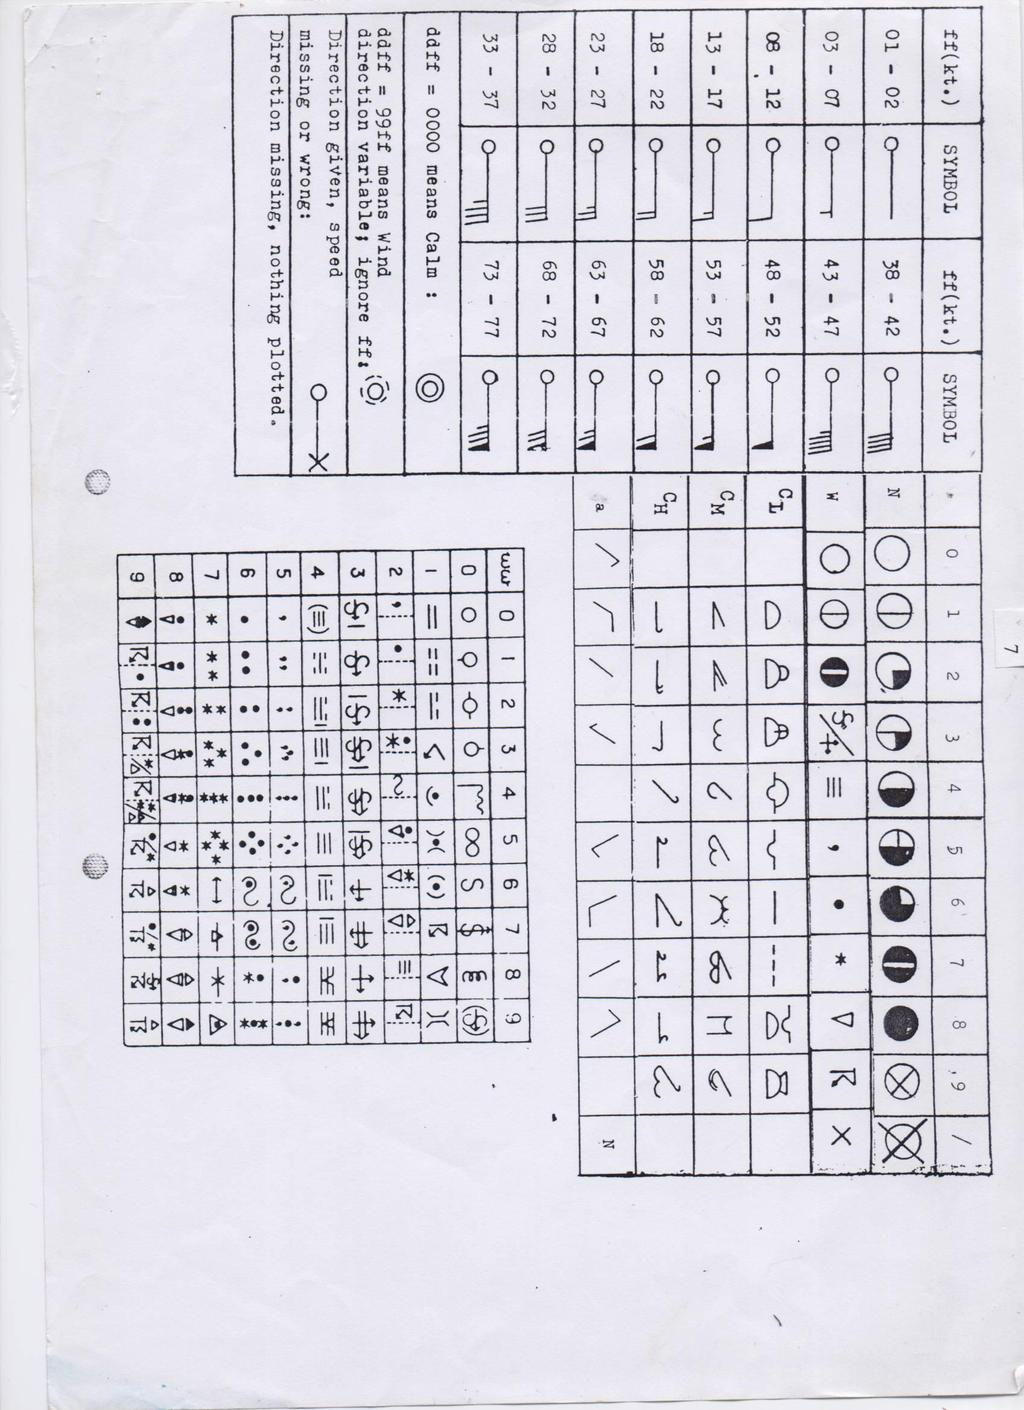
17 REG. NO. & NAME MONTH, DATE AND TIME 23 GMT 14 TH &15 TH APRIL GMT 14 TH & 15 TH APRIL GMT 16 TH & 17 TH APRIL GMT 16 TH & 17 TH APRIL GMT 18 TH & 19 TH APRIL GMT 18 TH & 19 TH APRIL GMT 20 TH & 21 ST PRIL GMT 20 TH & 21 ST APRIL GMT 22 ND & 23 RD APRIL GMT 22 ND & 23 RD APRIL GMT 24 TH & 25 TH APRIL GMT 24 TH & 25 TH APRIL GMT 26 TH & 27 TH APRIL GMT 26 TH & 27 TH APRIL GMT 28 TH & 29 TH APRIL GMT 28 TH & 29 TH APRIL GMT 30 TH APRIL & 1 ST MAYL GMT 30 TH APRIL & 1 ST MAY GMT 14 TH &15 TH APRIL GMT 14 TH & 15 TH APRIL GMT 16 TH & 17 TH APRIL GMT 16 TH & 17 TH APRIL GMT 18 TH & 19 TH APRIL GMT 18 TH & 19 TH APRIL GMT 20 TH & 21 ST PRIL GMT 20 TH & 21 ST APRIL GMT 22 ND & 23 RD APRIL GMT 22 ND & 23 RD APRIL GMT 24 TH & 25 TH APRIL GMT 24 TH & 25 TH APRIL 2009 (N B. You will need to print out the figure1) Synop of a landstation The basic form of the SYNOP bulletin for a landstation is: AAXX YYGGiw IIiii irixhvv Nddff 1snTTT 2snTdTdTd 4PPPP 5appp 6RRRtR 7wwW1W2 8NhCLCMCH The rain group (6RRRtR) is not plotted. All other groups will be plotted using the plot model in
18
19
20
21
22
Allocation of percentage Marks Practical rd February, st March, th March nd March
 UNIVERSITY OF NAIROBI COLLEGE OF BIOLOGICAL AND PHYSICAL SCIENCES School of Physical Sciences Post Graduate Diploma in Aviation Meteorology Aviation Weather (SMR 525) Practical Manual for Academic Year
Aviation weather Forecasts and Assessment of forecast Quality
 UNIVERSITY OF NAIROBI COLLEGE OF BIOLOGICAL AND PHYSICAL SCIENCES Schl f Physical Sciences Master f Science in Aviatin Meterlgy Aviatin weather Frecasts and Assessment f frecast Quality (SMR 644) Practical
CURRENT METHODS AND PRODUCTS OF SEASONAL PREDICTION IN KENYA
 CURRENT METHODS AND PRODUCTS OF SEASONAL PREDICTION IN KENYA BY Mr. PETER G. AMBENJE Deputy Director Kenya Meteorological Department Box 3259-1 NAIROBI OUTLINE Introduction Brief Geography of Kenya Brief
GAMINGRE 8/1/ of 7
 FYE 09/30/92 JULY 92 0.00 254,550.00 0.00 0 0 0 0 0 0 0 0 0 254,550.00 0.00 0.00 0.00 0.00 254,550.00 AUG 10,616,710.31 5,299.95 845,656.83 84,565.68 61,084.86 23,480.82 339,734.73 135,893.89 67,946.95
Plot manual. Synop of a landstation The basic form of the SYNOP bulletin for a landstation is: Plotmanual 1
 Plotmanual 1 Plot manual Introduction Meteorological bulletins are distributed worldwide and must be readable by persons have all nationalities and backgrounds. That is one of the reasons these bulletins
a) Name the features marked P,Q, and R b) Differentiate between a normal faulty and a reverse fault. 2. Use the diagram below to answer question (a)
 Name the features marked P,Q, and R b) Differentiate between a normal faulty and a reverse fault. 2. Use the diagram below to answer question (a)") GEOGRAPHY PAPER 312 / 1 K.C.S.E 2002 SECTION A Answer all the questions in this section 1. The diagram below represents features produced by faulting. Use it to answer questions that follow. a) Name the
GEOGRAPHY PAPER 312 / 1 K.C.S.E 2002 SECTION A Answer all the questions in this section 1. The diagram below represents features produced by faulting. Use it to answer questions that follow. a) Name the
WHEN IS IT EVER GOING TO RAIN? Table of Average Annual Rainfall and Rainfall For Selected Arizona Cities
 WHEN IS IT EVER GOING TO RAIN? Table of Average Annual Rainfall and 2001-2002 Rainfall For Selected Arizona Cities Phoenix Tucson Flagstaff Avg. 2001-2002 Avg. 2001-2002 Avg. 2001-2002 October 0.7 0.0
Champaign-Urbana 2000 Annual Weather Summary
 Champaign-Urbana 2000 Annual Weather Summary ILLINOIS STATE WATER SURVEY 2204 Griffith Dr. Champaign, IL 61820 wxobsrvr@sws.uiuc.edu Maria Peters, Weather Observer January: January started on a mild note,
Dust storm variability over EGYPT By Fathy M ELashmawy Egyptian Meteorological Authority
 WMO WORKSHOP ON CLIMATE MONITORING INCLUDING THE IMPLEMENTATION OF CLIMATE WATCH SYSTEMS FOR ARAB COUNTRIES IN WEST ASIA, AMMAN, JORDAN, 27-29 MAY 2013 Dust storm variability over EGYPT By Fathy M ELashmawy
APPENDIX G-7 METEROLOGICAL DATA
 APPENDIX G-7 METEROLOGICAL DATA METEOROLOGICAL DATA FOR AIR AND NOISE SAMPLING DAYS AT MMR Monthly Normals and Extremes for Honolulu International Airport Table G7-1 MMR RAWS Station Hourly Data Tables
Ref. No. KMD/FCST/4-2017/MO/12 Date: 29 November, 2017 REVIEW OF THE WEATHER IN NOVEMBER AND THE OUTLOOK FOR DECEMBER 2017
 REPUBLIC OF KENYA MINISTRY OF ENVIRONMENT & NATURAL RESOURCES KENYA METEOROLOGICAL DEPARTMENT Dagoretti Corner, Ngong Road, P. O. Box 30259, 00100 GPO, Nairobi, Kenya Telephone: 254 (0) 20 3867880-7, Fax:
UWM Field Station meteorological data
 University of Wisconsin Milwaukee UWM Digital Commons Field Station Bulletins UWM Field Station Spring 992 UWM Field Station meteorological data James W. Popp University of Wisconsin - Milwaukee Follow
Mountain View Community Shuttle Monthly Operations Report
 Mountain View Community Shuttle Monthly Operations Report December 6, 2018 Contents Passengers per Day, Table...- 3 - Passengers per Day, Chart...- 3 - Ridership Year-To-Date...- 4 - Average Daily Ridership
Jackson County 2018 Weather Data 67 Years of Weather Data Recorded at the UF/IFAS Marianna North Florida Research and Education Center
 Jackson County 2018 Weather Data 67 Years of Weather Data Recorded at the UF/IFAS Marianna North Florida Research and Education Center Doug Mayo Jackson County Extension Director 1952-2008 Rainfall Data
In this activity, students will compare weather data from to determine if there is a warming trend in their community.
 Overview: In this activity, students will compare weather data from 1910-2000 to determine if there is a warming trend in their community. Objectives: The student will: use the Internet to locate scientific
FEB DASHBOARD FEB JAN FEB MAR APR MAY JUN JUL AUG SEP OCT NOV DEC
 Positive Response Compliance 215 Compliant 215 Non-Compliant 216 Compliant 216 Non-Compliant 1% 87% 96% 86% 96% 88% 89% 89% 88% 86% 92% 93% 94% 96% 94% 8% 6% 4% 2% 13% 4% 14% 4% 12% 11% 11% 12% JAN MAR
Climatography of the United States No
 Climate Division: AK 5 NWS Call Sign: ANC Month (1) Min (2) Month(1) Extremes Lowest (2) Temperature ( F) Lowest Month(1) Degree s (1) Base Temp 65 Heating Cooling 90 Number of s (3) Jan 22.2 9.3 15.8
KENYA METEOROLOGICAL DEPARTMENT DEKADAL AGROMETEOROLOGICAL BULLETIN
 ` KENYA METEOROLOGICAL DEPARTMENT DEKADAL AGROMETEOROLOGICAL BULLETIN WEATHER AND CROP REVIEW FOR DEKAD 34, 1 ST 10 TH DECEMBER, 2017 HIGHLIGHTS ON RAINFALL AND TEMPERATURE Rainfall activities decreased
Jackson County 2013 Weather Data
 Jackson County 2013 Weather Data 61 Years of Weather Data Recorded at the UF/IFAS Marianna North Florida Research and Education Center Doug Mayo Jackson County Extension Director 1952-2008 Rainfall Data
Mr. XYZ. Stock Market Trading and Investment Astrology Report. Report Duration: 12 months. Type: Both Stocks and Option. Date: Apr 12, 2011
 Mr. XYZ Stock Market Trading and Investment Astrology Report Report Duration: 12 months Type: Both Stocks and Option Date: Apr 12, 2011 KT Astrologer Website: http://www.softwareandfinance.com/magazine/astrology/kt_astrologer.php
CAVE CLIMATE COMPARISON ACTIVITY BETWEEN THE SURFACE AND THE CAVERN
 CAVE CLIMATE COMPARISON ACTIVITY BETWEEN THE SURFACE AND THE CAVERN Created by Ray Bowers For the Virtual Center for the Environment (VCE) A part of the Institute of Natural Resources Analysis and Management
Chiang Rai Province CC Threat overview AAS1109 Mekong ARCC
 Chiang Rai Province CC Threat overview AAS1109 Mekong ARCC This threat overview relies on projections of future climate change in the Mekong Basin for the period 2045-2069 compared to a baseline of 1980-2005.
SYSTEM BRIEF DAILY SUMMARY
 SYSTEM BRIEF DAILY SUMMARY * ANNUAL MaxTemp NEL (MWH) Hr Ending Hr Ending LOAD (PEAK HOURS 7:00 AM TO 10:00 PM MON-SAT) ENERGY (MWH) INCREMENTAL COST DAY DATE Civic TOTAL MAXIMUM @Max MINIMUM @Min FACTOR
OVERVIEW OF IMPROVED USE OF RS INDICATORS AT INAM. Domingos Mosquito Patricio
 OVERVIEW OF IMPROVED USE OF RS INDICATORS AT INAM Domingos Mosquito Patricio domingos.mosquito@gmail.com Introduction to Mozambique /INAM Introduction to AGRICAB/SPIRITS Objectives Material & Methods Results
ISOLINE MAPS and RAINFALL
 ISOLINE MAPS and RAINFALL Geography 101 Lab Name Purpose: Introduce students to one of the most common and useful types of maps used in studying the natural environment. When completed, the student should
Drought in Southeast Colorado
 Drought in Southeast Colorado Nolan Doesken and Roger Pielke, Sr. Colorado Climate Center Prepared by Tara Green and Odie Bliss http://climate.atmos.colostate.edu 1 Historical Perspective on Drought Tourism
KENYA METEOROLOGICAL DEPARTMENT DEKADAL AGROMETEOROLOGICAL BULLETIN
 ` KENYA METEOROLOGICAL DEPARTMENT DEKADAL AGROMETEOROLOGICAL BULLETIN WEATHER AND CROP REVIEW FOR DEKAD 8, 11 TH 20 TH MARCH, 2018 HIGHLIGHTS ON RAINFALL AND TEMPERATURE Rainfall activities decreased in
PROJECT REPORT (ASL 720) CLOUD CLASSIFICATION
 CLOUD CLASSIFICATION") PROJECT REPORT (ASL 720) CLOUD CLASSIFICATION SUBMITTED BY- PRIYANKA GUPTA 2011CH70177 RINI KAPOOR 2011CH70179 INDIVIDUAL CONTRIBUTION- Priyanka Gupta- analysed data of region considered in India (West:80,
PROJECT REPORT (ASL 720) CLOUD CLASSIFICATION SUBMITTED BY- PRIYANKA GUPTA 2011CH70177 RINI KAPOOR 2011CH70179 INDIVIDUAL CONTRIBUTION- Priyanka Gupta- analysed data of region considered in India (West:80,
KENYA METEOROLOGICAL DEPARTMENT DEKADAL AGROMETEOROLOGICAL BULLETIN
 KENYA METEOROLOGICAL DEPARTMENT DEKADAL AGROMETEOROLOGICAL BULLETIN WEATHER AND CROP REVIEW FOR DEKAD 7, 1 ST 10 TH MARCH, 2017 1. HIGHLIGHTS ON RAINFALL AND TEMPERATURE Rainfall activities decreased both
KENYA METEOROLOGICAL DEPARTMENT DEKADAL AGROMETEOROLOGICAL BULLETIN
 ` KENYA METEOROLOGICAL DEPARTMENT DEKADAL AGROMETEOROLOGICAL BULLETIN WEATHER AND CROP REVIEW FOR DEKAD 32, 11 TH 20 TH NOVEMBER, 2017 HIGHLIGHTS ON RAINFALL AND TEMPERATURE Rainfall activities decreased
Climatography of the United States No
 Month (1) Min (2) Month(1) Extremes Lowest (2) Temperature ( F) Lowest Month(1) Degree s (1) Base Temp 65 Heating Cooling 100 Number of s (3) Jan 63.9 39.3 51.6 86 1976 16 56.6 1986 20 1976 2 47.5 1973
Climatography of the United States No
 Temperature ( F) Month (1) Min (2) Month(1) Extremes Lowest (2) Lowest Month(1) Degree s (1) Base Temp 65 Heating Cooling 100 Number of s (3) Jan 32.8 21.7 27.3 62 1918 1 35.8 1983-24 1950 29 10.5 1979
8 VISIBILITY. 8.1 Setting. 8.2 Assessment Focus. Table 8-1: Key Issue for Visibility
 Volume 2: Environmental and Sturgeon Upgrader Project 8 VISIBILITY 8.1 Setting The Project is in Sturgeon County within Alberta s Industrial Heartland area (the Heartland). The Heartland includes a number
Climatography of the United States No
 Climate Division: CA 4 NWS Call Sign: Month (1) Min (2) Month(1) Extremes Lowest (2) Temperature ( F) Lowest Month(1) Degree s (1) Base Temp 65 Heating Cooling 100 Number of s (3) Jan 55.6 39.3 47.5 77
Climatography of the United States No
 Climate Division: CA 5 NWS Call Sign: Month (1) Min (2) Month(1) Extremes Lowest (2) Temperature ( F) Lowest Month(1) Degree s (1) Base Temp 65 Heating Cooling 100 Number of s (3) Jan 56.6 36.5 46.6 81
Climatography of the United States No
 Climate Division: CA 1 NWS Call Sign: Month (1) Min (2) Month(1) Extremes Lowest (2) Temperature ( F) Lowest Month(1) Degree s (1) Base Temp 65 Heating Cooling 100 Number of s (3) Jan 57.9 38.9 48.4 85
Climatography of the United States No
 Climate Division: CA 5 NWS Call Sign: Month (1) Min (2) Month(1) Extremes Lowest (2) Temperature ( F) Lowest Month(1) Degree s (1) Base Temp 65 Heating Cooling 100 Number of s (3) Jan 44.8 25.4 35.1 72
Climatography of the United States No
 Climate Division: CA 4 NWS Call Sign: Month (1) Min (2) Month(1) Extremes Lowest (2) Temperature ( F) Lowest Month(1) Degree s (1) Base Temp 65 Heating Cooling 100 Number of s (3) Jan 49.4 37.5 43.5 73
Climatography of the United States No
 Climate Division: CA 6 NWS Call Sign: Month (1) Min (2) Month(1) Extremes Lowest (2) Temperature ( F) Lowest Month(1) Degree s (1) Base Temp 65 Heating Cooling 100 Number of s (3) Jan 69.4 46.6 58.0 92
Climatography of the United States No
 Climate Division: CA 6 NWS Call Sign: Month (1) Min (2) Month(1) Extremes Lowest (2) Temperature ( F) Lowest Month(1) Degree s (1) Base Temp 65 Heating Cooling 1 Number of s (3) Jan 67.5 42. 54.8 92 1971
Climatography of the United States No
 Climate Division: CA 4 NWS Call Sign: Month (1) Min (2) Month(1) Extremes Lowest (2) Temperature ( F) Lowest Month(1) Degree s (1) Base Temp 65 Heating Cooling 1 Number of s (3) Jan 58.5 38.8 48.7 79 1962
Climatography of the United States No
 Climate Division: CA 1 NWS Call Sign: Month (1) Min (2) Month(1) Extremes Lowest (2) Temperature ( F) Lowest Month(1) Degree s (1) Base Temp 65 Heating Cooling 1 Number of s (3) Jan 57.8 39.5 48.7 85 1962
Climatography of the United States No
 Climate Division: ND 8 NWS Call Sign: BIS Month (1) Min (2) Month(1) Extremes Lowest (2) Temperature ( F) Lowest Month(1) Degree s (1) Base Temp 65 Heating Cooling 100 Number of s (3) Jan 21.1 -.6 10.2
Jackson County 2014 Weather Data
 Jackson County 2014 Weather Data 62 Years of Weather Data Recorded at the UF/IFAS Marianna North Florida Research and Education Center Doug Mayo Jackson County Extension Director 1952-2008 Rainfall Data
Climatography of the United States No
 Climate Division: TN 1 NWS Call Sign: Month (1) Min (2) Month(1) Extremes Lowest (2) Temperature ( F) Lowest Month(1) Degree s (1) Base Temp 65 Heating Cooling 100 Number of s (3) Jan 47.6 24.9 36.3 81
Calculations Equation of Time. EQUATION OF TIME = apparent solar time - mean solar time
 Calculations Equation of Time APPARENT SOLAR TIME is the time that is shown on sundials. A MEAN SOLAR DAY is a constant 24 hours every day of the year. Apparent solar days are measured from noon one day
Climatography of the United States No
 Climate Division: CA 5 NWS Call Sign: FAT Month (1) Min (2) Month(1) Extremes Lowest (2) Temperature ( F) Lowest Month(1) Degree s (1) Base Temp 65 Heating Cooling 1 Number of s (3) Jan 53.6 38.4 46. 78
Increasing Transmission Capacities with Dynamic Monitoring Systems
 INL/MIS-11-22167 Increasing Transmission Capacities with Dynamic Monitoring Systems Kurt S. Myers Jake P. Gentle www.inl.gov March 22, 2012 Concurrent Cooling Background Project supported with funding
Climatography of the United States No
 Climate Division: CA 6 NWS Call Sign: 1L2 N Lon: 118 3W Month (1) Min (2) Month(1) Extremes Lowest (2) Temperature ( F) Lowest Month(1) Degree s (1) Base Temp 65 Heating Cooling 1 Number of s (3) Jan 63.7
Operation and Maintenance of Networking of CAAQM stations at Bangalore and Chennai.
 2014-15 CENTRAL POLLUTION NTROL BOARD ZONAL OFFICE (SOUTH), BENGALURU 560079 Project II-.Scientific & Technical Activities and R & D Operation and Maintenance of Networking of CAAQM stations at Bangalore
Climatography of the United States No
 Climate Division: CA 5 NWS Call Sign: BFL Month (1) Min (2) Month(1) Extremes Lowest (2) Temperature ( F) Lowest Month(1) Degree s (1) Base Temp 65 Heating Cooling 1 Number of s (3) Jan 56.3 39.3 47.8
2003 Water Year Wrap-Up and Look Ahead
 2003 Water Year Wrap-Up and Look Ahead Nolan Doesken Colorado Climate Center Prepared by Odie Bliss http://ccc.atmos.colostate.edu Colorado Average Annual Precipitation Map South Platte Average Precipitation
TILT, DAYLIGHT AND SEASONS WORKSHEET
 TILT, DAYLIGHT AND SEASONS WORKSHEET Activity Description: Students will use a data table to make a graph for the length of day and average high temperature in Utah. They will then answer questions based
2016 Meteorology Summary
 2016 Meteorology Summary New Jersey Department of Environmental Protection AIR POLLUTION AND METEOROLOGY Meteorology plays an important role in the distribution of pollution throughout the troposphere,
Climatography of the United States No
 Climate Division: TN 3 NWS Call Sign: BNA Month (1) Min (2) Month(1) Extremes Lowest (2) Temperature ( F) Lowest Month(1) Degree s (1) Base Temp 65 Heating Cooling 100 Number of s (3) Jan 45.6 27.9 36.8
Climatography of the United States No
 Climate Division: CA 5 NWS Call Sign: Elevation: 6 Feet Lat: 37 Month (1) Min (2) Month(1) Extremes Lowest (2) Temperature ( F) Lowest Month(1) Degree s (1) Base Temp 65 Heating Cooling 1 Number of s (3)
Climatography of the United States No
 Climate Division: CA 4 NWS Call Sign: Elevation: 2 Feet Lat: 37 Month (1) Min (2) Month(1) Extremes Lowest (2) Temperature ( F) Lowest Month(1) Degree s (1) Base Temp 65 Heating Cooling 1 Number of s (3)
Climatography of the United States No
 Climate Division: CA 4 NWS Call Sign: Elevation: 13 Feet Lat: 36 Month (1) Min (2) Month(1) Extremes Lowest (2) Temperature ( F) Lowest Month(1) Degree s (1) Base Temp 65 Heating Cooling 1 Number of s
Climatography of the United States No
 Climate Division: CA 5 NWS Call Sign: Elevation: 1,14 Feet Lat: 36 Month (1) Min (2) Month(1) Extremes Lowest (2) Temperature ( F) Lowest Month(1) Degree s (1) Base Temp 65 Heating Cooling 1 Number of
KENYA METEOROLOGICAL SERVICE DEKADAL AGROMETEOROLOGICAL BULLETIN WEATHER AND CROP REVIEW FOR DEKAD 26, SEPTEMBER, 2015
 KENYA METEOROLOGICAL SERVICE DEKADAL AGROMETEOROLOGICAL BULLETIN WEATHER AND CROP REVIEW FOR DEKAD 26, 11-20 SEPTEMBER, 2015 1. HIGHLIGHTS ON RAINFALL AND TEMPERATURE There was a decrease in both spatial
Institut national des sciences appliquées de Strasbourg GENIE CLIMATIQUE ET ENERGETIQUE APPENDICES
 Institut national des sciences appliquées de Strasbourg GENIE CLIMATIQUE ET ENERGETIQUE APPENDICES DEVELOPMENT OF A TOOL, BASED ON THE THERMAL DYNAMIC SIMULATION SOFTWARE TRNSYS, WHICH RUNS PARAMETRIC
Climatography of the United States No
 Climate Division: CA 6 NWS Call Sign: LAX Elevation: 1 Feet Lat: 33 Month (1) Min (2) Month(1) Extremes Lowest (2) Temperature ( F) Lowest Month(1) Degree s (1) Base Temp 65 Heating Cooling 1 Number of
Climatography of the United States No
 Climate Division: CA 6 NWS Call Sign: TOA Elevation: 11 Feet Lat: 33 2W Temperature ( F) Month (1) Min (2) Month(1) Extremes Lowest (2) Lowest Month(1) Degree s (1) Base Temp 65 Heating Cooling 1 Number
2003 Moisture Outlook
 2003 Moisture Outlook Nolan Doesken and Roger Pielke, Sr. Colorado Climate Center Prepared by Tara Green and Odie Bliss http://climate.atmos.colostate.edu Through 1999 Through 1999 Fort Collins Total Water
Climatography of the United States No
 No. 2 1971-2 Asheville, North Carolina 2881 COOP ID: 46646 Climate Division: CA 4 NWS Call Sign: 8W Month (1) Min (2) Month(1) Extremes Lowest (2) Temperature ( F) Lowest Month(1) Degree s (1) Base Temp
Champaign-Urbana 2001 Annual Weather Summary
 Champaign-Urbana 2001 Annual Weather Summary ILLINOIS STATE WATER SURVEY 2204 Griffith Dr. Champaign, IL 61820 wxobsrvr@sws.uiuc.edu Maria Peters, Weather Observer January: After a cold and snowy December,
Climatography of the United States No
 No. 2 1971-2 Asheville, North Carolina 2881 COOP ID: 4792 Climate Division: CA 6 NWS Call Sign: Month (1) Min (2) Month(1) Extremes Lowest (2) Temperature ( F) Lowest Month(1) Degree s (1) Base Temp 65
Lesson Adaptation Activity: Analyzing and Interpreting Data
 Lesson Adaptation Activity: Analyzing and Interpreting Data Related MA STE Framework Standard: 3-ESS2-1. Use graphs and tables of local weather data to describe and predict typical weather during a particular
SYSTEM BRIEF DAILY SUMMARY
 SYSTEM BRIEF DAILY SUMMARY * ANNUAL MaxTemp NEL (MWH) Hr Ending Hr Ending LOAD (PEAK HOURS 7:00 AM TO 10:00 PM MON-SAT) ENERGY (MWH) INCREMENTAL COST DAY DATE Civic TOTAL MAXIMUM @Max MINIMUM @Min FACTOR
Computing & Telecommunications Services
 Computing & Telecommunications Services Monthly Report September 214 CaTS Help Desk (937) 775-4827 1-888-775-4827 25 Library Annex helpdesk@wright.edu www.wright.edu/cats/ Table of Contents HEAT Ticket
Climatography of the United States No
 No. 2 1971-2 Asheville, North Carolina 2881 COOP ID: 43417 Climate Division: CA 4 NWS Call Sign: N Lon: 121 Month (1) Min (2) Month(1) Extremes Lowest (2) Temperature ( F) Lowest Month(1) Degree s (1)
KENYA METEOROLOGICAL DEPARTMENT DEKADAL AGROMETEOROLOGICAL BULLETIN
 KENYA METEOROLOGICAL DEPARTMENT DEKADAL AGROMETEOROLOGICAL BULLETIN WEATHER AND CROP REVIEW FOR DEKAD 4,1 ST 10 TH FEBRUARY, 2017 1. HIGHLIGHTS ON RAINFALL AND TEMPERATURE Rainfall activities have decreased
Computing & Telecommunications Services Monthly Report January CaTS Help Desk. Wright State University (937)
") January 215 Monthly Report Computing & Telecommunications Services Monthly Report January 215 CaTS Help Desk (937) 775-4827 1-888-775-4827 25 Library Annex helpdesk@wright.edu www.wright.edu/cats/ Last
January 215 Monthly Report Computing & Telecommunications Services Monthly Report January 215 CaTS Help Desk (937) 775-4827 1-888-775-4827 25 Library Annex helpdesk@wright.edu www.wright.edu/cats/ Last
Climatography of the United States No
 No. 2 1971-2 Asheville, North Carolina 2881 COOP ID: 4795 Climate Division: CA 6 NWS Call Sign: SBA Month (1) Min (2) Month(1) Extremes Lowest (2) Temperature ( F) Lowest Month(1) Degree s (1) Base Temp
Champaign-Urbana 1999 Annual Weather Summary
 Champaign-Urbana 1999 Annual Weather Summary ILLINOIS STATE WATER SURVEY 2204 Griffith Dr. Champaign, IL 61820 wxobsrvr@sws.uiuc.edu Maria Peters, Weather Observer A major snowstorm kicked off the new
KENYA METEOROLOGICAL DEPARTMENT DEKADAL AGROMETEOROLOGICAL BULLETIN
 KENYA METEOROLOGICAL DEPARTMENT DEKADAL AGROMETEOROLOGICAL BULLETIN WEATHER AND CROP REVIEW FOR DEKAD 11; 11 TH 20 TH APRIL, 2017 HIGHLIGHTS ON RAINFALL AND TEMPERATURE Rainfall activities drastically
Technical Report DMI SYNOP AWS Summit. Data status March Ellen Vaarby Laursen. SYNOP weather station Summit.
 10-09 DMI SYNOP AWS 04416 Summit. Data status March 2010. Ellen Vaarby Laursen SYNOP weather station 04416 Summit Picture Taken: 2007:06:20 16:16:11 Picture Taken: 2009:07:09 08:22:51 Copenhagen 2010 www.dmi.dk/dmi/tr
Climatography of the United States No
 Month (1) Min (2) Month(1) Extremes Lowest (2) Temperature ( F) Lowest Month(1) Degree s (1) Base Temp 65 Heating Cooling 100 Number of s (3) 42.6 24.2 33.4 79 1950 25 44.2 1974-16 1994 19 18.8 1977 977
Colorado s 2003 Moisture Outlook
 Colorado s 2003 Moisture Outlook Nolan Doesken and Roger Pielke, Sr. Colorado Climate Center Prepared by Tara Green and Odie Bliss http://climate.atmos.colostate.edu How we got into this drought! Fort
I C P A C. IGAD Climate Prediction and Applications Centre Monthly Climate Bulletin, Climate Review for April 2018
 No. ICPAC/02/312 Bulletin Issue May 2018 I C P A C IGAD Climate Prediction and Applications Centre Monthly Climate Bulletin, Climate Review for April 2018 1. INTRODUCTION This bulletin reviews the April
Kennedy Omondi Obong o. Grad. Eng. ERB/IEK Kenya Meteorological Department ICT Division P.O. Box G.P.O NAIROBI, KENYA Tel No:
 Modernisation of Surface Observations Network in KENYA 7/15/2010 1 Presenter Kennedy Omondi Obong o. Grad. Eng. ERB/IEK Kenya Meteorological Department ICT Division P.O. Box 30259-00100 G.P.O NAIROBI,
Climatography of the United States No
 No. 2 1971-2 Asheville, North Carolina 2881 COOP ID: 46175 Climate Division: CA 6 NWS Call Sign: 3L3 Elevation: 1 Feet Lat: 33 Month (1) Min (2) Month(1) Extremes Lowest (2) Temperature ( F) Lowest Month(1)
Climatography of the United States No
 No. 2 1971-2 Asheville, North Carolina 2881 COOP ID: 42713 Climate Division: CA 7 NWS Call Sign: Elevation: -3 Feet Lat: 32 Month (1) Min (2) Month(1) Extremes Lowest (2) Temperature ( F) Lowest Month(1)
Climatography of the United States No
 Month (1) Min (2) Month(1) Extremes Lowest (2) Temperature ( F) Lowest Month(1) Degree s (1) Base Temp 65 Heating Cooling 100 Number of s (3) Jan 54.3 40.1 47.2 75 1998 17 53.0 1995 18 1949 11 41.7 1972
THE RISKS ASSOCIATED TO THE HOARFROST PHENOMENON IN THE WEST PLAIN
 THE RISKS ASSOCIATED TO THE HOARFROST PHENOMENON IN THE WEST PLAIN V.D.MIRCOV 1., Mioara ȘIȘU 2, Carmen MOISA 2, Antoanela COZMA 1 1 BUASMV King Michael I of Romania from Timisoara Calea Aradului Street,
Climatography of the United States No
 Climate Division: CA 1 NWS Call Sign: Month (1) Min (2) Month(1) Extremes Lowest (2) Temperature ( F) Lowest Month(1) Degree s (1) Base Temp 65 Heating Cooling 100 Number of s (3) Jan 52.4 35.4 43.9 69
Climatography of the United States No
 Climate Division: CA 4 NWS Call Sign: Month (1) Min (2) Month(1) Extremes Lowest (2) Temperature ( F) Lowest Month(1) Degree s (1) Base Temp 65 Heating Cooling 100 Number of s (3) Jan 61.9 42.0 52.0 89
Climatography of the United States No
 Climate Division: CA 2 NWS Call Sign: Month (1) Min (2) Month(1) Extremes Lowest (2) Temperature ( F) Lowest Month(1) Degree s (1) Base Temp 65 Heating Cooling 100 Number of s (3) Jan 55.6 38.8 47.2 81
Climatography of the United States No
 Climate Division: CA 2 NWS Call Sign: Month (1) Min (2) Month(1) Extremes Lowest (2) Temperature ( F) Lowest Month(1) Degree s (1) Base Temp 65 Heating Cooling 100 Number of s (3) Jan 53.5 37.6 45.6 78
Climatography of the United States No
 Climate Division: CA 6 NWS Call Sign: Month (1) Min (2) Month(1) Extremes Lowest (2) Temperature ( F) Lowest Month(1) Degree s (1) Base Temp 65 Heating Cooling 100 Number of s (3) Jan 66.1 38.3 52.2 91
Climatography of the United States No
 Climate Division: CA 1 NWS Call Sign: Month (1) Min (2) Month(1) Extremes Lowest (2) Temperature ( F) Lowest Month(1) Degree s (1) Base Temp 65 Heating Cooling 1 Number of s (3) Jan 56.2 4.7 48.5 79 1962
Climatography of the United States No
 Climate Division: CA 1 NWS Call Sign: Month (1) Min (2) Month(1) Extremes Lowest (2) Temperature ( F) Lowest Month(1) Degree s (1) Base Temp 65 Heating Cooling 100 Number of s (3) Jan 50.2 31.2 40.7 65+
Climatography of the United States No
 Climate Division: CA 4 NWS Call Sign: Month (1) Min (2) Month(1) Extremes Lowest (2) Temperature ( F) Lowest Month(1) Degree s (1) Base Temp 65 Heating Cooling 100 Number of s (3) Jan 61.4 33.1 47.3 82+
A Synoptic Climatology of Heavy Precipitation Events in California
 A Synoptic Climatology of Heavy Precipitation Events in California Alan Haynes Hydrometeorological Analysis and Support (HAS) Forecaster National Weather Service California-Nevada River Forecast Center
Climatography of the United States No
 Climate Division: CA 6 NWS Call Sign: Month (1) Min (2) Month(1) Extremes Lowest (2) Temperature ( F) Lowest Month(1) Degree s (1) Base Temp 65 Heating Cooling 100 Number of s (3) Jan 51.5 35.0 43.3 80
Climatography of the United States No
 Climate Division: CA 5 NWS Call Sign: Month (1) Min (2) Month(1) Extremes Lowest (2) Temperature ( F) Lowest Month(1) Degree s (1) Base Temp 65 Heating Cooling 100 Number of s (3) 59.3 31.5 45.4 80 1976
Climatography of the United States No
 Climate Division: CA 7 NWS Call Sign: Month (1) Min (2) Month(1) Extremes Lowest (2) Temperature ( F) Lowest Month(1) Degree s (1) Base Temp 65 Heating Cooling 100 Number of s (3) 44.5 29.3 36.9 69 1951
Climatography of the United States No
 Climate Division: CA 2 NWS Call Sign: Month (1) Min (2) Month(1) Extremes Lowest (2) Temperature ( F) Lowest Month(1) Degree s (1) Base Temp 65 Heating Cooling 100 Number of s (3) 53.3 37.1 45.2 77 1962
Climatography of the United States No
 Climate Division: CA 2 NWS Call Sign: Month (1) Min (2) Month(1) Extremes Lowest (2) Temperature ( F) Lowest Month(1) Degree s (1) Base Temp 65 Heating Cooling 100 Number of s (3) 53.3 31.8 42.6 74+ 1975
Climatography of the United States No
 Climate Division: CA 6 NWS Call Sign: Month (1) Min (2) Month(1) Extremes Lowest (2) Temperature ( F) Lowest Month(1) Degree s (1) Base Temp 65 Heating Cooling 100 Number of s (3) 68.5 45.7 57.1 90 1971