Section 4.4 Z-Scores and the Empirical Rule
|
|
|
- Jean Quinn
- 5 years ago
- Views:
Transcription

1 Section 4.4 Z-Scores and the Empirical Rule 1 GPA Example A sample of GPAs of 40 freshman college students appear below (sorted in increasing order) Enter data in TICalc in L1 Set Window Xmin= 1 Ymin=-1 Xmax= 5 Ymax=20 Xscl=.5 Yscl= 5 Check Stats Xbar=2.9 s= Create a Box Plot and Histogram to review the distribution of the data 2 1
2 Shape of the RAW GPA Data Sketch the GPA Box Plot and Histogram and review the distribution of the data. Is the distribution of the data reasonably symmetric and unimodal? 3 Z-Scores and Location By itself, a raw data value provides very little information about how that particular score compares with other values in the distribution. If the raw score is transformed into a z-score, however, the value of the z-score tells exactly where the score is located relative to all the other scores in the distribution. The formula used with sample data is zscore x x s Enter Z-Scores into L2 Use TICalc (Vars) - 5:Statistics when entering formula into L2 4 2
3 Z-Scores Computing the z score is often referred to as standardization and the z score is called a standardized score. The formula used with sample data is zscore x x s Enter Z-Scores into L2 Use TICalc (Vars) - 5:Statistics when entering formula into L2. 5 Shape of the GPA ZScores Sketch the GPA Box Plot and Histogram and review the distribution of the data. Compare the RAW and ZScores, how do their distributions differ? 6 3
4 Z-Scores (continued) The z score corresponding to a particular observation in a data set is zscore observation mean standard deviation Now Count the Z-Scores and find the % in each group: Zscores +/- 1 std dev: /40= % Zscores +/- 2 std dev : /40= % Zscores +/- 3 std dev : /40= % The z score is how many standard deviations the observation is from the mean. A positive z score indicates the observation is above the mean and a negative z score indicates the observation is below the mean. 7 Z-Scores by Number of Standard Deviations Interval within 1 standard deviation of the mean within 2 standard deviations of the mean within 3 standard deviations of the mean # GPA Z- scores 27/40 = 67.5% 39/40 = 97.5% 40/40 = 100% Empirical Rule 68% 95% 99.7% Now let s look at the empirical rule and decide if our estimates are reasonable? 8 4
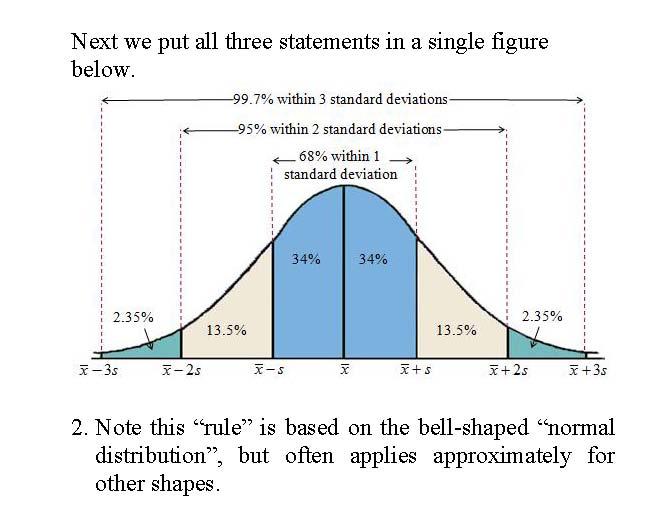
5 9 10 5
6 Z-Scores and Location Summary The process to calculate Z scores is called standardization and the Z-Score is called a standardized score. It is a position marker. The process of changing a raw data value into a z- score involves creating a signed number, such that a) The sign of the z-score (+ or ) identifies whether the data value is located above the mean (positive) or below the mean (negative). b) The numerical value of the z-score corresponds to the number of standard deviations between the data value and the mean of the distribution. 11 Appendix A GPA Zscore GPA Zscore GPA Zscore GPA Zscore Mean std dev

7 Appendix B 13 Appendix C 14 7
At right: Closeups of the graphs of. with WINDOW settings Xmin=-1, Xmax=1, Xscl=0.1, Ymin=-1, Ymax=1, Yscl=0.1
 Know the graphs of f(x) = x n for n = odd, positive: 1, 3, 5, The Domain is All Real Numbers, (, ), or R. The Range is All Real Numbers, (, ), or R. It is an Odd function because f( x) = f(x). It is symmetric
A repeated root is a root that occurs more than once in a polynomial function.
 Unit 2A, Lesson 3.3 Finding Zeros Synthetic division, along with your knowledge of end behavior and turning points, can be used to identify the x-intercepts of a polynomial function. This information allows
Objectives. Materials
 . Objectives Activity 6 To investigate the relationship between mass and volume To find the x value of a function, given the y value To find the y value of a function, given the x value To use technology
Chapter 6. The Standard Deviation as a Ruler and the Normal Model 1 /67
 Chapter 6 The Standard Deviation as a Ruler and the Normal Model 1 /67 Homework Read Chpt 6 Complete Reading Notes Do P129 1, 3, 5, 7, 15, 17, 23, 27, 29, 31, 37, 39, 43 2 /67 Objective Students calculate
AP Calculus AB Summer Assignment. Due Date: First day of school.
 AP Calculus AB Summer Assignment Name: Due Date: First day of school. The purpose of this assignment is to have you practice the mathematical skills necessary to be successful in Calculus AB. All of the
Functions Modeling Change A Preparation for Calculus Third Edition
 Powerpoint slides copied from or based upon: Functions Modeling Change A Preparation for Calculus Third Edition Connally, Hughes-Hallett, Gleason, Et Al. Copyright 2007 John Wiley & Sons, Inc. 1 Chapter
( ) ( ) SECTION 1.1, Page ( x 3) 5 = 4( x 5) = 7. x = = = x x+ 0.12(4000 x) = 432
 ( ) SECTION 1.1, Page ( x 3) 5 = 4( x 5) = 7. x = = = x x+ 0.12(4000 x) = 432") CHAPTER Functions and Graphs SECTION., Page. x + x + x x x. x + x x x x x. ( x ) ( x ) x 6 x x x x x + x x 7. x + x + x + 6 8 x 8 6 x x. x x 6 x 6 x x x 8 x x 8 + x..x +..6.x. x 6 ( n + ) ( n ) n + n.
CHAPTER Functions and Graphs SECTION., Page. x + x + x x x. x + x x x x x. ( x ) ( x ) x 6 x x x x x + x x 7. x + x + x + 6 8 x 8 6 x x. x x 6 x 6 x x x 8 x x 8 + x..x +..6.x. x 6 ( n + ) ( n ) n + n.
FLEX Mathematics Introduction to Trigonometry. MULTIPLE CHOICE. Choose the one alternative that best completes the statement or answers the question.
 FLEX Mathematics Introduction to Trigonometry Name MULTIPLE CHOICE. Choose the one alternative that best completes the statement or answers the question. Evaluate the expression. 1) 8 tan 0 + 3 csc 20
Name: Date: Period: Activity 5.1.1: Hurricanes
 Name: Date: Period: Activity 5.1.1: Hurricanes Each year tropical storms that form in the Atlantic Ocean are given names. The first named storm starts with A, the second starts with B, and so on. A tropical
Objectives. Materials
 . Objectives Activity 13 To graphically represent and analyze climate data To use linear regressions to understand the relationship between temperatures as measured in the Fahrenheit and Celsius scale
Study Ch. 9.4, # 73, (65, 67 75)
") GOALS: 1. Understand the differences between the critical value and p value approaches to hypothesis testing. 2. Understand what the p value is and how to find it. 3. Understand the assumptions of a z
GOALS: 1. Understand the differences between the critical value and p value approaches to hypothesis testing. 2. Understand what the p value is and how to find it. 3. Understand the assumptions of a z
Functions Modeling Change A Preparation for Calculus Third Edition
 Powerpoint slides copied from or based upon: Functions Modeling Change A Preparation for Calculus Third Edition Connally, Hughes-Hallett, Gleason, Et Al. Copyright 2007 John Wiley & Sons, Inc. 1 CHAPTER
Practice Problems. 1. The age and weights of six cats are given in the following table:
 1. The age and weights of six cats are given in the following table: Age (in years) A Weight (in pounds) - W 3 2 5 4 17 15 7 10 12 10 1 1 a. Identify the input and output quantities and their associated
Moving Straight Ahead Practice Answers
 Copright Pearson Education, Inc., or its affiliates. All Rights Reserved. Investigation Additional Practice. a. Francine:. mph; Geraldo: mph; Jennifer: 7. mph; Divide the number of miles traveled in hours
PART 1 - CALCULATOR ACTIVE QUESTIONS
 Name: Date : IM 3 UNIT TEST Linear Functions Teacher: Mr. Santowski and Mr. Smith Score: PART 1 - CALCULATOR ACTIVE QUESTIONS SHOW ALL WORK AND WRITE ALL ANSWERS IN THE SPACES PROVIDED. Maximum marks will
Name: JMJ April 10, 2017 Trigonometry A2 Trimester 2 Exam 8:40 AM 10:10 AM Mr. Casalinuovo
 Name: JMJ April 10, 2017 Trigonometry A2 Trimester 2 Exam 8:40 AM 10:10 AM Mr. Casalinuovo Part 1: You MUST answer this problem. It is worth 20 points. 1) Temperature vs. Cricket Chirps: Crickets make
Regressions of Olympic Proportions
 About the Lesson In this activity, students use the Manual-Fit and Linear Regression commands to find lines of best fit to model data from the Olympic Games. As a result, students will: Develop and evaluate
Content Standard Geometric Series. What number 0, 1, 2, 3, 4, 5, 6, 7, 8, or 9
 9-5 Content Standard Geometric Series A.SSE.4 Derive the formula for the sum of a geometric series (when the common ratio is not 1), and use the formula to solve problems. Objective To define geometric
The Mathematics of a Football Kick (Parametric Equations) (Adapted from an article in COMAP)
 (Adapted from an article in COMAP)") The Mathematics of a Football Kick (Parametric Equations) (Adapted from an article in COMAP) I. Problem The punter on the 1994 Handley State Championship Football team, Michael Partlow, was also a calculus
The Mathematics of a Football Kick (Parametric Equations) (Adapted from an article in COMAP) I. Problem The punter on the 1994 Handley State Championship Football team, Michael Partlow, was also a calculus
Lesson 5 Practice Problems
 Name: Date: Lesson 5 Section 5.1: Linear Functions vs. Exponential Functions 1. Complete the table below. Function Linear or Exponential? Linear: Increasing or Decreasing? Exponential: Growth or Decay?
Complete Week 8 Package
 Complete Week 8 Package Algebra1Teachers @ 2015 Table of Contents Unit 3 Pacing Chart -------------------------------------------------------------------------------------------- 1 Lesson Plans --------------------------------------------------------------------------------------------
ASTROMATH 101: BEGINNING MATHEMATICS IN ASTRONOMY
 Name Partner(s) Section Date ASTROMATH 101: BEGINNING MATHEMATICS IN ASTRONOMY Astronomers deal with very, very large distances, some incredible temperatures, and even really, really small wavelengths.
Math 2311 Sections 4.1, 4.2 and 4.3
 Math 2311 Sections 4.1, 4.2 and 4.3 4.1 - Density Curves What do we know about density curves? Example: Suppose we have a density curve defined for defined by the line y = x. Sketch: What percent of observations
Foundations for Functions
 Activity: TEKS: Overview: Materials: Regression Exploration (A.2) Foundations for functions. The student uses the properties and attributes of functions. The student is expected to: (D) collect and organize
UNIT 3 Relationships
 UNIT 3 Relationships Topics Covered in this Unit Include: Interpreting Graphs, Scatter Plot Graphs, Line of Best Fit, First Differences, Linear and Non-Linear Evaluations Given this Unit (Record Your Marks
CHAPTER 1. Functions and Linear Models
 CHAPTER 1 Functions and Linear Models 1. Functions Definition. A function is a rule that associates each input with exactly one output. Example. (1) Millions of cameras made Cost in million $ 1 175 5 260
Lawrence High School s AP Calculus AB 2018 Summer Assignment
 s AP Calculus AB 2018 Summer Assignment To incoming AP Calculus AB students, To be best prepared for your AP Calculus AB course, you will complete this summer review assignment, which you will submit on
6.1 Normal Distribution
 GOALS: 1. Understand properties of: a) Density Curves b) Normal Curves c) Standard Normal Curve 2. Relate area under the curve to proportions of the population represented by the curve. Study Ch. 6.1,
Chapter 6 The Standard Deviation as a Ruler and the Normal Model
 Chapter 6 The Standard Deviation as a Ruler and the Normal Model Overview Key Concepts Understand how adding (subtracting) a constant or multiplying (dividing) by a constant changes the center and/or spread
Calculating Normal Distribution Probabilities
 Calculating Normal Distribution Probabilities Lecture 13 February 12, 2018 Four Stages of Statistics Data Collection Displaying and Summarizing Data Probability Basics of Probability Probability Distributions
Math 148. Polynomial Graphs
 Math 148 Lab 1 Polynomial Graphs Due: Monday Wednesday, April April 10 5 Directions: Work out each problem on a separate sheet of paper, and write your answers on the answer sheet provided. Submit the
Lesson 6 Practice Problems
 Name: Date: Lesson 6 Section 6.1: Writing Exponential Models 1. Complete the following table. Growth Rate as a % Growth Rate as a decimal Growth Factor 13% 0.13 1.13 21% 7% 0.20 0.05 1.25 1.075 2.03 2.
g( x) = 3x 4 Lesson 10 - Practice Problems Lesson 10 Rational Functions and Equations Practice Problems
 = 3x 4 Lesson 10 - Practice Problems Lesson 10 Rational Functions and Equations Practice Problems") Lesson 10 - Practice Problems Section 10.1: Characteristics of Rational Functions 1. Complete the table below. Function Domain a) f ( x) = 4x 6 2x b) f ( x) = 8x + 2 3x 9 c) s( t ) = 6t + 4 t d) p( t )
Lesson 10 - Practice Problems Section 10.1: Characteristics of Rational Functions 1. Complete the table below. Function Domain a) f ( x) = 4x 6 2x b) f ( x) = 8x + 2 3x 9 c) s( t ) = 6t + 4 t d) p( t )
1.) Suppose the graph of f(x) looks like this (each tick mark denotes 1 unit). x y
 Suppose the graph of f(x) looks like this (each tick mark denotes 1 unit). x y") College Algebra Summer 2014 Exam File Exam #1 1.) Suppose the graph of f(x) looks like this (each tick mark denotes 1 unit). Graph g(x) = -0.5 f(x + 1) - 3 2.) Consider the following table of values. x
College Algebra Summer 2014 Exam File Exam #1 1.) Suppose the graph of f(x) looks like this (each tick mark denotes 1 unit). Graph g(x) = -0.5 f(x + 1) - 3 2.) Consider the following table of values. x
Unit 2 Linear Equations and Inequalities
 Unit 2 Linear Equations and Inequalities Test Date: Name: By the end of this unit, you will be able to Use rate of change to solve problems Find the slope of a line Model real-world data with linear equations
Chapter 23: Inferences About Means
 Chapter 3: Inferences About Means Sample of Means: number of observations in one sample the population mean (theoretical mean) sample mean (observed mean) is the theoretical standard deviation of the population
Lesson 4 Linear Functions and Applications
 In this lesson, we take a close look at Linear Functions and how real world situations can be modeled using Linear Functions. We study the relationship between Average Rate of Change and Slope and how
Using Exploration and Technology to Teach Graph Translations
 Using Eploration and Technology to Teach Graph Translations Rutgers Precalculus Conference March 16, 2018 Frank Forte Raritan Valley Community College Opening Introduction Motivation learning the alphabet
Chapter 6 The Normal Distribution
 Chapter 6 The Normal PSY 395 Oswald Outline s and area The normal distribution The standard normal distribution Setting probable limits on a score/observation Measures related to 2 s and Area The idea
Chapter 6. Exploring Data: Relationships
 Chapter 6 Exploring Data: Relationships For All Practical Purposes: Effective Teaching A characteristic of an effective instructor is fairness and consistenc in grading and evaluating student performance.
The standard form of the equation of a circle is based on the distance formula. The distance formula, in turn, is based on the Pythagorean Theorem.
 Unit, Lesson. Deriving the Equation of a Circle The graph of an equation in and is the set of all points (, ) in a coordinate plane that satisf the equation. Some equations have graphs with precise geometric
Linear Equations 1.1. A Park Ranger s Work Is Never Done Solving Problems Using Equations
 Linear Equations Black bears, like this little cub, are really good climbers. They climb trees to eat and to avoid their enemies. There are all kinds of different black bears: New Mexico black bears, Florida
3.2 Quadratic Equations by Graphing
 www.ck12.org Chapter 3. Quadratic Equations and Quadratic Functions 3.2 Quadratic Equations by Graphing Learning Objectives Identify the number of solutions of quadratic equations. Solve quadratic equations
Lesson 1 Practice Problems
 Name: Date: Section 1.1: What is a Function? Lesson 1 1. The table below gives the distance D, in kilometers, of a GPS satellite from Earth t minutes after being launched. t = Time (in minutes) D = Distance
(a) (i) Use StatCrunch to simulate 1000 random samples of size n = 10 from this population.
 (i) Use StatCrunch to simulate 1000 random samples of size n = 10 from this population.") Chapter 8 Sampling Distribution Ch 8.1 Distribution of Sample Mean Objective A : Shape, Center, and Spread of the Distributions of A1. Sampling Distributions of Mean A1.1 Sampling Distribution of the Sample
Chapter 8 Sampling Distribution Ch 8.1 Distribution of Sample Mean Objective A : Shape, Center, and Spread of the Distributions of A1. Sampling Distributions of Mean A1.1 Sampling Distribution of the Sample
AP Calculus AB SUMMER ASSIGNMENT. Dear future Calculus AB student
 AP Calculus AB SUMMER ASSIGNMENT Dear future Calculus AB student We are ecited to work with you net year in Calculus AB. In order to help you be prepared for this class, please complete the summer assignment.
Name Typical Applications in Algebra 1
 1. Graph the information below as a scatter plot. Turn your graph paper to landscape. Use 1960 as year 0. Let each square along the x-axis represent one year. Let each square on the y axis represent 100
7-1A. Relationships Between Two Variables. Vocabulary. Using the Formula d = r t. Lesson
 Chapter 7 Lesson 7-1A Relationships Between Two Variables Vocabulary independent variable dependent variable BIG IDEA In equations where there are two variables, it is often the case that the value of
Epsilon-Delta Window Challenge Name Student Activity
 Open the TI-Nspire document Epsilon-Delta.tns. In this activity, you will get to visualize what the formal definition of limit means in terms of a graphing window challenge. Informally, lim f( x) Lmeans
Linear Equations and Inequalities
 Unit 2 Linear Equations and Inequalities 9/26/2016 10/21/2016 Name: By the end of this unit, you will be able to Use rate of change to solve problems Find the slope of a line Model real-world data with
Graphing Utility Programs
 Appendix H Graphing Utility Programs H1 Appendix H Graphing Utility Programs Parabola (Reflections and Shifts Program) Reflections and Shifts Program (Section 2.6) This program will graph the function
Describing Distributions
 Describing Distributions With Numbers April 18, 2012 Summary Statistics. Measures of Center. Percentiles. Measures of Spread. A Summary Statement. Choosing Numerical Summaries. 1.0 What Are Summary Statistics?
IM3 Unit 1 TEST - Working with Linear Relations SEP 2015
 Name: Date : IM 3 UNIT TEST Linear Functions Teacher: Mr. Santowski and Ms. Aschenbrenner Score: PART 1 - CALCULATOR ACTIVE QUESTIONS Maximum marks will be given for correct answers. Where an answer is
Normal Curve in standard form: Answer each of the following questions
 Basic Statistics Normal Curve in standard form: Answer each of the following questions What percent of the normal distribution lies between one and two standard deviations above the mean? What percent
Review of the Normal Distribution
 Sampling and s Normal Distribution Aims of Sampling Basic Principles of Probability Types of Random Samples s of the Mean Standard Error of the Mean The Central Limit Theorem Review of the Normal Distribution
Inferential Statistics and Distributions
 13 Inferential Statistics and Distributions Contents Getting Started: Mean Height of a Population... 13-2 Inferential Stat Editors... 13-6 STAT TESTS Menu... 13-9 Inferential Statistics Input Descriptions...
How Do They Fit? y > 4. y + 2 < 8 y > -6. y - 8 > y > 7. y > > y < -6 y + 1 > -2. y < 5. y > -3 y < y > -6.
 How Do They Fit? y < -4 y + 2 < 8 y > -6 y > 1 2-7y > 7 y - 8 > -12 y < -3 y > -4 y < -1 12y < -6 y + 1 > -2 y > -3 y < - 1 2 -y 3 > -3 5 y < 5 y 2 > -1 y -2 < -3-2y > -6 15y < 3 y < 3 y > 6 y 2 < 2 y
Objective A: Mean, Median and Mode Three measures of central of tendency: the mean, the median, and the mode.
 Chapter 3 Numerically Summarizing Data Chapter 3.1 Measures of Central Tendency Objective A: Mean, Median and Mode Three measures of central of tendency: the mean, the median, and the mode. A1. Mean The
H(t) = 16t Sketch a diagram illustrating the Willis Tower and the path of the baseball as it falls to the ground.
 = 16t Sketch a diagram illustrating the Willis Tower and the path of the baseball as it falls to the ground.") Name Period Date Introduction to Quadratic Functions Activity 2 Imagine yourself standing on the roof of the 1450-foot-high Willis Tower (formerly called the Sears Tower) in Chicago. When you release and
Name Period Date Introduction to Quadratic Functions Activity 2 Imagine yourself standing on the roof of the 1450-foot-high Willis Tower (formerly called the Sears Tower) in Chicago. When you release and
Ø Set of mutually exclusive categories. Ø Classify or categorize subject. Ø No meaningful order to categorization.
 Statistical Tools in Evaluation HPS 41 Fall 213 Dr. Joe G. Schmalfeldt Types of Scores Continuous Scores scores with a potentially infinite number of values. Discrete Scores scores limited to a specific
4.2 The Normal Distribution. that is, a graph of the measurement looks like the familiar symmetrical, bell-shaped
 4.2 The Normal Distribution Many physiological and psychological measurements are normality distributed; that is, a graph of the measurement looks like the familiar symmetrical, bell-shaped distribution
Describing Distributions With Numbers
 Describing Distributions With Numbers October 24, 2012 What Do We Usually Summarize? Measures of Center. Percentiles. Measures of Spread. A Summary Statement. Choosing Numerical Summaries. 1.0 What Do
Using a graphic display calculator
 12 Using a graphic display calculator CHAPTER OBJECTIVES: This chapter shows you how to use your graphic display calculator (GDC) to solve the different types of problems that you will meet in your course.
Unit 7 Trigonometry Project Name Key Project Information
 Unit 7 Trigonometry Project Name Key Project Information What is it? This project will be a series of tasks that you must complete on your own. Specific instructions are given for each task, but all must
Study Ch. 13.1, # 1 4 all Study Ch. 13.2, # 9 15, 25, 27, 31 [# 11 17, ~27, 29, ~33]
![Study Ch. 13.1, # 1 4 all Study Ch. 13.2, # 9 15, 25, 27, 31 [# 11 17, ~27, 29, ~33]](/thumbs/77/76526716.jpg "Study Ch. 13.1, # 1 4 all Study Ch. 13.2, # 9 15, 25, 27, 31 [# 11 17, ~27, 29, ~33]") GOALS: 1. Learn the properties of the χ 2 Distribution. 2. Understand how the shape of the χ 2 Distribution changes as the df increases. 3. Be able to find p values. 4. Recognize that χ 2 tests are right
GOALS: 1. Learn the properties of the χ 2 Distribution. 2. Understand how the shape of the χ 2 Distribution changes as the df increases. 3. Be able to find p values. 4. Recognize that χ 2 tests are right
Lecture 10/Chapter 8 Bell-Shaped Curves & Other Shapes. From a Histogram to a Frequency Curve Standard Score Using Normal Table Empirical Rule
 Lecture 10/Chapter 8 Bell-Shaped Curves & Other Shapes From a Histogram to a Frequency Curve Standard Score Using Normal Table Empirical Rule From Histogram to Normal Curve Start: sample of female hts
TI-80. Two-Point Form of a Line. Simple Interest Program. Graph Reflection Program. Quadratic Formula Program
 TI-80 PROGRAM:SIMPINT :FIX 2 :DISP PRINCIPAL :INPUT P :DISP INTEREST RATE :DISP IN DECIMAL FORM :INPUT R :DISP NUMBER OF YEARS :INPUT T :PRT I :DISP THE INTEREST IS :DISP I :FLOAT write the quadratic equation
Making Sense in Algebra 2
 Making Sense in Algebra 2 Henri Picciotto henri@matheducationpage.org www.matheducationpage.org Lessons from a course developed over many years, for somewhat heterogeneous classes, with an emphasis on
Table of Contents. Unit 6: Modeling Geometry. Answer Key...AK-1. Introduction... v
 These materials ma not be reproduced for an purpose. The reproduction of an part for an entire school or school sstem is strictl prohibited. No part of this publication ma be transmitted, stored, or recorded
Paired Samples. Lecture 37 Sections 11.1, 11.2, Robb T. Koether. Hampden-Sydney College. Mon, Apr 2, 2012
 Paired Samples Lecture 37 Sections 11.1, 11.2, 11.3 Robb T. Koether Hampden-Sydney College Mon, Apr 2, 2012 Robb T. Koether (Hampden-Sydney College) Paired Samples Mon, Apr 2, 2012 1 / 17 Outline 1 Dependent
Practice Test Questions Multiple Choice Identify the choice that best completes the statement or answers the question.
 Practice Test Questions Multiple Choice Identify the choice that best completes the statement or answers the question. 1. Which set of data is correct for this graph? 5 y 4 3 1 5 4 3 1 1 1 3 4 5 x 3 4
MINI LESSON. Lesson 2a Linear Functions and Applications
 MINI LESSON Lesson 2a Linear Functions and Applications Lesson Objectives: 1. Compute AVERAGE RATE OF CHANGE 2. Explain the meaning of AVERAGE RATE OF CHANGE as it relates to a given situation 3. Interpret
Digital Elevation Models. Using elevation data in raster format in a GIS
 Digital Elevation Models Using elevation data in raster format in a GIS What is a Digital Elevation Model (DEM)? Digital representation of topography Model based on scale of original data Commonly a raster
Lesson 3 Average Rate of Change and Linear Functions
 Lesson 3 Average Rate of Change and Linear Functions Lesson 3 Average Rate of Change and Linear Functions In this lesson, we will introduce the concept of average rate of change followed by a review of
The empirical ( ) rule
 rule") The empirical (68-95-99.7) rule With a bell shaped distribution, about 68% of the data fall within a distance of 1 standard deviation from the mean. 95% fall within 2 standard deviations of the mean. 99.7%
The empirical (68-95-99.7) rule With a bell shaped distribution, about 68% of the data fall within a distance of 1 standard deviation from the mean. 95% fall within 2 standard deviations of the mean. 99.7%
Solving Quadratic Equations by Graphs and Factoring
 Solving Quadratic Equations b Graphs and Factoring Algebra Unit: 05 Lesson: 0 Consider the equation - 8 + 15 = 0. Show (numericall) that = 5 is a solution. There is also another solution to the equation.
Ch Inference for Linear Regression
 Ch. 12-1 Inference for Linear Regression ACT = 6.71 + 5.17(GPA) For every increase of 1 in GPA, we predict the ACT score to increase by 5.17. population regression line β (true slope) μ y = α + βx mean
CHAPTER P Preparation for Calculus
 PART II CHAPTER P Preparation for Calculus Section P. Graphs and Models..................... 8 Section P. Linear Models and Rates of Change............ 87 Section P. Functions and Their Graphs................
Summer AP Assignment Coversheet Falls Church High School
 Summer AP Assignment Coversheet Falls Church High School Course: AP Calculus AB Teacher Name/s: Veronica Moldoveanu, Ethan Batterman Assignment Title: AP Calculus AB Summer Packet Assignment Summary/Purpose:
MATH 099 Name (please print) FINAL EXAM - FORM A Winter 2015 Instructor Score
 FINAL EXAM - FORM A Winter 2015 Instructor Score") MATH 099 Name (please print) Winter 2015 Instructor Score Point-values for each problem are shown at the right in parentheses. PART I: SIMPLIFY AS MUCH AS POSSIBLE: 1. ( 16 c 12 ) 3 4 1. (2) 2. 52 m "7
MATH 099 Name (please print) Winter 2015 Instructor Score Point-values for each problem are shown at the right in parentheses. PART I: SIMPLIFY AS MUCH AS POSSIBLE: 1. ( 16 c 12 ) 3 4 1. (2) 2. 52 m "7
The SIR Disease Model Trajectories and MatLab
 The SIR Disease Model Trajectories and MatLab James K. Peterson Department of Biological Sciences and Department of Mathematical Sciences Clemson University November 17, 2013 Outline Reviewing the SIR
Continuous random variables
 Continuous random variables A continuous random variable X takes all values in an interval of numbers. The probability distribution of X is described by a density curve. The total area under a density
Vectors and Projectile Motion on the TI-89
 1 Vectors and Projectile Motion on the TI-89 David K. Pierce Tabor Academy Marion, Massachusetts 2738 dpierce@taboracademy.org (58) 748-2 ext. 2243 This paper will investigate various properties of projectile
2.1 Identifying Patterns
 I. Foundations for Functions 2.1 Identifying Patterns: Leaders' Notes 2.1 Identifying Patterns Overview: Objective: s: Materials: Participants represent linear relationships among quantities using concrete
Mathematics HL/SL Graphic display calculators First examinations Diploma Programme. Teacher support material
 Mathematics HL/SL Graphic display calculators First examinations 2006 Diploma Programme Teacher support material Diploma Programme Mathematics HL/SL Graphic display calculators Teacher support material
Unit 1: Statistics. Mrs. Valentine Math III
 Unit 1: Statistics Mrs. Valentine Math III 1.1 Analyzing Data Statistics Study, analysis, and interpretation of data Find measure of central tendency Mean average of the data Median Odd # data pts: middle
MEI Casio Tasks for Mechanics
 Task 1: Kinematics Constant Acceleration Equations and Graphs Example 2 1 A particle acceleration has a 0.8ms and initial velocity u 3.6ms. Sketch the graphs of displacement, velocity and acceleration
Summer AP Assignment Coversheet Falls Church High School
 Summer AP Assignment Coversheet Falls Church High School Course: AP Calculus AB Teacher Name/s: Veronica Moldoveanu, Ethan Batterman Assignment Title: AP Calculus AB Summer Packet Assignment Summary/Purpose:
3.1 Measure of Center
 3.1 Measure of Center Calculate the mean for a given data set Find the median, and describe why the median is sometimes preferable to the mean Find the mode of a data set Describe how skewness affects
Stat 101 Exam 1 Important Formulas and Concepts 1
 1 Chapter 1 1.1 Definitions Stat 101 Exam 1 Important Formulas and Concepts 1 1. Data Any collection of numbers, characters, images, or other items that provide information about something. 2. Categorical/Qualitative
Density curves and the normal distribution
 Density curves and the normal distribution - Imagine what would happen if we measured a variable X repeatedly and make a histogram of the values. What shape would emerge? A mathematical model of this shape
Epsilon-Delta Window Challenge TEACHER NOTES MATH NSPIRED
 Math Objectives Students will interpret the formal definition (epsilon-delta) of limit in terms of graphing window dimensions. Students will use this interpretation to make judgments of whether a limit
STT 315 This lecture is based on Chapter 2 of the textbook.
 STT 315 This lecture is based on Chapter 2 of the textbook. Acknowledgement: Author is thankful to Dr. Ashok Sinha, Dr. Jennifer Kaplan and Dr. Parthanil Roy for allowing him to use/edit some of their
Practice A. Name Date. (8x 2 6) 5 1; 1. (m 2 4) 5 5. (w 2 7) 5 5. (d 2 5) (m 1 6) Total amount in piggy bank.
 5 1; 1. (m 2 4) 5 5. (w 2 7) 5 5. (d 2 5) (m 1 6) Total amount in piggy bank.") Practice A For use with pages 48 53 Check whether the given number is a solution of the equation.. 6x 2 5x 5 7; 2 2. 7 2(m 2 4) 5 3; 3. } 2 (8x 2 6) 5 ; State the first step in solving the equation. 4.
Practice A For use with pages 48 53 Check whether the given number is a solution of the equation.. 6x 2 5x 5 7; 2 2. 7 2(m 2 4) 5 3; 3. } 2 (8x 2 6) 5 ; State the first step in solving the equation. 4.
Chapter 3: Displaying and summarizing quantitative data p52 The pattern of variation of a variable is called its distribution.
 Chapter 3: Displaying and summarizing quantitative data p52 The pattern of variation of a variable is called its distribution. 1 Histograms p53 The breakfast cereal data Study collected data on nutritional
Section 1.1: THE DISTANCE AND MIDPOINT FORMULAS; GRAPHING UTILITIES; INTRODUCTION TO GRAPHING EQUATIONS
 PRECALCULUS I: COLLEGE ALGEBRA GUIDED NOTEBOOK FOR USE WITH SULLIVAN AND SULLIVAN PRECALCULUS ENHANCED WITH GRAPHING UTILITIES, BY SHANNON MYERS (FORMERLY GRACEY) Section 1.1: THE DISTANCE AND MIDPOINT
UNIT 6 MODELING GEOMETRY Lesson 1: Deriving Equations Instruction
 Prerequisite Skills This lesson requires the use of the following skills: appling the Pthagorean Theorem representing horizontal and vertical distances in a coordinate plane simplifing square roots writing
 www.casioeducation.com 1-800-582-2763 AlgebraII_FinalCVR1,4.indd 1 10/13/11 2:29 PM C A S I O w w w. C A S I O e d u C At I O n. C O m 1. POLYNOMIAL Investigation 6.5: Earth s Revolution Before the 1530s,
MALLOY PSYCH 3000 MEAN & VARIANCE PAGE 1 STATISTICS MEASURES OF CENTRAL TENDENCY. In an experiment, these are applied to the dependent variable (DV)
") MALLOY PSYCH 3000 MEAN & VARIANCE PAGE 1 STATISTICS Descriptive statistics Inferential statistics MEASURES OF CENTRAL TENDENCY In an experiment, these are applied to the dependent variable (DV) E.g., MEASURES
MALLOY PSYCH 3000 MEAN & VARIANCE PAGE 1 STATISTICS Descriptive statistics Inferential statistics MEASURES OF CENTRAL TENDENCY In an experiment, these are applied to the dependent variable (DV) E.g., MEASURES
Unit 6 Quadratic Relations of the Form y = ax 2 + bx + c
 Unit 6 Quadratic Relations of the Form y = ax 2 + bx + c Lesson Outline BIG PICTURE Students will: manipulate algebraic expressions, as needed to understand quadratic relations; identify characteristics