ST Correlation and Regression
|
|
|
- Ashlyn Baker
- 5 years ago
- Views:
Transcription
1 Chapter 5 ST Correlation and Regression Readings: Chapter , , Chapter Recap: So far we ve learned: Why we want a random sample and how to achieve it (Sampling Scheme) How to use randomization, replication, and control/blocking to create a valid experiment. Methods for summarizing and graphing data in meaningful ways. Analyzing CRD type designs to investigate which factors are important for a particular response. Next we ll look at how to deal with quantitative explanatory variables and a quantitative response. Multi-Way ANOVA vs Linear Regression Multi-Way ANOVA used with variable(s) and a Determines which factors are significantly associated with the response Correlation and Linear Regression used with variable(s) and a Determines if there is a significant linear relationship between the variables Not necessarily cause and effect! 63
2 Scatterplots and Correlation Goal: Determine the relationship between two quantitative variables! Scatterplots can display the relationship between two quantitative variables Each dot corresponds to one observation Example: Using number of cups of coffee to predict quiz score (observational study). Cups of Coffee Quiz Score
3 Examining a Scatterplot: We are looking for 3 things Form Strength 65
4 Direction Correlation We will focus on the Correlation a statistic that measures the strength and direction of the linear association between two quantitative variables. No need to distinguish between explanatory variable and response for correlation! Properties of Correlation: Unitless quantity ρ and R (or r) are always between Sign indicates the direction of association Distance from 0 (magnitude) indicates the strength of the association Interpreting Correlation: ρ (or R/r) close to 1 = ρ (or R/r) close to 0 = ρ (or R/r) close to 1 = 66
5 What would a correlation of 1 or -1 look like on a scatterplot? Not resistant to outliers, why? 67
6 Example: For the cups of coffee and quiz score example, we can find the sample correlation, r (which is estimating the true underlying population correlation (ρ)) and interpret it. Cups of Coffee Quiz Score
7 Linear Regression What if I want to use an explanatory variable (x) to predict a response (y)? Simple Linear Regression (SLR) finds the line of best fit between one quantitative explanatory variable x and the response y measured on the same subjects. Data in the form of pairs of observations (x 1, y 1 ), (x 2, y 2 ),, (x n, y n ) - same set up as correlation data Often done using a model of the form: Note: β 0 and β 1 are true unknown parameters. When we have data we fit this model and get estimates denoted by 69


8 How to get the estimates? Names of line with estimates plugged in: fitted line or regression line or prediction line or prediction equation or least squares line 70
9 Interpretation of line: Major use of Regression line!! Useful for predicting the response (called ŷ) for a given value of x Just plug the new x into the equation! Warning! Extrapolation is bad! 71
10 Interpretation of parameter estimates: ˆβ 0 = b 0 = sample intercept ˆβ 1 = b 1 = sample slope 72
11 Example: Coffee and Quiz Score 1. Find the fitted least squares regression line. 2. Interpret the slope. 3. Interpret the intercept. Is it meaningful in this example? 4. Jenny happens to stop in the coffee shop. She notices your plot and says, I had 5 cups of coffee the night before the quiz. Guess what my score was! 5. Jenny actually scored a 14. Find her residual. 6. If Enrique drank 12 cups of coffee, can we safely predict his quiz score? 73
12 Note: Always Graph your Data To check linearity assumption. Four data sets below give the same fitted line, but only the first one makes sense! Note: Causation vs Correlation Association between variables does not mean that one variable causes the changes in another. Only well designed experiments can establish that an explanatory variable causes a change in a response variable. 74
13 How do we know we have a Significant Linear Relationship IDEA: Given data, we find An estimate of the (true) mean response If we did another experiment would we get the same data?? Need to do a statistical test to see if there is a significant linear relationship between the explanatory and response variable. What hypothesis do we want to test? 75
14 How to investigate this hypothesis?... ANOVA! ANOVA = ANalysis Of VAriance. What variation are we measuring here? Which line above gives more evidence of a significant linear relationship? Why? A measure of the total amount of variability in the response is the sample variance of Y. Consider the numerator, which we call the total sum of squares: SS(T ot) = n (y i ȳ) 2 (variability of observations about the mean) i=1 df T ot = n 1 76
15 This variability is partitioned into independent components: Sum of squares due to regression, SS(R) (or sum of squares model, SS(M)) SS(R) = df R = 1 n (ŷ i ȳ) 2 (variability of the fitted line about the mean) i=1 Sum of squares due to error, SS(E) SS(E) = e 2 i = (y i ŷ i ) 2 (variability of observations about the fitted line) df E = n 2 Note: SS(T ot) = SS(R) + SS(E) and df T ot = df R + df E (Recall: DF = Number of independent pieces of data for the sum of squares). The ANOVA table from simple linear regression Source df Sum of squares Mean Square F-Ratio Regression 1 SS(R) M S(R) M S(R)/M S(E) Error n 2 SS(E) MS(E) Total n 1 SS(T ot) Meaning of pieces very similar to Multi-Way ANOVA! mean squares - represent standardized measures of variation due to the different sources and are given by SS(source)/df source. F-Ratio - Ratios of mean squares often follow an F -distribution and are appropriate for testing different hypotheses of interest. In this case, to test Use the test statistic (H 0 ) β 1 = 0 vs (H 1 ) β 1 0 F = MS(R)/MS(E) This is used to find a p-value which can then be used to determine if we have a statistically significant result. 77
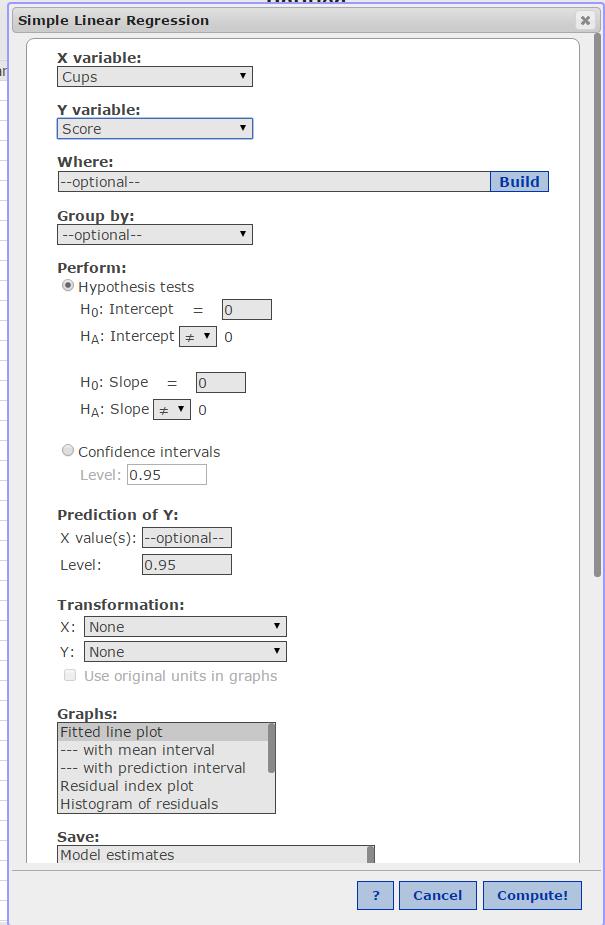
16 Conducting the analysis in Statcrunch 78

17 79
18 r 2 the coefficient of determination r 2 = SS(Model)/SS(T ot) - Interpretation: 1. High r 2 then the line is good for prediction. 2. In the coffee example, we obtained r 2 = Interpretation: 80
19 Example: One type of fuel is biodiesel, which comes from plants. An experiment was done to determine how much biodiesel could be generated from a certain type of plant grown in different media. The final biomass was also recorded on 44 the plants from the experiment. Let s consider these two variables, the log of biodiesel and biomass. proc reg data=bioexp ; model logbiodiesel=biomass/clb; run; 1. Describe the scatterplot (3 things!). 2. Give the value of the sample correlation. 81
20 Output From Proc Reg for Biomass and Log(Biodiesel) Example 1 The REG Procedure Model: MODEL1 Dependent Variable: logbiodiesel Number of Observations Read 44 Number of Observations Used 44 Source Analysis of Variance DF Sum of Squares Mean Square F Value Pr > F Model <.0001 Error Corrected Total Root MSE R-Square Dependent Mean Adj R-Sq Coeff Var Variable DF Parameter Estimate Parameter Estimates Standard Error t Value Pr > t 95% Confidence Limits Intercept biomass < State and interpret the value of the MSE. 4. Determine if there is a significant linear relationship between these variables. State your reasoning and your hypothesis. 5. Give the fitted line and use it to predict for a biomass of 10. If you have an observed value of 4 for a biomass of 10, what is the residual? 82
21 Consider the regression of Y = brain size (MRI counts) on x=height(in). Use the output below to answer the following: 1. Interpret the scatterplot and state the correlation. 2. What is the % of variability in the MRI counts explained by the data. 3. Determine the fitted regression line. 4. Is there a significant liner relationship between the variables. Why or why not? 5. Does the intercept have a meaningful interpretation? 6. Predict brain size for an individual that is 60inches tall. 83
22 84
23 Multiple Linear Regression (Optional Reading) These ideas can easily be extended to the case of more than 1 quantitative explanatory variable. This is called Multiple Linear Regression: β j are called partial slopes Model Y i = β 0 + β 1 x i1 + β 2 x i β p x ip + E i x p can be quadratic values, cubics, or interaction terms x 2 1, x 3 1, x 1 x 2 fitted model, ŷ = b 0 + b 1 x 1 + b 2 x b p x p Model often still fit using least squares i.e. minimize SS(E) = n i=1 (y i ŷ i ) 2 Example (Taken from Probabilitiy and Statistics, Devore) Soil and sediment adsorption, the extent to which chemicals collect in a condensed form on the surface, is an important characteristic influencing the effectiveness of pesticides and various agricultural chemicals. A study was done on 13 soil samples that measured Y = phosphate adsorption index, X 1 = amount of extractable aluminum, and X 2 = amount of extractable iron. The data are given below: Adsorption Label Aluminum Label Iron Label 4 y 1 13 x 1,1 61 x 1,2 18 y 2 21 x 2,1 175 x 2,2 14 y 3 24 x 3,1 111 x 3,2 18 y 4 23 x 4,1 124 x 4,2 26 y 5 64 x 5,1 130 x 5,2 26 y 6 38 x 6,1 173 x 6,2 21 y 7 33 x 7,1 169 x 7,2 30 y 8 61 x 8,1 169 x 8,2 28 y 9 39 x 9,1 160 x 9,2 36 y x 10,1 244 x 10,2 65 y x 11,1 257 x 11,2 62 y x 12,1 333 x 12,2 40 y x 13,1 199 x 13,2 85
24 Output From Proc Reg for Adsorption Example 1 The REG Procedure Model: MODEL1 Dependent Variable: adsorp Number of Observations Read 14 Number of Observations Used 13 Number of Observations with Missing Values 1 Source DF Analysis of Variance Sum of Squares Mean Square F Value Pr > F Model <.0001 Error Corrected Total Root MSE R-Square Dependent Mean Adj R-Sq Coeff Var Variable DF Parameter Estimate Parameter Estimates Standard Error t Value Pr > t 95% Confidence Limits Intercept aluminum iron
Correlation and the Analysis of Variance Approach to Simple Linear Regression
 Correlation and the Analysis of Variance Approach to Simple Linear Regression Biometry 755 Spring 2009 Correlation and the Analysis of Variance Approach to Simple Linear Regression p. 1/35 Correlation
Lecture 11: Simple Linear Regression
 Lecture 11: Simple Linear Regression Readings: Sections 3.1-3.3, 11.1-11.3 Apr 17, 2009 In linear regression, we examine the association between two quantitative variables. Number of beers that you drink
Unit 6 - Introduction to linear regression
 Unit 6 - Introduction to linear regression Suggested reading: OpenIntro Statistics, Chapter 7 Suggested exercises: Part 1 - Relationship between two numerical variables: 7.7, 7.9, 7.11, 7.13, 7.15, 7.25,
Unit 6 - Simple linear regression
 Sta 101: Data Analysis and Statistical Inference Dr. Çetinkaya-Rundel Unit 6 - Simple linear regression LO 1. Define the explanatory variable as the independent variable (predictor), and the response variable
df=degrees of freedom = n - 1
 One sample t-test test of the mean Assumptions: Independent, random samples Approximately normal distribution (from intro class: σ is unknown, need to calculate and use s (sample standard deviation)) Hypotheses:
Inference for Regression Inference about the Regression Model and Using the Regression Line, with Details. Section 10.1, 2, 3
 Inference for Regression Inference about the Regression Model and Using the Regression Line, with Details Section 10.1, 2, 3 Basic components of regression setup Target of inference: linear dependency
STAT 3900/4950 MIDTERM TWO Name: Spring, 2015 (print: first last ) Covered topics: Two-way ANOVA, ANCOVA, SLR, MLR and correlation analysis
 Covered topics: Two-way ANOVA, ANCOVA, SLR, MLR and correlation analysis") STAT 3900/4950 MIDTERM TWO Name: Spring, 205 (print: first last ) Covered topics: Two-way ANOVA, ANCOVA, SLR, MLR and correlation analysis Instructions: You may use your books, notes, and SPSS/SAS. NO
STAT 3900/4950 MIDTERM TWO Name: Spring, 205 (print: first last ) Covered topics: Two-way ANOVA, ANCOVA, SLR, MLR and correlation analysis Instructions: You may use your books, notes, and SPSS/SAS. NO
Inferences for Regression
 Inferences for Regression An Example: Body Fat and Waist Size Looking at the relationship between % body fat and waist size (in inches). Here is a scatterplot of our data set: Remembering Regression In
Simple Linear Regression Using Ordinary Least Squares
 Simple Linear Regression Using Ordinary Least Squares Purpose: To approximate a linear relationship with a line. Reason: We want to be able to predict Y using X. Definition: The Least Squares Regression
Inference for the Regression Coefficient
 Inference for the Regression Coefficient Recall, b 0 and b 1 are the estimates of the slope β 1 and intercept β 0 of population regression line. We can shows that b 0 and b 1 are the unbiased estimates
Inference for Regression Simple Linear Regression
 Inference for Regression Simple Linear Regression IPS Chapter 10.1 2009 W.H. Freeman and Company Objectives (IPS Chapter 10.1) Simple linear regression p Statistical model for linear regression p Estimating
Lecture 16 - Correlation and Regression
 Lecture 16 - Correlation and Regression Statistics 102 Colin Rundel April 1, 2013 Modeling numerical variables Modeling numerical variables So far we have worked with single numerical and categorical variables,
Inference for Regression
 Inference for Regression Section 9.4 Cathy Poliak, Ph.D. cathy@math.uh.edu Office in Fleming 11c Department of Mathematics University of Houston Lecture 13b - 3339 Cathy Poliak, Ph.D. cathy@math.uh.edu
AMS 7 Correlation and Regression Lecture 8
 AMS 7 Correlation and Regression Lecture 8 Department of Applied Mathematics and Statistics, University of California, Santa Cruz Suumer 2014 1 / 18 Correlation pairs of continuous observations. Correlation
STA 302 H1F / 1001 HF Fall 2007 Test 1 October 24, 2007
 STA 302 H1F / 1001 HF Fall 2007 Test 1 October 24, 2007 LAST NAME: SOLUTIONS FIRST NAME: STUDENT NUMBER: ENROLLED IN: (circle one) STA 302 STA 1001 INSTRUCTIONS: Time: 90 minutes Aids allowed: calculator.
LECTURE 6. Introduction to Econometrics. Hypothesis testing & Goodness of fit
 LECTURE 6 Introduction to Econometrics Hypothesis testing & Goodness of fit October 25, 2016 1 / 23 ON TODAY S LECTURE We will explain how multiple hypotheses are tested in a regression model We will define
Estimating σ 2. We can do simple prediction of Y and estimation of the mean of Y at any value of X.
 Estimating σ 2 We can do simple prediction of Y and estimation of the mean of Y at any value of X. To perform inferences about our regression line, we must estimate σ 2, the variance of the error term.
Lecture notes on Regression & SAS example demonstration
 Regression & Correlation (p. 215) When two variables are measured on a single experimental unit, the resulting data are called bivariate data. You can describe each variable individually, and you can also
Lecture 9: Linear Regression
 Lecture 9: Linear Regression Goals Develop basic concepts of linear regression from a probabilistic framework Estimating parameters and hypothesis testing with linear models Linear regression in R Regression
Regression Analysis. Regression: Methodology for studying the relationship among two or more variables
 Regression Analysis Regression: Methodology for studying the relationship among two or more variables Two major aims: Determine an appropriate model for the relationship between the variables Predict the
Overview Scatter Plot Example
 Overview Topic 22 - Linear Regression and Correlation STAT 5 Professor Bruce Craig Consider one population but two variables For each sampling unit observe X and Y Assume linear relationship between variables
CHAPTER EIGHT Linear Regression
 7 CHAPTER EIGHT Linear Regression 8. Scatter Diagram Example 8. A chemical engineer is investigating the effect of process operating temperature ( x ) on product yield ( y ). The study results in the following
Lecture 15 Multiple regression I Chapter 6 Set 2 Least Square Estimation The quadratic form to be minimized is
 Lecture 15 Multiple regression I Chapter 6 Set 2 Least Square Estimation The quadratic form to be minimized is Q = (Y i β 0 β 1 X i1 β 2 X i2 β p 1 X i.p 1 ) 2, which in matrix notation is Q = (Y Xβ) (Y
Linear regression. We have that the estimated mean in linear regression is. ˆµ Y X=x = ˆβ 0 + ˆβ 1 x. The standard error of ˆµ Y X=x is.
 Linear regression We have that the estimated mean in linear regression is The standard error of ˆµ Y X=x is where x = 1 n s.e.(ˆµ Y X=x ) = σ ˆµ Y X=x = ˆβ 0 + ˆβ 1 x. 1 n + (x x)2 i (x i x) 2 i x i. The
Chapter 4: Regression Models
 Sales volume of company 1 Textbook: pp. 129-164 Chapter 4: Regression Models Money spent on advertising 2 Learning Objectives After completing this chapter, students will be able to: Identify variables,
Multiple Regression. Inference for Multiple Regression and A Case Study. IPS Chapters 11.1 and W.H. Freeman and Company
 Multiple Regression Inference for Multiple Regression and A Case Study IPS Chapters 11.1 and 11.2 2009 W.H. Freeman and Company Objectives (IPS Chapters 11.1 and 11.2) Multiple regression Data for multiple
Regression Models. Chapter 4. Introduction. Introduction. Introduction
 Chapter 4 Regression Models Quantitative Analysis for Management, Tenth Edition, by Render, Stair, and Hanna 008 Prentice-Hall, Inc. Introduction Regression analysis is a very valuable tool for a manager
STAT 3A03 Applied Regression With SAS Fall 2017
 STAT 3A03 Applied Regression With SAS Fall 2017 Assignment 2 Solution Set Q. 1 I will add subscripts relating to the question part to the parameters and their estimates as well as the errors and residuals.
Chapter 1: Linear Regression with One Predictor Variable also known as: Simple Linear Regression Bivariate Linear Regression
 BSTT523: Kutner et al., Chapter 1 1 Chapter 1: Linear Regression with One Predictor Variable also known as: Simple Linear Regression Bivariate Linear Regression Introduction: Functional relation between
Statistics 512: Solution to Homework#11. Problems 1-3 refer to the soybean sausage dataset of Problem 20.8 (ch21pr08.dat).
.") Statistics 512: Solution to Homework#11 Problems 1-3 refer to the soybean sausage dataset of Problem 20.8 (ch21pr08.dat). 1. Perform the two-way ANOVA without interaction for this model. Use the results
Statistics 512: Solution to Homework#11 Problems 1-3 refer to the soybean sausage dataset of Problem 20.8 (ch21pr08.dat). 1. Perform the two-way ANOVA without interaction for this model. Use the results
Measuring the fit of the model - SSR
 Measuring the fit of the model - SSR Once we ve determined our estimated regression line, we d like to know how well the model fits. How far/close are the observations to the fitted line? One way to do
STOR 455 STATISTICAL METHODS I
 STOR 455 STATISTICAL METHODS I Jan Hannig Mul9variate Regression Y=X β + ε X is a regression matrix, β is a vector of parameters and ε are independent N(0,σ) Es9mated parameters b=(x X) - 1 X Y Predicted
General Linear Model (Chapter 4)
") General Linear Model (Chapter 4) Outcome variable is considered continuous Simple linear regression Scatterplots OLS is BLUE under basic assumptions MSE estimates residual variance testing regression coefficients
General Linear Model (Chapter 4) Outcome variable is considered continuous Simple linear regression Scatterplots OLS is BLUE under basic assumptions MSE estimates residual variance testing regression coefficients
Chi-square tests. Unit 6: Simple Linear Regression Lecture 1: Introduction to SLR. Statistics 101. Poverty vs. HS graduate rate
 Review and Comments Chi-square tests Unit : Simple Linear Regression Lecture 1: Introduction to SLR Statistics 1 Monika Jingchen Hu June, 20 Chi-square test of GOF k χ 2 (O E) 2 = E i=1 where k = total
Ch 2: Simple Linear Regression
 Ch 2: Simple Linear Regression 1. Simple Linear Regression Model A simple regression model with a single regressor x is y = β 0 + β 1 x + ɛ, where we assume that the error ɛ is independent random component
Chapter 6 Multiple Regression
 STAT 525 FALL 2018 Chapter 6 Multiple Regression Professor Min Zhang The Data and Model Still have single response variable Y Now have multiple explanatory variables Examples: Blood Pressure vs Age, Weight,
Lecture 6 Multiple Linear Regression, cont.
 Lecture 6 Multiple Linear Regression, cont. BIOST 515 January 22, 2004 BIOST 515, Lecture 6 Testing general linear hypotheses Suppose we are interested in testing linear combinations of the regression
Nature vs. nurture? Lecture 18 - Regression: Inference, Outliers, and Intervals. Regression Output. Conditions for inference.
 Understanding regression output from software Nature vs. nurture? Lecture 18 - Regression: Inference, Outliers, and Intervals In 1966 Cyril Burt published a paper called The genetic determination of differences
Econ 3790: Business and Economics Statistics. Instructor: Yogesh Uppal
 Econ 3790: Business and Economics Statistics Instructor: Yogesh Uppal yuppal@ysu.edu Sampling Distribution of b 1 Expected value of b 1 : Variance of b 1 : E(b 1 ) = 1 Var(b 1 ) = σ 2 /SS x Estimate of
Variance Decomposition and Goodness of Fit
 Variance Decomposition and Goodness of Fit 1. Example: Monthly Earnings and Years of Education In this tutorial, we will focus on an example that explores the relationship between total monthly earnings
Chapter 12 - Lecture 2 Inferences about regression coefficient
 Chapter 12 - Lecture 2 Inferences about regression coefficient April 19th, 2010 Facts about slope Test Statistic Confidence interval Hypothesis testing Test using ANOVA Table Facts about slope In previous
Lectures on Simple Linear Regression Stat 431, Summer 2012
 Lectures on Simple Linear Regression Stat 43, Summer 0 Hyunseung Kang July 6-8, 0 Last Updated: July 8, 0 :59PM Introduction Previously, we have been investigating various properties of the population
Simple Linear Regression
 Simple Linear Regression In simple linear regression we are concerned about the relationship between two variables, X and Y. There are two components to such a relationship. 1. The strength of the relationship.
Scatterplots and Correlation
 Bivariate Data Page 1 Scatterplots and Correlation Essential Question: What is the correlation coefficient and what does it tell you? Most statistical studies examine data on more than one variable. Fortunately,
Chapter 4. Regression Models. Learning Objectives
 Chapter 4 Regression Models To accompany Quantitative Analysis for Management, Eleventh Edition, by Render, Stair, and Hanna Power Point slides created by Brian Peterson Learning Objectives After completing
TABLES AND FORMULAS FOR MOORE Basic Practice of Statistics
 TABLES AND FORMULAS FOR MOORE Basic Practice of Statistics Exploring Data: Distributions Look for overall pattern (shape, center, spread) and deviations (outliers). Mean (use a calculator): x = x 1 + x
Math 3330: Solution to midterm Exam
 Math 3330: Solution to midterm Exam Question 1: (14 marks) Suppose the regression model is y i = β 0 + β 1 x i + ε i, i = 1,, n, where ε i are iid Normal distribution N(0, σ 2 ). a. (2 marks) Compute the
Analysis of Variance. Source DF Squares Square F Value Pr > F. Model <.0001 Error Corrected Total
 Math 221: Linear Regression and Prediction Intervals S. K. Hyde Chapter 23 (Moore, 5th Ed.) (Neter, Kutner, Nachsheim, and Wasserman) The Toluca Company manufactures refrigeration equipment as well as
Inference for Regression Inference about the Regression Model and Using the Regression Line
 Inference for Regression Inference about the Regression Model and Using the Regression Line PBS Chapter 10.1 and 10.2 2009 W.H. Freeman and Company Objectives (PBS Chapter 10.1 and 10.2) Inference about
Lecture 1 Linear Regression with One Predictor Variable.p2
 Lecture Linear Regression with One Predictor Variablep - Basics - Meaning of regression parameters p - β - the slope of the regression line -it indicates the change in mean of the probability distn of
The Simple Linear Regression Model
 The Simple Linear Regression Model Lesson 3 Ryan Safner 1 1 Department of Economics Hood College ECON 480 - Econometrics Fall 2017 Ryan Safner (Hood College) ECON 480 - Lesson 3 Fall 2017 1 / 77 Bivariate
STATISTICS 479 Exam II (100 points)
") Name STATISTICS 79 Exam II (1 points) 1. A SAS data set was created using the following input statement: Answer parts(a) to (e) below. input State $ City $ Pop199 Income Housing Electric; (a) () Give the
Name STATISTICS 79 Exam II (1 points) 1. A SAS data set was created using the following input statement: Answer parts(a) to (e) below. input State $ City $ Pop199 Income Housing Electric; (a) () Give the
Linear models and their mathematical foundations: Simple linear regression
 Linear models and their mathematical foundations: Simple linear regression Steffen Unkel Department of Medical Statistics University Medical Center Göttingen, Germany Winter term 2018/19 1/21 Introduction
STAT 511. Lecture : Simple linear regression Devore: Section Prof. Michael Levine. December 3, Levine STAT 511
 STAT 511 Lecture : Simple linear regression Devore: Section 12.1-12.4 Prof. Michael Levine December 3, 2018 A simple linear regression investigates the relationship between the two variables that is not
One-sided and two-sided t-test
 One-sided and two-sided t-test Given a mean cancer rate in Montreal, 1. What is the probability of finding a deviation of > 1 stdev from the mean? 2. What is the probability of finding 1 stdev more cases?
Lecture 13 Extra Sums of Squares
 Lecture 13 Extra Sums of Squares STAT 512 Spring 2011 Background Reading KNNL: 7.1-7.4 13-1 Topic Overview Extra Sums of Squares (Defined) Using and Interpreting R 2 and Partial-R 2 Getting ESS and Partial-R
Warm-up Using the given data Create a scatterplot Find the regression line
 Time at the lunch table Caloric intake 21.4 472 30.8 498 37.7 335 32.8 423 39.5 437 22.8 508 34.1 431 33.9 479 43.8 454 42.4 450 43.1 410 29.2 504 31.3 437 28.6 489 32.9 436 30.6 480 35.1 439 33.0 444
Simple Linear Regression
 Chapter 2 Simple Linear Regression Linear Regression with One Independent Variable 2.1 Introduction In Chapter 1 we introduced the linear model as an alternative for making inferences on means of one or
Multiple Linear Regression
 Multiple Linear Regression Simple linear regression tries to fit a simple line between two variables Y and X. If X is linearly related to Y this explains some of the variability in Y. In most cases, there
Announcements. Unit 6: Simple Linear Regression Lecture : Introduction to SLR. Poverty vs. HS graduate rate. Modeling numerical variables
 Announcements Announcements Unit : Simple Linear Regression Lecture : Introduction to SLR Statistics 1 Mine Çetinkaya-Rundel April 2, 2013 Statistics 1 (Mine Çetinkaya-Rundel) U - L1: Introduction to SLR
Lecture 18 MA Applied Statistics II D 2004
 Lecture 18 MA 2612 - Applied Statistics II D 2004 Today 1. Examples of multiple linear regression 2. The modeling process (PNC 8.4) 3. The graphical exploration of multivariable data (PNC 8.5) 4. Fitting
EXST Regression Techniques Page 1. We can also test the hypothesis H :" œ 0 versus H :"
 EXST704 - Regression Techniques Page 1 Using F tests instead of t-tests We can also test the hypothesis H :" œ 0 versus H :" Á 0 with an F test.! " " " F œ MSRegression MSError This test is mathematically
Notes 6. Basic Stats Procedures part II
 Statistics 5106, Fall 2007 Notes 6 Basic Stats Procedures part II Testing for Correlation between Two Variables You have probably all heard about correlation. When two variables are correlated, they are
Variance Decomposition in Regression James M. Murray, Ph.D. University of Wisconsin - La Crosse Updated: October 04, 2017
 Variance Decomposition in Regression James M. Murray, Ph.D. University of Wisconsin - La Crosse Updated: October 04, 2017 PDF file location: http://www.murraylax.org/rtutorials/regression_anovatable.pdf
Ch 3: Multiple Linear Regression
 Ch 3: Multiple Linear Regression 1. Multiple Linear Regression Model Multiple regression model has more than one regressor. For example, we have one response variable and two regressor variables: 1. delivery
Mathematics for Economics MA course
 Mathematics for Economics MA course Simple Linear Regression Dr. Seetha Bandara Simple Regression Simple linear regression is a statistical method that allows us to summarize and study relationships between
Lecture 3: Inference in SLR
 Lecture 3: Inference in SLR STAT 51 Spring 011 Background Reading KNNL:.1.6 3-1 Topic Overview This topic will cover: Review of hypothesis testing Inference about 1 Inference about 0 Confidence Intervals
y response variable x 1, x 2,, x k -- a set of explanatory variables
 11. Multiple Regression and Correlation y response variable x 1, x 2,, x k -- a set of explanatory variables In this chapter, all variables are assumed to be quantitative. Chapters 12-14 show how to incorporate
Simple linear regression
 Simple linear regression Biometry 755 Spring 2008 Simple linear regression p. 1/40 Overview of regression analysis Evaluate relationship between one or more independent variables (X 1,...,X k ) and a single
Confidence Interval for the mean response
 Week 3: Prediction and Confidence Intervals at specified x. Testing lack of fit with replicates at some x's. Inference for the correlation. Introduction to regression with several explanatory variables.
Figure 1: The fitted line using the shipment route-number of ampules data. STAT5044: Regression and ANOVA The Solution of Homework #2 Inyoung Kim
 0.0 1.0 1.5 2.0 2.5 3.0 8 10 12 14 16 18 20 22 y x Figure 1: The fitted line using the shipment route-number of ampules data STAT5044: Regression and ANOVA The Solution of Homework #2 Inyoung Kim Problem#
appstats27.notebook April 06, 2017
 Chapter 27 Objective Students will conduct inference on regression and analyze data to write a conclusion. Inferences for Regression An Example: Body Fat and Waist Size pg 634 Our chapter example revolves
This document contains 3 sets of practice problems.
 P RACTICE PROBLEMS This document contains 3 sets of practice problems. Correlation: 3 problems Regression: 4 problems ANOVA: 8 problems You should print a copy of these practice problems and bring them
Chapter 14 Simple Linear Regression (A)
") Chapter 14 Simple Linear Regression (A) 1. Characteristics Managerial decisions often are based on the relationship between two or more variables. can be used to develop an equation showing how the variables
Chapter 14 Simple Linear Regression (A) 1. Characteristics Managerial decisions often are based on the relationship between two or more variables. can be used to develop an equation showing how the variables
Simple Linear Regression
 Simple Linear Regression OI CHAPTER 7 Important Concepts Correlation (r or R) and Coefficient of determination (R 2 ) Interpreting y-intercept and slope coefficients Inference (hypothesis testing and confidence
Table 1: Fish Biomass data set on 26 streams
 Math 221: Multiple Regression S. K. Hyde Chapter 27 (Moore, 5th Ed.) The following data set contains observations on the fish biomass of 26 streams. The potential regressors from which we wish to explain
Simple Linear Regression: One Quantitative IV
 Simple Linear Regression: One Quantitative IV Linear regression is frequently used to explain variation observed in a dependent variable (DV) with theoretically linked independent variables (IV). For example,
Stat 500 Midterm 2 12 November 2009 page 0 of 11
 Stat 500 Midterm 2 12 November 2009 page 0 of 11 Please put your name on the back of your answer book. Do NOT put it on the front. Thanks. Do not start until I tell you to. The exam is closed book, closed
STAT 572 Assignment 5 - Answers Due: March 2, 2007
 1. The file glue.txt contains a data set with the results of an experiment on the dry sheer strength (in pounds per square inch) of birch plywood, bonded with 5 different resin glues A, B, C, D, and E.
Chapter 27 Summary Inferences for Regression
 Chapter 7 Summary Inferences for Regression What have we learned? We have now applied inference to regression models. Like in all inference situations, there are conditions that we must check. We can test
Statistical View of Least Squares
 May 23, 2006 Purpose of Regression Some Examples Least Squares Purpose of Regression Purpose of Regression Some Examples Least Squares Suppose we have two variables x and y Purpose of Regression Some Examples
Simple Linear Regression
 9-1 l Chapter 9 l Simple Linear Regression 9.1 Simple Linear Regression 9.2 Scatter Diagram 9.3 Graphical Method for Determining Regression 9.4 Least Square Method 9.5 Correlation Coefficient and Coefficient
Section 3: Simple Linear Regression
 Section 3: Simple Linear Regression Carlos M. Carvalho The University of Texas at Austin McCombs School of Business http://faculty.mccombs.utexas.edu/carlos.carvalho/teaching/ 1 Regression: General Introduction
Chapter 7 Linear Regression
 Chapter 7 Linear Regression 1 7.1 Least Squares: The Line of Best Fit 2 The Linear Model Fat and Protein at Burger King The correlation is 0.76. This indicates a strong linear fit, but what line? The line
Chapter 12: Multiple Regression
 Chapter 12: Multiple Regression 12.1 a. A scatterplot of the data is given here: Plot of Drug Potency versus Dose Level Potency 0 5 10 15 20 25 30 0 5 10 15 20 25 30 35 Dose Level b. ŷ = 8.667 + 0.575x
Multiple Linear Regression
 Chapter 3 Multiple Linear Regression 3.1 Introduction Multiple linear regression is in some ways a relatively straightforward extension of simple linear regression that allows for more than one independent
Sociology 6Z03 Review II
 Sociology 6Z03 Review II John Fox McMaster University Fall 2016 John Fox (McMaster University) Sociology 6Z03 Review II Fall 2016 1 / 35 Outline: Review II Probability Part I Sampling Distributions Probability
Chapter 8 Quantitative and Qualitative Predictors
 STAT 525 FALL 2017 Chapter 8 Quantitative and Qualitative Predictors Professor Dabao Zhang Polynomial Regression Multiple regression using X 2 i, X3 i, etc as additional predictors Generates quadratic,
Applied Regression. Applied Regression. Chapter 2 Simple Linear Regression. Hongcheng Li. April, 6, 2013
 Applied Regression Chapter 2 Simple Linear Regression Hongcheng Li April, 6, 2013 Outline 1 Introduction of simple linear regression 2 Scatter plot 3 Simple linear regression model 4 Test of Hypothesis
Statistics 5100 Spring 2018 Exam 1
 Statistics 5100 Spring 2018 Exam 1 Directions: You have 60 minutes to complete the exam. Be sure to answer every question, and do not spend too much time on any part of any question. Be concise with all
3.2: Least Squares Regressions
 3.2: Least Squares Regressions Section 3.2 Least-Squares Regression After this section, you should be able to INTERPRET a regression line CALCULATE the equation of the least-squares regression line CALCULATE
Homework 2: Simple Linear Regression
 STAT 4385 Applied Regression Analysis Homework : Simple Linear Regression (Simple Linear Regression) Thirty (n = 30) College graduates who have recently entered the job market. For each student, the CGPA
Correlation and Regression
 Correlation and Regression Dr. Bob Gee Dean Scott Bonney Professor William G. Journigan American Meridian University 1 Learning Objectives Upon successful completion of this module, the student should
Simple and Multiple Linear Regression
 Sta. 113 Chapter 12 and 13 of Devore March 12, 2010 Table of contents 1 Simple Linear Regression 2 Model Simple Linear Regression A simple linear regression model is given by Y = β 0 + β 1 x + ɛ where
ECON3150/4150 Spring 2015
 ECON3150/4150 Spring 2015 Lecture 3&4 - The linear regression model Siv-Elisabeth Skjelbred University of Oslo January 29, 2015 1 / 67 Chapter 4 in S&W Section 17.1 in S&W (extended OLS assumptions) 2
Regression Analysis II
 Regression Analysis II Measures of Goodness of fit Two measures of Goodness of fit Measure of the absolute fit of the sample points to the sample regression line Standard error of the estimate An index
SIMPLE REGRESSION ANALYSIS. Business Statistics
 SIMPLE REGRESSION ANALYSIS Business Statistics CONTENTS Ordinary least squares (recap for some) Statistical formulation of the regression model Assessing the regression model Testing the regression coefficients
Lecture 18: Simple Linear Regression
 Lecture 18: Simple Linear Regression BIOS 553 Department of Biostatistics University of Michigan Fall 2004 The Correlation Coefficient: r The correlation coefficient (r) is a number that measures the strength
9. Linear Regression and Correlation
 9. Linear Regression and Correlation Data: y a quantitative response variable x a quantitative explanatory variable (Chap. 8: Recall that both variables were categorical) For example, y = annual income,
STA 108 Applied Linear Models: Regression Analysis Spring Solution for Homework #6
 STA 8 Applied Linear Models: Regression Analysis Spring 011 Solution for Homework #6 6. a) = 11 1 31 41 51 1 3 4 5 11 1 31 41 51 β = β1 β β 3 b) = 1 1 1 1 1 11 1 31 41 51 1 3 4 5 β = β 0 β1 β 6.15 a) Stem-and-leaf