Inference for Regression Inference about the Regression Model and Using the Regression Line, with Details. Section 10.1, 2, 3
|
|
|
- Ashlynn Stanley
- 5 years ago
- Views:
Transcription
1 Inference for Regression Inference about the Regression Model and Using the Regression Line, with Details Section 10.1, 2, 3
2 Basic components of regression setup Target of inference: linear dependency of a response variable on one or more explanatory variables One explanatory variable simple linear regression (SLR) One or more multiple regression The least-squares regression line describes this dependency in the data. A population regression line describes its underlying idealization Involved in describing the probabilities of observing certain values in the sample measurements.
3 Brief review of least-squares regression The least-squares regression line makes the sum of squared-prediction errors as small as possible. The slope is and the intercept is Predictions are made by plugging in values of x The residuals describe the leftover variation in y after fitting the least-squares regression line The coefficient of determination, r 2, measures the proportion of variability in y that is explained by x
4 Formal setup for inference in regression The data arise as n pairs of measurements, (x 1, y 1 ),, (x n, y n ) (x i, y i ) are measurements on the i th individual The statistical model is y i = β 0 + β 1 x i + ε i µ y = β 0 + β 1 x i is the mean response when x = x i The ε i are independent, and each ε i is N(0, σ) The least-squares regression line is Sample estimate of µ y = β 0 + β 1 x i
5 Example: Wages and experience Do wages rise with experience? In a study of employment trends, wage (y, in $/week) and length of service (LOS = x, in months) measurements were obtained from n = 59 workers in similar customer-service positions. Wages LOS Wages LOS Wages LOS Wages LOS Wages LOS Wages LOS
6 Example: Wages and experience (continued) Summary statistics: Least-squares regression line and scatterplot:
7 Sampling framework Idea: Each value of x defines a subpopulation Multiple, independent SRSs: Each SRS is drawn from a distinct subpopulation y = response variable = measurement of interest x = explanatory variable = subpopulation and sample labels One SRS, with multiple measurements: measure (x i, y i ) on the i th individual but treat the x i as fixed quantities Model describes the conditional distribution of y given its associated subpopulation

8 Comments on the statistical model y i = β 0 + β 1 x i + ε i with independent ε i, each N(0, σ) Data = Fit + Residual Linearity: µ y = β 0 + β 1 x connects subpopulation means Constant spread: σ does not depend on x Normality: response measurements are bell-shaped within each subpopulation
 residual is e i = y i ŷ i The regression standard")
9 Residuals and residual standard deviation Unknown population quantities: The random variables ε i are residual deviations The parameter σ is the residual standard deviation Analogous quantities calculated from the sample: The i th (sample) residual is e i = y i ŷ i The regression standard error is


10 Properties of the slope estimate Suppose (x 1, y 1 ),, (x n, y n ) satisfy the assumptions of the statistical model for SLR Mean: Standard deviation: Standard error:
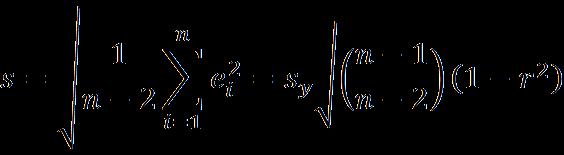
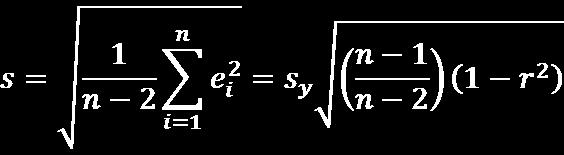
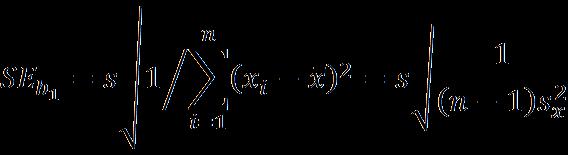
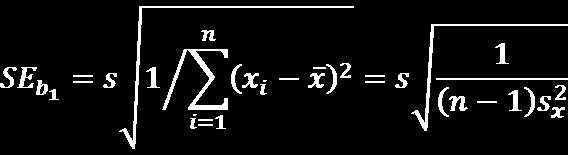
11 Some computational formulas Regression standard error: Standard error for slope:

")


12 Example: Wages and experience (continued) Regression standard error: Standard error for slope:
13 The t test and CI for slope in SLR Assumptions: The statistical model for SLR Hypotheses: H 0 : β 1 = 0 versus a one- or two-sided H a Test statistic: P-value: P(T -t) for H a : β 1 < 0 P(T t) for H a : β 1 > 0 2P(T t ) for H a : β 1 0, where T is t(n 2) CI: For confidence level C, the interval is where t* is such that P(T t*) = (1 C)/2
14 Example: Wages and experience (continued) Hypotheses: H 0 : β 1 = 0 versus H a : β 1 > 0 Summary statistics: b 1 = 0.59, s = 82.2, and SE b1 = 0.21 Test statistic: t = b 1 / SE b1 = 0.59 / 0.21 = 2.85 P-value: P(T 2.85) = 0.003, with k = n 2 = 57 d.f. Decision: Reject H 0 at significance level α = 0.05, and conclude that wages rise with experience
15 Example: Wages and experience (continued) How much do wages rise with experience? 95% CI: P(T 2.00) = 0.025, using k = n 2 = 57 d.f. t* = 2.00, and the interval is b 1 ± t*se b1 = 0.59 ± (2.00)(0.21) = 0.59 ± 0.41 = (0.18, 1.00) Conclude an increase in weekly salary between $0.18 and $1.00 per month of service, on average
16 Robustness A moderate lack of Normality may be tolerated Better for large n Outliers or influential observations may be problematic Basic tool: residual plots Example: Wages and experience (continued)
17 Connections to correlation One SRS, with multiple measurements: (x i, y i ) are paired measurements from one SRS Idea: Treat x as random and work with correlation r is the sample correlation ρ is the population correlation A test of H 0 : ρ = 0 may be carried out with identical calculations as a test of H 0 : β 1 = 0 but CI formulas for ρ and β 1 are very different Different interpretations: Correlation is for two-way relationships; regression is for one-way relationships
18 Uncertainty in predicted values Plugging x into ŷ = b 0 + b 1 x provides a prediction of the response. Two possible interpretations: ŷ is an estimate of the subpopulation mean µ y = β 0 + β 1 x ŷ is a prediction of an unobserved response, y, from a subpopulation with mean µ y = β 0 + β 1 x Note: There is more uncertainty in the second interpretation since the target of inference is random
 = (1")
19 Confidence interval for µ y Suppose ŷ is to be an estimate of µ y = β 0 + β 1 x Standard error: CI: For confidence level C, the interval is where t* is such that P(T t*) = (1 C)/2
20 Prediction interval for y Suppose ŷ is to be a prediction of y from a subpopulation with mean µ y = β 0 + β 1 x Standard error: PI: For confidence level C, the interval is where t* is such that P(T t*) = (1 C)/2


21 Example: Wages and experience (continued) What is the mean of the subpopulation of workers who s length of service is x = 125? Estimate of µ y : ŷ = b 0 + b 1 x = (0.59)(125) = Standard error: 95% CI:
 Suppose the length of")


22 Example: Wages and experience (continued) Suppose the length of service of some interesting worker is x = 125. What is his or her weekly wage? Prediction of y: ŷ = b 0 + b 1 x = Standard error: 95% PI:
23 Confidence and prediction bands Observe: PIs are less precise than CIs Reflects greater uncertainty of the prediction problem
 equation: Total variation in y (= 0 if all")
 Variation along the line (= 0 if b")
24 Decomposition of variation Analysis of variance (ANOVA) equation: Total variation in y (= 0 if all y i are equal) Variation about the line (= 0 if all y i = ŷ i ) Variation along the line (= 0 if b 1 = 0)


25 ANOVA setup Total variation in y: Variation along the line: Variation about the line: Note: Total d.f. = Regression d.f. + Residual d.f.
26 Related calculations Coefficient of determination: proportion of total variation accounted for by the regression line Mean squares: Alternative formula (which generalizes to multiple regression)
27 Example: Wages and experience (continued) Relevant summary statistics: Mean square statistics: Sums of square statistics (MS d.f.):
28 Testing in ANOVA The ANOVA F statistic is May be used to test H 0 : β 1 = 0 versus H a : β 1 0 and its generalization to multiple regression Large values of F provide evidence against H 0 : β 1 = 0 In SLR case, t = F P-value is 2P(T F) where T is t(n 2)
Inference for the Regression Coefficient
 Inference for the Regression Coefficient Recall, b 0 and b 1 are the estimates of the slope β 1 and intercept β 0 of population regression line. We can shows that b 0 and b 1 are the unbiased estimates
Mathematics for Economics MA course
 Mathematics for Economics MA course Simple Linear Regression Dr. Seetha Bandara Simple Regression Simple linear regression is a statistical method that allows us to summarize and study relationships between
Inference for Regression Simple Linear Regression
 Inference for Regression Simple Linear Regression IPS Chapter 10.1 2009 W.H. Freeman and Company Objectives (IPS Chapter 10.1) Simple linear regression p Statistical model for linear regression p Estimating
Inference for Distributions Inference for the Mean of a Population. Section 7.1
 Inference for Distributions Inference for the Mean of a Population Section 7.1 Statistical inference in practice Emphasis turns from statistical reasoning to statistical practice: Population standard deviation,
TABLES AND FORMULAS FOR MOORE Basic Practice of Statistics
 TABLES AND FORMULAS FOR MOORE Basic Practice of Statistics Exploring Data: Distributions Look for overall pattern (shape, center, spread) and deviations (outliers). Mean (use a calculator): x = x 1 + x
Inferences for Regression
 Inferences for Regression An Example: Body Fat and Waist Size Looking at the relationship between % body fat and waist size (in inches). Here is a scatterplot of our data set: Remembering Regression In
Inference for Regression Inference about the Regression Model and Using the Regression Line
 Inference for Regression Inference about the Regression Model and Using the Regression Line PBS Chapter 10.1 and 10.2 2009 W.H. Freeman and Company Objectives (PBS Chapter 10.1 and 10.2) Inference about
INFERENCE FOR REGRESSION
 CHAPTER 3 INFERENCE FOR REGRESSION OVERVIEW In Chapter 5 of the textbook, we first encountered regression. The assumptions that describe the regression model we use in this chapter are the following. We
Regression Models - Introduction
 Regression Models - Introduction In regression models there are two types of variables that are studied: A dependent variable, Y, also called response variable. It is modeled as random. An independent
23. Inference for regression
 23. Inference for regression The Practice of Statistics in the Life Sciences Third Edition 2014 W. H. Freeman and Company Objectives (PSLS Chapter 23) Inference for regression The regression model Confidence
LECTURE 6. Introduction to Econometrics. Hypothesis testing & Goodness of fit
 LECTURE 6 Introduction to Econometrics Hypothesis testing & Goodness of fit October 25, 2016 1 / 23 ON TODAY S LECTURE We will explain how multiple hypotheses are tested in a regression model We will define
Estimating σ 2. We can do simple prediction of Y and estimation of the mean of Y at any value of X.
 Estimating σ 2 We can do simple prediction of Y and estimation of the mean of Y at any value of X. To perform inferences about our regression line, we must estimate σ 2, the variance of the error term.
ST Correlation and Regression
 Chapter 5 ST 370 - Correlation and Regression Readings: Chapter 11.1-11.4, 11.7.2-11.8, Chapter 12.1-12.2 Recap: So far we ve learned: Why we want a random sample and how to achieve it (Sampling Scheme)
Correlation Analysis
 Simple Regression Correlation Analysis Correlation analysis is used to measure strength of the association (linear relationship) between two variables Correlation is only concerned with strength of the
Nature vs. nurture? Lecture 18 - Regression: Inference, Outliers, and Intervals. Regression Output. Conditions for inference.
 Understanding regression output from software Nature vs. nurture? Lecture 18 - Regression: Inference, Outliers, and Intervals In 1966 Cyril Burt published a paper called The genetic determination of differences
Correlation and Regression (Excel 2007)
") Correlation and Regression (Excel 2007) (See Also Scatterplots, Regression Lines, and Time Series Charts With Excel 2007 for instructions on making a scatterplot of the data and an alternate method of
Correlation and Regression (Excel 2007) (See Also Scatterplots, Regression Lines, and Time Series Charts With Excel 2007 for instructions on making a scatterplot of the data and an alternate method of
Sociology 6Z03 Review II
 Sociology 6Z03 Review II John Fox McMaster University Fall 2016 John Fox (McMaster University) Sociology 6Z03 Review II Fall 2016 1 / 35 Outline: Review II Probability Part I Sampling Distributions Probability
LECTURE 5. Introduction to Econometrics. Hypothesis testing
 LECTURE 5 Introduction to Econometrics Hypothesis testing October 18, 2016 1 / 26 ON TODAY S LECTURE We are going to discuss how hypotheses about coefficients can be tested in regression models We will
Correlation and the Analysis of Variance Approach to Simple Linear Regression
 Correlation and the Analysis of Variance Approach to Simple Linear Regression Biometry 755 Spring 2009 Correlation and the Analysis of Variance Approach to Simple Linear Regression p. 1/35 Correlation
Multiple Regression. Inference for Multiple Regression and A Case Study. IPS Chapters 11.1 and W.H. Freeman and Company
 Multiple Regression Inference for Multiple Regression and A Case Study IPS Chapters 11.1 and 11.2 2009 W.H. Freeman and Company Objectives (IPS Chapters 11.1 and 11.2) Multiple regression Data for multiple
Homework 2: Simple Linear Regression
 STAT 4385 Applied Regression Analysis Homework : Simple Linear Regression (Simple Linear Regression) Thirty (n = 30) College graduates who have recently entered the job market. For each student, the CGPA
Inference for Regression
 Inference for Regression Section 9.4 Cathy Poliak, Ph.D. cathy@math.uh.edu Office in Fleming 11c Department of Mathematics University of Houston Lecture 13b - 3339 Cathy Poliak, Ph.D. cathy@math.uh.edu
Unit 6 - Introduction to linear regression
 Unit 6 - Introduction to linear regression Suggested reading: OpenIntro Statistics, Chapter 7 Suggested exercises: Part 1 - Relationship between two numerical variables: 7.7, 7.9, 7.11, 7.13, 7.15, 7.25,
Simple linear regression
 Simple linear regression Biometry 755 Spring 2008 Simple linear regression p. 1/40 Overview of regression analysis Evaluate relationship between one or more independent variables (X 1,...,X k ) and a single
Statistical Modelling in Stata 5: Linear Models
 Statistical Modelling in Stata 5: Linear Models Mark Lunt Arthritis Research UK Epidemiology Unit University of Manchester 07/11/2017 Structure This Week What is a linear model? How good is my model? Does
9. Linear Regression and Correlation
 9. Linear Regression and Correlation Data: y a quantitative response variable x a quantitative explanatory variable (Chap. 8: Recall that both variables were categorical) For example, y = annual income,
Basic Business Statistics 6 th Edition
 Basic Business Statistics 6 th Edition Chapter 12 Simple Linear Regression Learning Objectives In this chapter, you learn: How to use regression analysis to predict the value of a dependent variable based
Confidence Intervals, Testing and ANOVA Summary
 Confidence Intervals, Testing and ANOVA Summary 1 One Sample Tests 1.1 One Sample z test: Mean (σ known) Let X 1,, X n a r.s. from N(µ, σ) or n > 30. Let The test statistic is H 0 : µ = µ 0. z = x µ 0
Confidence Interval for the mean response
 Week 3: Prediction and Confidence Intervals at specified x. Testing lack of fit with replicates at some x's. Inference for the correlation. Introduction to regression with several explanatory variables.
Unit 6 - Simple linear regression
 Sta 101: Data Analysis and Statistical Inference Dr. Çetinkaya-Rundel Unit 6 - Simple linear regression LO 1. Define the explanatory variable as the independent variable (predictor), and the response variable
Basic Business Statistics, 10/e
 Chapter 4 4- Basic Business Statistics th Edition Chapter 4 Introduction to Multiple Regression Basic Business Statistics, e 9 Prentice-Hall, Inc. Chap 4- Learning Objectives In this chapter, you learn:
Lectures on Simple Linear Regression Stat 431, Summer 2012
 Lectures on Simple Linear Regression Stat 43, Summer 0 Hyunseung Kang July 6-8, 0 Last Updated: July 8, 0 :59PM Introduction Previously, we have been investigating various properties of the population
Stat 411/511 ESTIMATING THE SLOPE AND INTERCEPT. Charlotte Wickham. stat511.cwick.co.nz. Nov
 Stat 411/511 ESTIMATING THE SLOPE AND INTERCEPT Nov 20 2015 Charlotte Wickham stat511.cwick.co.nz Quiz #4 This weekend, don t forget. Usual format Assumptions Display 7.5 p. 180 The ideal normal, simple
Chapter 14 Student Lecture Notes Department of Quantitative Methods & Information Systems. Business Statistics. Chapter 14 Multiple Regression
 Chapter 14 Student Lecture Notes 14-1 Department of Quantitative Methods & Information Systems Business Statistics Chapter 14 Multiple Regression QMIS 0 Dr. Mohammad Zainal Chapter Goals After completing
Chi-square tests. Unit 6: Simple Linear Regression Lecture 1: Introduction to SLR. Statistics 101. Poverty vs. HS graduate rate
 Review and Comments Chi-square tests Unit : Simple Linear Regression Lecture 1: Introduction to SLR Statistics 1 Monika Jingchen Hu June, 20 Chi-square test of GOF k χ 2 (O E) 2 = E i=1 where k = total
Topic 14: Inference in Multiple Regression
 Topic 14: Inference in Multiple Regression Outline Review multiple linear regression Inference of regression coefficients Application to book example Inference of mean Application to book example Inference
CHAPTER EIGHT Linear Regression
 7 CHAPTER EIGHT Linear Regression 8. Scatter Diagram Example 8. A chemical engineer is investigating the effect of process operating temperature ( x ) on product yield ( y ). The study results in the following
df=degrees of freedom = n - 1
 One sample t-test test of the mean Assumptions: Independent, random samples Approximately normal distribution (from intro class: σ is unknown, need to calculate and use s (sample standard deviation)) Hypotheses:
Simple Linear Regression
 Simple Linear Regression In simple linear regression we are concerned about the relationship between two variables, X and Y. There are two components to such a relationship. 1. The strength of the relationship.
Review of Statistics 101
 Review of Statistics 101 We review some important themes from the course 1. Introduction Statistics- Set of methods for collecting/analyzing data (the art and science of learning from data). Provides methods
Psychology 282 Lecture #4 Outline Inferences in SLR
 Psychology 282 Lecture #4 Outline Inferences in SLR Assumptions To this point we have not had to make any distributional assumptions. Principle of least squares requires no assumptions. Can use correlations
Regression Analysis: Exploring relationships between variables. Stat 251
 Regression Analysis: Exploring relationships between variables Stat 251 Introduction Objective of regression analysis is to explore the relationship between two (or more) variables so that information
Business Statistics. Lecture 10: Course Review
 Business Statistics Lecture 10: Course Review 1 Descriptive Statistics for Continuous Data Numerical Summaries Location: mean, median Spread or variability: variance, standard deviation, range, percentiles,
Regression Models - Introduction
 Regression Models - Introduction In regression models, two types of variables that are studied: A dependent variable, Y, also called response variable. It is modeled as random. An independent variable,
Statistics for Managers using Microsoft Excel 6 th Edition
 Statistics for Managers using Microsoft Excel 6 th Edition Chapter 13 Simple Linear Regression 13-1 Learning Objectives In this chapter, you learn: How to use regression analysis to predict the value of
AMS 7 Correlation and Regression Lecture 8
 AMS 7 Correlation and Regression Lecture 8 Department of Applied Mathematics and Statistics, University of California, Santa Cruz Suumer 2014 1 / 18 Correlation pairs of continuous observations. Correlation
y = a + bx 12.1: Inference for Linear Regression Review: General Form of Linear Regression Equation Review: Interpreting Computer Regression Output
 12.1: Inference for Linear Regression Review: General Form of Linear Regression Equation y = a + bx y = dependent variable a = intercept b = slope x = independent variable Section 12.1 Inference for Linear
Variance Decomposition and Goodness of Fit
 Variance Decomposition and Goodness of Fit 1. Example: Monthly Earnings and Years of Education In this tutorial, we will focus on an example that explores the relationship between total monthly earnings
x3,..., Multiple Regression β q α, β 1, β 2, β 3,..., β q in the model can all be estimated by least square estimators
 Multiple Regression Relating a response (dependent, input) y to a set of explanatory (independent, output, predictor) variables x, x 2, x 3,, x q. A technique for modeling the relationship between variables.
The Multiple Regression Model
 Multiple Regression The Multiple Regression Model Idea: Examine the linear relationship between 1 dependent (Y) & or more independent variables (X i ) Multiple Regression Model with k Independent Variables:
ECO220Y Simple Regression: Testing the Slope
 ECO220Y Simple Regression: Testing the Slope Readings: Chapter 18 (Sections 18.3-18.5) Winter 2012 Lecture 19 (Winter 2012) Simple Regression Lecture 19 1 / 32 Simple Regression Model y i = β 0 + β 1 x
Correlation & Simple Regression
 Chapter 11 Correlation & Simple Regression The previous chapter dealt with inference for two categorical variables. In this chapter, we would like to examine the relationship between two quantitative variables.
Section 3: Simple Linear Regression
 Section 3: Simple Linear Regression Carlos M. Carvalho The University of Texas at Austin McCombs School of Business http://faculty.mccombs.utexas.edu/carlos.carvalho/teaching/ 1 Regression: General Introduction
Chapter 16. Simple Linear Regression and dcorrelation
 Chapter 16 Simple Linear Regression and dcorrelation 16.1 Regression Analysis Our problem objective is to analyze the relationship between interval variables; regression analysis is the first tool we will
Objectives Simple linear regression. Statistical model for linear regression. Estimating the regression parameters
 Objectives 10.1 Simple linear regression Statistical model for linear regression Estimating the regression parameters Confidence interval for regression parameters Significance test for the slope Confidence
Lecture 18: Simple Linear Regression
 Lecture 18: Simple Linear Regression BIOS 553 Department of Biostatistics University of Michigan Fall 2004 The Correlation Coefficient: r The correlation coefficient (r) is a number that measures the strength
Chapter 7 Student Lecture Notes 7-1
 Chapter 7 Student Lecture Notes 7- Chapter Goals QM353: Business Statistics Chapter 7 Multiple Regression Analysis and Model Building After completing this chapter, you should be able to: Explain model
Applied Regression. Applied Regression. Chapter 2 Simple Linear Regression. Hongcheng Li. April, 6, 2013
 Applied Regression Chapter 2 Simple Linear Regression Hongcheng Li April, 6, 2013 Outline 1 Introduction of simple linear regression 2 Scatter plot 3 Simple linear regression model 4 Test of Hypothesis
Review 6. n 1 = 85 n 2 = 75 x 1 = x 2 = s 1 = 38.7 s 2 = 39.2
 Review 6 Use the traditional method to test the given hypothesis. Assume that the samples are independent and that they have been randomly selected ) A researcher finds that of,000 people who said that
Inference with Simple Regression
 1 Introduction Inference with Simple Regression Alan B. Gelder 06E:071, The University of Iowa 1 Moving to infinite means: In this course we have seen one-mean problems, twomean problems, and problems
Chapter 27 Summary Inferences for Regression
 Chapter 7 Summary Inferences for Regression What have we learned? We have now applied inference to regression models. Like in all inference situations, there are conditions that we must check. We can test
Acknowledgements. Outline. Marie Diener-West. ICTR Leadership / Team INTRODUCTION TO CLINICAL RESEARCH. Introduction to Linear Regression
 INTRODUCTION TO CLINICAL RESEARCH Introduction to Linear Regression Karen Bandeen-Roche, Ph.D. July 17, 2012 Acknowledgements Marie Diener-West Rick Thompson ICTR Leadership / Team JHU Intro to Clinical
Scatter plot of data from the study. Linear Regression
 1 2 Linear Regression Scatter plot of data from the study. Consider a study to relate birthweight to the estriol level of pregnant women. The data is below. i Weight (g / 100) i Weight (g / 100) 1 7 25
Single and multiple linear regression analysis
 Single and multiple linear regression analysis Marike Cockeran 2017 Introduction Outline of the session Simple linear regression analysis SPSS example of simple linear regression analysis Additional topics
Chapter 3 Multiple Regression Complete Example
 Department of Quantitative Methods & Information Systems ECON 504 Chapter 3 Multiple Regression Complete Example Spring 2013 Dr. Mohammad Zainal Review Goals After completing this lecture, you should be
SIMPLE REGRESSION ANALYSIS. Business Statistics
 SIMPLE REGRESSION ANALYSIS Business Statistics CONTENTS Ordinary least squares (recap for some) Statistical formulation of the regression model Assessing the regression model Testing the regression coefficients
Regression. Marc H. Mehlman University of New Haven
 Regression Marc H. Mehlman marcmehlman@yahoo.com University of New Haven the statistician knows that in nature there never was a normal distribution, there never was a straight line, yet with normal and
Ch 2: Simple Linear Regression
 Ch 2: Simple Linear Regression 1. Simple Linear Regression Model A simple regression model with a single regressor x is y = β 0 + β 1 x + ɛ, where we assume that the error ɛ is independent random component
Trendlines Simple Linear Regression Multiple Linear Regression Systematic Model Building Practical Issues
 Trendlines Simple Linear Regression Multiple Linear Regression Systematic Model Building Practical Issues Overfitting Categorical Variables Interaction Terms Non-linear Terms Linear Logarithmic y = a +
Econometrics. Week 8. Fall Institute of Economic Studies Faculty of Social Sciences Charles University in Prague
 Econometrics Week 8 Institute of Economic Studies Faculty of Social Sciences Charles University in Prague Fall 2012 1 / 25 Recommended Reading For the today Instrumental Variables Estimation and Two Stage
Math 3330: Solution to midterm Exam
 Math 3330: Solution to midterm Exam Question 1: (14 marks) Suppose the regression model is y i = β 0 + β 1 x i + ε i, i = 1,, n, where ε i are iid Normal distribution N(0, σ 2 ). a. (2 marks) Compute the
Objectives. 2.3 Least-squares regression. Regression lines. Prediction and Extrapolation. Correlation and r 2. Transforming relationships
 Objectives 2.3 Least-squares regression Regression lines Prediction and Extrapolation Correlation and r 2 Transforming relationships Adapted from authors slides 2012 W.H. Freeman and Company Straight Line
STATS DOESN T SUCK! ~ CHAPTER 16
 SIMPLE LINEAR REGRESSION: STATS DOESN T SUCK! ~ CHAPTER 6 The HR manager at ACME food services wants to examine the relationship between a workers income and their years of experience on the job. He randomly
AMS 315/576 Lecture Notes. Chapter 11. Simple Linear Regression
 AMS 315/576 Lecture Notes Chapter 11. Simple Linear Regression 11.1 Motivation A restaurant opening on a reservations-only basis would like to use the number of advance reservations x to predict the number
Chapter 7: Simple linear regression
 The absolute movement of the ground and buildings during an earthquake is small even in major earthquakes. The damage that a building suffers depends not upon its displacement, but upon the acceleration.
Scatter plot of data from the study. Linear Regression
 1 2 Linear Regression Scatter plot of data from the study. Consider a study to relate birthweight to the estriol level of pregnant women. The data is below. i Weight (g / 100) i Weight (g / 100) 1 7 25
STAT Chapter 11: Regression
 STAT 515 -- Chapter 11: Regression Mostly we have studied the behavior of a single random variable. Often, however, we gather data on two random variables. We wish to determine: Is there a relationship
Variance Decomposition in Regression James M. Murray, Ph.D. University of Wisconsin - La Crosse Updated: October 04, 2017
 Variance Decomposition in Regression James M. Murray, Ph.D. University of Wisconsin - La Crosse Updated: October 04, 2017 PDF file location: http://www.murraylax.org/rtutorials/regression_anovatable.pdf
Formal Statement of Simple Linear Regression Model
 Formal Statement of Simple Linear Regression Model Y i = β 0 + β 1 X i + ɛ i Y i value of the response variable in the i th trial β 0 and β 1 are parameters X i is a known constant, the value of the predictor
Business Statistics. Chapter 14 Introduction to Linear Regression and Correlation Analysis QMIS 220. Dr. Mohammad Zainal
 Department of Quantitative Methods & Information Systems Business Statistics Chapter 14 Introduction to Linear Regression and Correlation Analysis QMIS 220 Dr. Mohammad Zainal Chapter Goals After completing
Applied Regression Modeling: A Business Approach Chapter 3: Multiple Linear Regression Sections
 Applied Regression Modeling: A Business Approach Chapter 3: Multiple Linear Regression Sections 3.4 3.6 by Iain Pardoe 3.4 Model assumptions 2 Regression model assumptions.............................................
STA 302 H1F / 1001 HF Fall 2007 Test 1 October 24, 2007
 STA 302 H1F / 1001 HF Fall 2007 Test 1 October 24, 2007 LAST NAME: SOLUTIONS FIRST NAME: STUDENT NUMBER: ENROLLED IN: (circle one) STA 302 STA 1001 INSTRUCTIONS: Time: 90 minutes Aids allowed: calculator.
Lecture 9: Linear Regression
 Lecture 9: Linear Regression Goals Develop basic concepts of linear regression from a probabilistic framework Estimating parameters and hypothesis testing with linear models Linear regression in R Regression
: The model hypothesizes a relationship between the variables. The simplest probabilistic model: or.
 Chapter Simple Linear Regression : comparing means across groups : presenting relationships among numeric variables. Probabilistic Model : The model hypothesizes an relationship between the variables.
Chapter 14. Linear least squares
 Serik Sagitov, Chalmers and GU, March 5, 2018 Chapter 14 Linear least squares 1 Simple linear regression model A linear model for the random response Y = Y (x) to an independent variable X = x For a given
Chapter 14 Student Lecture Notes 14-1
 Chapter 14 Student Lecture Notes 14-1 Business Statistics: A Decision-Making Approach 6 th Edition Chapter 14 Multiple Regression Analysis and Model Building Chap 14-1 Chapter Goals After completing this
Note on Bivariate Regression: Connecting Practice and Theory. Konstantin Kashin
 Note on Bivariate Regression: Connecting Practice and Theory Konstantin Kashin Fall 2012 1 This note will explain - in less theoretical terms - the basics of a bivariate linear regression, including testing
Statistics II Exercises Chapter 5
 Statistics II Exercises Chapter 5 1. Consider the four datasets provided in the transparencies for Chapter 5 (section 5.1) (a) Check that all four datasets generate exactly the same LS linear regression
Six Sigma Black Belt Study Guides
 Six Sigma Black Belt Study Guides 1 www.pmtutor.org Powered by POeT Solvers Limited. Analyze Correlation and Regression Analysis 2 www.pmtutor.org Powered by POeT Solvers Limited. Variables and relationships
Regression Models. Chapter 4. Introduction. Introduction. Introduction
 Chapter 4 Regression Models Quantitative Analysis for Management, Tenth Edition, by Render, Stair, and Hanna 008 Prentice-Hall, Inc. Introduction Regression analysis is a very valuable tool for a manager
Chapter 10. Regression. Understandable Statistics Ninth Edition By Brase and Brase Prepared by Yixun Shi Bloomsburg University of Pennsylvania
 Chapter 10 Regression Understandable Statistics Ninth Edition By Brase and Brase Prepared by Yixun Shi Bloomsburg University of Pennsylvania Scatter Diagrams A graph in which pairs of points, (x, y), are
Chapter 14 Simple Linear Regression (A)
") Chapter 14 Simple Linear Regression (A) 1. Characteristics Managerial decisions often are based on the relationship between two or more variables. can be used to develop an equation showing how the variables
Chapter 14 Simple Linear Regression (A) 1. Characteristics Managerial decisions often are based on the relationship between two or more variables. can be used to develop an equation showing how the variables
Answer Key. 9.1 Scatter Plots and Linear Correlation. Chapter 9 Regression and Correlation. CK-12 Advanced Probability and Statistics Concepts 1
 9.1 Scatter Plots and Linear Correlation Answers 1. A high school psychologist wants to conduct a survey to answer the question: Is there a relationship between a student s athletic ability and his/her
Introduction to Simple Linear Regression
 Introduction to Simple Linear Regression 1. Regression Equation A simple linear regression (also known as a bivariate regression) is a linear equation describing the relationship between an explanatory
9 Correlation and Regression
 9 Correlation and Regression SW, Chapter 12. Suppose we select n = 10 persons from the population of college seniors who plan to take the MCAT exam. Each takes the test, is coached, and then retakes the
Chapter 16. Simple Linear Regression and Correlation
 Chapter 16 Simple Linear Regression and Correlation 16.1 Regression Analysis Our problem objective is to analyze the relationship between interval variables; regression analysis is the first tool we will
AP Statistics Unit 6 Note Packet Linear Regression. Scatterplots and Correlation
 Scatterplots and Correlation Name Hr A scatterplot shows the relationship between two quantitative variables measured on the same individuals. variable (y) measures an outcome of a study variable (x) may
Lecture 18 Miscellaneous Topics in Multiple Regression
 Lecture 18 Miscellaneous Topics in Multiple Regression STAT 512 Spring 2011 Background Reading KNNL: 8.1-8.5,10.1, 11, 12 18-1 Topic Overview Polynomial Models (8.1) Interaction Models (8.2) Qualitative
Lecture 3: Inference in SLR
 Lecture 3: Inference in SLR STAT 51 Spring 011 Background Reading KNNL:.1.6 3-1 Topic Overview This topic will cover: Review of hypothesis testing Inference about 1 Inference about 0 Confidence Intervals
Regression analysis is a tool for building mathematical and statistical models that characterize relationships between variables Finds a linear
 Regression analysis is a tool for building mathematical and statistical models that characterize relationships between variables Finds a linear relationship between: - one independent variable X and -