AMS 7 Correlation and Regression Lecture 8
|
|
|
- Ross Fitzgerald
- 5 years ago
- Views:
Transcription
1 AMS 7 Correlation and Regression Lecture 8 Department of Applied Mathematics and Statistics, University of California, Santa Cruz Suumer / 18
2 Correlation pairs of continuous observations. Correlation exists between two variables when one of them is related to the other in some way. e.g. height and weight of people, temperature and altitude, quiz scores and midterm score Query 1: Do the two variables change together? Query 2: Can changes in one variable predict the changes in the other? Query 3: How do we measure the strength of the relationship between two quantitative variables? 2 / 18

3 Scatterplot: a graph of the paired sample data. 3 / 18
4 The linear correlation coefficient, r, measures the linear association between two variables. Properties 1 r 1 It does not change if we change the scale of the measurement. It is sensitive to outliers. You need to understand the concept, but you don t need to know the formula or how to test on it. If r = 1, there is a perfect positive linear relationship. If r = 1, there is perfect negative linear relationship. If r = 0, there is no relationship. 4 / 18
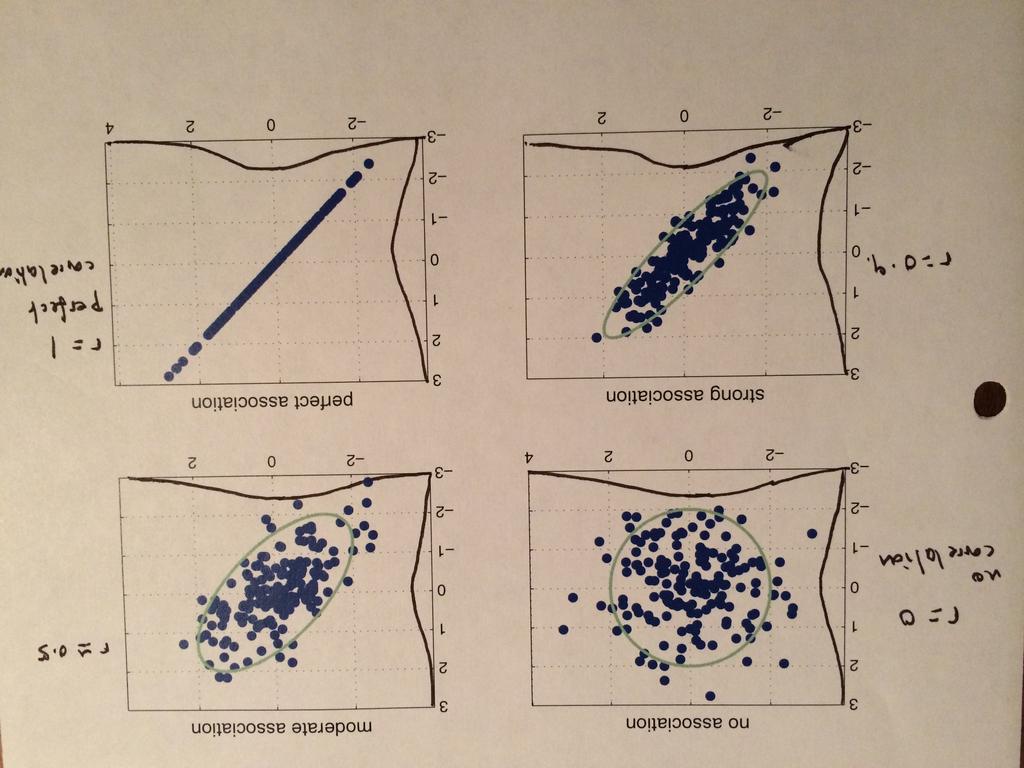
5 5 / 18
6 Correlation is not causation!!! Coefficient of determination, r 2 : Gives the proportion of the variation in variable 1 that is explained by the linear association between the two variables. 0 r indicates no linear relationship while 1 indicates a perfect linear relationship. 6 / 18
7 Review of lines y = 1 + 2x slope = 2 = y x for each one unit change in x, y changes by 2 units. intercept = 1 : value of y when x = 0 y = b 0 + b 1 x, where b 0 is the intercept and b 1 is the slope. 7 / 18
8 8 / 18
9 Linear Regression Fitting a line to data - to model the relationship between two quantitative variables. Lots of lines can be fit to the data - which do we choose? Fitted line = regression line = least squares line Fitted values = predicted values = values predicted by the line for a particular value of x 9 / 18
10 Example: The fitted line is: ŷ = x The fitted values would be : x = 1, ŷ = = 3 2 x = 2, ŷ = = 2 x = 3, ŷ = = 5 2 x = 4, ŷ = = 3 10 / 18
11 Regression is the predicting of Y from X assuming a linear relationship. X and Y are not treated the same. We are predicting Y from X! The regression line (least-squares line) is the one that minimizes the sum of squared errors in predicting Y (sum of squared residuals): b 0 and b 1 are chosen to minimize n n (ŷ i y i ) 2 = (b 0 +b 1 x i y i ) 2 i=1 i=1 This is always goes through ( x, ȳ) Note that this does not minimize the distance (perpendicular) to the line. 11 / 18
12 You don t need to know how to compute b 0 and b 1 by hand. You will need to know how to interpret JMP output, compute predicted values, and do hypothesis tests with JMP. Some data examples 12 / 18
13 How good is a regression model? Statistical significance - test if β 1 = 0 Practical significance - r 2 Check model assumptions - residual plots 13 / 18
14 Hypothesis Testing for Regression The model is y = β 0 + β 1 x, where β 0 and β 1 are population parameters. If there is a linear relationship between x and y then β 1 0. This is a t-test with n 2 degrees of freedom. 1. H 0 : β 1 = 0 vs. H 1 : β Level of significance α = Test statistic: t = b 1 0 (sampling distribution under H 0 is t with n 2 df) s b1 4. Compute t and its p-value with JMP 5. Reject if p-value < Draw conclusions about linear relationship 14 / 18
15 r 2 = square of correlation between x and y = % of variability in y is explained by predicting from x n i=1 = (ŷ i ȳ) 2 n i=1 (y i ȳ) 2 = explained variation total variation Recall that s 2 y = 1 n 1 0 r 2 1 n (y i ȳ) 2 i=1 Gives a measure for practical significance 15 / 18
16 Model assumptions: 1. y is normally distributed with mean β 0 + β 1 x and standard deviation σ. 2. The relationship between x and y is linear. 3. σ is the same for all observations. 4. The observation (x i, y i ) is independent of (x j, y j ) (conditional on β 0, β 1 ) How do we check these? Hypothesis test for (1) and (2). Residual analysis for (2), (3) and (4). 16 / 18
17 Residuals: e i = y i ŷ i Plot x i vs. e i or ŷ i vs. e i (BUT not y i vs. e i, which are correlated) Make sure there are no patterns in the plot check for non-linearity check for change in variability (heteroscedasticity) Patterns indicate violations of assumptions! Prediction is valid only when statistically significant and no problems with residuals. Prediction interval: a confidence interval for a predicted value - get from JMP. 17 / 18
18 Correlation Key Concepts!!!!! Slope and Intercept Fitted vs. Predicted values Test for linear relationship r 2 Residual analysis 18 / 18
Objectives Simple linear regression. Statistical model for linear regression. Estimating the regression parameters
 Objectives 10.1 Simple linear regression Statistical model for linear regression Estimating the regression parameters Confidence interval for regression parameters Significance test for the slope Confidence
Unit 6 - Introduction to linear regression
 Unit 6 - Introduction to linear regression Suggested reading: OpenIntro Statistics, Chapter 7 Suggested exercises: Part 1 - Relationship between two numerical variables: 7.7, 7.9, 7.11, 7.13, 7.15, 7.25,
Unit 6 - Simple linear regression
 Sta 101: Data Analysis and Statistical Inference Dr. Çetinkaya-Rundel Unit 6 - Simple linear regression LO 1. Define the explanatory variable as the independent variable (predictor), and the response variable
7.0 Lesson Plan. Regression. Residuals
 7.0 Lesson Plan Regression Residuals 1 7.1 More About Regression Recall the regression assumptions: 1. Each point (X i, Y i ) in the scatterplot satisfies: Y i = ax i + b + ɛ i where the ɛ i have a normal
THE PEARSON CORRELATION COEFFICIENT
 CORRELATION Two variables are said to have a relation if knowing the value of one variable gives you information about the likely value of the second variable this is known as a bivariate relation There
Homework for Lecture Regression Analysis Sections
 Homework for Lecture 14-15 Regression Analysis Sections 9.1-9.4 Consider the following data set labeled Gala, which describe the number of species of tortoise on the various Galapagos Islands. There are
Chapter 7. Linear Regression (Pt. 1) 7.1 Introduction. 7.2 The Least-Squares Regression Line
 7.1 Introduction. 7.2 The Least-Squares Regression Line") Chapter 7 Linear Regression (Pt. 1) 7.1 Introduction Recall that r, the correlation coefficient, measures the linear association between two quantitative variables. Linear regression is the method of fitting
Chapter 7 Linear Regression (Pt. 1) 7.1 Introduction Recall that r, the correlation coefficient, measures the linear association between two quantitative variables. Linear regression is the method of fitting
Business Statistics. Lecture 10: Correlation and Linear Regression
 Business Statistics Lecture 10: Correlation and Linear Regression Scatterplot A scatterplot shows the relationship between two quantitative variables measured on the same individuals. It displays the Form
Inferences for Regression
 Inferences for Regression An Example: Body Fat and Waist Size Looking at the relationship between % body fat and waist size (in inches). Here is a scatterplot of our data set: Remembering Regression In
11 Correlation and Regression
 Chapter 11 Correlation and Regression August 21, 2017 1 11 Correlation and Regression When comparing two variables, sometimes one variable (the explanatory variable) can be used to help predict the value
Chapter 7. Scatterplots, Association, and Correlation
 Chapter 7 Scatterplots, Association, and Correlation Bin Zou (bzou@ualberta.ca) STAT 141 University of Alberta Winter 2015 1 / 29 Objective In this chapter, we study relationships! Instead, we investigate
Chapter 5 Least Squares Regression
 Chapter 5 Least Squares Regression A Royal Bengal tiger wandered out of a reserve forest. We tranquilized him and want to take him back to the forest. We need an idea of his weight, but have no scale!
Lecture 18: Simple Linear Regression
 Lecture 18: Simple Linear Regression BIOS 553 Department of Biostatistics University of Michigan Fall 2004 The Correlation Coefficient: r The correlation coefficient (r) is a number that measures the strength
Simple Linear Regression
 Simple Linear Regression ST 430/514 Recall: A regression model describes how a dependent variable (or response) Y is affected, on average, by one or more independent variables (or factors, or covariates)
Business Statistics. Lecture 9: Simple Regression
 Business Statistics Lecture 9: Simple Regression 1 On to Model Building! Up to now, class was about descriptive and inferential statistics Numerical and graphical summaries of data Confidence intervals
Can you tell the relationship between students SAT scores and their college grades?
 Correlation One Challenge Can you tell the relationship between students SAT scores and their college grades? A: The higher SAT scores are, the better GPA may be. B: The higher SAT scores are, the lower
Correlation. A statistics method to measure the relationship between two variables. Three characteristics
 Correlation Correlation A statistics method to measure the relationship between two variables Three characteristics Direction of the relationship Form of the relationship Strength/Consistency Direction
Inference for Regression
 Inference for Regression Section 9.4 Cathy Poliak, Ph.D. cathy@math.uh.edu Office in Fleming 11c Department of Mathematics University of Houston Lecture 13b - 3339 Cathy Poliak, Ph.D. cathy@math.uh.edu
Important note: Transcripts are not substitutes for textbook assignments. 1
 In this lesson we will cover correlation and regression, two really common statistical analyses for quantitative (or continuous) data. Specially we will review how to organize the data, the importance
Introduction and Single Predictor Regression. Correlation
 Introduction and Single Predictor Regression Dr. J. Kyle Roberts Southern Methodist University Simmons School of Education and Human Development Department of Teaching and Learning Correlation A correlation
Chapter 12 Summarizing Bivariate Data Linear Regression and Correlation
 Chapter 1 Summarizing Bivariate Data Linear Regression and Correlation This chapter introduces an important method for making inferences about a linear correlation (or relationship) between two variables,
Chapter 27 Summary Inferences for Regression
 Chapter 7 Summary Inferences for Regression What have we learned? We have now applied inference to regression models. Like in all inference situations, there are conditions that we must check. We can test
Correlation & Simple Regression
 Chapter 11 Correlation & Simple Regression The previous chapter dealt with inference for two categorical variables. In this chapter, we would like to examine the relationship between two quantitative variables.
Determine is the equation of the LSRL. Determine is the equation of the LSRL of Customers in line and seconds to check out.. Chapter 3, Section 2
 3.2c Computer Output, Regression to the Mean, & AP Formulas Be sure you can locate: the slope, the y intercept and determine the equation of the LSRL. Slope is always in context and context is x value.
Announcements. Lecture 10: Relationship between Measurement Variables. Poverty vs. HS graduate rate. Response vs. explanatory
 Announcements Announcements Lecture : Relationship between Measurement Variables Statistics Colin Rundel February, 20 In class Quiz #2 at the end of class Midterm #1 on Friday, in class review Wednesday
Linear Regression. Simple linear regression model determines the relationship between one dependent variable (y) and one independent variable (x).
 and one independent variable (x).") Linear Regression Simple linear regression model determines the relationship between one dependent variable (y) and one independent variable (x). A dependent variable is a random variable whose variation
Linear Regression Simple linear regression model determines the relationship between one dependent variable (y) and one independent variable (x). A dependent variable is a random variable whose variation
Chapter 6: Exploring Data: Relationships Lesson Plan
 Chapter 6: Exploring Data: Relationships Lesson Plan For All Practical Purposes Displaying Relationships: Scatterplots Mathematical Literacy in Today s World, 9th ed. Making Predictions: Regression Line
Inference with Simple Regression
 1 Introduction Inference with Simple Regression Alan B. Gelder 06E:071, The University of Iowa 1 Moving to infinite means: In this course we have seen one-mean problems, twomean problems, and problems
Statistical View of Least Squares
 May 23, 2006 Purpose of Regression Some Examples Least Squares Purpose of Regression Purpose of Regression Some Examples Least Squares Suppose we have two variables x and y Purpose of Regression Some Examples
Chapter 4 Describing the Relation between Two Variables
 Chapter 4 Describing the Relation between Two Variables 4.1 Scatter Diagrams and Correlation The is the variable whose value can be explained by the value of the or. A is a graph that shows the relationship
LECTURE 6. Introduction to Econometrics. Hypothesis testing & Goodness of fit
 LECTURE 6 Introduction to Econometrics Hypothesis testing & Goodness of fit October 25, 2016 1 / 23 ON TODAY S LECTURE We will explain how multiple hypotheses are tested in a regression model We will define
Test 3 Practice Test A. NOTE: Ignore Q10 (not covered)
") Test 3 Practice Test A NOTE: Ignore Q10 (not covered) MA 180/418 Midterm Test 3, Version A Fall 2010 Student Name (PRINT):............................................. Student Signature:...................................................
Test 3 Practice Test A NOTE: Ignore Q10 (not covered) MA 180/418 Midterm Test 3, Version A Fall 2010 Student Name (PRINT):............................................. Student Signature:...................................................
Lecture 30. DATA 8 Summer Regression Inference
 DATA 8 Summer 2018 Lecture 30 Regression Inference Slides created by John DeNero (denero@berkeley.edu) and Ani Adhikari (adhikari@berkeley.edu) Contributions by Fahad Kamran (fhdkmrn@berkeley.edu) and
Linear Regression and Correlation. February 11, 2009
 Linear Regression and Correlation February 11, 2009 The Big Ideas To understand a set of data, start with a graph or graphs. The Big Ideas To understand a set of data, start with a graph or graphs. If
t-test for b Copyright 2000 Tom Malloy. All rights reserved. Regression
 t-test for b Copyright 2000 Tom Malloy. All rights reserved. Regression Recall, back some time ago, we used a descriptive statistic which allowed us to draw the best fit line through a scatter plot. We
Data Analysis and Statistical Methods Statistics 651
 y 1 2 3 4 5 6 7 x Data Analysis and Statistical Methods Statistics 651 http://www.stat.tamu.edu/~suhasini/teaching.html Lecture 32 Suhasini Subba Rao Previous lecture We are interested in whether a dependent
Stat 101: Lecture 6. Summer 2006
 Stat 101: Lecture 6 Summer 2006 Outline Review and Questions Example for regression Transformations, Extrapolations, and Residual Review Mathematical model for regression Each point (X i, Y i ) in the
ST Correlation and Regression
 Chapter 5 ST 370 - Correlation and Regression Readings: Chapter 11.1-11.4, 11.7.2-11.8, Chapter 12.1-12.2 Recap: So far we ve learned: Why we want a random sample and how to achieve it (Sampling Scheme)
Chapter 12 - Part I: Correlation Analysis
 ST coursework due Friday, April - Chapter - Part I: Correlation Analysis Textbook Assignment Page - # Page - #, Page - # Lab Assignment # (available on ST webpage) GOALS When you have completed this lecture,
Math 3330: Solution to midterm Exam
 Math 3330: Solution to midterm Exam Question 1: (14 marks) Suppose the regression model is y i = β 0 + β 1 x i + ε i, i = 1,, n, where ε i are iid Normal distribution N(0, σ 2 ). a. (2 marks) Compute the
Sociology 6Z03 Review II
 Sociology 6Z03 Review II John Fox McMaster University Fall 2016 John Fox (McMaster University) Sociology 6Z03 Review II Fall 2016 1 / 35 Outline: Review II Probability Part I Sampling Distributions Probability
appstats27.notebook April 06, 2017
 Chapter 27 Objective Students will conduct inference on regression and analyze data to write a conclusion. Inferences for Regression An Example: Body Fat and Waist Size pg 634 Our chapter example revolves
Regression and correlation. Correlation & Regression, I. Regression & correlation. Regression vs. correlation. Involve bivariate, paired data, X & Y
 Regression and correlation Correlation & Regression, I 9.07 4/1/004 Involve bivariate, paired data, X & Y Height & weight measured for the same individual IQ & exam scores for each individual Height of
Keller: Stats for Mgmt & Econ, 7th Ed July 17, 2006
 Chapter 17 Simple Linear Regression and Correlation 17.1 Regression Analysis Our problem objective is to analyze the relationship between interval variables; regression analysis is the first tool we will
Density Temp vs Ratio. temp
 Temp Ratio Density 0.00 0.02 0.04 0.06 0.08 0.10 0.12 Density 0.0 0.2 0.4 0.6 0.8 1.0 1. (a) 170 175 180 185 temp 1.0 1.5 2.0 2.5 3.0 ratio The histogram shows that the temperature measures have two peaks,
Chapter 16. Simple Linear Regression and dcorrelation
 Chapter 16 Simple Linear Regression and dcorrelation 16.1 Regression Analysis Our problem objective is to analyze the relationship between interval variables; regression analysis is the first tool we will
Warm-up Using the given data Create a scatterplot Find the regression line
 Time at the lunch table Caloric intake 21.4 472 30.8 498 37.7 335 32.8 423 39.5 437 22.8 508 34.1 431 33.9 479 43.8 454 42.4 450 43.1 410 29.2 504 31.3 437 28.6 489 32.9 436 30.6 480 35.1 439 33.0 444
Linear Regression with one Regressor
 1 Linear Regression with one Regressor Covering Chapters 4.1 and 4.2. We ve seen the California test score data before. Now we will try to estimate the marginal effect of STR on SCORE. To motivate these
MAT2377. Rafa l Kulik. Version 2015/November/26. Rafa l Kulik
 MAT2377 Rafa l Kulik Version 2015/November/26 Rafa l Kulik Bivariate data and scatterplot Data: Hydrocarbon level (x) and Oxygen level (y): x: 0.99, 1.02, 1.15, 1.29, 1.46, 1.36, 0.87, 1.23, 1.55, 1.40,
9. Linear Regression and Correlation
 9. Linear Regression and Correlation Data: y a quantitative response variable x a quantitative explanatory variable (Chap. 8: Recall that both variables were categorical) For example, y = annual income,
Chapter 16. Simple Linear Regression and Correlation
 Chapter 16 Simple Linear Regression and Correlation 16.1 Regression Analysis Our problem objective is to analyze the relationship between interval variables; regression analysis is the first tool we will
TABLES AND FORMULAS FOR MOORE Basic Practice of Statistics
 TABLES AND FORMULAS FOR MOORE Basic Practice of Statistics Exploring Data: Distributions Look for overall pattern (shape, center, spread) and deviations (outliers). Mean (use a calculator): x = x 1 + x
Prepared by: Prof. Dr Bahaman Abu Samah Department of Professional Development and Continuing Education Faculty of Educational Studies Universiti
 Prepared by: Prof Dr Bahaman Abu Samah Department of Professional Development and Continuing Education Faculty of Educational Studies Universiti Putra Malaysia Serdang M L Regression is an extension to
Chi-square tests. Unit 6: Simple Linear Regression Lecture 1: Introduction to SLR. Statistics 101. Poverty vs. HS graduate rate
 Review and Comments Chi-square tests Unit : Simple Linear Regression Lecture 1: Introduction to SLR Statistics 1 Monika Jingchen Hu June, 20 Chi-square test of GOF k χ 2 (O E) 2 = E i=1 where k = total
Correlation. We don't consider one variable independent and the other dependent. Does x go up as y goes up? Does x go down as y goes up?
 Comment: notes are adapted from BIOL 214/312. I. Correlation. Correlation A) Correlation is used when we want to examine the relationship of two continuous variables. We are not interested in prediction.
Chapter 14 Simple Linear Regression (A)
") Chapter 14 Simple Linear Regression (A) 1. Characteristics Managerial decisions often are based on the relationship between two or more variables. can be used to develop an equation showing how the variables
Chapter 14 Simple Linear Regression (A) 1. Characteristics Managerial decisions often are based on the relationship between two or more variables. can be used to develop an equation showing how the variables
Lectures on Simple Linear Regression Stat 431, Summer 2012
 Lectures on Simple Linear Regression Stat 43, Summer 0 Hyunseung Kang July 6-8, 0 Last Updated: July 8, 0 :59PM Introduction Previously, we have been investigating various properties of the population
Quoting from the document I suggested you read (http://courses.ttu.edu/isqs5349 westfall/images/5349/practiceproblems_discussion.
 Spring 14, ISQS 5349 Midterm 1. Instructions: Closed book, notes and no electronic devices. Put all answers on scratch paper provided. Points (out of 100) are in parentheses. 1. (20) Define regression
Business Statistics. Lecture 10: Course Review
 Business Statistics Lecture 10: Course Review 1 Descriptive Statistics for Continuous Data Numerical Summaries Location: mean, median Spread or variability: variance, standard deviation, range, percentiles,
Exam Applied Statistical Regression. Good Luck!
 Dr. M. Dettling Summer 2011 Exam Applied Statistical Regression Approved: Tables: Note: Any written material, calculator (without communication facility). Attached. All tests have to be done at the 5%-level.
Ecn Analysis of Economic Data University of California - Davis February 23, 2010 Instructor: John Parman. Midterm 2. Name: ID Number: Section:
 Ecn 102 - Analysis of Economic Data University of California - Davis February 23, 2010 Instructor: John Parman Midterm 2 You have until 10:20am to complete this exam. Please remember to put your name,
Statistics Introductory Correlation
 Statistics Introductory Correlation Session 10 oscardavid.barrerarodriguez@sciencespo.fr April 9, 2018 Outline 1 Statistics are not used only to describe central tendency and variability for a single variable.
Overview. Overview. Overview. Specific Examples. General Examples. Bivariate Regression & Correlation
 Bivariate Regression & Correlation Overview The Scatter Diagram Two Examples: Education & Prestige Correlation Coefficient Bivariate Linear Regression Line SPSS Output Interpretation Covariance ou already
Scatter plot of data from the study. Linear Regression
 1 2 Linear Regression Scatter plot of data from the study. Consider a study to relate birthweight to the estriol level of pregnant women. The data is below. i Weight (g / 100) i Weight (g / 100) 1 7 25
Announcements. Lecture 18: Simple Linear Regression. Poverty vs. HS graduate rate
 Announcements Announcements Lecture : Simple Linear Regression Statistics 1 Mine Çetinkaya-Rundel March 29, 2 Midterm 2 - same regrade request policy: On a separate sheet write up your request, describing
Regression, part II. I. What does it all mean? A) Notice that so far all we ve done is math.
 Notice that so far all we ve done is math.") Regression, part II I. What does it all mean? A) Notice that so far all we ve done is math. 1) One can calculate the Least Squares Regression Line for anything, regardless of any assumptions. 2) But, if
Regression, part II I. What does it all mean? A) Notice that so far all we ve done is math. 1) One can calculate the Least Squares Regression Line for anything, regardless of any assumptions. 2) But, if
STAT 512 MidTerm I (2/21/2013) Spring 2013 INSTRUCTIONS
 Spring 2013 INSTRUCTIONS") STAT 512 MidTerm I (2/21/2013) Spring 2013 Name: Key INSTRUCTIONS 1. This exam is open book/open notes. All papers (but no electronic devices except for calculators) are allowed. 2. There are 5 pages in
STAT 512 MidTerm I (2/21/2013) Spring 2013 Name: Key INSTRUCTIONS 1. This exam is open book/open notes. All papers (but no electronic devices except for calculators) are allowed. 2. There are 5 pages in
Correlation and Regression (Excel 2007)
") Correlation and Regression (Excel 2007) (See Also Scatterplots, Regression Lines, and Time Series Charts With Excel 2007 for instructions on making a scatterplot of the data and an alternate method of
Correlation and Regression (Excel 2007) (See Also Scatterplots, Regression Lines, and Time Series Charts With Excel 2007 for instructions on making a scatterplot of the data and an alternate method of
The linear model. Our models so far are linear. Change in Y due to change in X? See plots for: o age vs. ahe o carats vs.
 8 Nonlinear effects Lots of effects in economics are nonlinear Examples Deal with these in two (sort of three) ways: o Polynomials o Logarithms o Interaction terms (sort of) 1 The linear model Our models
STA 108 Applied Linear Models: Regression Analysis Spring Solution for Homework #6
 STA 8 Applied Linear Models: Regression Analysis Spring 011 Solution for Homework #6 6. a) = 11 1 31 41 51 1 3 4 5 11 1 31 41 51 β = β1 β β 3 b) = 1 1 1 1 1 11 1 31 41 51 1 3 4 5 β = β 0 β1 β 6.15 a) Stem-and-leaf
Nature vs. nurture? Lecture 18 - Regression: Inference, Outliers, and Intervals. Regression Output. Conditions for inference.
 Understanding regression output from software Nature vs. nurture? Lecture 18 - Regression: Inference, Outliers, and Intervals In 1966 Cyril Burt published a paper called The genetic determination of differences
determine whether or not this relationship is.
 Section 9-1 Correlation A correlation is a between two. The data can be represented by ordered pairs (x,y) where x is the (or ) variable and y is the (or ) variable. There are several types of correlations
INFERENCE FOR REGRESSION
 CHAPTER 3 INFERENCE FOR REGRESSION OVERVIEW In Chapter 5 of the textbook, we first encountered regression. The assumptions that describe the regression model we use in this chapter are the following. We
Final Exam. Name: Solution:
 Final Exam. Name: Instructions. Answer all questions on the exam. Open books, open notes, but no electronic devices. The first 13 problems are worth 5 points each. The rest are worth 1 point each. HW1.
AP Statistics Unit 6 Note Packet Linear Regression. Scatterplots and Correlation
 Scatterplots and Correlation Name Hr A scatterplot shows the relationship between two quantitative variables measured on the same individuals. variable (y) measures an outcome of a study variable (x) may
Problems. Suppose both models are fitted to the same data. Show that SS Res, A SS Res, B
 Simple Linear Regression 35 Problems 1 Consider a set of data (x i, y i ), i =1, 2,,n, and the following two regression models: y i = β 0 + β 1 x i + ε, (i =1, 2,,n), Model A y i = γ 0 + γ 1 x i + γ 2
ST430 Exam 1 with Answers
 ST430 Exam 1 with Answers Date: October 5, 2015 Name: Guideline: You may use one-page (front and back of a standard A4 paper) of notes. No laptop or textook are permitted but you may use a calculator.
28. SIMPLE LINEAR REGRESSION III
 28. SIMPLE LINEAR REGRESSION III Fitted Values and Residuals To each observed x i, there corresponds a y-value on the fitted line, y = βˆ + βˆ x. The are called fitted values. ŷ i They are the values of
Correlation 1. December 4, HMS, 2017, v1.1
 Correlation 1 December 4, 2017 1 HMS, 2017, v1.1 Chapter References Diez: Chapter 7 Navidi, Chapter 7 I don t expect you to learn the proofs what will follow. Chapter References 2 Correlation The sample
Lecture 11: Simple Linear Regression
 Lecture 11: Simple Linear Regression Readings: Sections 3.1-3.3, 11.1-11.3 Apr 17, 2009 In linear regression, we examine the association between two quantitative variables. Number of beers that you drink
2 Regression Analysis
 FORK 1002 Preparatory Course in Statistics: 2 Regression Analysis Genaro Sucarrat (BI) http://www.sucarrat.net/ Contents: 1 Bivariate Correlation Analysis 2 Simple Regression 3 Estimation and Fit 4 T -Test:
Inference for Regression Inference about the Regression Model and Using the Regression Line, with Details. Section 10.1, 2, 3
 Inference for Regression Inference about the Regression Model and Using the Regression Line, with Details Section 10.1, 2, 3 Basic components of regression setup Target of inference: linear dependency
Lecture 3. The Population Variance. The population variance, denoted σ 2, is the sum. of the squared deviations about the population
 Lecture 5 1 Lecture 3 The Population Variance The population variance, denoted σ 2, is the sum of the squared deviations about the population mean divided by the number of observations in the population,
Question Possible Points Score Total 100
 Midterm I NAME: Instructions: 1. For hypothesis testing, the significant level is set at α = 0.05. 2. This exam is open book. You may use textbooks, notebooks, and a calculator. 3. Do all your work in
Scatter plot of data from the study. Linear Regression
 1 2 Linear Regression Scatter plot of data from the study. Consider a study to relate birthweight to the estriol level of pregnant women. The data is below. i Weight (g / 100) i Weight (g / 100) 1 7 25
7. Do not estimate values for y using x-values outside the limits of the data given. This is called extrapolation and is not reliable.
 AP Statistics 15 Inference for Regression I. Regression Review a. r à correlation coefficient or Pearson s coefficient: indicates strength and direction of the relationship between the explanatory variables
Chapter 12 : Linear Correlation and Linear Regression
 Chapter 1 : Linear Correlation and Linear Regression Determining whether a linear relationship exists between two quantitative variables, and modeling the relationship with a line, if the linear relationship
6.0 Lesson Plan. Answer Questions. Regression. Transformation. Extrapolation. Residuals
 6.0 Lesson Plan Answer Questions Regression Transformation Extrapolation Residuals 1 Information about TAs Lab grader: Pontus, npl@duke.edu Hwk grader: Rachel, rmt6@duke.edu Quiz (Tuesday): Matt, matthew.campbell@duke.edu
y n 1 ( x i x )( y y i n 1 i y 2
( y y i n 1 i y 2") STP3 Brief Class Notes Instructor: Ela Jackiewicz Chapter Regression and Correlation In this chapter we will explore the relationship between two quantitative variables, X an Y. We will consider n ordered
STP3 Brief Class Notes Instructor: Ela Jackiewicz Chapter Regression and Correlation In this chapter we will explore the relationship between two quantitative variables, X an Y. We will consider n ordered
MS&E 226: Small Data
 MS&E 226: Small Data Lecture 15: Examples of hypothesis tests (v5) Ramesh Johari ramesh.johari@stanford.edu 1 / 32 The recipe 2 / 32 The hypothesis testing recipe In this lecture we repeatedly apply the
HOMEWORK (due Wed, Jan 23): Chapter 3: #42, 48, 74
: Chapter 3: #42, 48, 74") ANNOUNCEMENTS: Grades available on eee for Week 1 clickers, Quiz and Discussion. If your clicker grade is missing, check next week before contacting me. If any other grades are missing let me know now.
ANNOUNCEMENTS: Grades available on eee for Week 1 clickers, Quiz and Discussion. If your clicker grade is missing, check next week before contacting me. If any other grades are missing let me know now.
7.2 One-Sample Correlation ( = a) Introduction. Correlation analysis measures the strength and direction of association between
 Introduction. Correlation analysis measures the strength and direction of association between") 7.2 One-Sample Correlation ( = a) Introduction Correlation analysis measures the strength and direction of association between variables. In this chapter we will test whether the population correlation
7.2 One-Sample Correlation ( = a) Introduction Correlation analysis measures the strength and direction of association between variables. In this chapter we will test whether the population correlation
Ordinary Least Squares Regression Explained: Vartanian
 Ordinary Least Squares Regression Explained: Vartanian When to Use Ordinary Least Squares Regression Analysis A. Variable types. When you have an interval/ratio scale dependent variable.. When your independent
Inference for the Regression Coefficient
 Inference for the Regression Coefficient Recall, b 0 and b 1 are the estimates of the slope β 1 and intercept β 0 of population regression line. We can shows that b 0 and b 1 are the unbiased estimates
ISQS 5349 Final Exam, Spring 2017.
 ISQS 5349 Final Exam, Spring 7. Instructions: Put all answers on paper other than this exam. If you do not have paper, some will be provided to you. The exam is OPEN BOOKS, OPEN NOTES, but NO ELECTRONIC
Data Science for Engineers Department of Computer Science and Engineering Indian Institute of Technology, Madras
 Data Science for Engineers Department of Computer Science and Engineering Indian Institute of Technology, Madras Lecture 36 Simple Linear Regression Model Assessment So, welcome to the second lecture on
Simple and Multiple Linear Regression
 Sta. 113 Chapter 12 and 13 of Devore March 12, 2010 Table of contents 1 Simple Linear Regression 2 Model Simple Linear Regression A simple linear regression model is given by Y = β 0 + β 1 x + ɛ where
Correlation. What Is Correlation? Why Correlations Are Used
 Correlation 1 What Is Correlation? Correlation is a numerical value that describes and measures three characteristics of the relationship between two variables, X and Y The direction of the relationship
Simple Linear Regression
 Simple Linear Regression ST 370 Regression models are used to study the relationship of a response variable and one or more predictors. The response is also called the dependent variable, and the predictors
Regression Analysis: Exploring relationships between variables. Stat 251
 Regression Analysis: Exploring relationships between variables Stat 251 Introduction Objective of regression analysis is to explore the relationship between two (or more) variables so that information