Statistics 5100 Spring 2018 Exam 1
|
|
|
- Sheena Perry
- 5 years ago
- Views:
Transcription
1 Statistics 5100 Spring 2018 Exam 1 Directions: You have 60 minutes to complete the exam. Be sure to answer every question, and do not spend too much time on any part of any question. Be concise with all your responses. Partial SAS output and statistical tables are found in an accompanying handout. The point value of each question is given, and the points sum to 100. Good luck! (Q1) (1 point) What is your name? Possibly useful formulas for this exam: b1 = Corr(X,Y) SDY / SDX b0 = Y b 1 X ei = Y i Y i conf/pred interval: Estimate ± (Critical Value) (Standard Error of Estimate) regression equation: Y i = β 0 + β 1 X i1 + β 2 X i2 + + β p 1 X i,p 1 + ε i (SSE reduced SSE full ) F p q = SSE full n p o p = # β s in full model (incl. intercept) o q = # β s in reduced model (incl. intercept) o n = sample size SSR(U V) = SSE(V) SSE(U, V) R 2 = SS model = 1 SSE SS total SS total 2 R adj = 1 n 1 SSE, where p = # predictors in model n p SS total Data: This exam uses a single data set involving intelligence quotient (IQ). Data were collected on 38 students at a certain university. The relevant variables are summarized in the table below. Of interest is how the other variables could be used to predict IQ. Variable Description IQ Full-scale IQ, from Wechsler subtests Sex 0=Female, 1=Male BrainSize Total pixel count (in 1000 s) of brain in MRI scans Weight Body weight, in pounds Height Body height, in inches
2 (Q2) IQ is regressed on Weight, Height, and BrainSize; see the partial output from PROC REG in SAS Output 1. (a) (7 points) What percentage of the variability in IQ can be explained by its linear relationship with Weight, Height, and BrainSize? (b) (12 points) Give an appropriate interpretation of the number , which is bolded and underlined in the last line of the Parameter Estimates table. (c) (10 points) Give an appropriate interpretation of the number , which is also bolded and underlined in the same table. (Note that you are not asked what you would do with this number, or what you might conclude from it, but what does the value of the number itself represent?) (d) (8 points) Comment briefly on what the graphical diagnostics in this output suggest about two model assumptions regarding error term distribution. For both assumptions, specify (i) the assumption, (ii) the name of the graphical diagnostic, and (iii) what the diagnostic suggests about the assumption here. 1: 2: (i) (iii) (i) (iii) (ii) (ii)
3 (Q3) (8 points) SAS Output 2 reports some numerical diagnostics on the residuals from the model fit in SAS Output 1. For the same two assumptions you referred to in part (d) of Q2 above, specify (i) the name of the numerical diagnostic, (ii) the value of the threshold against which you compare its results (i.e., when would it be significant), and (iii) what the diagnostic suggests about the assumption here. 1: (i) (iii) (ii) 2: (i) (iii) (ii) (Q4) A researcher wonders whether the effect of BrainSize on IQ is the same for both men and women. (See SAS Output 3, where the plotting symbol is Sex.) (a) (6 points) Write out the linear regression model (in terms of β's and the variable names) to address this question. (b) (1 points) Based on this model, write (but do not test) the appropriate null hypothesis to test the researcher's question. (Q5) A researcher wonders whether the average IQ is different for men and women (see SAS Output 4 ). One could use a t-test or ANOVA model to consider this potential difference. Instead, the researcher also wants to also control for possible effects of the factors Weight, Height, and BrainSize (see SAS Output 5 ), but no interactions. (a) (6 points) Write out the linear regression model (in terms of β's and the variable names) to address this question (including controlling for these other factors). (b) (1 point) Based on this model, write (but do not test) the appropriate null hypothesis to test the researcher's question.
4 (Q6) SAS Output 6 has evidence that multicollinearity is not problematic in the model fit there. For one diagnostic method to assess multicollinearity, identify the following: (a) (1 point) The name of the diagnostic method (b) (4 points) The numeric rule (or threshold) the method uses for determining multicollinearity (i.e., when would multicollinearity be called problematic?) (c) (4 points) How the output in SAS Output 6 compares to this numeric rule (or threshold) (Q7) A researcher regresses IQ on BrainSize, Sex, and the interaction term BrainSize*Sex. Assume that she has verified that model assumptions are met. She reports 90% interval estimates for male IQ when BrainSize is 1000, and partial results are given below. (There is no other output needed to answer these questions.) Interval Type Left Endpoint Right Endpoint Confidence Prediction (a) (6 points) What is the correct interpretation of the confidence interval? (b) (6 points) What is the point estimate of male IQ when BrainSize is 1000?
5 (Q8) [This collection of questions does not involve any data or output.] Consider a multiple linear regression model where Y is regressed on X1, X2, and X3. (a) (6 points) When asked to state the multiple linear regression model, a student wrote the model below. Do you agree? Why or why not? E[Y i ] = β 0 + β 1 X i1 + β 2 X i2 + β 3 X i3 + ε i (b) (6 points) Suppose there is multicollinearity involving X1 and X3. State clearly what this means. (You are not asked how you would check for it.) (c) (6 points) Suppose there is interaction involving X1 and X3. State clearly what this means. (You are not asked how you would check for it.) (Q9) (1 point) What topic(s) did you study most but that did not appear on this exam?
6 Output and Tables for Spring 2018 STAT 5100 Exam 1 SAS Output 1 The REG Procedure Dependent Variable: IQ Number of Observations Read 38 Number of Observations Used 38 Analysis of Variance Source DF Sum of Squares Mean Square F Value Pr > F Model Error Corrected Total Parameter Estimates Variable DF Parameter Estimate Standard Error t Value Pr > t Intercept Weight Height BrainSize (SAS Output 1 continues)
7 SAS Output 1, continued
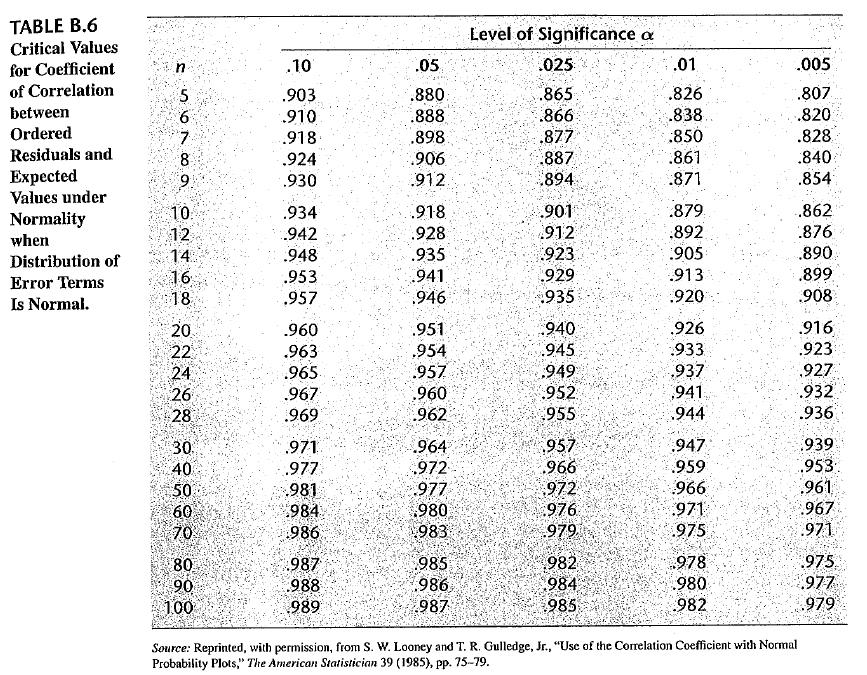
8 SAS Output 2 P-value for Brown-Forsythe test of constant variance in residual vs. predicted Obs t_bf BF_pvalue Output for correlation test of normality of residual (Check text Table B.6 for threshold) The CORR Procedure 2 Variables: resid expectnorm Simple Statistics Variable N Mean Std Dev Sum Minimum Maximum Label resid residual expectnorm Pearson Correlation Coefficients, N = 38 Prob > r under H0: Rho=0 resid expectnorm resid residual <.0001 expectnorm <.0001
9 SAS Output 4
10
11 SAS Output 6 The REG Procedure Model: MODEL1 Dependent Variable: IQ Analysis of Variance Source DF Sum of Squares Mean Square F Value Pr > F Model Error Corrected Total Parameter Estimates Variable DF Parameter Estimate Standard Error t Value Pr > t Variance Inflation Intercept Weight Height BrainSize Collinearity Diagnostics Number Eigenvalue Condition Index Proportion of Variation Intercept Weight Height BrainSize
12
Possibly useful formulas for this exam: b1 = Corr(X,Y) SDY / SDX. confidence interval: Estimate ± (Critical Value) (Standard Error of Estimate)
 SDY / SDX. confidence interval: Estimate ± (Critical Value) (Standard Error of Estimate)") Statistics 5100 Exam 2 (Practice) Directions: Be sure to answer every question, and do not spend too much time on any part of any question. Be concise with all your responses. Partial SAS output and statistical
Statistics 5100 Exam 2 (Practice) Directions: Be sure to answer every question, and do not spend too much time on any part of any question. Be concise with all your responses. Partial SAS output and statistical
General Linear Model (Chapter 4)
") General Linear Model (Chapter 4) Outcome variable is considered continuous Simple linear regression Scatterplots OLS is BLUE under basic assumptions MSE estimates residual variance testing regression coefficients
General Linear Model (Chapter 4) Outcome variable is considered continuous Simple linear regression Scatterplots OLS is BLUE under basic assumptions MSE estimates residual variance testing regression coefficients
Multicollinearity Exercise
 Multicollinearity Exercise Use the attached SAS output to answer the questions. [OPTIONAL: Copy the SAS program below into the SAS editor window and run it.] You do not need to submit any output, so there
Lecture 11 Multiple Linear Regression
 Lecture 11 Multiple Linear Regression STAT 512 Spring 2011 Background Reading KNNL: 6.1-6.5 11-1 Topic Overview Review: Multiple Linear Regression (MLR) Computer Science Case Study 11-2 Multiple Regression
Lecture 3: Inference in SLR
 Lecture 3: Inference in SLR STAT 51 Spring 011 Background Reading KNNL:.1.6 3-1 Topic Overview This topic will cover: Review of hypothesis testing Inference about 1 Inference about 0 Confidence Intervals
STAT 512 MidTerm I (2/21/2013) Spring 2013 INSTRUCTIONS
 Spring 2013 INSTRUCTIONS") STAT 512 MidTerm I (2/21/2013) Spring 2013 Name: Key INSTRUCTIONS 1. This exam is open book/open notes. All papers (but no electronic devices except for calculators) are allowed. 2. There are 5 pages in
STAT 512 MidTerm I (2/21/2013) Spring 2013 Name: Key INSTRUCTIONS 1. This exam is open book/open notes. All papers (but no electronic devices except for calculators) are allowed. 2. There are 5 pages in
Inferences for Regression
 Inferences for Regression An Example: Body Fat and Waist Size Looking at the relationship between % body fat and waist size (in inches). Here is a scatterplot of our data set: Remembering Regression In
Lecture 10 Multiple Linear Regression
 Lecture 10 Multiple Linear Regression STAT 512 Spring 2011 Background Reading KNNL: 6.1-6.5 10-1 Topic Overview Multiple Linear Regression Model 10-2 Data for Multiple Regression Y i is the response variable
Stat 500 Midterm 2 12 November 2009 page 0 of 11
 Stat 500 Midterm 2 12 November 2009 page 0 of 11 Please put your name on the back of your answer book. Do NOT put it on the front. Thanks. Do not start until I tell you to. The exam is closed book, closed
Simple Linear Regression: One Quantitative IV
 Simple Linear Regression: One Quantitative IV Linear regression is frequently used to explain variation observed in a dependent variable (DV) with theoretically linked independent variables (IV). For example,
Simple Linear Regression: One Qualitative IV
 Simple Linear Regression: One Qualitative IV 1. Purpose As noted before regression is used both to explain and predict variation in DVs, and adding to the equation categorical variables extends regression
STA 302 H1F / 1001 HF Fall 2007 Test 1 October 24, 2007
 STA 302 H1F / 1001 HF Fall 2007 Test 1 October 24, 2007 LAST NAME: SOLUTIONS FIRST NAME: STUDENT NUMBER: ENROLLED IN: (circle one) STA 302 STA 1001 INSTRUCTIONS: Time: 90 minutes Aids allowed: calculator.
COMPREHENSIVE WRITTEN EXAMINATION, PAPER III FRIDAY AUGUST 26, 2005, 9:00 A.M. 1:00 P.M. STATISTICS 174 QUESTION
 COMPREHENSIVE WRITTEN EXAMINATION, PAPER III FRIDAY AUGUST 26, 2005, 9:00 A.M. 1:00 P.M. STATISTICS 174 QUESTION Answer all parts. Closed book, calculators allowed. It is important to show all working,
This document contains 3 sets of practice problems.
 P RACTICE PROBLEMS This document contains 3 sets of practice problems. Correlation: 3 problems Regression: 4 problems ANOVA: 8 problems You should print a copy of these practice problems and bring them
3 Variables: Cyberloafing Conscientiousness Age
 title 'Cyberloafing, Mike Sage'; run; PROC CORR data=sage; var Cyberloafing Conscientiousness Age; run; quit; The CORR Procedure 3 Variables: Cyberloafing Conscientiousness Age Simple Statistics Variable
Booklet of Code and Output for STAC32 Final Exam
 Booklet of Code and Output for STAC32 Final Exam December 7, 2017 Figure captions are below the Figures they refer to. LowCalorie LowFat LowCarbo Control 8 2 3 2 9 4 5 2 6 3 4-1 7 5 2 0 3 1 3 3 Figure
A discussion on multiple regression models
 A discussion on multiple regression models In our previous discussion of simple linear regression, we focused on a model in which one independent or explanatory variable X was used to predict the value
using the beginning of all regression models
 Estimating using the beginning of all regression models 3 examples Note about shorthand Cavendish's 29 measurements of the earth's density Heights (inches) of 14 11 year-old males from Alberta study Half-life
a. The least squares estimators of intercept and slope are (from JMP output): b 0 = 6.25 b 1 =
: b 0 = 6.25 b 1 =") Stat 28 Fall 2004 Key to Homework Exercise.10 a. There is evidence of a linear trend: winning times appear to decrease with year. A straight-line model for predicting winning times based on year is: Winning
Stat 28 Fall 2004 Key to Homework Exercise.10 a. There is evidence of a linear trend: winning times appear to decrease with year. A straight-line model for predicting winning times based on year is: Winning
Lecture 11: Simple Linear Regression
 Lecture 11: Simple Linear Regression Readings: Sections 3.1-3.3, 11.1-11.3 Apr 17, 2009 In linear regression, we examine the association between two quantitative variables. Number of beers that you drink
STATISTICS 110/201 PRACTICE FINAL EXAM
 STATISTICS 110/201 PRACTICE FINAL EXAM Questions 1 to 5: There is a downloadable Stata package that produces sequential sums of squares for regression. In other words, the SS is built up as each variable
ST430 Exam 2 Solutions
 ST430 Exam 2 Solutions Date: November 9, 2015 Name: Guideline: You may use one-page (front and back of a standard A4 paper) of notes. No laptop or textbook are permitted but you may use a calculator. Giving
Multiple Regression Examples
 Multiple Regression Examples Example: Tree data. we have seen that a simple linear regression of usable volume on diameter at chest height is not suitable, but that a quadratic model y = β 0 + β 1 x +
Math 3330: Solution to midterm Exam
 Math 3330: Solution to midterm Exam Question 1: (14 marks) Suppose the regression model is y i = β 0 + β 1 x i + ε i, i = 1,, n, where ε i are iid Normal distribution N(0, σ 2 ). a. (2 marks) Compute the
1. The shoe size of five randomly selected men in the class is 7, 7.5, 6, 6.5 the shoe size of 4 randomly selected women is 6, 5.
 Economics 3 Introduction to Econometrics Winter 2004 Professor Dobkin Name Final Exam (Sample) You must answer all the questions. The exam is closed book and closed notes you may use calculators. You must
Correlation and the Analysis of Variance Approach to Simple Linear Regression
 Correlation and the Analysis of Variance Approach to Simple Linear Regression Biometry 755 Spring 2009 Correlation and the Analysis of Variance Approach to Simple Linear Regression p. 1/35 Correlation
STAT 350 Final (new Material) Review Problems Key Spring 2016
 Review Problems Key Spring 2016") 1. The editor of a statistics textbook would like to plan for the next edition. A key variable is the number of pages that will be in the final version. Text files are prepared by the authors using LaTeX,
1. The editor of a statistics textbook would like to plan for the next edition. A key variable is the number of pages that will be in the final version. Text files are prepared by the authors using LaTeX,
Chapter 8 Quantitative and Qualitative Predictors
 STAT 525 FALL 2017 Chapter 8 Quantitative and Qualitative Predictors Professor Dabao Zhang Polynomial Regression Multiple regression using X 2 i, X3 i, etc as additional predictors Generates quadratic,
Lecture notes on Regression & SAS example demonstration
 Regression & Correlation (p. 215) When two variables are measured on a single experimental unit, the resulting data are called bivariate data. You can describe each variable individually, and you can also
EXST Regression Techniques Page 1. We can also test the hypothesis H :" œ 0 versus H :"
 EXST704 - Regression Techniques Page 1 Using F tests instead of t-tests We can also test the hypothesis H :" œ 0 versus H :" Á 0 with an F test.! " " " F œ MSRegression MSError This test is mathematically
1 A Review of Correlation and Regression
 1 A Review of Correlation and Regression SW, Chapter 12 Suppose we select n = 10 persons from the population of college seniors who plan to take the MCAT exam. Each takes the test, is coached, and then
Linear models Analysis of Covariance
 Esben Budtz-Jørgensen April 22, 2008 Linear models Analysis of Covariance Confounding Interactions Parameterizations Analysis of Covariance group comparisons can become biased if an important predictor
STAT 350: Summer Semester Midterm 1: Solutions
 Name: Student Number: STAT 350: Summer Semester 2008 Midterm 1: Solutions 9 June 2008 Instructor: Richard Lockhart Instructions: This is an open book test. You may use notes, text, other books and a calculator.
Failure Time of System due to the Hot Electron Effect
 of System due to the Hot Electron Effect 1 * exresist; 2 option ls=120 ps=75 nocenter nodate; 3 title of System due to the Hot Electron Effect ; 4 * TIME = failure time (hours) of a system due to drift
Data Analysis 1 LINEAR REGRESSION. Chapter 03
 Data Analysis 1 LINEAR REGRESSION Chapter 03 Data Analysis 2 Outline The Linear Regression Model Least Squares Fit Measures of Fit Inference in Regression Other Considerations in Regression Model Qualitative
Unit 6 - Introduction to linear regression
 Unit 6 - Introduction to linear regression Suggested reading: OpenIntro Statistics, Chapter 7 Suggested exercises: Part 1 - Relationship between two numerical variables: 7.7, 7.9, 7.11, 7.13, 7.15, 7.25,
171:162 Design and Analysis of Biomedical Studies, Summer 2011 Exam #3, July 16th
 Name 171:162 Design and Analysis of Biomedical Studies, Summer 2011 Exam #3, July 16th Use the selected SAS output to help you answer the questions. The SAS output is all at the back of the exam on pages
Linear models Analysis of Covariance
 Esben Budtz-Jørgensen November 20, 2007 Linear models Analysis of Covariance Confounding Interactions Parameterizations Analysis of Covariance group comparisons can become biased if an important predictor
Topic 18: Model Selection and Diagnostics
 Topic 18: Model Selection and Diagnostics Variable Selection We want to choose a best model that is a subset of the available explanatory variables Two separate problems 1. How many explanatory variables
An Analysis of College Algebra Exam Scores December 14, James D Jones Math Section 01
 An Analysis of College Algebra Exam s December, 000 James D Jones Math - Section 0 An Analysis of College Algebra Exam s Introduction Students often complain about a test being too difficult. Are there
Sociology Exam 2 Answer Key March 30, 2012
 Sociology 63993 Exam 2 Answer Key March 30, 2012 I. True-False. (20 points) Indicate whether the following statements are true or false. If false, briefly explain why. 1. A researcher has constructed scales
Lecture 1 Linear Regression with One Predictor Variable.p2
 Lecture Linear Regression with One Predictor Variablep - Basics - Meaning of regression parameters p - β - the slope of the regression line -it indicates the change in mean of the probability distn of
1) Answer the following questions as true (T) or false (F) by circling the appropriate letter.
 Answer the following questions as true (T) or false (F) by circling the appropriate letter.") 1) Answer the following questions as true (T) or false (F) by circling the appropriate letter. T F T F T F a) Variance estimates should always be positive, but covariance estimates can be either positive
1) Answer the following questions as true (T) or false (F) by circling the appropriate letter. T F T F T F a) Variance estimates should always be positive, but covariance estimates can be either positive
x3,..., Multiple Regression β q α, β 1, β 2, β 3,..., β q in the model can all be estimated by least square estimators
 Multiple Regression Relating a response (dependent, input) y to a set of explanatory (independent, output, predictor) variables x, x 2, x 3,, x q. A technique for modeling the relationship between variables.
Lecture 18 Miscellaneous Topics in Multiple Regression
 Lecture 18 Miscellaneous Topics in Multiple Regression STAT 512 Spring 2011 Background Reading KNNL: 8.1-8.5,10.1, 11, 12 18-1 Topic Overview Polynomial Models (8.1) Interaction Models (8.2) Qualitative
Chapter 2 Inferences in Simple Linear Regression
 STAT 525 SPRING 2018 Chapter 2 Inferences in Simple Linear Regression Professor Min Zhang Testing for Linear Relationship Term β 1 X i defines linear relationship Will then test H 0 : β 1 = 0 Test requires
y response variable x 1, x 2,, x k -- a set of explanatory variables
 11. Multiple Regression and Correlation y response variable x 1, x 2,, x k -- a set of explanatory variables In this chapter, all variables are assumed to be quantitative. Chapters 12-14 show how to incorporate
Unit 6 - Simple linear regression
 Sta 101: Data Analysis and Statistical Inference Dr. Çetinkaya-Rundel Unit 6 - Simple linear regression LO 1. Define the explanatory variable as the independent variable (predictor), and the response variable
ST Correlation and Regression
 Chapter 5 ST 370 - Correlation and Regression Readings: Chapter 11.1-11.4, 11.7.2-11.8, Chapter 12.1-12.2 Recap: So far we ve learned: Why we want a random sample and how to achieve it (Sampling Scheme)
SPSS Output. ANOVA a b Residual Coefficients a Standardized Coefficients
 SPSS Output Homework 1-1e ANOVA a Sum of Squares df Mean Square F Sig. 1 Regression 351.056 1 351.056 11.295.002 b Residual 932.412 30 31.080 Total 1283.469 31 a. Dependent Variable: Sexual Harassment
df=degrees of freedom = n - 1
 One sample t-test test of the mean Assumptions: Independent, random samples Approximately normal distribution (from intro class: σ is unknown, need to calculate and use s (sample standard deviation)) Hypotheses:
Data Analyses in Multivariate Regression Chii-Dean Joey Lin, SDSU, San Diego, CA
 Data Analyses in Multivariate Regression Chii-Dean Joey Lin, SDSU, San Diego, CA ABSTRACT Regression analysis is one of the most used statistical methodologies. It can be used to describe or predict causal
1 Multiple Regression
 1 Multiple Regression In this section, we extend the linear model to the case of several quantitative explanatory variables. There are many issues involved in this problem and this section serves only
MATH ASSIGNMENT 2: SOLUTIONS
 MATH 204 - ASSIGNMENT 2: SOLUTIONS (a) Fitting the simple linear regression model to each of the variables in turn yields the following results: we look at t-tests for the individual coefficients, and
Correlation and Simple Linear Regression
 Correlation and Simple Linear Regression Sasivimol Rattanasiri, Ph.D Section for Clinical Epidemiology and Biostatistics Ramathibodi Hospital, Mahidol University E-mail: sasivimol.rat@mahidol.ac.th 1 Outline
Overview Scatter Plot Example
 Overview Topic 22 - Linear Regression and Correlation STAT 5 Professor Bruce Craig Consider one population but two variables For each sampling unit observe X and Y Assume linear relationship between variables
Chapter 6 Multiple Regression
 STAT 525 FALL 2018 Chapter 6 Multiple Regression Professor Min Zhang The Data and Model Still have single response variable Y Now have multiple explanatory variables Examples: Blood Pressure vs Age, Weight,
Stat 302 Statistical Software and Its Applications SAS: Simple Linear Regression
 1 Stat 302 Statistical Software and Its Applications SAS: Simple Linear Regression Fritz Scholz Department of Statistics, University of Washington Winter Quarter 2015 February 16, 2015 2 The Spirit of
Topic 20: Single Factor Analysis of Variance
 Topic 20: Single Factor Analysis of Variance Outline Single factor Analysis of Variance One set of treatments Cell means model Factor effects model Link to linear regression using indicator explanatory
ECON 497 Midterm Spring
 ECON 497 Midterm Spring 2009 1 ECON 497: Economic Research and Forecasting Name: Spring 2009 Bellas Midterm You have three hours and twenty minutes to complete this exam. Answer all questions and explain
Topic 28: Unequal Replication in Two-Way ANOVA
 Topic 28: Unequal Replication in Two-Way ANOVA Outline Two-way ANOVA with unequal numbers of observations in the cells Data and model Regression approach Parameter estimates Previous analyses with constant
PubH 7405: REGRESSION ANALYSIS SLR: DIAGNOSTICS & REMEDIES
 PubH 7405: REGRESSION ANALYSIS SLR: DIAGNOSTICS & REMEDIES Normal Error RegressionModel : Y = β 0 + β ε N(0,σ 2 1 x ) + ε The Model has several parts: Normal Distribution, Linear Mean, Constant Variance,
Correlation Analysis
 Simple Regression Correlation Analysis Correlation analysis is used to measure strength of the association (linear relationship) between two variables Correlation is only concerned with strength of the
In Class Review Exercises Vartanian: SW 540
 In Class Review Exercises Vartanian: SW 540 1. Given the following output from an OLS model looking at income, what is the slope and intercept for those who are black and those who are not black? b SE
ST 512-Practice Exam I - Osborne Directions: Answer questions as directed. For true/false questions, circle either true or false.
 ST 512-Practice Exam I - Osborne Directions: Answer questions as directed. For true/false questions, circle either true or false. 1. A study was carried out to examine the relationship between the number
Outline. Review regression diagnostics Remedial measures Weighted regression Ridge regression Robust regression Bootstrapping
 Topic 19: Remedies Outline Review regression diagnostics Remedial measures Weighted regression Ridge regression Robust regression Bootstrapping Regression Diagnostics Summary Check normality of the residuals
Group Comparisons: Differences in Composition Versus Differences in Models and Effects
 Group Comparisons: Differences in Composition Versus Differences in Models and Effects Richard Williams, University of Notre Dame, https://www3.nd.edu/~rwilliam/ Last revised February 15, 2015 Overview.
ST505/S697R: Fall Homework 2 Solution.
 ST505/S69R: Fall 2012. Homework 2 Solution. 1. 1a; problem 1.22 Below is the summary information (edited) from the regression (using R output); code at end of solution as is code and output for SAS. a)
Table 1: Fish Biomass data set on 26 streams
 Math 221: Multiple Regression S. K. Hyde Chapter 27 (Moore, 5th Ed.) The following data set contains observations on the fish biomass of 26 streams. The potential regressors from which we wish to explain
14 Multiple Linear Regression
 B.Sc./Cert./M.Sc. Qualif. - Statistics: Theory and Practice 14 Multiple Linear Regression 14.1 The multiple linear regression model In simple linear regression, the response variable y is expressed in
Unit 11: Multiple Linear Regression
 Unit 11: Multiple Linear Regression Statistics 571: Statistical Methods Ramón V. León 7/13/2004 Unit 11 - Stat 571 - Ramón V. León 1 Main Application of Multiple Regression Isolating the effect of a variable
9 Correlation and Regression
 9 Correlation and Regression SW, Chapter 12. Suppose we select n = 10 persons from the population of college seniors who plan to take the MCAT exam. Each takes the test, is coached, and then retakes the
Lecture 3: Multiple Regression. Prof. Sharyn O Halloran Sustainable Development U9611 Econometrics II
 Lecture 3: Multiple Regression Prof. Sharyn O Halloran Sustainable Development Econometrics II Outline Basics of Multiple Regression Dummy Variables Interactive terms Curvilinear models Review Strategies
Paper: ST-161. Techniques for Evidence-Based Decision Making Using SAS Ian Stockwell, The Hilltop UMBC, Baltimore, MD
 Paper: ST-161 Techniques for Evidence-Based Decision Making Using SAS Ian Stockwell, The Hilltop Institute @ UMBC, Baltimore, MD ABSTRACT SAS has many tools that can be used for data analysis. From Freqs
PART I. (a) Describe all the assumptions for a normal error regression model with one predictor variable,
 Describe all the assumptions for a normal error regression model with one predictor variable,") Concordia University Department of Mathematics and Statistics Course Number Section Statistics 360/2 01 Examination Date Time Pages Final December 2002 3 hours 6 Instructors Course Examiner Marks Y.P.
Concordia University Department of Mathematics and Statistics Course Number Section Statistics 360/2 01 Examination Date Time Pages Final December 2002 3 hours 6 Instructors Course Examiner Marks Y.P.
Chapter 4. Regression Models. Learning Objectives
 Chapter 4 Regression Models To accompany Quantitative Analysis for Management, Eleventh Edition, by Render, Stair, and Hanna Power Point slides created by Brian Peterson Learning Objectives After completing
One-Way ANOVA. Some examples of when ANOVA would be appropriate include:
 One-Way ANOVA 1. Purpose Analysis of variance (ANOVA) is used when one wishes to determine whether two or more groups (e.g., classes A, B, and C) differ on some outcome of interest (e.g., an achievement
Ch 2: Simple Linear Regression
 Ch 2: Simple Linear Regression 1. Simple Linear Regression Model A simple regression model with a single regressor x is y = β 0 + β 1 x + ɛ, where we assume that the error ɛ is independent random component
ECON 4230 Intermediate Econometric Theory Exam
 ECON 4230 Intermediate Econometric Theory Exam Multiple Choice (20 pts). Circle the best answer. 1. The Classical assumption of mean zero errors is satisfied if the regression model a) is linear in the
Chapter 14 Student Lecture Notes Department of Quantitative Methods & Information Systems. Business Statistics. Chapter 14 Multiple Regression
 Chapter 14 Student Lecture Notes 14-1 Department of Quantitative Methods & Information Systems Business Statistics Chapter 14 Multiple Regression QMIS 0 Dr. Mohammad Zainal Chapter Goals After completing
ST430 Exam 1 with Answers
 ST430 Exam 1 with Answers Date: October 5, 2015 Name: Guideline: You may use one-page (front and back of a standard A4 paper) of notes. No laptop or textook are permitted but you may use a calculator.
MATH 644: Regression Analysis Methods
 MATH 644: Regression Analysis Methods FINAL EXAM Fall, 2012 INSTRUCTIONS TO STUDENTS: 1. This test contains SIX questions. It comprises ELEVEN printed pages. 2. Answer ALL questions for a total of 100
SPECIAL TOPICS IN REGRESSION ANALYSIS
 1 SPECIAL TOPICS IN REGRESSION ANALYSIS Representing Nominal Scales in Regression Analysis There are several ways in which a set of G qualitative distinctions on some variable of interest can be represented
CHAPTER 4 & 5 Linear Regression with One Regressor. Kazu Matsuda IBEC PHBU 430 Econometrics
 CHAPTER 4 & 5 Linear Regression with One Regressor Kazu Matsuda IBEC PHBU 430 Econometrics Introduction Simple linear regression model = Linear model with one independent variable. y = dependent variable
Chapter 12 - Lecture 2 Inferences about regression coefficient
 Chapter 12 - Lecture 2 Inferences about regression coefficient April 19th, 2010 Facts about slope Test Statistic Confidence interval Hypothesis testing Test using ANOVA Table Facts about slope In previous
Chapter 1 Linear Regression with One Predictor
 STAT 525 FALL 2018 Chapter 1 Linear Regression with One Predictor Professor Min Zhang Goals of Regression Analysis Serve three purposes Describes an association between X and Y In some applications, the
Topic 17 - Single Factor Analysis of Variance. Outline. One-way ANOVA. The Data / Notation. One way ANOVA Cell means model Factor effects model
 Topic 17 - Single Factor Analysis of Variance - Fall 2013 One way ANOVA Cell means model Factor effects model Outline Topic 17 2 One-way ANOVA Response variable Y is continuous Explanatory variable is
Lab 10 - Binary Variables
 Lab 10 - Binary Variables Spring 2017 Contents 1 Introduction 1 2 SLR on a Dummy 2 3 MLR with binary independent variables 3 3.1 MLR with a Dummy: different intercepts, same slope................. 4 3.2
Chapter 1: Linear Regression with One Predictor Variable also known as: Simple Linear Regression Bivariate Linear Regression
 BSTT523: Kutner et al., Chapter 1 1 Chapter 1: Linear Regression with One Predictor Variable also known as: Simple Linear Regression Bivariate Linear Regression Introduction: Functional relation between
Acknowledgements. Outline. Marie Diener-West. ICTR Leadership / Team INTRODUCTION TO CLINICAL RESEARCH. Introduction to Linear Regression
 INTRODUCTION TO CLINICAL RESEARCH Introduction to Linear Regression Karen Bandeen-Roche, Ph.D. July 17, 2012 Acknowledgements Marie Diener-West Rick Thompson ICTR Leadership / Team JHU Intro to Clinical
Homework 2: Simple Linear Regression
 STAT 4385 Applied Regression Analysis Homework : Simple Linear Regression (Simple Linear Regression) Thirty (n = 30) College graduates who have recently entered the job market. For each student, the CGPA
Final Exam. Question 1 (20 points) 2 (25 points) 3 (30 points) 4 (25 points) 5 (10 points) 6 (40 points) Total (150 points) Bonus question (10)
 2 (25 points) 3 (30 points) 4 (25 points) 5 (10 points) 6 (40 points) Total (150 points) Bonus question (10)") Name Economics 170 Spring 2004 Honor pledge: I have neither given nor received aid on this exam including the preparation of my one page formula list and the preparation of the Stata assignment for the
Name Economics 170 Spring 2004 Honor pledge: I have neither given nor received aid on this exam including the preparation of my one page formula list and the preparation of the Stata assignment for the
Ch 3: Multiple Linear Regression
 Ch 3: Multiple Linear Regression 1. Multiple Linear Regression Model Multiple regression model has more than one regressor. For example, we have one response variable and two regressor variables: 1. delivery
" M A #M B. Standard deviation of the population (Greek lowercase letter sigma) σ 2
 σ 2") Notation and Equations for Final Exam Symbol Definition X The variable we measure in a scientific study n The size of the sample N The size of the population M The mean of the sample µ The mean of the
Notation and Equations for Final Exam Symbol Definition X The variable we measure in a scientific study n The size of the sample N The size of the population M The mean of the sample µ The mean of the
STAT 3A03 Applied Regression With SAS Fall 2017
 STAT 3A03 Applied Regression With SAS Fall 2017 Assignment 2 Solution Set Q. 1 I will add subscripts relating to the question part to the parameters and their estimates as well as the errors and residuals.
Business Statistics. Lecture 10: Correlation and Linear Regression
 Business Statistics Lecture 10: Correlation and Linear Regression Scatterplot A scatterplot shows the relationship between two quantitative variables measured on the same individuals. It displays the Form
Correlation and Linear Regression
 Correlation and Linear Regression Correlation: Relationships between Variables So far, nearly all of our discussion of inferential statistics has focused on testing for differences between group means
Correlation and simple linear regression S5
 Basic medical statistics for clinical and eperimental research Correlation and simple linear regression S5 Katarzyna Jóźwiak k.jozwiak@nki.nl November 15, 2017 1/41 Introduction Eample: Brain size and
Regression: Main Ideas Setting: Quantitative outcome with a quantitative explanatory variable. Example, cont.
 TCELL 9/4/205 36-309/749 Experimental Design for Behavioral and Social Sciences Simple Regression Example Male black wheatear birds carry stones to the nest as a form of sexual display. Soler et al. wanted
Chapter 5 Introduction to Factorial Designs Solutions
 Solutions from Montgomery, D. C. (1) Design and Analysis of Experiments, Wiley, NY Chapter 5 Introduction to Factorial Designs Solutions 5.1. The following output was obtained from a computer program that