Unit 11: Multiple Linear Regression
|
|
|
- Gervais Tate
- 5 years ago
- Views:
Transcription
1 Unit 11: Multiple Linear Regression Statistics 571: Statistical Methods Ramón V. León 7/13/2004 Unit 11 - Stat Ramón V. León 1 Main Application of Multiple Regression Isolating the effect of a variable by adjusting for the effect of other variables Regressing health index versus wealth gives a negative slope for wealth effect The higher the wealth the lower the health What one does when one fits a simple linear regression model Regressing health index versus wealth while adjusting for age gives a positive slope for wealth The higher the wealth the higher the health when one adjusts for the effect of the confounder age Multiple linear regression models allow us to determine the effect of regressors while adjusting For confounding For effect modification 7/13/2004 Unit 11 - Stat Ramón V. León 2

2 Why Do Regression Coefficients Have the Wrong Sign? yˆ = x yˆ = x x /13/2004 Unit 11 - Stat Ramón V. León 3 Multiple Linear Regression y = β + β x + β x + + β x + ε Model: k k Model is called linear because it is linear in the β s not necessarily in the x s. So y = + x + x + + x + 2 k β0 β1 β2... βk ε is considered a linear model and so is y = β + β x + β x + β x x + β x + β x + ε /13/2004 Unit 11 - Stat Ramón V. León 4
 r.v.'s. 2 This implies that Yi's are independent N( µ i, σ ) r.v.'s with µ = EY ( ) = β + β x + β x +.")
3 A Probabilistic Model for Multiple Linear Regression Yi = β0 + β1xi 1+ β2xi βkxik + εi, i= 1,2,..., n where εi is a random error with E( εi) = 0, and β0, β1,..., βk are unknown parameters. Usually we assume that the εi are 2 independent N(0, σ ) r.v.'s. 2 This implies that Yi's are independent N( µ i, σ ) r.v.'s with µ = EY ( ) = β + β x + β x β x i i 0 1 i1 2 i2 k ik 7/13/2004 Unit 11 - Stat Ramón V. León 5 Tire Wear Example xi1 x i 2 k=2 i y n=9 i = 1,2,..., n= 9 7/13/2004 Unit 11 - Stat Ramón V. León 6
4 Minimize: Least Squares Fit n i 0 1 i1 2 i2 k ik i= 1 ( ) 2 β β β... β Q= y + x + x + + x By solving the following equations: Q Q Q = 0, = 0,..., = 0 β β β 0 1 Solution are Least Square regression estimates: ˆ β, ˆ β,..., ˆ β 0 1 k k 7/13/2004 Unit 11 - Stat Ramón V. León 7 Sums of Squares yˆ = ˆ β + ˆ β x ˆ β x i= 1,2,..., n i 0 0 i1 k ik n n 2 2 e ( ˆ i = yi yi) i= 1 i= 1 n 2 ( yi y) i= 1 n 2 ( yˆ i y) i= 1 n ( ) 2 n ( ) 2 n y ˆ ( ˆ ) 2 i y = yi y + yi yi i= 1 i= 1 i= 1 Error Sum of Squares (SSE) = Total Sum of Squares (SST) = Regression Sum of Squares (SSR) = SST = SSR + SSE As also obtained for simple linear regression 7/13/2004 Unit 11 - Stat Ramón V. León 8


5 Coefficient of Multiple Determination r 2 SSR SSE = = 1 SST SST Percentage of the total variation in Y that is explained by the model r = r 2, is called the multiple correlation coefficient. Remark: R 2 square always increases with the number of variables included in the model, but this does not mean that more variables always leads to a better model. 7/13/2004 Unit 11 - Stat Ramón V. León 9 The Tire Wear Example: Quadratic Fit Using Fit Y by X platform: 7/13/2004 Unit 11 - Stat Ramón V. León 10


6 Tire Wear Example: JMP Output We used the Fit Y by X platform of JMP Reduces multicollinearty and differences in order of magnitudes among different powers of x Notice that the polynomial is centered at the average of Mileage = 16 7/13/2004 Unit 11 - Stat Ramón V. León 11 Tire Wear Example: JMP In this method of fitting, using the Fit Model platform, JMP does not know that Mileage^2 is the square of Mileage. The Mileage^2 column was created using JMP s calculator 7/13/2004 Unit 11 - Stat Ramón V. León 12


7 Tire Wear Example: JMP Output Polynomial is not centered here. Why? 7/13/2004 Unit 11 - Stat Ramón V. León 13 JMP Fit Model Platform Square term is added by highlighting Mileage in both Select Columns and Construct Model Effects and then clicking the Cross button Polynomials are centered by default 7/13/2004 Unit 11 - Stat Ramón V. León 14
 SE( ˆ β ) j 100(1-α)% CI for β : ˆ β ± t j n ( k+ 1), α 2 j j SE( ˆ β ) H : β = 0 versus H : β 0 oj j 1 j j ˆ β j Reject if t = > t SE ( ˆ β j ) j n ( k+ 1), α 2 Recall that the CI are")
8 Fit Model Platform Output Now polynomial is centered again 7/13/2004 Unit 11 - Stat Ramón V. León 15 Statistical Inference on Individual β s ˆ β j β j Tn ( k+ 1) ( j = 0,1,..., k) SE( ˆ β ) j 100(1-α)% CI for β : ˆ β ± t j n ( k+ 1), α 2 j j SE( ˆ β ) H : β = 0 versus H : β 0 oj j 1 j j ˆ β j Reject if t = > t SE ( ˆ β j ) j n ( k+ 1), α 2 Recall that the CI are obtained by right clicking on the parameter estimate area and from the popup menu selecting Columns and then Upper 95% and Lower 95% 7/13/2004 Unit 11 - Stat Ramón V. León 16
9 H Statistical Inference on Simultaneous β s : β = β =... = β = 0 vs. H : At least one β k 1 j MSR Reject if F = > fkn k MSE, ( + 1), α ANOVA table for quadratic fit of tire wear data. 7/13/2004 Unit 11 - Stat Ramón V. León 17 Compares the full model: Other Test of Hypothesis H0 : β = k m 1... = + β = k 0 Y = β + β x β x + ε ( i= 1,2,..., n) i 0 1 i1 k ik i to the partial model: Y = β + β x β x + ε ( i = 1, 2,..., n) i 0 1 i1 k m i, k m i Does adding additional predictor variables to the model lead to a significant reduction in the Error Sums of Squares (SSE)? 7/13/2004 Unit 11 - Stat Ramón V. León 18


10 Exercise 11.3: Type I and III Sums of Squares 7/13/2004 Unit 11 - Stat Ramón V. León 19 Type III Sums of Squares Does adding a variable to the model last lead to a significant decrease in the error sum of squares? Adding weight to the model - once brain size and height are in the model - does not help predict IQ Part of JMP s standard output for the Fit Model platform 7/13/2004 Unit 11 - Stat Ramón V. León 20
11 Type I or Sequential Sum of Squares Decrease in the error sums of squares when variables are added one at the time. Here order matters. Conclusion: Weight does not provide additional information about IQ once brain size and height are in the model 7/13/2004 Unit 11 - Stat Ramón V. León 21 Sequential SS Add to the Model SS (SSR) SSR = SSR = SST = SSR = Type III SS do not add up to the Model SS (SSR) 7/13/2004 Unit 11 - Stat Ramón V. León 22
12 Type I or Sequential Sum of Squares Looks a how much of SST is moved from the SSE into the SSR as you add additional regressors SST remains constant no matter how many regressors are in the model Recall that SST = SSR + SSE 7/13/2004 Unit 11 - Stat Ramón V. León 23 Variable Selection Methods In practice, a common problem is that there is a large set of candidate predictor variables. One wants to choose a small subset so that the resulting regression model is simple and has good predictive ability Stepwise regression Best subsets regression Optimality criteria Take Stat 572: Applied Linear Models to learn more Reading assignment: Section 11.8 A Strategy for Building a Multiple Regression Model. This strategy will help you with your project. 7/13/2004 Unit 11 - Stat Ramón V. León 24


13 Stepwise Regression in JMP 7/13/2004 Unit 11 - Stat Ramón V. León 25 Stepwise Regression in JMP Stepwise regression drops Weight from the model Sequential Sums of Square 7/13/2004 Unit 11 - Stat Ramón V. León 26

14 Reduced Model Compared with Full Model Brain size, height, and weight in the models Only brain size and height in the model Adjusted R 2 improves when Weight is dropped from the model since it has a penalty for number of variables in the model R 2 always increases with number of variables added to the model, but in this case the increase is negligible. This confirms that weight does not add much additional information to the model once brain weight and height are in the model. 7/13/2004 Unit 11 - Stat Ramón V. León 27 PRESS Statistic 7/13/2004 Unit 11 - Stat Ramón V. León 28


15 PRESS in JMP 7/13/2004 Unit 11 - Stat Ramón V. León 29 Cross-Validation Divide the data into training and test sets using random mechanism. Fit the models with training set data. Predict the test set data. Choose model that predicts best. 7/13/2004 Unit 11 - Stat Ramón V. León 30
16 Analysis Methods that Are Similar to Those in Simple Linear Regression Confidence intervals for the average response of Y at a particular value of the regressors Prediction intervals for a future value of Y for a particular value of the regressors Plot of residuals against individual predictor variables included or not in the model against predicted value on normal plot in time order if data is time ordered (Durbin-Watson test) Standardized residuals ( > 2 indicates an outlier) Influential observations if 2( k + 1) hii > n 7/13/2004 Unit 11 - Stat Ramón V. León 31 Transformations For the predictor variables as well as the response to make the model linear A model that can be transformed so that it becomes linear in in its unknown parameters is called intrinsically linear otherwise it is called a nonlinear model Unless a common transformation of y linearizes its relationship with all x s, effort should be focused on transforming the x s, leaving y untransformed, at least initially. It is usually assumed that the random error enters additively into the final form of the model 7/13/2004 Unit 11 - Stat Ramón V. León 32
17 Illustration of Multicollinearity: Cement Data Note that x1, x2, x3, and x4 add up to approximately 100% for all observations. 7/13/2004 Unit 11 - Stat Ramón V. León 33 Correlation Matrix: Cement Data Note that the x 1, x 2, x 3, and x 4 add up to approximately 100% for all observations. This approximate linear relationship among the x s results in multicollinearity. Multicollinearity means that the predictor variable are linearly related. Correlations X1 x2 x3 X4 X1 x2 x3 X /13/2004 Unit 11 - Stat Ramón V. León 34
18 Scatterplot Matrix Scatter Plot Matrix of Cement Data X1 x2 x X /13/2004 Unit 11 - Stat Ramón V. León 35 Multicolliniarity 7/13/2004 Unit 11 - Stat Ramón V. León 36
19 Multicollinearity Multicollinearity can cause serious numerical and statistical difficulties in fitting the regression model unless extra predictor variables are deleted. Example:If income, expenditure, and savings are used as predictor variables one should be deleted since saving = income expenditure Multicollinearity leads to these problems: -The estimates ˆ β j are subject to numerical errors and are unreliables. This is reflected in large changes in their magnitudes with small changes in data. -Most of the estimated coefficients have large standard errors and as a result are statistically nonsignificant even if the overall F-statistic is significant. 7/13/2004 Unit 11 - Stat Ramón V. León 37 Regression Coefficients in the Presence of Multicollinearty: Cement Data Parameter Estimates Term Intercept X1 x2 x3 X4 Source Model Error C. Total Estimate Analysis of Variance DF Std Error Sum of Squares t Ratio Mean Square Prob> t F Ratio Prob > F <.0001 Notice that all the regression coefficients are nonsignificant, although the overall F = is highly significant 7/13/2004 Unit 11 - Stat Ramón V. León 38
20 Measures of Multicollinearity: Correlations and Variance Inflation Factor (VIF) The simplest measure is the correlations matrix between pairs of predictor variables. A more direct measure is the VIF. VIFj = Diagonal elements of inverse of correlation matrix 1 We can show that VIFj =, i = 1, 2,..., k 1 r 2 where rj is the coefficient of multiple determination when regressing xj on the remaining k-1 predictor variables. Generally, VIF j values greater than 10, corresponding to 2 r >.9, are regarded as unacceptable. j 2 j 7/13/2004 Unit 11 - Stat Ramón V. León 39 VIFs for Cement Data Parameter Estimates Term Intercept X1 x2 x3 X4 Estimate Std Error t Ratio Prob> t VIF Notice that all the VIFs are greater than 10, a strong indication of multicollinearity 7/13/2004 Unit 11 - Stat Ramón V. León 40


21 VIF in JMP: How? Right click on the Parameter Estimates area. Select VIF from the columns submenu that pops up: 7/13/2004 Unit 11 - Stat Ramón V. León 41 Polynomial Regression Remarks Problems Power of x are highly correlated: collinearity Powers of x can have large differences in order of magnitude Solutions Center the x around the mean: x x Standardizing the x is even better: x x s x 7/13/2004 Unit 11 - Stat Ramón V. León 42
22 Dummy Predictor Variables Many applications involve categorical predictor variables, e.g. gender, season, prognosis (poor, average, good) For ordinal variables may use scores, e.g. use 1, 2, and 3 for the prognosis categories For nominal variables with c categories use c-1 indicator variables x 1,x 2,,x c-1 called dummy variables. Example: 1 if Winter x1 = 0 if another season Model: 1 if Spring x2 = Y = β0 + β1x1 + β2x2 + β3x3 + ε 0 if another season Fall is taken as reference point: 1 if Summer x3 = 0 if another season β 0 7/13/2004 Unit 11 - Stat Ramón V. León 43 Why 1-c Dummy Variables? 1 if Winter x1 = 0 if another season If 1 if Spring x2 = 0 if another season 1 if Summer x3 = 0 if another season Then x x x x = 1 Multicollinearity x 4 1 if Fall = 0 if another season 7/13/2004 Unit 11 - Stat Ramón V. León 44
 + ε 0 1 1 2 2 3 3 Four season average is taken as reference point:β 0 + Y Y Y Y = β + β ( 1) + β ( 1) + β ( 1) + ε Fall 0 1 2 3 = β + β (1) + ε Winter 0 1 = β + β (1) + ε Spring 0 2 = β + β (1) + ε")
23 JMP s Dummy Variables 1 if Winter 1 if Spring 1 if Summer z1 = -1 if Fall z2 = -1 if Fall z3 = -1 if Fall 0 if another season 0 if another season 0 if another season Y = β + β ( z ) + β ( z ) + β ( z ) + ε Four season average is taken as reference point:β 0 + Y Y Y Y = β + β ( 1) + β ( 1) + β ( 1) + ε Fall = β + β (1) + ε Winter 0 1 = β + β (1) + ε Spring 0 2 = β + β (1) + ε Summer 0 3 = 4β + ε 0 ε Y = β /13/2004 Unit 11 - Stat Ramón V. León 45 Quarterly Sales of Soda Cans (in Millions of Cans) The x s are the textbook (SAS) dummy variables. Thez s are JMP s dummy variables. 7/13/2004 Unit 11 - Stat Ramón V. León 46


24 New platform Runs Chart of Soda Can Sales 1 if Winter x1 = 0 if another season 1 if Spring x2 = 0 if another season 1 if Summer x3 = 0 if another season Try Model : Y = β + β x + β x Q β x + β QUARTER + ε Linear time trend and cyclical seasonal trend 7/13/2004 Unit 11 - Stat Ramón V. León 47 JMP Analysis: Textbook (SAS) Dummy Variables After adjusting for the linear time trend, the Spring and Summer sales differ significantly from the Fall sales, but those of Winter do not. Notice that these variables are declared continuous in JMP Winter Spring Summer 7/13/2004 Unit 11 - Stat Ramón V. León 48

 differ significantly")


25 JMP Analysis: JMP Dummy Variables After adjusting for the linear time trend Winter, Spring, and Summer (and Fall) differ significantly from the average of the four quarters Winter Spring Summer 7/13/2004 Unit 11 - Stat Ramón V. León 49 JMP Analysis: The Easy Way Nominal To make Fall the -1 z variable. 7/13/2004 Unit 11 - Stat Ramón V. León 50

26 How to Tell Season Effect is Important* Effect Tests Source Quarter Season Np arm 1 3 DF 1 3 Sum of Squares F Ratio Prob > F <.0001 <.0001 There statistical evidence of a seasonal effect *Part the output of the command in the previous visual 7/13/2004 Unit 11 - Stat Ramón V. León 51 7/13/2004 Unit 11 - Stat Ramón V. León 52
 in last line 7/13/2004 Unit")

27 Confidence and Prediction Intervals Notice that one should not use the Mean Confidence Interval Predicted sales for seventeenth quarter (next Winter) in last line 7/13/2004 Unit 11 - Stat Ramón V. León 53 Time Series Reference Forecasting Principles and Applications by Stephen A. DeLurgio. Inwin McGraw- Hill 7/13/2004 Unit 11 - Stat Ramón V. León 54
28 No interaction term in the model One Dummy and One Continuous Predictor Variables E( Weight) = β0 + β1sex + β2height where SEX = 0 for females and 1 for males. Equivalent formulation: β0 + β2height for females E( Weight) = ( β0 + β1) + β2height for males Parallel lines Lines have the same slope Height is an effect confounder for the gender effect. 7/13/2004 Unit 11 - Stat Ramón V. León 55 No interaction term in the model One Dummy and One Continuous Predictor Variables E( Weight) = β0 + β1sex + β2height where SEX = 0 for females and 1 for males. Equivalent formulation: β0 + β2height for females E( Weight) = ( β0 + β1) + β2height for males Lines have the same slope Height is an effect confounder for the gender effect. 7/13/2004 Unit 11 Female - Stat Ramón Male V. León 56 F
 = ( β0 + β1) + ( β2 + β3) Height for males Lines have different slopes Height is an effect modifier for the gender effect")
29 Interaction E( Weight) = β0 + β1sex + β2height + β3sex * HEIGHT where SEX = 0 for females and 1 for males. Interaction Equivalent formulation: Term β0 + β2height for females E( Weight) = ( β0 + β1) + ( β2 + β3) Height for males Lines have different slopes Height is an effect modifier for the gender effect Interactions are also important to consider among continuous and among categorical variables. This is a key step in model building. 7/13/2004 Unit 11 - Stat Ramón V. León 57 Considering Interactions 7/13/2004 Unit 11 - Stat Ramón V. León 58

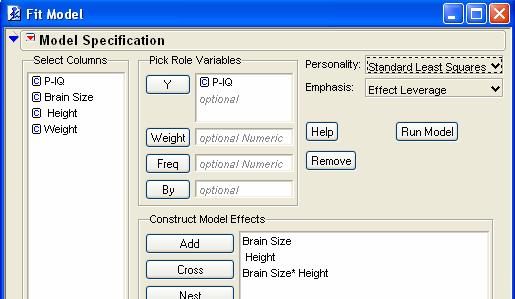
30 7/13/2004 Unit 11 - Stat Ramón V. León 59 7/13/2004 Unit 11 - Stat Ramón V. León 60

31 The interaction of Brain Size and Height is not significant 7/13/2004 Unit 11 - Stat Ramón V. León 61 Fallacy of Doing Simple Linear Regression When Multiple Linear Regression is Called For Regressing health index versus wealth gives a negative slope for wealth effect The higher the wealth the lower the health This is what one does when one fits a simple linear regression model Regressing health index versus wealth while adjusting for age gives a positive slope for wealth The higher the wealth the higher the health This is what one does when one fits a multiple linear regression model of the health index versus wealth and age 7/13/2004 Unit 11 - Stat Ramón V. León 62
32 Logistic Regression and Logit Models Logistic Regression used when the response variable is binary (or more generally categorical), e.g., a patient survives or dies. Model: PY ( = 1 x1, x2,..., x) k ln = β0 + β1x1+ β2x βkxk PY ( = 0 x1, x2,..., xk ) Equivalently, β0+ β1x1+ β2x βkxk e PY ( = 1 x1, x2,..., xk ) = β0+ β1x1+ β2x βkxk 1 + e 7/13/2004 Unit 11 - Stat Ramón V. León 63 Age and Coronary Heart Disease: Status of 100 Subjects Age CHD Age CHD Age CHD Age CHD Age CHD /13/2004 Unit 11 - Stat Ramón V. León 64


33 Coronary Heart Disease by Age 7/13/2004 Unit 11 - Stat Ramón V. León 65 Logistic Regression in JMP Notice that CHD is declared nominal 7/13/2004 Unit 11 - Stat Ramón V. León 66
34 JMP Output The probability of coronary heart disease increases with age. CHD AGE Ask JMP with the question mark tool for the complete interpretation of this plot 7/13/2004 Unit 11 - Stat Ramón V. León 67 JMP Output SSR SSE SST Whole Model Test Model Difference Full Reduced -LogLikelihood RSquare (U) Observations (or Sum Wgts) Converged by Gradient Parameter Estimates Term Intercept AGE For log odds of 0/1 Estimate DF Std Error ChiSquare ChiSquare Prob>ChiSq <.0001 Counterpart to the Analysis of Variance table in multiple linear regression with similar interpretation. Prob>ChiSq <.0001 < /13/2004 Unit 11 - Stat Ramón V. León 68

35 Logistic Regression Using JMP s Fit Model Platform: How to do Multiple Logistic Regression 7/13/2004 Unit 11 - Stat Ramón V. León 69 Whole Model Test Model Difference Full Reduced -LogLikelihood RSquare (U) Observations (or Sum Wgts) Converged by Gradient Lack Of Fit Source Lack Of Fit Saturated Fitted Intercept AGE DF Parameter Estimates Term Estimate DF LogLikelihood ChiSquare Prob>ChiSq Std Error ChiSquare Prob>ChiSq <.0001 ChiSquare For log odds of 0/1 Effect Wald Tests Source Nparm DF Wald ChiSquare Prob>ChiSq AGE Effect Likelihood Ratio Tests Source Nparm DF L-R ChiSquare Prob>ChiSq AGE Prob>ChiSq Lower 95% <.0001 < Upper 95% JMP Output This test is also available in multiple linear regression when there are repeat observations at certain values of the regressors X 7/13/2004 Unit 11 - Stat Ramón V. León 70 Y Interpreted as the Type III sums of squares in multiple linear regression
36 Do You Need to Know More? 572 Applied Regression Analysis (3) Simple linear regression. Matrix approach to multiple linear regression. Partial and sequential sums of squares, interaction and confounding, use of dummy variables, model selection. Leverage, influence and collinearity. Autocorrelated errors. Generalized linear models, maximum likelihood estimation, logistic regression, analysis of deviance. Nonlinear models, inference, ill-conditioning. Robust regression, M-estimators, iteratively reweighted least squares. Nonparametric regression, kernel, splines, testing lack of fit. Prereq: 571 and matrix algebra. F,Sp Recommended References: Introduction to Linear Regression Analysis, Third Edition by Douglas C. Montgomery, Elizabeth A. Peck, and G. Geoffrey Vining. A very well-written introduction to regression including some modern methods. Applied Logistic Regression, Second Edition by David W. Hosmer and Stanley Lemeshow. Wiley Interscience. A great introduction to logistic regression for those already familiar with the elements of multiple regression analysis. 7/13/2004 Unit 11 - Stat Ramón V. León 71
Unit 10: Simple Linear Regression and Correlation
 Unit 10: Simple Linear Regression and Correlation Statistics 571: Statistical Methods Ramón V. León 6/28/2004 Unit 10 - Stat 571 - Ramón V. León 1 Introductory Remarks Regression analysis is a method for
Lecture 10 Multiple Linear Regression
 Lecture 10 Multiple Linear Regression STAT 512 Spring 2011 Background Reading KNNL: 6.1-6.5 10-1 Topic Overview Multiple Linear Regression Model 10-2 Data for Multiple Regression Y i is the response variable
Project Report for STAT571 Statistical Methods Instructor: Dr. Ramon V. Leon. Wage Data Analysis. Yuanlei Zhang
 Project Report for STAT7 Statistical Methods Instructor: Dr. Ramon V. Leon Wage Data Analysis Yuanlei Zhang 77--7 November, Part : Introduction Data Set The data set contains a random sample of observations
Correlation and regression
 1 Correlation and regression Yongjua Laosiritaworn Introductory on Field Epidemiology 6 July 2015, Thailand Data 2 Illustrative data (Doll, 1955) 3 Scatter plot 4 Doll, 1955 5 6 Correlation coefficient,
Chapter 14 Student Lecture Notes 14-1
 Chapter 14 Student Lecture Notes 14-1 Business Statistics: A Decision-Making Approach 6 th Edition Chapter 14 Multiple Regression Analysis and Model Building Chap 14-1 Chapter Goals After completing this
Chapter 4: Regression Models
 Sales volume of company 1 Textbook: pp. 129-164 Chapter 4: Regression Models Money spent on advertising 2 Learning Objectives After completing this chapter, students will be able to: Identify variables,
Dr. Maddah ENMG 617 EM Statistics 11/28/12. Multiple Regression (3) (Chapter 15, Hines)
 (Chapter 15, Hines)") Dr. Maddah ENMG 617 EM Statistics 11/28/12 Multiple Regression (3) (Chapter 15, Hines) Problems in multiple regression: Multicollinearity This arises when the independent variables x 1, x 2,, x k, are
Dr. Maddah ENMG 617 EM Statistics 11/28/12 Multiple Regression (3) (Chapter 15, Hines) Problems in multiple regression: Multicollinearity This arises when the independent variables x 1, x 2,, x k, are
Statistics for Managers using Microsoft Excel 6 th Edition
 Statistics for Managers using Microsoft Excel 6 th Edition Chapter 13 Simple Linear Regression 13-1 Learning Objectives In this chapter, you learn: How to use regression analysis to predict the value of
Chapter 4. Regression Models. Learning Objectives
 Chapter 4 Regression Models To accompany Quantitative Analysis for Management, Eleventh Edition, by Render, Stair, and Hanna Power Point slides created by Brian Peterson Learning Objectives After completing
Multiple Regression Methods
 Chapter 1: Multiple Regression Methods Hildebrand, Ott and Gray Basic Statistical Ideas for Managers Second Edition 1 Learning Objectives for Ch. 1 The Multiple Linear Regression Model How to interpret
Data Analysis 1 LINEAR REGRESSION. Chapter 03
 Data Analysis 1 LINEAR REGRESSION Chapter 03 Data Analysis 2 Outline The Linear Regression Model Least Squares Fit Measures of Fit Inference in Regression Other Considerations in Regression Model Qualitative
Predictive Analytics : QM901.1x Prof U Dinesh Kumar, IIMB. All Rights Reserved, Indian Institute of Management Bangalore
 What is Multiple Linear Regression Several independent variables may influence the change in response variable we are trying to study. When several independent variables are included in the equation, the
Chapter 7 Student Lecture Notes 7-1
 Chapter 7 Student Lecture Notes 7- Chapter Goals QM353: Business Statistics Chapter 7 Multiple Regression Analysis and Model Building After completing this chapter, you should be able to: Explain model
Correlation Analysis
 Simple Regression Correlation Analysis Correlation analysis is used to measure strength of the association (linear relationship) between two variables Correlation is only concerned with strength of the
y response variable x 1, x 2,, x k -- a set of explanatory variables
 11. Multiple Regression and Correlation y response variable x 1, x 2,, x k -- a set of explanatory variables In this chapter, all variables are assumed to be quantitative. Chapters 12-14 show how to incorporate
Lecture 9: Linear Regression
 Lecture 9: Linear Regression Goals Develop basic concepts of linear regression from a probabilistic framework Estimating parameters and hypothesis testing with linear models Linear regression in R Regression
Any of 27 linear and nonlinear models may be fit. The output parallels that of the Simple Regression procedure.
 STATGRAPHICS Rev. 9/13/213 Calibration Models Summary... 1 Data Input... 3 Analysis Summary... 5 Analysis Options... 7 Plot of Fitted Model... 9 Predicted Values... 1 Confidence Intervals... 11 Observed
Chapter 3 Multiple Regression Complete Example
 Department of Quantitative Methods & Information Systems ECON 504 Chapter 3 Multiple Regression Complete Example Spring 2013 Dr. Mohammad Zainal Review Goals After completing this lecture, you should be
Inferences for Regression
 Inferences for Regression An Example: Body Fat and Waist Size Looking at the relationship between % body fat and waist size (in inches). Here is a scatterplot of our data set: Remembering Regression In
Final Review. Yang Feng. Yang Feng (Columbia University) Final Review 1 / 58
 Final Review 1 / 58") Final Review Yang Feng http://www.stat.columbia.edu/~yangfeng Yang Feng (Columbia University) Final Review 1 / 58 Outline 1 Multiple Linear Regression (Estimation, Inference) 2 Special Topics for Multiple
Final Review Yang Feng http://www.stat.columbia.edu/~yangfeng Yang Feng (Columbia University) Final Review 1 / 58 Outline 1 Multiple Linear Regression (Estimation, Inference) 2 Special Topics for Multiple
Multiple Regression. Peerapat Wongchaiwat, Ph.D.
 Peerapat Wongchaiwat, Ph.D. wongchaiwat@hotmail.com The Multiple Regression Model Examine the linear relationship between 1 dependent (Y) & 2 or more independent variables (X i ) Multiple Regression Model
x3,..., Multiple Regression β q α, β 1, β 2, β 3,..., β q in the model can all be estimated by least square estimators
 Multiple Regression Relating a response (dependent, input) y to a set of explanatory (independent, output, predictor) variables x, x 2, x 3,, x q. A technique for modeling the relationship between variables.
Regression Models. Chapter 4. Introduction. Introduction. Introduction
 Chapter 4 Regression Models Quantitative Analysis for Management, Tenth Edition, by Render, Stair, and Hanna 008 Prentice-Hall, Inc. Introduction Regression analysis is a very valuable tool for a manager
Basic Business Statistics 6 th Edition
 Basic Business Statistics 6 th Edition Chapter 12 Simple Linear Regression Learning Objectives In this chapter, you learn: How to use regression analysis to predict the value of a dependent variable based
Basic Business Statistics, 10/e
 Chapter 4 4- Basic Business Statistics th Edition Chapter 4 Introduction to Multiple Regression Basic Business Statistics, e 9 Prentice-Hall, Inc. Chap 4- Learning Objectives In this chapter, you learn:
Multiple linear regression
 Multiple linear regression Course MF 930: Introduction to statistics June 0 Tron Anders Moger Department of biostatistics, IMB University of Oslo Aims for this lecture: Continue where we left off. Repeat
Unit 9: Inferences for Proportions and Count Data
 Unit 9: Inferences for Proportions and Count Data Statistics 571: Statistical Methods Ramón V. León 12/15/2008 Unit 9 - Stat 571 - Ramón V. León 1 Large Sample Confidence Interval for Proportion ( pˆ p)
Chapter 19: Logistic regression
 Chapter 19: Logistic regression Self-test answers SELF-TEST Rerun this analysis using a stepwise method (Forward: LR) entry method of analysis. The main analysis To open the main Logistic Regression dialog
FinQuiz Notes
 Reading 10 Multiple Regression and Issues in Regression Analysis 2. MULTIPLE LINEAR REGRESSION Multiple linear regression is a method used to model the linear relationship between a dependent variable
(Where does Ch. 7 on comparing 2 means or 2 proportions fit into this?)
") 12. Comparing Groups: Analysis of Variance (ANOVA) Methods Response y Explanatory x var s Method Categorical Categorical Contingency tables (Ch. 8) (chi-squared, etc.) Quantitative Quantitative Regression
12. Comparing Groups: Analysis of Variance (ANOVA) Methods Response y Explanatory x var s Method Categorical Categorical Contingency tables (Ch. 8) (chi-squared, etc.) Quantitative Quantitative Regression
2/26/2017. PSY 512: Advanced Statistics for Psychological and Behavioral Research 2
 PSY 512: Advanced Statistics for Psychological and Behavioral Research 2 When and why do we use logistic regression? Binary Multinomial Theory behind logistic regression Assessing the model Assessing predictors
Review of Statistics 101
 Review of Statistics 101 We review some important themes from the course 1. Introduction Statistics- Set of methods for collecting/analyzing data (the art and science of learning from data). Provides methods
CHAPTER 5 LINEAR REGRESSION AND CORRELATION
 CHAPTER 5 LINEAR REGRESSION AND CORRELATION Expected Outcomes Able to use simple and multiple linear regression analysis, and correlation. Able to conduct hypothesis testing for simple and multiple linear
4. Nonlinear regression functions
 4. Nonlinear regression functions Up to now: Population regression function was assumed to be linear The slope(s) of the population regression function is (are) constant The effect on Y of a unit-change
Unit 9: Inferences for Proportions and Count Data
 Unit 9: Inferences for Proportions and Count Data Statistics 571: Statistical Methods Ramón V. León 1/15/008 Unit 9 - Stat 571 - Ramón V. León 1 Large Sample Confidence Interval for Proportion ( pˆ p)
STA 108 Applied Linear Models: Regression Analysis Spring Solution for Homework #6
 STA 8 Applied Linear Models: Regression Analysis Spring 011 Solution for Homework #6 6. a) = 11 1 31 41 51 1 3 4 5 11 1 31 41 51 β = β1 β β 3 b) = 1 1 1 1 1 11 1 31 41 51 1 3 4 5 β = β 0 β1 β 6.15 a) Stem-and-leaf
STAT Chapter 11: Regression
 STAT 515 -- Chapter 11: Regression Mostly we have studied the behavior of a single random variable. Often, however, we gather data on two random variables. We wish to determine: Is there a relationship
Analysing data: regression and correlation S6 and S7
 Basic medical statistics for clinical and experimental research Analysing data: regression and correlation S6 and S7 K. Jozwiak k.jozwiak@nki.nl 2 / 49 Correlation So far we have looked at the association
Class Notes Spring 2014
 Psychology 513 Quantitative Models in Psychology Class Notes Spring 2014 Robert M. McFatter University of Louisiana Lafayette 5.5 5 4.5 Positive Emotional Intensity 4 3.5 3 2.5 2.5 1.25 2-2.5-2 -1.5-1
General Linear Model (Chapter 4)
") General Linear Model (Chapter 4) Outcome variable is considered continuous Simple linear regression Scatterplots OLS is BLUE under basic assumptions MSE estimates residual variance testing regression coefficients
General Linear Model (Chapter 4) Outcome variable is considered continuous Simple linear regression Scatterplots OLS is BLUE under basic assumptions MSE estimates residual variance testing regression coefficients
Inference for Regression Inference about the Regression Model and Using the Regression Line
 Inference for Regression Inference about the Regression Model and Using the Regression Line PBS Chapter 10.1 and 10.2 2009 W.H. Freeman and Company Objectives (PBS Chapter 10.1 and 10.2) Inference about
Simple Linear Regression: One Qualitative IV
 Simple Linear Regression: One Qualitative IV 1. Purpose As noted before regression is used both to explain and predict variation in DVs, and adding to the equation categorical variables extends regression
Lecture 12: Effect modification, and confounding in logistic regression
 Lecture 12: Effect modification, and confounding in logistic regression Ani Manichaikul amanicha@jhsph.edu 4 May 2007 Today Categorical predictor create dummy variables just like for linear regression
Trendlines Simple Linear Regression Multiple Linear Regression Systematic Model Building Practical Issues
 Trendlines Simple Linear Regression Multiple Linear Regression Systematic Model Building Practical Issues Overfitting Categorical Variables Interaction Terms Non-linear Terms Linear Logarithmic y = a +
Chapter 1 Statistical Inference
 Chapter 1 Statistical Inference causal inference To infer causality, you need a randomized experiment (or a huge observational study and lots of outside information). inference to populations Generalizations
Chapter 13. Multiple Regression and Model Building
 Chapter 13 Multiple Regression and Model Building Multiple Regression Models The General Multiple Regression Model y x x x 0 1 1 2 2... k k y is the dependent variable x, x,..., x 1 2 k the model are the
LAB 5 INSTRUCTIONS LINEAR REGRESSION AND CORRELATION
 LAB 5 INSTRUCTIONS LINEAR REGRESSION AND CORRELATION In this lab you will learn how to use Excel to display the relationship between two quantitative variables, measure the strength and direction of the
STA121: Applied Regression Analysis
 STA121: Applied Regression Analysis Linear Regression Analysis - Chapters 3 and 4 in Dielman Artin Department of Statistical Science September 15, 2009 Outline 1 Simple Linear Regression Analysis 2 Using
Multiple Regression: Chapter 13. July 24, 2015
 Multiple Regression: Chapter 13 July 24, 2015 Multiple Regression (MR) Response Variable: Y - only one response variable (quantitative) Several Predictor Variables: X 1, X 2, X 3,..., X p (p = # predictors)
10. Alternative case influence statistics
 10. Alternative case influence statistics a. Alternative to D i : dffits i (and others) b. Alternative to studres i : externally-studentized residual c. Suggestion: use whatever is convenient with the
LINEAR REGRESSION ANALYSIS. MODULE XVI Lecture Exercises
 LINEAR REGRESSION ANALYSIS MODULE XVI Lecture - 44 Exercises Dr. Shalabh Department of Mathematics and Statistics Indian Institute of Technology Kanpur Exercise 1 The following data has been obtained on
Lecture 3: Inference in SLR
 Lecture 3: Inference in SLR STAT 51 Spring 011 Background Reading KNNL:.1.6 3-1 Topic Overview This topic will cover: Review of hypothesis testing Inference about 1 Inference about 0 Confidence Intervals
9. Linear Regression and Correlation
 9. Linear Regression and Correlation Data: y a quantitative response variable x a quantitative explanatory variable (Chap. 8: Recall that both variables were categorical) For example, y = annual income,
Inference for Regression
 Inference for Regression Section 9.4 Cathy Poliak, Ph.D. cathy@math.uh.edu Office in Fleming 11c Department of Mathematics University of Houston Lecture 13b - 3339 Cathy Poliak, Ph.D. cathy@math.uh.edu
STATISTICS 110/201 PRACTICE FINAL EXAM
 STATISTICS 110/201 PRACTICE FINAL EXAM Questions 1 to 5: There is a downloadable Stata package that produces sequential sums of squares for regression. In other words, the SS is built up as each variable
Basic Medical Statistics Course
 Basic Medical Statistics Course S7 Logistic Regression November 2015 Wilma Heemsbergen w.heemsbergen@nki.nl Logistic Regression The concept of a relationship between the distribution of a dependent variable
Estimating σ 2. We can do simple prediction of Y and estimation of the mean of Y at any value of X.
 Estimating σ 2 We can do simple prediction of Y and estimation of the mean of Y at any value of X. To perform inferences about our regression line, we must estimate σ 2, the variance of the error term.
Multiple Linear Regression
 Multiple Linear Regression Simple linear regression tries to fit a simple line between two variables Y and X. If X is linearly related to Y this explains some of the variability in Y. In most cases, there
STAT 7030: Categorical Data Analysis
 STAT 7030: Categorical Data Analysis 5. Logistic Regression Peng Zeng Department of Mathematics and Statistics Auburn University Fall 2012 Peng Zeng (Auburn University) STAT 7030 Lecture Notes Fall 2012
Multiple Regression Analysis. Part III. Multiple Regression Analysis
 Part III Multiple Regression Analysis As of Sep 26, 2017 1 Multiple Regression Analysis Estimation Matrix form Goodness-of-Fit R-square Adjusted R-square Expected values of the OLS estimators Irrelevant
Logistic Regression. Continued Psy 524 Ainsworth
 Logistic Regression Continued Psy 524 Ainsworth Equations Regression Equation Y e = 1 + A+ B X + B X + B X 1 1 2 2 3 3 i A+ B X + B X + B X e 1 1 2 2 3 3 Equations The linear part of the logistic regression
Lectures on Simple Linear Regression Stat 431, Summer 2012
 Lectures on Simple Linear Regression Stat 43, Summer 0 Hyunseung Kang July 6-8, 0 Last Updated: July 8, 0 :59PM Introduction Previously, we have been investigating various properties of the population
Introduction to the Logistic Regression Model
 CHAPTER 1 Introduction to the Logistic Regression Model 1.1 INTRODUCTION Regression methods have become an integral component of any data analysis concerned with describing the relationship between a response
Topic 18: Model Selection and Diagnostics
 Topic 18: Model Selection and Diagnostics Variable Selection We want to choose a best model that is a subset of the available explanatory variables Two separate problems 1. How many explanatory variables
Regression Models - Introduction
 Regression Models - Introduction In regression models there are two types of variables that are studied: A dependent variable, Y, also called response variable. It is modeled as random. An independent
A Second Course in Statistics: Regression Analysis
 FIFTH E D I T I 0 N A Second Course in Statistics: Regression Analysis WILLIAM MENDENHALL University of Florida TERRY SINCICH University of South Florida PRENTICE HALL Upper Saddle River, New Jersey 07458
Regression Models for Time Trends: A Second Example. INSR 260, Spring 2009 Bob Stine
 Regression Models for Time Trends: A Second Example INSR 260, Spring 2009 Bob Stine 1 Overview Resembles prior textbook occupancy example Time series of revenue, costs and sales at Best Buy, in millions
Simple Linear Regression
 Simple Linear Regression ST 430/514 Recall: A regression model describes how a dependent variable (or response) Y is affected, on average, by one or more independent variables (or factors, or covariates)
holding all other predictors constant
 Multiple Regression Numeric Response variable (y) p Numeric predictor variables (p < n) Model: Y = b 0 + b 1 x 1 + + b p x p + e Partial Regression Coefficients: b i effect (on the mean response) of increasing
Ridge Regression. Summary. Sample StatFolio: ridge reg.sgp. STATGRAPHICS Rev. 10/1/2014
 Ridge Regression Summary... 1 Data Input... 4 Analysis Summary... 5 Analysis Options... 6 Ridge Trace... 7 Regression Coefficients... 8 Standardized Regression Coefficients... 9 Observed versus Predicted...
Chapter 14. Linear least squares
 Serik Sagitov, Chalmers and GU, March 5, 2018 Chapter 14 Linear least squares 1 Simple linear regression model A linear model for the random response Y = Y (x) to an independent variable X = x For a given
Inference for the Regression Coefficient
 Inference for the Regression Coefficient Recall, b 0 and b 1 are the estimates of the slope β 1 and intercept β 0 of population regression line. We can shows that b 0 and b 1 are the unbiased estimates
Statistics in medicine
 Statistics in medicine Lecture 4: and multivariable regression Fatma Shebl, MD, MS, MPH, PhD Assistant Professor Chronic Disease Epidemiology Department Yale School of Public Health Fatma.shebl@yale.edu
Correlation & Simple Regression
 Chapter 11 Correlation & Simple Regression The previous chapter dealt with inference for two categorical variables. In this chapter, we would like to examine the relationship between two quantitative variables.
Linear Regression Analysis for Survey Data. Professor Ron Fricker Naval Postgraduate School Monterey, California
 Linear Regression Analysis for Survey Data Professor Ron Fricker Naval Postgraduate School Monterey, California 1 Goals for this Lecture Linear regression How to think about it for Lickert scale dependent
Prepared by: Prof. Dr Bahaman Abu Samah Department of Professional Development and Continuing Education Faculty of Educational Studies Universiti
 Prepared by: Prof Dr Bahaman Abu Samah Department of Professional Development and Continuing Education Faculty of Educational Studies Universiti Putra Malaysia Serdang M L Regression is an extension to
Correlation and simple linear regression S5
 Basic medical statistics for clinical and eperimental research Correlation and simple linear regression S5 Katarzyna Jóźwiak k.jozwiak@nki.nl November 15, 2017 1/41 Introduction Eample: Brain size and
Multiple regression: Model building. Topics. Correlation Matrix. CQMS 202 Business Statistics II Prepared by Moez Hababou
 Multiple regression: Model building CQMS 202 Business Statistics II Prepared by Moez Hababou Topics Forward versus backward model building approach Using the correlation matrix Testing for multicolinearity
STA 303 H1S / 1002 HS Winter 2011 Test March 7, ab 1cde 2abcde 2fghij 3
 STA 303 H1S / 1002 HS Winter 2011 Test March 7, 2011 LAST NAME: FIRST NAME: STUDENT NUMBER: ENROLLED IN: (circle one) STA 303 STA 1002 INSTRUCTIONS: Time: 90 minutes Aids allowed: calculator. Some formulae
CS 5014: Research Methods in Computer Science
 Computer Science Clifford A. Shaffer Department of Computer Science Virginia Tech Blacksburg, Virginia Fall 2010 Copyright c 2010 by Clifford A. Shaffer Computer Science Fall 2010 1 / 207 Correlation and
Confidence Interval for the mean response
 Week 3: Prediction and Confidence Intervals at specified x. Testing lack of fit with replicates at some x's. Inference for the correlation. Introduction to regression with several explanatory variables.
Model Selection Procedures
 Model Selection Procedures Statistics 135 Autumn 2005 Copyright c 2005 by Mark E. Irwin Model Selection Procedures Consider a regression setting with K potential predictor variables and you wish to explore
Ch14. Multiple Regression Analysis
 Ch14. Multiple Regression Analysis 1 Goals : multiple regression analysis Model Building and Estimating More than 1 independent variables Quantitative( 量 ) independent variables Qualitative( ) independent
Classification & Regression. Multicollinearity Intro to Nominal Data
 Multicollinearity Intro to Nominal Let s Start With A Question y = β 0 + β 1 x 1 +β 2 x 2 y = Anxiety Level x 1 = heart rate x 2 = recorded pulse Since we can all agree heart rate and pulse are related,
INTRODUCTION TO LINEAR REGRESSION ANALYSIS
 INTRODUCTION TO LINEAR REGRESSION ANALYSIS WILEY SERIES IN PROBABILITY AND STATISTICS Established by WALTER A. SHEWHART and SAMUEL S. WILKS Editors: David J. Balding, Noel A. C. Cressie, Garrett M. Fitzmaurice,
MULTIPLE REGRESSION AND ISSUES IN REGRESSION ANALYSIS
 MULTIPLE REGRESSION AND ISSUES IN REGRESSION ANALYSIS Page 1 MSR = Mean Regression Sum of Squares MSE = Mean Squared Error RSS = Regression Sum of Squares SSE = Sum of Squared Errors/Residuals α = Level
Investigating Models with Two or Three Categories
 Ronald H. Heck and Lynn N. Tabata 1 Investigating Models with Two or Three Categories For the past few weeks we have been working with discriminant analysis. Let s now see what the same sort of model might
Machine Learning Linear Classification. Prof. Matteo Matteucci
 Machine Learning Linear Classification Prof. Matteo Matteucci Recall from the first lecture 2 X R p Regression Y R Continuous Output X R p Y {Ω 0, Ω 1,, Ω K } Classification Discrete Output X R p Y (X)
Multiple linear regression S6
 Basic medical statistics for clinical and experimental research Multiple linear regression S6 Katarzyna Jóźwiak k.jozwiak@nki.nl November 15, 2017 1/42 Introduction Two main motivations for doing multiple
Lecture 4 Multiple linear regression
 Lecture 4 Multiple linear regression BIOST 515 January 15, 2004 Outline 1 Motivation for the multiple regression model Multiple regression in matrix notation Least squares estimation of model parameters
STA6938-Logistic Regression Model
 Dr. Ying Zhang STA6938-Logistic Regression Model Topic 2-Multiple Logistic Regression Model Outlines:. Model Fitting 2. Statistical Inference for Multiple Logistic Regression Model 3. Interpretation of
Single and multiple linear regression analysis
 Single and multiple linear regression analysis Marike Cockeran 2017 Introduction Outline of the session Simple linear regression analysis SPSS example of simple linear regression analysis Additional topics
Section IX. Introduction to Logistic Regression for binary outcomes. Poisson regression
 Section IX Introduction to Logistic Regression for binary outcomes Poisson regression 0 Sec 9 - Logistic regression In linear regression, we studied models where Y is a continuous variable. What about
Business Statistics. Lecture 9: Simple Regression
 Business Statistics Lecture 9: Simple Regression 1 On to Model Building! Up to now, class was about descriptive and inferential statistics Numerical and graphical summaries of data Confidence intervals
Statistics 5100 Spring 2018 Exam 1
 Statistics 5100 Spring 2018 Exam 1 Directions: You have 60 minutes to complete the exam. Be sure to answer every question, and do not spend too much time on any part of any question. Be concise with all
STAT 212 Business Statistics II 1
 STAT 1 Business Statistics II 1 KING FAHD UNIVERSITY OF PETROLEUM & MINERALS DEPARTMENT OF MATHEMATICAL SCIENCES DHAHRAN, SAUDI ARABIA STAT 1: BUSINESS STATISTICS II Semester 091 Final Exam Thursday Feb
Chapter 14 Student Lecture Notes Department of Quantitative Methods & Information Systems. Business Statistics. Chapter 14 Multiple Regression
 Chapter 14 Student Lecture Notes 14-1 Department of Quantitative Methods & Information Systems Business Statistics Chapter 14 Multiple Regression QMIS 0 Dr. Mohammad Zainal Chapter Goals After completing
Regression Analysis By Example
 Regression Analysis By Example Third Edition SAMPRIT CHATTERJEE New York University ALI S. HADI Cornell University BERTRAM PRICE Price Associates, Inc. A Wiley-Interscience Publication JOHN WILEY & SONS,
SMA 6304 / MIT / MIT Manufacturing Systems. Lecture 10: Data and Regression Analysis. Lecturer: Prof. Duane S. Boning
 SMA 6304 / MIT 2.853 / MIT 2.854 Manufacturing Systems Lecture 10: Data and Regression Analysis Lecturer: Prof. Duane S. Boning 1 Agenda 1. Comparison of Treatments (One Variable) Analysis of Variance
Unit 6 - Introduction to linear regression
 Unit 6 - Introduction to linear regression Suggested reading: OpenIntro Statistics, Chapter 7 Suggested exercises: Part 1 - Relationship between two numerical variables: 7.7, 7.9, 7.11, 7.13, 7.15, 7.25,