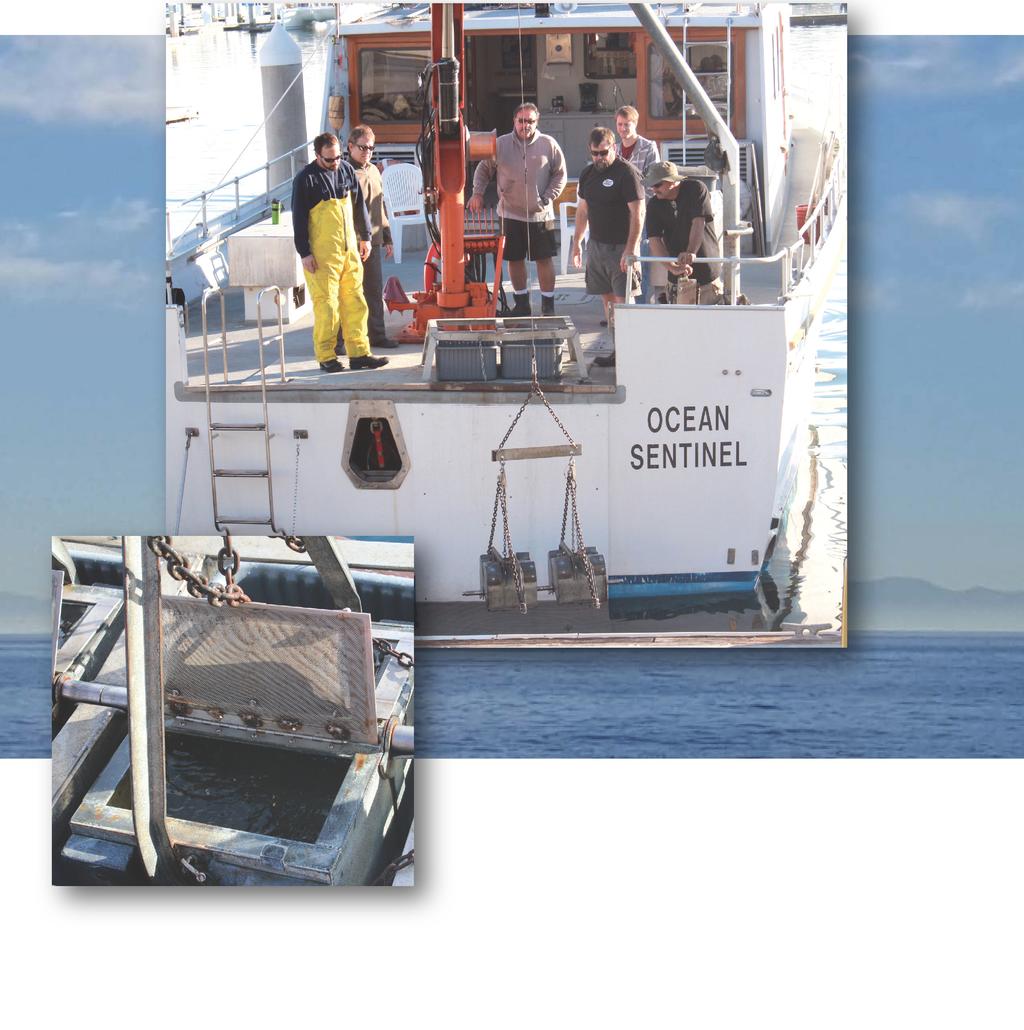
A close-up view of sediment collected from the tandem Van Veen benthic grab.
|
|
|
- Eileen Norman
- 5 years ago
- Views:
Transcription
1
2 Cover photos Top: Bottom left: Benthic sampling crew aboard the Ocean Sentinel. From left to right: Brent Haggin (Senior Laboratory Technician), Larry Lovell (Senior Biologist), Fred Stern (Senior Biologist, retired), Bill Power (Supervising Scientist), Chase McDonald (Senior Biologist) and Percival Harper (Boat Deck Hand) retrieving the tandem Van Veen benthic grab. A close-up view of sediment collected from the tandem Van Veen benthic grab.
3 Chapter 4 Sediment Condition INTRODUCTION Analyzing physical and chemical properties of sediments are essential elements of the Joint Water Pollution Control Plant s (JWPCP) National Pollution Discharge Elimination System (NPDES) receiving water monitoring program. Suspended solids in treated wastewater effluents discharged to an aquatic environment typically settle on the bottom and mix with native sediments. The effluent-derived solids are enriched with organic carbon and nitrogen and can cause environmental degradation under certain circumstances. Further, these particles serve as a conveyance mechanism for trace metals and organic contaminants (pesticides, polycyclic aromatic hydrocarbons or PAHs, pharmaceuticals and personal care products, etc.) to enter the marine environment. Sediments serve as a sink for discharged pollutants and can be a significant source of contaminants to the local environment for decades after the discharge of these pollutants has ceased. The physical and chemical data collected through the Sanitation Districts of Los Angeles County s (Sanitation Districts) ocean monitoring program allows for the spatial and temporal trends in sediment condition to be documented. Inferences can then be drawn regarding the relationship between effluent-derived pollutants and alterations to benthic habitat and infaunal (Chapter 5) and epibenthic (Chapter 6) communities. Sediment chemistry information is also vital to assess the link between pollutants discharged and wildlife and human health risk from the consumption of exposed prey such as fish and shellfish (Chapter 7). History of sediment monitoring and condition The JWPCP discharge off Palos Verdes altered the physical and chemical nature of sediments on the shelf and slope during the 33 years of operation from 1937 to Suspended solids and the resulting organic matter and contaminant loads to the receiving water increased over time (Figure 1.2) as the Sanitation Districts service area grew in population and industrialization. By 1970, the discharge had altered the sediment texture (sediments became finer) and polluted the seafloor with organic matter and contaminants (e.g. metals and chlorinated hydrocarbons). Organic loading resulted in sediment hypoxia and formation of free hydrogen sulfide (H 2 S) in the porewater of surface sediments. Potentially toxic synthetic organic compounds, most notably DDTs (dichlorodiphenyltrichloroethane and its degradation products) and PCBs (polychlorinated biphenyls), were at levels in the sediments above those likely to cause biological effects (Chapter 1). These alterations were severe enough to degrade the sediment-associated biological communities over the entire shelf and slope, particularly near the outfalls. The Sanitation Districts have monitored benthic biological communities and sediment quality on the Palos Verdes shelf and slope since the early 1970s. Despite more than 45 years of declining mass emissions of suspended solids and associated industrial contaminants from the JWPCP, there is still a small reservoir of organically enriched and contaminated sediments on the Palos Verdes shelf and slope. A series of reports describe the sediments off Palos Verdes in detail (Sediment Dynamics Workshop Group 1987, Lee 1994, Lee and Wilberg 2002, CH2M Hill 2007, Eganhouse and Pontolillo 2008, Ferré et al. 2010, USEPA 2013, LACSD 2014). The deposit contains elevated concentrations of DDT, PCBs, metals, PAH, and organic matter (including effluent-derived materials). The highest concentrations of contaminants are found between the meter isobaths (i.e. the shelf break) buried below cm of cleaner sediment. The effluent-affected shelf break 4.1
4 sediments are characterized by a lower density and finer grain size than native sediments. Both suspended and bedload sediment movement is variable, but the dominant sediment transport direction on the mid-shelf is toward the northwest (Wiberg et al. 2002). The dominance of this northwest sediment transport is evident in the distribution of chemical and sedimentological variables (Stull et al. 1986, Sediment Dynamics Workshop Group 1987, Hampton et al. 2002, Lee et al. 2002, LACSD 2012). Wu et al. (1994) also reported extensive resuspension of sediments near the seafloor. In one example, the resuspended sediment rose up almost 20 m from the bottom, and extended horizontally at least 4 km. JWPCP effluent has been historically one of two major sources of sediment to the Palos Verdes shelf. The other source is the Portuguese Bend landslide that has contributed rock and sediment to the shelf since at least Erosion, both past and present, has resulted in an accumulation of slide material on the inner shelf. Slide movement is correlated, in part, with storms and rainfall that tend to move slide material offshore, and the landslide toe erosion varies with storm-wave energy and direction. The littoral current carries landslide material alongshore to the southeast towards White Point and beyond including offshore of the Los Angeles Harbor. Bottom currents at water depths over 30 m, however, carry slide sediments to the northwest. By 1988, slide movement was reduced substantially by engineering projects related to stabilization and shoreline protection, including dewatering wells, regrading, better drainage, gabions, and revetments (Kayen et al. 2002). During the 44-year period after initiation of movement ( ), the Portuguese Bend landslide contributed up to 9.4 million metric tons of sediment to the Palos Verdes shelf. This is as much as 2.5 times the total mass of particulate discharged from JWPCP during the 50-year period from (Kayen et al. 2002); only a fraction of which settled on the Palos Verdes shelf (Hendricks 1980). The sediment load from the slide has led to significant (>1 m) shoaling on the inshore seafloor east of the slide toe (Kayen et al. 2002), burying many low-lying rocky reefs in the area (LACSD 2002). Sediment condition monitoring requirements The Monitoring and Reporting Program (MRP) for the JWPCP NPDES permit issued by the Los Angeles Regional Water Quality Control Board (LARWQCB; Order No. R ; NPDES No. CA ; Appendix 1.1) require the Sanitation Districts to participate in two sediment condition monitoring programs. A brief discussion of each monitoring element is described below. The Local Sediment Chemistry Trends Survey is conducted annually at 24 sites and at 44 sites once every five-year permit cycle along the Palos Verdes Peninsula (Figure 4.1). Over 70 constituents, including organic nitrogen and carbon, trace metals, and organic contaminants are quantified. Grain size distributions are also determined at all 44 sites annually. These physical and chemical datasets are used to assess whether sediment conditions under the influence of the discharge are changing over time. Furthermore, the data collected provide context for assessing trends in biological communities (Chapter 5 and Chapter 6) and fish tissue bioaccumulation monitoring programs (Chapter 7) under the NPDES permit. The Sanitation Districts are also required to participate in Regional Benthic Surveys of sediment conditions. The objective of these surveys is to determine the extent, distribution, magnitude, and trend of ecological change in softbottom benthic habitats within the Southern California Bight (SCB). The physical and chemical measurements of the sediment are used to evaluate the relationship between biological responses and exposure to contaminants. Combined with biological data, these studies evaluate the condition of the seafloor environment and the health of the biological resources in the SCB. These regional studies, termed Bight surveys, are conducted every five years under the direction of a steering committee and coordinated by the Southern California Coastal 4.2
 every five years with the full survey conducted for summer of 2014. A subset of 24 stations (full circles) are sampled and analyzed annually.")
5 Figure 4.1 Benthic Sediment Monitoring Stations Map of the sampling sites for physical and chemical analysis of surficial (top two centimeters) sediments. Analyses are performed on all 44 sites (compound circles) every five years with the full survey conducted for summer of A subset of 24 stations (full circles) are sampled and analyzed annually. Total organic carbon, organic nitrogen and grain size are measured at all 44 sites annually as required for the benthic infauna monitoring program (Chapter 5) and are also utilized in this chapter. Water Research Project (SCCWRP). When such surveys are scheduled, the Sanitation Districts are required to provide staff and resources for planning, sampling, analyses, and data management associated with the project. The 2013 Bight regional monitoring (Bight 13) Contaminant Impact Assessment Committee designed (SCCWRP 2013) and conducted a Regional Benthic Survey during summer of Members of the Sanitation Districts staff served on the Bight 13 Contaminant Impact Assessment Committee 4.3
6 and several associated technical committees and facilitated the implementation of this survey through sample analysis, quality assurance/quality control, data management support, and report writing (Dodder et al. 2016). Chapter overview This chapter provides the results of the physical and chemical analyses of surface sediments for the Local Benthic Trends Surveys in 2014 and Consistent with the objectives of the monitoring and reporting requirement, the local trends data are analyzed and discussed in terms of spatial and temporal relationships between sediment condition and proximity to the JWPCP outfall. This chapter is one component of the JWPCP Biennial Receiving Water Monitoring Report (LACSD 2016a). The complete report includes results and analyses for all JWPCP NPDES receiving water monitoring requirements and associated appendices. Electronic copies of the complete JWPCP Biennial Receiving Water Monitoring Report can be downloaded from the Sanitation Districts website ( environment/ocean_monitoring_n_research_/ reports/default.asp). MATERIALS AND METHODS Field sampling Paired sediment samples were collected with a 0.1 m 2 tandem Van Veen grab in July of 2014 and 2015 at 44 sites (Figure 4.1). At each site, sediment samples were collected for both benthic infauna and physical and chemical analyses. Surficial sediment, defined here as the top two centimeters, was collected from the dedicated sediment grab sample (as opposed to the benthic infauna). Sediment color and type, presence of hydrogen sulfide odor, and temperature were recorded at the time of sampling. The field sampling standard operating procedure (SOP) is provided in Appendix 4.1. Sediment analysis Table 4.1 lists the specific physical and chemical parameters measured in surficial sediments collected for the Local Sediment Chemistry Trends monitoring program. All chemical analyses for sediment samples were performed by the Sanitation Districts laboratories in accordance with the laboratory s standard operating procedures. The Sanitation Districts laboratories are certified by the State of California under the Environmental Laboratory Accreditation Program (ELAP). Specific procedures associated with sediment sample processing and analyses are provided as separate appendices. Briefly, grain size analysis was performed gravimetrically using a combination of sieve and pipette analyses (Appendix 4.2). Total organic carbon (TOC) was quantified using a carbonaceous analyzer (Appendix 4.3). Organic nitrogen was measured using titrimetric Kjeldahl distillation (Appendix 4.4) and dissolved sulfides (i.e. H 2 S) were quantified in the field using a sulfide specific electrode (Appendix 4.5). All trace metals, with the exception of mercury, were analyzed using inductively coupled plasma mass spectrometry (ICPMS; Appendix 4.6). Cold vapor atomic absorption spectroscopy was utilized for mercury quantification (Appendix 4.7). Chlorinated pesticides (DDTs and chlordanes) and PCBs were measured using a gas chromatograph combined with electron capture detectors (GC-ECD; Appendix 4.8). Data analysis All results from 2014 and 2015 are presented in summary tables. Interpretation of the physical properties and chemical sediment contamination data is focused on spatial distribution and temporal trends primarily as they relate to the proximity of the discharge and treatment period. The treatment periods used for this analysis are: Baseline ( ); Advanced Primary ( ); Partial Secondary ( ); Full Secondary ( ); and Current ( ). The Baseline period represents the first complete sediment 4.4
7 Table 4.1 Physical and Chemical Sediment Condition Parameters Required physical and chemical analyses for sediments collected under the Local Benthic Trends Survey. Pollutant class Conventional pollutants Trace metals DDTs Total DDTs PCBs Specific Parameters Analyzed in Group Grain size, total organic carbon (TOC), organic nitrogen, dissolved sulfides (H 2 S) Arsenic (As), Cadmium (Cd), Chromium (Cr), Copper (Cu), Lead (Pb), Mercury (Hg), Nickel (Ni), Silver (Ag), Zinc (Zn) 4,4 -DDT; 2,4 -DDT; 4,4 -DDE; 2,4 -DDE, 4,4 -DDD, 2,4 -DDD Sum of detectable DDTs Aroclor-1016, Aroclor-1221, Aroclor-1232, Aroclor-1242, Aroclor-1248, Aroclor-1254, Aroclor-1260 PCB congeners PCB congeners 18, 28, 37, 44, 49, 52, 66, 70, 74, 77, 81, 87, 99, 101, 105, 110, 114, 118, 119, 123, 126, 128, 138, 149, 151, 153, 156, 157, 158, 167, 168, 169, 170, 177, 180, 183, 187, 189, 194, 201, 206 Total PCBs Sum of detectable PCB (Aroclors) chemistry data obtained from the Palos Verdes shelf following more than 35 years of primary treated discharge. During the Advanced Primary period, improvements were made to solids removal and processing which greatly reduced the level of suspended solids in the discharge. Secondary treatment facilities went online in 1984 and provided biological (i.e. secondary) treatment to 60% of the total discharge (the remainder being advanced primary treated) representing the Partial Secondary period. Construction of additional biological treatment facilities to provide secondary treatment to 100% of the wastewater entering the JWPCP were completed in late 2002 and represents the level of treatment provided in the Full Secondary and Current treatment periods. The spatial distributions and temporal trends of conventional pollutants, trace metals, and total DDTs and PCBs are presented as contour maps or bubble plots depending on data availability where the average values for each treatment period are depicted within pollutant concentration ranges. Due to periodic changes in monitoring frequency, sampling locations, measured parameters, and analytical methods, the specific years and/or number of data points represented varies between constituents. RESULTS All NPDES permit required sediment samples for the 2014 and 2015 survey years were collected and analyzed. Results from for conventional pollutants, trace metals, and organic contaminants are provided in Tables 4.2, 4.3 and 4.4, respectively. Complete data sets for the 2014 and 2015 surveys, including individual constituents within the classes of organic contaminants, were submitted to the LARWQCB electronically in August of 2015 (LACSD 2015), and 2016 (LACSD 2016b), respectively. DISCUSSION The objectives of the local sediment contamination monitoring requirements in the NPDES permit are to assess trends in sediment pollutant concentrations within the current and historical influence of the discharge. The resulting physical and chemical data are used to make inferences concerning the relationship between effluent-derived habitat alteration and patterns of infaunal (Chapter 5) and epibenthic (Chapter 6) community structure. Further, these data are used to assess potential sources of 4.5
8 Table 4.2 Conventional Pollutants in Palos Verdes Sediments, Porewater Hydrogen sulfide (H 2 S; mg/l porewater), total organic carbon (TOC; % dry weight), organic nitrogen (% dry weight), and mean grain size (phi size) in surficial sediments collected from 44 stations (Figure 4.1) along Palos Verdes. Values preceded by a less than symbol (<) were below analytical detection. Min: Minimum, Max: Maximum. SD: Standard deviation. Station H 2 S TOC Organic Nitrogen Mean Grain Size A <0.02 < B <0.02 < C <0.02 < D <0.02 < A <0.02 < B <0.02 < C <0.02 < D <0.02 < A <0.02 < B <0.02 < C <0.02 < D <0.02 < A <0.02 < B <0.02 < C <0.02 < D <0.02 < A <0.02 < B < C <0.02 < D <0.02 < A <0.02 < B <0.02 < C <0.02 < D <0.02 < A <0.02 < B 0.03 < C <0.02 < D <0.02 < A <0.02 < B <0.02 < C <0.02 < D <0.02 < A <0.02 < B <0.02 < C < D <0.02 < A <0.02 < B <0.02 < C < D <0.02 < A <0.02 < B <0.02 < C <0.02 < D <0.02 < Min <0.02 < Max Mean SD
9 Table 4.3 Trace Metals in Palos Verdes Sediments, Arsenic, cadmium, chromium, copper, lead, mercury, nickel, silver, and zinc concentrations (mg/kg dry weight) in surficial sediments collected from 44 stations in 2014 and 24 stations in 2015 (Figure 4.1) along Palos Verdes. Min: Minimum, Max: Maximum, SD= Standard deviation. NS= Not sampled. Station Arsenic Cadmium Chromium Copper Lead A 9.40 NS 1.40 NS 90.6 NS 40.9 NS 25.3 NS 0B C D A 8.08 NS 3.40 NS 95.4 NS 45.8 NS 28.4 NS 1B C D A 7.30 NS 1.90 NS 71.5 NS 33.1 NS 18.2 NS 2B 8.68 NS 2.40 NS 79.3 NS 30.1 NS 23.0 NS 2C 10.5 NS 1.80 NS 79.0 NS 31.9 NS 22.1 NS 2D 8.30 NS 0.75 NS 21.6 NS 3.7 NS 4.60 NS 3A 6.88 NS 2.60 NS 81.4 NS 40.2 NS 23.2 NS 3B C D A 8.34 NS 2.40 NS 79.8 NS 41.0 NS 23.1 NS 4B 15.1 NS 8.20 NS 231 NS 127 NS 72.4 NS 4C 8.66 NS 2.10 NS 77.4 NS 41.8 NS 25.0 NS 4D 8.84 NS 2.00 NS 45.0 NS 18.6 NS 13.1 NS 5A 8.11 NS 3.20 NS 124 NS 58.0 NS 37.7 NS 5B C D A 10.2 NS 3.50 NS 109 NS 53.8 NS 29.7 NS 6B C D A 7.66 NS 1.80 NS 66.2 NS 36.4 NS 16.6 NS 7B C D A 12.3 NS 4.70 NS 140 NS 78.5 NS 39.1 NS 8B C D A 9.90 NS 3.10 NS 117 NS 64.2 NS 30.9 NS 9B C D A 6.44 NS 0.94 NS 48.0 NS 27.7 NS 14.5 NS 10B 6.58 NS 0.69 NS 41.8 NS 22.4 NS 13.6 NS 10C 11.8 NS <0.40 NS 31.8 NS 13.5 NS 10.7 NS 10D 6.55 NS 0.72 NS 25.5 NS 11.6 NS 8.50 NS Min < Max Mean SD
10 Table 4.3 Trace Metals in Palos Verdes Sediments, (Continued) Arsenic, cadmium, chromium, copper, lead, mercury, nickel, silver, and zinc concentrations (mg/kg dry weight) in surficial sediments collected from 44 stations in 2014 and 24 stations in 2015 (Figure 4.1) along Palos Verdes. Min: Minimum, Max: Maximum, SD= Standard deviation, NS= Not sampled. Station Mercury Nickel Silver Zinc A 0.34 NS 29.1 NS 1.65 NS 82.0 NS 0B C D < A 0.29 NS 22.2 NS 1.22 NS 131 NS 1B C D A 0.19 NS 22.0 NS 0.73 NS 79.6 NS 2B 0.16 NS 19.7 NS 0.74 NS 92.8 NS 2C 0.18 NS 23.7 NS 0.72 NS 87.2 NS 2D <0.02 NS 6.50 NS <0.20 NS 19.0 NS 3A 0.26 NS 21.5 NS 0.99 NS 96.7 NS 3B C D A 0.25 NS 22.2 NS 1.01 NS 95.7 NS 4B 0.80 NS 29.1 NS 3.58 NS 265 NS 4C 0.24 NS 24.5 NS 0.96 NS 93.8 NS 4D 0.08 NS 21.1 NS 0.34 NS 60.2 NS 5A 0.37 NS 22.9 NS 1.60 NS 140 NS 5B C D A 0.33 NS 22.8 NS 1.36 NS 142 NS 6B C D A 0.22 NS 21.6 NS 0.68 NS 83.2 NS 7B C D A 0.43 NS 28.7 NS 2.23 NS 164 NS 8B C D A 0.37 NS 26.6 NS 1.64 NS 134 NS 9B C D A 0.14 NS 18.4 NS 0.44 NS 73.9 NS 10B 0.21 NS 15.8 NS 0.33 NS 66.1 NS 10C 0.06 NS 11.6 NS <0.40 NS 57.1 NS 10D 0.06 NS 11.0 NS <0.20 NS 47.3 NS Min < < Max Mean SD
11 Table 4.4 Organic Contaminants in Palos Verdes Sediments, Total DDTs (mg/kg dry weight), total PCBs (mg/kg dry weight) and total PCB Congener in surficial sediments collected from 44 stations (Figure 4.1) along Palos Verdes. Total concentrations represent the sum of all detectable compounds within the class as defined in Table 4.1. ND indicates that none of the targeted compounds within the class were detected. Min: Minimum, Max: Maximum, SD: Standard deviation, NS= Not sampled. Station Total DDTs Total PCBs A 0.43 NS ND NS 0B ND 0C ND ND 0D ND ND 1A 2.00 NS 0.38 NS 1B C D ND ND 2A 0.94 NS 0.09 NS 2B 1.23 NS 0.16 NS 2C 0.90 NS 0.13 NS 2D 0.08 NS ND NS 3A 1.59 NS 0.31 NS 3B C D ND A 1.11 NS 0.28 NS 4B 3.75 NS 0.78 NS 4C 1.30 NS 0.29 NS 4D 0.50 NS ND NS 5A 4.20 NS 0.70 NS 5B C D ND ND 6A 2.14 NS 0.50 NS 6B C D ND ND 7A 0.71 NS ND NS 7B C D ND ND 8A 2.12 NS 0.24 NS 8B C D ND ND 9A 2.66 NS 0.24 NS 9B C ND 9D ND ND 10A 0.46 NS ND NS 10B 0.40 NS ND NS 10C 0.34 NS ND NS 10D 0.26 NS ND NS Min ND ND Max Mean SD
12 bioaccumulative compounds in fish that may pose a threat to human or wildlife health (Chapter 7). The following discussion provides the spatial distribution and temporal change of sediment condition in relation to the history of effluent quality and proximity to the discharge. Spatial patterns, Conventional pollutants Average surface sediment distribution patterns for conventional pollutants measured during the 2014 and 2015 sampling period are displayed in the last row of contour maps on Figure 4.2. Mean grain size was primarily a function of depth. Coarser sediments (lower phi), including some very coarse relict red sands at station 2D, are found nearshore becoming finer with increasing depth. This distribution is driven by a gradient of physical disturbance, which is greatest in the nearshore due to wave energy and land based runoff. Contrary to this pattern, a patchy zone of finer grained silt and clay was found adjacent to and northwest of the outfalls, particularly at shelf depth (Figure 4.2). This finer grained material is assumed to be remnant particulate matter discharged from the outfall, mostly prior to implementation of full secondary treatment in 2002 that reduced the mass emission of suspended solids to very low levels (Figure 1.2). Another area of fine sediment was identified to the extreme northwest of the sampling grid (stations 0A and 0B) within the Redondo submarine canyon. Submarine canyons are natural collection areas for finer sediments and organic matter. Detailed assessment of grain size distributions and spatial patterns for percent sand, silt and clay are provided in Appendix 4.9. Elevated concentrations of organic nitrogen and total organic carbon were also detected in surficial sediment samples in the vicinity of the outfall (Figure 4.2). This finding further supports the assertion that the origin of fine grain sediments near the outfall is remnant particulate matter associated with the discharge. The highest TOC results were measured at 61 m water depth stations near the discharge (8C). Lower TOC results were measured along the 30 m isobath stations, especially to the east of the outfall during the 2014 and 2015 surveys. Hydrogen sulfide is generated by sulfatereducing bacteria that convert free sulfate ions (SO 4-2 ) to H 2 S under anaerobic conditions. Anaerobic conditions often exist in organically rich sediments where oxidizing-bacteria have depleted the available oxygen in the sediments. Most porewater H 2 S concentrations in 2014 and 2015 were <0.02 mg/l or slightly above the detection limits. Station 6B had slightly elevated levels of H 2 S in 2014 (Table 4.2). The maximum concentration of H 2 S analyzed in 2015 was 0.20 mg/l at station 8C. The resulting spatial pattern of H 2 S is consistent with sediments enriched with historically discharged organic material. It is unknown what the relative contributions are from past and present discharges to the generation of H 2 S sporadically observed in porewater of surface sediments. However, given the extremely low concentrations of suspended solids in the current JWPCP discharge (Figure 1.2), it is unlikely that sufficient organic matter to induce H 2 S generation is currently being deposited to the seafloor by the discharge. Trace metals and organic contaminants Nine trace metals and two classes of organic contaminants (Table 4.1) were measured in Palos Verdes sediments at 44 sites in 2014 and 24 sites in Results for all trace metals and organic contaminants during sampling period are listed in Table 4.3 and 4.4, respectively. Representative trace metals (Cd, Cu, Pb, and Hg) from the averaged results of 2014 and 2015 are presented as contour maps in the bottom row of Figure 4.3 while the summed totals for DDTs and PCBs are displayed in the far right panels of Figure 4.4. Isobath related spatial profiles of all measured trace metals (As, Cd, Cr, Cu, Pb, Hg, Ni, Ag and Zn) are provided in Appendix Contour maps for As, Ni, Cr, Ag, and Zn are provided in Appendix In general, trace metals and organic contaminants share the same spatial distribution within the monitoring area. Specifically, the highest concentrations are measured proximal to and offshore of the outfalls. Concentrations typically 4.10


13 Figure 4.2 Spatial and Temporal Trends of Conventional Pollutants Spatial and temporal trends in average sediment concentrations over the treatment periods for mean grain size, organic nitrogen, total organic carbon and hydrogen sulfide. Total organic carbon was not measured from 1972 to 1983 (NS). 4.11

14 Figure 4.3 Spatial and Temporal Trends of Trace Metals Spatial and temporal trends in average sediment concentrations over the treatment periods of representative trace metals in Palos Verdes surficial sediments (top two centimeters). ND= Below detection level. 4.12


15 Figure 4.4 Spatial and Temporal Trends of DDTs and PCBs Spatial and temporal trends in average sediment concentrations over the treatment periods of total DDTs and PCBs in Palos Verdes surficial sediments (top two centimeters). Contour maps represent samples were collected at 44 stations. Bubble plots represent limited data available during the sampling period. NS= Not sampled. ND= Below detection level. decline rapidly to the southeast and more gradually to the northwest of the outfall. This pattern is consistent with that observed for conventional pollutants and indicates the JWPCP discharge was a significant source of these contaminants to the sediments along Palos Verdes in the past. However, concentrations of these contaminants in the current effluent discharge have greatly declined since the early 1970s. Effluent concentrations of arsenic (As) have declined by more than 90% and the remainder of monitored trace metals (Cd, Cr, Cu, Pb, Hg, Ni, Ag and Zn) by more than 97% since 1972 when the Advanced Primary treatment began (Figure 1.3). Compliance monitoring for total PCBs in JWPCP effluent samples (Chapter1) were below analytical detection limits in 2014 and 2015 (Table 4.4; LACSD 2015, LACSD 2016b). Further, the 95% reduction in suspended solids in the discharge now as compared to 1971 has minimized the potential for these pollutants to adhere to particulate matter and be delivered to the seafloor in the immediate vicinity of the outfalls. Therefore, it is presumed that the contaminants found in surficial sediments are primarily a legacy of historical discharges prior to the implementation of full secondary treatment in Contaminant concentrations in sediments collected from the 2013 Regional Monitoring Survey stations were summarized in the Bight 13 Sediment Chemistry assessment report. Although the concentration of the class of flame retardant chemicals known as polybrominated diphenyl ethers (PBDEs) has dropped by 92% in Southern California Bight embayments over a five-year period, and by 50% offshore, the concentrations of legacy contaminants such as DDTs, PCBs and metals remain largely 4.13
16 unchanged (Dodder et al. 2016). The Santa Monica Bay National Estuary Program (SMBNEP) also examined the soft-bottom habitat conditions for DDT, PCBs and mercury throughout the Santa Monica Bay and Palos Verdes shelf using percent of surface area in each class of contaminant concentration as defined by either Total Maximum Daily Loads (TMDLs) targets for DDT and PCBs or regional results from the Bight 08 study for mercury. Based on the scores for all these indicators, the overall score for structure and ecological disturbance is fair and the conditions for DDT, PCBs and mercury are improving (Bay et al., 2015). Temporal trends In the early 1970s, the Sanitation Districts began to monitor sediment condition with selected parameters and sampling sites. Data gaps were found in the early years (e.g.: Transect 0 was not sampled until 1973; the first surveys for total DDT and metals were 1973 and 1974, respectively). However, significant improvement in sediment quality was observed due to improved wastewater treatment practices during the past four decades (Chapter 1). Depending on data availability, the discussion of temporal trends is categorized by Baseline (1973/1974), Advanced Primary Treatment ( ), Partial Secondary Treatment (1984/ ), Full Secondary Treatment ( ), and the Current years ( ). Results for individual parameters are presented in Figure 4.2, Figure 4.3 and Figure 4.4. Conventional pollutants Surface sediment concentrations of conventional pollutants are much lower than four decades ago, confined to a much smaller area, and increasingly focused on the outfall termini. Figure 4.2 illustrates the sequence of changes in concentration and spatial patterns of grain size, surface sediment organic nitrogen, TOC and H 2 S between 1973 and This trend indicates that organically enriched particulate matter historically deposited in surface sediments along the majority of the Palos Verdes shelf and slope has largely been remediated. This reduction is primarily due to the combination of reduced mass emissions of organically enriched suspended solids and decomposition of organic matter by microbes, invertebrates, and fish. Burial and downcurrent transport of surface sediments, as a result of sediment resuspension (at varying rates by wave action or storms) have also played a significant role in these reductions. These processes have resulted in the emergence of a more natural pattern of grain size distribution. Coarser sediment (<4 phi) was found near the east side of the outfall discharge since Historically, even the very coarse relict red sands near station 2D were inundated with finer particulate matter, presumably from the JWPCP discharge. However, the pattern has been changed through the Partial Secondary and Full Secondary period. Depth, which is inversely proportional to physical disturbance, became the primary determinant of mean grain size, except in the immediate vicinity of the outfall. Since 1973, the concentration of organic nitrogen in Palos Verdes surface sediments has decreased substantially until there is only a remnant of slightly enriched sediment in the immediate area offshore and downcurrent of the discharge. A similar, but more variable, trend can be observed in the TOC time series data. The concentration and spatial extent of H 2 S in sediments also declined considerably since the mid-1980s. Hydrogen sulfide observed sporadically in recent years is most likely derived from historic deposits of discharged organic matter. Trace metals and organic contaminants Historical monitoring of trace metals and organic contaminants has been less consistent than conventional pollutants due to changing permit requirements. Consequently, the specific years available to evaluate temporal trends are much more variable and occasionally limited, particularly for the organic contaminants. Despite these limitations, a general trend very similar to 4.14
17 that displayed by the conventional pollutants is clearly evident. Elevated concentrations of trace metals in surface sediments were widespread throughout the monitoring area in the Baseline period (Figure 4.3; Appendix 4.11). Bubble plots for the year of 1980 (Advanced Primary) represented high concentrations of the metals at the 61 and 152 meter stations. By the Partial Secondary period, concentrations began to decline in shallow water and with distance from the outfall in deeper water. The concentration gradient in sediments to the southeast (upcurrent) of the outfall declined rapidly with distance while to the northwest (downcurrent) the gradient was more gradual. This pattern of decline continued through the Full Secondary period until the Current period where elevated concentrations of trace metals are generally restricted to the immediate vicinity of the outfall. Given the historical sampling at station 8C may cause patchiness in the analytical results, total PCBs concentration measured at station 8C in 2014 survey (7.39 mg/kg, dry weight) was nearly two folds higher than its previous 10-year average (3.75 mg/kg, dry weight). However, the result of 2015 survey at station 8C for total PCBs was significantly lower (4.54 mg/kg, dry weight) than the 2014 survey. Although sampling for DDTs and PCBs were not conducted during the Advance Primary and Baseline treatment periods, respectively, similar temporal responses are observed for these organic pollutants (Figure 4.4). The primary processes responsible for the reductions in surface sediment contamination over time are identical to those identified for conventional pollutants. The greatly reduced mass emissions of suspended solids since 1972 (Figure 1.2) combined with the Sanitation Districts comprehensive industrial waste pretreatment program (Chapter 1) have significantly reduced the loading of these trace metals and organic compounds to the sediments. Besides the loading decrease, decomposition of organic matter in the sediments by bacteria and other fauna resulted in varying degrees of biodegradation of organic contaminants and/or assimilation into biota, which have removed these constituents from the area (Eganhouse and Pontolillo 2008). Burial and downcurrent transport of surface sediments due to re-suspension and redeposition by wave action or storms were also factors in redistribution of legacy toxicants within the monitoring area. CONCLUSIONS For more than 77 years, the Sanitation Districts have discharged treated wastewater to the Palos Verdes shelf. The effluent inputs of suspended solids and trace constituents (such as organics and metals) had created a zone of finegrained sediments highly enriched in organic matter and contaminants by the early 1970s. An outfall-centered gradient of sediment quality was created with the highest concentrations of contaminants found near the discharge. As a result of treatment upgrades initiated in the early 1970s, the final effluent quality improved dramatically (Chapter 1). This resulted in great improvements in surface sediment quality across the Palos Verdes shelf and slope. The magnitude and geographic extent of elevated organic nitrogen, trace contaminants, finegrained sediments, and porewater hydrogen sulfide have decreased since the early 1970s. These changes first occurred on the more physically energetic inner shelf followed by gradual reductions in sediment organic matter and trace contaminants on the outer shelf and on the slope. In the 2014 and 2015 surveys, Palos Verdes sediments near, northwest, and offshore of the outfall system were finer grained and marginally enriched with organic nitrogen and total organic carbon compared to reference sediments. This region also contains the highest levels of chemical contamination. Porewater hydrogen sulfide levels were generally very low and spatially confined to small areas. Although the relative contributions of historic versus contemporary wastewater discharge to surface sediment quality are not easily separated, the extremely low concentrations of pollutants in the 4.15
18 current JWPCP effluent discharge make it much more likely that legacy discharges, preserved in a partly buried sediment reservoir, are the key contributor to the character of surface sediments today. LITERATURE CITED Bay S., Dojiri M., Gully J State of the Bay Report. Habitat Conditions: Soft-Bottom Benthos. Urban Coast 5(1): CH2M Hill Palos Verdes Shelf Superfund site remedial investigation report. Santa Ana, CA: Prepared for United States Environmental Protection Agency, Region 9, EPA contract number 68-W Dodder N., Schiff K., Latker A., Tang C-L Southern California Bight 2013 Regional Monitoring Program: Volume IV. Sediment Chemistry. Technical Report 922. Costa Mesa, CA: Southern California Coastal Water Research Project. Eganhouse RP, Pontolillo J DDE in sediments of the Palos Verdes Shelf, California: in situ transformation rates and geochemical fate. Environmental Science and Technology 42( 17): Ferré B, Sherwood CR, Wiberg PL Sediment transport on the Palos Verdes shelf, California. Continental Shelf Research 30(7): Hampton MA, Karl HA, Murray CJ Acoustic profiles and images of the Palos Verdes margin: implications concerning deposition from the White's Point outfall. In: Lee HJ, Wilber, PL, editor. Sedimentation processes, DDT, and the Palos Verdes margin. Continental Shelf Research. p Hendricks TJ Currents in the Los Angeles area. In: Bascom W, editor. Southern California Coastal Water Research Project biennial report Long Beach, CA: Southern California Coastal Water Research Project; p Kayen RE, Lee HJ, Hein JR Influence of the Portuguese Bend landslide on the character of the effluent-affected sediment deposit, Palos Verdes margin, southern California. Continental Shelf Research 22(6-7): Lee HJ The distribution and character of contaminated effluent-affect sediment, Palos Verdes margin, southern California. Menlo Park, CA: United States Geological Survey. Lee HJ, Sherwood CR, Drake DE, Edwards BD, Wong F, Hamer M Spatial and temporal distribution of contaminated, effluent-affected sediment on the Palos Verdes margin, southern California. In: Lee HJ, Wilber PL, editors. Continental Shelf Research 22(6-7): Lee HJ, Wilberg PL Sedimentation processes, DDT, and the Palos Verdes margin. Continental Shelf Research 22(6-7): [LACSD] Los Angeles County Sanitation Districts Palos Verdes ocean monitoring annual report Whittier, CA: Los Angeles County Sanitation Districts, Ocean Monitoring and Research Group, Technical Services Department. [LACSD] Los Angeles County Sanitation Districts Joint Water Pollution Control Plant biennial receiving water monitoring report Whittier, CA: Los Angeles County Sanitation Districts, Ocean Monitoring and Research Group, Technical Services Department. [LACSD] Los Angeles County Sanitation Districts Joint Water Pollution Control Plant special study final report: Fine-scale assessment of the DDT contamination gradient near the LACSD outfall. Whittier, CA: Los Angeles County Sanitation Districts, Ocean Monitoring and Research Group, Technical Services Department. [LACSD] Los Angeles County Sanitation Districts annual receiving water data summary report [compact 4.16
19 disk]. Whittier, CA: Los Angeles County Sanitation Districts, Ocean Monitoring and Research Group, Technical Services Department. [LACSD] Los Angeles County Sanitation Districts. 2016a. Joint Water Pollution Control Plant biennial receiving water monitoring report Whittier, CA: Los Angeles County Sanitation Districts, Ocean Monitoring and Research Group, Technical Services Department. [LACSD] Los Angeles County Sanitation Districts. 2016b annual receiving water data summary report [compact disk]. Whittier, CA: Los Angeles County Sanitation Districts, Ocean Monitoring and Research Group, Technical Services Department. Sediment Dynamics Workshop Group Environmental processes affecting DDT contaminated sediments off Palos Verdes, California. Kolpack, RL (editor). Pomona, CA: Los Angeles County Sanitation Districts and the US Environmental Protection Agency, Region IX. [SCCWRP] Southern California Coastal Water Research Project Southern California Bight Regional Marine Monitoring Survey (Bight 13) Contaminant Impact Assessment Workplan. Costa Mesa, CA: Southern California Coastal Water Research Project. Stull JK, Baird RB, Heesen TC Marine sediment core profiles of trace constituents offshore of a deep wastewater outfall. Journal of the Water Pollution Control Federation 58(10): [USEPA] United States Environmental Protection Agency Revised final data report for the fall 2009 sediment sampling program, Palos Verdes shelf (OU 5 of the Montrose chemical corporation superfund site), Los Angeles county, California. EPA Contract No. EP- S San Francisco, CA: U.S. Environmental Agency, Region, IX. Wiberg PL, Drake DE, Harris CK, Noble M Sediment transport on the Palos Verdes shelf over seasonal to decadal time scales. In: Lee HJ WP, editor. Sedimentation processes, DDT, and the Palos Verdes margin. Continental Shelf Research 22(6-7): Wu Y, Washburn L, Jones BH Buoyant plume dispersion in a coastal environment: evolving plume structure and dynamics. Continental Shelf Research 14(9):
20 This page intentionally left blank
Results of a Sediment Survey in the Near Offshore Waters of the Proposed Quarry Site in the Vicinity of Whites Cove, Digby Neck, Nova Scotia
 Results of a Sediment Survey in the Near Offshore Waters of the Proposed Quarry Site in the Vicinity of Whites Cove, Digby Neck, Nova Scotia Prepared for Paul G. Buxton P.O. Box 98 Annapolis Royal, Nova
Sediment Distribution and Characteristics
 Sediment Distribution and Characteristics Sediments at the bottom of ponds are a source or sink for nutrients in relation to the water column, contribute to turbidity during storm events, serve as the
Akvaplan-niva rapport
 Grunnlagsundersøkelse på Snøhvit og Område C i Barentshavet, 2003 Akvaplan-niva rapport APN-411.2785-1 Introduction Statoil and Norsk Hydro commissioned Akvaplan-niva AS to perform baseline surveys at
Sediment Quality Improvements Through Science Based Management Actions
 Sediment Quality Improvements Through Science Based Management Actions Andrew Jirik, Port of Los Angeles James Vernon, Port of Long Beach May 30, 2014 Strategy Ports developed a 6 year program to develop
Environmental Implications A Case Study
 Grain Size Variations and Its Environmental Implications A Case Study DR PURANDARA BEKAL SCIENTIST, NATIONAL INSTITUTE OF HYDROLOGY HARD ROCK REGIONAL CENTER HANUMAN NAGAR BELGAUM, KARNATAKA Particle Transport
Figure 1 a. The location of Reay Creek and Reay Creek Pond on northern Saanich Peninsula
 Figure 1 a. The location of Reay Creek and Reay Creek Pond on northern Saanich Peninsula Victoria Airport Reay Creek Pond Sidney Reay Creek & Pond Bazan Bay Figure 1 b. Reay Creek & Pond showing Core Locations
Environmental impact assessment study of the new offshore dumping sites for Šventoji port in Lithuania
 Environmental impact assessment study of the new offshore dumping sites for Šventoji port in Lithuania Introduction Summary In 2003 Lithuanian Ministry of Transport initiated the preparation of feasibility
Source Control Early Action Focused Feasibility Study
 Source Control Early Action Focused Feasibility Study Empirical Mass Balance Model Results or the Lower Passaic River Edward A. Garvey, PhD, PG Malcolm Pirnie, Inc. Remedial Options Workgroup Meeting June
Section 8 Results Toxicity
 Section 8 Results Toxicity Summary of Toxicity Test Results Most samples collected from Mission Bay were not significantly toxic to bivalve larvae or amphipods. When present, however, toxicity was greatest
PCB Aroclor Concentrations in Puget Sound Sediments
 PCB Aroclor Concentrations in Puget Sound Sediments Margaret Dutch, Sandra Aasen and Edward R. Long Washington State Department of Ecology Environmental Assessment Program [Editor s note: Tables and Figures
Biological Response to the Gold King Mine Release in the Animas and San Juan Rivers
 Biological Response to the Gold King Mine Release in the and San Juan Rivers Lareina Guenzel 1, Richard Mitchell, PhD 1, Kate Sullivan, PhD 2, and Michael Cyterski, PhD 2 1 U.S. Environmental Protection
Sediment Characterization and Metal Bioavailability within a Range Complex, MCRD Parris Island, South Carolina. 6 May 2009
 Sediment Characterization and Metal Bioavailability within a Range Complex, MCRD Parris Island, South Carolina 1 6 May 2009 Contributing Authors Daniel Tomczak, CH2M HILL, Raleigh, North Carolina Kristen
Use of benthic invertebrate biological indicators in evaluating sediment deposition impairment on the Middle Truckee River, California
 Use of benthic invertebrate biological indicators in evaluating sediment deposition impairment on the Middle Truckee River, California David B. Herbst Sierra Nevada Aquatic Research Laboratory University
2014 Sewage Treatment System Impact Monitoring Program Interpretive Report. Volume 4 Ocean Sediment Program report
 2014 Sewage Treatment System Impact Monitoring Program Interpretive Report Volume 4 Ocean Sediment Program report 2014 Sewage Treatment System Impact Monitoring Program Volume 4 Ocean Sediment Program
Relationship between rainfall and beach bacterial concentrations on Santa Monica Bay beaches
 85 IWA Publishing 2003 Journal of Water and Health 01.2 2003 Relationship between rainfall and beach bacterial concentrations on Santa Monica Bay beaches Drew Ackerman and Stephen B. Weisberg ABSTRACT
Stickney Avenue Depositional Zone (SADZ) Investigation
 Investigation") The Ottawa River: A Report to the Community Stickney Avenue Depositional Zone (SADZ) Investigation May 22, 2007 Presented by: Scott Bell, P.E., BCEE (LimnoTech) Kelly Bensman (Hull & Associates) SADZ Location
The Ottawa River: A Report to the Community Stickney Avenue Depositional Zone (SADZ) Investigation May 22, 2007 Presented by: Scott Bell, P.E., BCEE (LimnoTech) Kelly Bensman (Hull & Associates) SADZ Location
Dynamic preservation of the coastline
 Dynamic preservation of the coastline Content Introduction The Dutch coastal defence by dynamic processes Data collection Management of the sand resources Growing importance of marine sand and gravel resources
Environmental Resources Management
 Figure 1: Concentration of Metals and Metalloid (Cr, Cu, Ni, Pb, Zn, As; mean +SD) in sediment samples collected from Pit Specific Sediment Chemistry Monitoring for CMP 1 in January 2014. Figure 2: Concentration
Coastal Mixing and Optics
 Coastal Mixing and Optics W. Scott Pegau College of Oceanic and Atmospheric Sciences Ocean. Admin. Bldg. 104 Oregon State University Corvallis, OR 97331-5503 Phone: (541) 737-5229 fax: (541) 737-2064 email:
Physiography Ocean Provinces p. 1 Dimensions p. 1 Physiographic Provinces p. 2 Continental Margin Province p. 2 Deep-Ocean Basin Province p.
 Physiography Ocean Provinces p. 1 Dimensions p. 1 Physiographic Provinces p. 2 Continental Margin Province p. 2 Deep-Ocean Basin Province p. 2 Mid-Ocean Ridge Province p. 3 Benthic and Pelagic Provinces
Name: Period: Date: ID: A. Circle the choice that best completes the statement or answers the question and write the letter on the blank.
 Name: Period: _ Date: _ ID: A Unit 7 Practice Circle the choice that best completes the statement or answers the question and write the letter on the blank. 1. What term describes the movement of rock
Earth / Environmental Science. Ch. 14 THE OCEAN FLOOR
 Earth / Environmental Science Ch. 14 THE OCEAN FLOOR The Blue Planet Nearly 70% of the Earth s surface is covered by the global ocean It was not until the 1800s that the ocean became an important focus
B-1. Attachment B-1. Evaluation of AdH Model Simplifications in Conowingo Reservoir Sediment Transport Modeling
 Attachment B-1 Evaluation of AdH Model Simplifications in Conowingo Reservoir Sediment Transport Modeling 1 October 2012 Lower Susquehanna River Watershed Assessment Evaluation of AdH Model Simplifications
Rapid Geomorphic Assessments: RGA s
 Establishing Current Reference Conditions Rates and concentrations of suspended-sediment transport vary over time and space due to factors such as precipitation characteristics and discharge, geology,
November 13, 2013 File No:
 November 13, 2013 File No: 31-300.25 Mr. Sam Unger, Executive Officer California Regional Water Quality Control Board Los Angeles Region 320 W. 4 th St., Suite 200 Los Angeles, CA 90013 Attn: Information
Microplastics in the marine environment of coastal British Columbia
 Microplastics in the marine environment of coastal British Columbia Jean-Pierre Desforges 1, Moira Galbraith 2, Neil Dangerfield 2, Peter Ross 1 1 School of Earth and Ocean Sciences, University of Victoria,
Marine Sediments. Introductory Oceanography. Ray Rector: Instructor
 Marine Sediments Introductory Oceanography Ray Rector: Instructor Ocean Basins are Vast Sinks for Huge Amounts of Sediment from Numerous Different Sources Four Major Types of Seafloor Sediments 1. Lithogenous
TPDES: Soil, Erosion and Sedimentation Methods
 SAWS TPDES: Soil, Erosion and Sedimentation Methods Philip Handley Supervisor-Resource Protection & Compliance August 25, 2014 TPDES: Soil, Erosion and Sedimentation Methods Soil Common term: Dirt Common
Remedial Investigation of Sediments in NJDEP s Site Remediation and Waste Management Program
 Remedial Investigation of Sediments in NJDEP s Site Remediation and Waste Management Program Nancy Hamill Bureau of Environmental Evaluation and Risk Assessment nancy.hamill@dep.nj.gov 609-633-1353 NJ
2015 Toxicity Testing of BEAR CREEK SEDIMENT
 2015 Toxicity Testing of BEAR CREEK SEDIMENT Sparrows Point Meeting Sollers Pt / Dundalk Public Library DECEMBER 16TH, 2015 LANCE YONKOS / SHARON HARTZELL PAST INVESTIGATIONS: 2004 Reported toxicity in
Status Report on Polychlorinated Biphenyls in the Western Storm Drain University of California, Richmond Field Station Richmond, California
 Status Report on Polychlorinated Biphenyls in the Western Storm Drain University of California, Richmond Field Station Richmond, California Introduction Beginning in 1999, the University of California,
Heavy Metals in Water and Bottom Sediments of Odessa Region of the Black Sea
 Journal of Shipping and Ocean Engineering 5 (2015) 51-58 doi: 10.17265/2159-5879/2015.02.001 D DAVID PUBLISHING Heavy Metals in Water and Bottom Sediments of Odessa Region of the Black Sea Sergey Yevgenevich
Sediment characteristics of Beaver Lake and implications for remediation; A Pilot Project.
 Sediment characteristics of Beaver Lake and implications for remediation; A Pilot Project. Delphine Faugeraux Leah Bendell A report to the Stanley Park Ecological Society. September 15 th 2011. Abstract
The Coast: Beaches and Shoreline Processes
 1 2 3 4 5 6 7 8 9 The Coast: es and Shoreline Processes Trujillo & Thurman, Chapter 10 Oceanography 101 Chapter Objectives Recognize the various landforms characteristic of beaches and coastal regions.
Spatial and Temporal distribution of metals in sediments of a tropical lagoon, SW coast of India: Environmental Indicators ABSTRACT
 Spatial and Temporal distribution of metals in sediments of a tropical lagoon, SW coast of India: Environmental Indicators C.P. Priju 1 and A.C. Narayana 2 * 1 Department of Marine Geology & Geophysics
The Coast: Beaches and Shoreline Processes Trujillo & Thurman, Chapter 10
 The Coast: es and Shoreline Processes Trujillo & Thurman, Chapter 10 Oceanography 101 Chapter Objectives Recognize the various landforms characteristic of beaches and coastal regions. Identify seasonal
What is weathering and how does it change Earth s surface? Answer the question using
 7 th Grade Lesson What is weathering and how does it change Earth s surface? Answer the question using the sentence frame. You have 4 minutes. Weathering is. This changes the Earth s surface because. 1
ARE YOU READY TO THINK? Look at the first slide THINK PAIR SHARE!
 ARE YOU READY TO THINK? Look at the first slide THINK PAIR SHARE! WHAT PROMINENT FEATURE CAN YOU IDENTIFY IN THIS PICTURE? What do you think the different colors represent? Who might find such a picture
The Marine Environment
 The Marine Environment SECTION 16.1 Shoreline Features In your textbook, read about erosional landforms, beaches, estuaries, longshore currents, and rip currents. For each statement below, write true or
Regional-scale understanding of the geologic character and sand resources of the Atlantic inner continental shelf, Maine to Virginia
 Regional-scale understanding of the geologic character and sand resources of the Atlantic inner continental shelf, Maine to Virginia Workshop on Dredging, Beach Nourishment and Bird Conservation Atlantic
Appendix K.2: Sediment Management Excerpt from South Orange County Hydromodification Management Plan
 Appendix K.2: Sediment Management Excerpt from South Orange County Hydromodification Management Plan 4 Sediment Supply Management Requirements Permit Order R9-2013-0001 as amended by Order No. R9-2015-0001Section
Sediment Transport and Strata Formation in the Adriatic Sea
 Sediment Transport and Strata Formation in the Adriatic Sea Wayne R. Geyer James D. Irish Peter A. Traykovski Woods Hole Oceanographic Institution Woods Hole, MA 02543 Tel. (508) 289-2868, Fax: (508) 457-2194,
Foundations of Earth Science, 6e Lutgens, Tarbuck, & Tasa
 Foundations of Earth Science, 6e Lutgens, Tarbuck, & Tasa Oceans: The Last Frontier Foundations, 6e - Chapter 9 Stan Hatfield Southwestern Illinois College The vast world ocean Earth is often referred
Objectives: Define Relative Age, Absolute Age
 S6E5. Students will investigate the scientific view of how the earth s surface is formed. c. Classify rocks by their process of formation. g. Describe how fossils show evidence of the changing surface
Heather Schlosser Army Corps of Engineers Coastal Studies Group August 28, 2008
 Got sand? Regional Sediment Management in Orange County Heather Schlosser Army Corps of Engineers Coastal Studies Group August 28, 2008 Regional Sediment Management Regional sediment management recognizes
Distribution of Anthropogenic and Natural Debris on the Mainland Shelf of the Southern California Bight
 Distribution of Anthropogenic and Natural Debris on the Mainland Shelf of the Southern California Bight SHELLY L. MOORE* and M. JAMES ALLEN Southern California Coastal Water Research Project, 7171 Fenwick
Fate of historic metal releases from the Coeur d Alene mining district Northern Idaho
 Fate of historic metal releases from the Coeur d Alene mining district Northern Idaho Stephen E. Box US Geological Survey U.S. Metal Production Coeur d'alene, ID Butte, MT Tintic-East Tintic, UT Ag (10
Estimated Sediment Volume: Bridge Street Dam Impoundment, Royal River, Yarmouth, Maine
 University of Southern Maine USM Digital Commons Publications Casco Bay Estuary Partnership (CBEP) 2015 Estimated Sediment Volume: Bridge Street Dam Impoundment, Royal River, Yarmouth, Maine Stantec Follow
Metals Sediment Study in Lower Newport Bay (Post-dredging) Final Report
 Final Report") Metals Sediment Study in Lower Newport Bay (Post-dredging) Final Report by Orange County Coastkeeper and Linda M. Candelaria, PhD for the Santa Ana Regional Water Quality Control Board March 2014 Page
Metals Sediment Study in Lower Newport Bay (Post-dredging) Final Report by Orange County Coastkeeper and Linda M. Candelaria, PhD for the Santa Ana Regional Water Quality Control Board March 2014 Page
GLY Coastal Geomorphology Notes
 GLY 4734 - Coastal Geomorphology Notes Dr. Peter N. Adams Spring 2011 2 Coastal Classification In this lecture, we discuss some successful classification schemes of the coastal landscape, and pay particular
SHORELINE AND BEACH PROCESSES: PART 2. Implications for Coastal Engineering
 SHORELINE AND BEACH PROCESSES: PART 2 Implications for Coastal Engineering Objectives of the lecture: Part 2 Show examples of coastal engineering Discuss the practical difficulties of ocean engineering
Case Study: Sediment Contamination by Mercury and DDT and Ecological Risk Assessment for Aquatic Biota, Lake Maggiore, Italy
 Intersol March 19th, 2014 Case Study: Sediment Contamination by Mercury and DDT and Ecological Risk Assessment for Aquatic Biota, Lake Maggiore, Italy CO-AUTHORED BY E Bizzotto and F Colombo PRESENTED
Lab 7: Sedimentary Structures
 Name: Lab 7: Sedimentary Structures Sedimentary rocks account for a negligibly small fraction of Earth s mass, yet they are commonly encountered because the processes that form them are ubiquitous in the
low turbidity high turbidity
 What is Turbidity? Turbidity refers to how clear the water is. The greater the amount of total suspended solids (TSS) in the water, the murkier it appears and the higher the measured turbidity. Excessive
IOP Conference Series: Earth and Environmental Science PAPER OPEN ACCESS
 IOP Conference Series: Earth and Environmental Science PAPER OPEN ACCESS Distributing Characteristics of Heavy Metal Elements in A Tributary of Zhedong River in Laowangzhai Gold Deposit, Yunnan (China):
June 2018 Sediments and Dredging at GBR Ports
 June 2018 Sediments and Dredging at GBR Ports Reef 2050 Long Term Sustainability Plan The Great Barrier Reef is over 2000 km long and covers an area of approximately 350,000 square kilometres. It is a
SEDIMENT QUALITY OF THE NY/NJ HARBOR SYSTEM
 APPENDICES FOR: SEDIMENT QUALITY OF THE NY/NJ HARBOR SYSTEM EPA/902-R-98-001 Darvene A. Adams U.S. Environmental Protection Agency - Region 2 Edison, NJ Joel S. O'Connor U.S. Environmental Protection Agency
Chapter 3 Sedimentation of clay minerals
 Chapter 3 Sedimentation of clay minerals 3.1 Clay sedimentation on land 3.2 From land to sea 3.3 Clay sedimentation in the sea 1 3.1 Clay sedimentation on land Deserts Glaciers Rivers Lacustrine 2 University
The Marine Environment
 The Marine Environment SECTION 16.1 Shoreline Features In your textbook, read about erosional landforms, beaches, estuaries, longshore currents, and rip currents. For each statement below, write or. 1.
14.2 Ocean Floor Features Mapping the Ocean Floor
 14.2 Ocean Floor Features Mapping the Ocean Floor The ocean floor regions are the continental margins, the ocean basin floor, and the mid-ocean ridge. 14.2 Ocean Floor Features Continental Margins A continental
Prof. Dr. Biljana Škrbić, Jelena Živančev
 5 th CEFSER Training Course Analysis of chemical contaminants in food and the environment Faculty of Technology, University of Novi Sad, Novi Sad, Republic of Serbia 7-11 May 2012 Analysis of heavy elements
Nova Scotia Department of Fisheries and Aquaculture. Environmental Monitoring Program Summary
 Nova Scotia Department of Fisheries and Aquaculture Environmental Monitoring Program Summary 2015 Table of Contents 1 Environmental Monitoring Program Overview... 1 2 2015 EMP... 5 2.1 Level I... 5 2.1.1
Aquatic Chemistry (10 hrs)
") Aquatic Chemistry (10 hrs) Water -The quality and quantity of water available to human have been vital factors in determining their well-being. -More then 70% of the earth is covered by water. Living cells
Aquatic Chemistry (10 hrs) Water -The quality and quantity of water available to human have been vital factors in determining their well-being. -More then 70% of the earth is covered by water. Living cells
Chapter 3 Erosion in the Las Vegas Wash
 Chapter 3 Erosion in the Las Vegas Wash Introduction As described in Chapter 1, the Las Vegas Wash (Wash) has experienced considerable change as a result of development of the Las Vegas Valley (Valley).
Item #9: Amphipod Tox Proposal Modification Page 1 of 9
 Item #9: Amphipod Tox Proposal Modification Page 1 of 9 The effects of particle size and shape and animal health on toxicity test results using the amphipod Eohaustorius estuarius. Estimated Cost: $30,000
Reading Material. See class website. Sediments, from Oceanography M.G. Gross, Prentice-Hall
 Reading Material See class website Sediments, from Oceanography M.G. Gross, Prentice-Hall Materials filling ocean basins Dissolved chemicals especially from rivers and mid-ocean ridges (volcanic eruptions)
Lower Susquehanna River Integrated Sediment & Nutrient Monitoring Program
 Lower Susquehanna River Integrated Sediment & Nutrient Monitoring Program Presented at the Chesapeake Bay Program Scientific and Technical Advisory Committee (STAC) Workshop January 13, 2016 Background
TECHNICAL SUPPORT FOR NY/NJ HARBOR ESTUARY PROGRAM USEPA REGION 2 TOXICS TMDL MODEL DEVELOPMENT. New York/New Jersey Harbor Estuary Program
 New York/New Jersey Harbor Estuary Program SEDIMENT AREA LOADING COMPONENT ANALYSIS AND SPREADSHEET TOOL DEVELOPMENT II HACKENSACK RIVER AND LOWER/RARITAN BAYS INTERPRETATIVE TECHNICAL MEMORANDUM TECHNICAL
Biogeochemical cycles
 Lecture -2: Biogeochemical cycles ENV 107: Introduction to Environmental Science Dr. A.K.M. Saiful Islam Case Study: Lake Washington The city of Seattle, USA lies between two major bodies of water- saltwater
PROFESSIONAL SERVICES DESCRIPTION FOR THE POSITION OF:
 PROFESSIONAL SERVICES DESCRIPTION FOR THE POSITION OF: Paulsboro Marine Terminal Sediment and Benthic Sampling and Characterization Plan Addendum No. 1 SUBMISSION DEADLINE: May 27, 2009 at 11:00 A.M. FAIR
Coastal and Marine Ecological Classification Standard (CMECS)
") Coastal and Marine Ecological Classification Standard (CMECS) Kathy Goodin, NatureServe EMECS, August 2011 Baltimore, MD 1 Outline Objectives & Process Classification Content Questions 2 Objectives Develop
Coastal and Marine Ecological Classification Standard (CMECS) Kathy Goodin, NatureServe EMECS, August 2011 Baltimore, MD 1 Outline Objectives & Process Classification Content Questions 2 Objectives Develop
Module 4: Overview of the Fundamentals of Runoff and Erosion
 Module 4: Overview of the Fundamentals of Runoff and Erosion Module 4a Goal Once we can better understand the forces which cause erosion and runoff, only then can we begin to minimize the negative results.
Aquatic Transfer Facility (ATF) San Pablo Bay (SPB) Proposed Region of ATF. Proposed Seabed Pipeline
 San Pablo Bay (SPB) Proposed Region of ATF. Proposed Seabed Pipeline") Aquatic Transfer Facility (ATF) San Pablo Bay (SPB) Proposed Region of ATF Proposed Seabed Pipeline Technical Studies An Overview Scope: Provide background and new scientific information and analysis for
Aquatic Transfer Facility (ATF) San Pablo Bay (SPB) Proposed Region of ATF Proposed Seabed Pipeline Technical Studies An Overview Scope: Provide background and new scientific information and analysis for
Lecture Outlines PowerPoint. Chapter 13 Earth Science 11e Tarbuck/Lutgens
 Lecture Outlines PowerPoint Chapter 13 Earth Science 11e Tarbuck/Lutgens 2006 Pearson Prentice Hall This work is protected by United States copyright laws and is provided solely for the use of instructors
Summer 2014 Reading the Geologic History of Doheny State Beach Rodger More LAYERS LET S TAKE A TOUR THE BLUFFS
 Summer 2014 Reading the Geologic History of Doheny State Beach Rodger More DSBIA Board Officer and Geologist (retired) LAYERS of sediment and rock are like a book. Formations make up chapters and individual
Geologic Trips San Francisco and the Bay Area
 Excerpt from Geologic Trips San Francisco and the Bay Area by Ted Konigsmark ISBN 0-9661316-4-9 GeoPress All rights reserved. No part of this book may be reproduced without written permission in writing,
North Bay Wildfires: Response & Recovery
 North Bay Wildfires: Response & Recovery December 1, 2017 Cristina Grosso Scott Dusterhoff Meg Sedlak Presentation Overview Overview of Wildfires [Scott] Water Quality Monitoring [Meg] Response & Recovery
Appendix I. Dredged Volume Estimates. Draft Contractor Document: Subject to Continuing Agency Review
 Appendix I Dredged Volume Estimates Draft Contractor Document: Subject to Continuing Agency Review Interoffice Correspondence Date: April 6, 2007 To: L. Bossi (WHI) Copy: S. Thompson (WHI), B. Fidler (NNJ)
TABLE 1 SSFL CHEMICAL SOIL BACKGROUND STUDY DATA QUALITY OBJECTIVES
 Problem Statement: Soil chemical concentration data for selected constituents are needed from off-site chemical background reference areas (CBRAs) to establish a regulatory-compliant, publicly-reviewed,
Figure 1 The map shows the top view of a meandering stream as it enters a lake. At which points along the stream are erosion and deposition dominant?
 1. In which type of climate does chemical weathering usually occur most rapidly? 1. hot and dry 3. cold and dry 2. hot and wet 4. cold and wet 2. Figure 1 The map shows the top view of a meandering stream
Phase I System Characterization: Year 2 Study Plans
 Phase I System Characterization: Year 2 Study Plans Year I Physical and Biological Data Sets Quarterly Storm Sampling Four storm events with 8 sample stations at bridges Monthly Baseline Characterization
Marine Mammal Tox: Overview (1 st class) February 5, Marine Mammals. # aquatic (marine or freshwater) species
 February 5, Marine Mammals. # aquatic (marine or freshwater) species") Marine Mammal Tox: Overview (1 st class) February 5, 2004 Marine Mammals group # aquatic (marine or freshwater) species Cetacea odontocetes Cetacea mysticetes Pinnipeds Mustelids Sirenians Ursids 67 +
Marine Mammal Tox: Overview (1 st class) February 5, 2004 Marine Mammals group # aquatic (marine or freshwater) species Cetacea odontocetes Cetacea mysticetes Pinnipeds Mustelids Sirenians Ursids 67 +
Soil Formation. Lesson Plan: NRES B2-4
 Soil Formation Lesson Plan: NRES B2-4 1 Anticipated Problems 1. What are five different factors that affect soil formation? 2. What are some different types of parent material that affect soils? 3. What
PTM: A Lagrangian Particle Tracking Model. Joseph Gailani
 PTM: A Lagrangian Particle Tracking Model Joseph Gailani Joe.Z.Gailani@usace.army.mil OUTLINE Motivation for sediment/constituent modeling system Objectives of modeling system Description of PTM PTM Example
Oceanography is the scientific study of oceans Oceans make up over 70% of the Earth s surface
 Oceanography Oceanography is the scientific study of oceans Oceans make up over 70% of the Earth s surface An ocean must be large and have features which set it apart from other oceans (currents, water
Chapter 6. Sediment Chemistry Analyses
 Chapter 6. Sediment Chemistry Analyses 6.1. Introduction Sediment chemistry is closely linked to the water quality of the overlying water body. Many water-borne pollutant and nutrient species are predominately
Relatively little hard substrate occurs naturally in the
 CHAPTER FIVE Rock Habitats Relatively little hard substrate occurs naturally in the estuary, owing mainly to the vast quantities of fine sediment that have been deposited by the rivers. Rock habitat is
Appendix O. Sediment Transport Modelling Technical Memorandum
 Appendix O Sediment Transport Modelling Technical Memorandum w w w. b a i r d. c o m Baird o c e a n s engineering l a k e s design r i v e r s science w a t e r s h e d s construction Final Report Don
CENTRAL LABORATORY. Sl. No. Type of sampling Charges in Rs. 1. GRAB SAMPLING:
 E-mail: centrallab@ospcboard.org Website : www.ospcboard.org CENTRAL LABORATORY STATE POLLUTION CONTROL BOARD, ODISHA [DEPARTMENT OF FOREST & ENVIRONMENT, GOVERNMENT OF ODISHA] Plot B-59/2 & 59/3, Chandaka
Earth Science Lesson Plan Quarter 2, Week 10, Day 1
 Earth Science Lesson Plan Quarter 2, Week 10, Day 1 Outcomes for Today Standard Focus: PREPARE 1. Background knowledge necessary for today s reading. Beaches are created by the actions of waves, tides,
Chapter 17. Ocean and Coastal Processes
 Chapter 17 Ocean and Coastal Processes Ocean Basins and Plates Ocean Basins Ocean Basins are profoundly different from the continents. Ocean crust is thin and dense and young. New ocean crust is generated
Highland Lake Bathymetric Survey
 Highland Lake Bathymetric Survey Final Report, Prepared For: The Town of Highland Lake 612 Lakeshore Drive Oneonta, AL 35121 Prepared By: Tetra Tech 2110 Powers Ferry Road SE Suite 202 Atlanta, GA 30339
Opportunities to Improve Ecological Functions of Floodplains and Reduce Flood Risk along Major Rivers in the Puget Sound Basin
 Opportunities to Improve Ecological Functions of Floodplains and Reduce Flood Risk along Major Rivers in the Puget Sound Basin Christopher Konrad, US Geological Survey Tim Beechie, NOAA Fisheries Managing
GIS-Based Sediment Quality Database for the St. Louis River Area of Concern (AOC): Overview Presentations and Demonstration
: Overview Presentations and Demonstration") GIS-Based Sediment Quality Database for the St. Louis River Area of Concern (AOC): Overview Presentations and Demonstration Judy L. Crane 1 and Dawn E. Smorong 2 1 Minnesota Pollution Control Agency, St.
GIS-Based Sediment Quality Database for the St. Louis River Area of Concern (AOC): Overview Presentations and Demonstration Judy L. Crane 1 and Dawn E. Smorong 2 1 Minnesota Pollution Control Agency, St.
Question #1: What are some ways that you think the climate may have changed in the area where you live over the past million years?
 Reading 5.2 Environmental Change Think about the area where you live. You may see changes in the landscape in that area over a year. Some of those changes are weather related. Others are due to how the
National Science Standards Unit 1 Unit 2 Unit 3 Unit 4 Unit 5 Unit 6 Unit 7 Unit 8
 Unifying Concepts and Processes Geology Geologic Changes The Dynamic Earth Water and Water Systems National Science Standards Systems, order, and organization Evidence, models, and explanation Change,
CHAPTER VI. Executive Summary. Ganga cleaning Project has raised public awareness about the quality of Indian
 CHAPTER VI Executive Summary Ganga cleaning Project has raised public awareness about the quality of Indian rivers. There have been a series of reports and debate in the media about environmental contamination
Forebay Confirmatory Sediment Sampling Results
 Forebay Confirmatory Sediment Sampling Results Maine Yankee Decommissioning Project Corrective Measures Study May 2004 Prepared for: Maine Yankee 321 Old Ferry Road, Bailey Point Wiscasset, ME 04578 Prepared
Sediment Stability in the Lower Passaic River Integration of Multiple Lines of Evidence
 Sediment Stability in the Lower Passaic River Integration of Multiple Lines of Evidence Fourth Passaic River Symposium June 22, 21 Michael Barbara, mab.consulting, LLC Marcia Greenblatt, AECOM John Connolly,
Changes in Geomorphology and Backscatter Patterns in Mount Misery Shoal, Long Island Sound as Revealed through Multiple Multibeam Surveys
 Changes in Geomorphology and Backscatter Patterns in Mount Misery Shoal, Long Island Sound as Revealed through Multiple Multibeam Surveys Laurie A. Zaleski Laurie.Zaleski@msrc.sunysb.edu, Roger D. Flood