Climate Regimes of the Arctic
|
|
|
- Agnes Hines
- 5 years ago
- Views:
Transcription
1 Climate Regimes of the Arctic
2 The climate of Greenland, recent changes and the ice sheet mass balance
 [from Steffen and Box, 2001, by permission of AGU].")
3 Map of Greenland, showing elevation and the location of GC- Net automatic weather stations (+), expedition stations (x), and coastal settlements (o) [from Steffen and Box, 2001, by permission of AGU]. There are two elevation maxima, at Summit (3208 m) and near South D, about 2800 m.

4 Summit, Greenland Summit Camp consists of a handful of permanent buildings, surrounded by temporary housing in the summer months. (Photograph courtesy John Burkhart, GEOSummit.)
5 Monthly mean air temperatures for different sites in Greenland (see previous slide for locations) [from Steffen and Box, 2001, by permission of AGU]. The only station with a July mean temperature above the freezing point is JAR-1 (+0.2 deg. C).

6 Greenland, like Antarctica is home to frequent katabatic winds. The basic process is illustrated above. Air is chilled near the surface (through radiative cooling) and becomes quite dense. It wants to move outward from the slope due to a horizontal pressure gradient, but finds itself denser that its surroundings. The net effect is a wind accelerating down the slope [from Wikipedia].
7 See the YouTube piece (for Antarctica but it gives the idea)

8 Greenland tip jet The Greenland tip jet is a sporadic jet stream characterized by strong winds on the lee side of Cape Farewell. It appears to play an important role in chilling North Atlantic waters so that they sink and drive part of the thermohaline circulation. The figure at left was assembled by MIT/WHOI Joint Program graduate student Kjetil Våge using NOAA's QuikSCAT satellite. It depicts a tip-jet event for Dec. 5, Color indicates wind speeds in meters per second; arrows indicate wind direction. (Courtesy of Kjetil Våge WHOI) Tip jets form through interaction between the synoptic-scale flow and the topography of Greenland. There are both forward top jets (like the one depicted above), and reverse tip jets, extending west of the tip of Greenland

9 Storms (red tracks) causing strong tip-jet events during the winter of Composite sea level pressure during tip-jet events [from Pickart et al., 2003]
10 Annual accumulation over the Greenland Ice Sheet in mm water equivalent. The contour intervals are 200 mm, but 100 mm if smaller than 400 mm and 600 mm if larger than 1000 mm [from Chen et al., 1997, by permission of AMS]. Due to orographic precipitation, accumulation along the southeast coast of Greenland locally exceeds 2000 mm. Accumulation over the northcentral part of the ice sheet is only mm.
11 Map of estimated mean annual sublimation for the Greenland ice sheet. Sublimation is a direct change from the solid to vapor state of water. Positive values mean transfer of mass from the surface to the atmosphere [from Box and Steffen, 2001, by permission of AGU]. At the top of the ice sheet the rule is deposition (vapor to solid).
 for the summer of 1999 based on satellite passive microwave")
12 Part of the Greenland ice sheet sees surface melt in summer. The figure at left show surface melt extent (black areas) for the summer of 1999 based on satellite passive microwave retrievals. [adapted from Abdalati et al., 2001, by permission of AGU].

13 Seasonal melt water stream in the ablation zone Yumi Nakayama

14 Seasonal melt ponds on the ice sheet Ian Joughin / University of Washington Polar Science Center

15 Left- melt water disappearing into a moulin. Bottom cross section of a moulin. Seasonal melt ponds may drain completely to the base on the ice sheet in a few hours through crevasses or when a moulin forms. The weight of the water wedges the crevasse open. Konrad Steffen, CIRES/Univ. CO
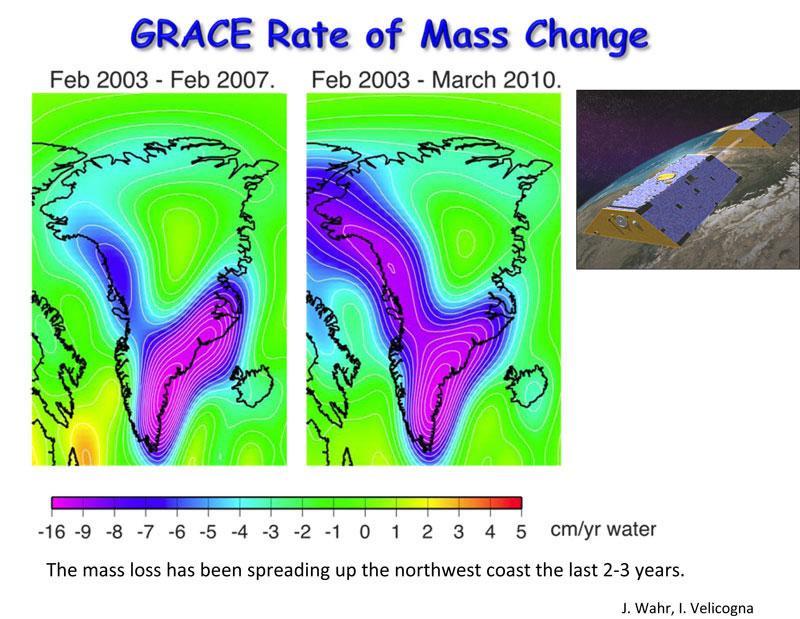
16 Greenland is losing mass Estimated Greenland Ice Sheet mass balance changes since 1950 using three different methods (from Jiang, 2010).
17
18 Greenland s contribution to sea level rise The boxes indicate the time period examined (the width) and uncertainty in the estimate (height). From Wu et al. [2010]. Total sea level rise is presently about 3.1 mm per year.
19 Over the satellite record there is a positive, albeit rather noisy positive trend in melt extent and related melt indices. There was a record melt (at the time) in Left: anomaly map of melting days for 2010 derived from passive microwave data. Hatched regions indicate where simulated meltwater production exceeds the mean by at least two standard deviations; Top Right: daily melt extent for the 2010 season, the average and the year 2007; Bottom Right: standardized melting index (the number of melting days times area subject to melting) by year from passive microwave data over the whole ice sheet and for different elevation bands [from Tedesco et al., 2011, Env. Res. Lett.]

20 Early July 2012: 97% of the ice sheet had experienced surface melt July 8, 2012 July 12,

21 The Jakobshavn glacier on the west coast and the Kangerdlugssuaq glacier on the east coast are two of the major glaciers draining the Greenland ice sheet. They have shown accelerated flow in recent years (Local ice caps and ice domes are shown in green. Ice-free areas are shown in dark gray).

22 Basal Lubrication Theory (the Zwally effect) Surface melt is increasing. This means more seasonal melt ponds. Melt ponds drain quickly to the base on the ice sheet via crevasses and moulins, which lubricates the base of the drainage glaciers, causing accelerated flow. Konrad Steffen, CIRES/Univ. CO More recent work: Back pressure effects are probably more important

23 Rapid retreat of Jacobshavn Glacier The rapidly retreating Jakobshavn Glacier in western Greenland drains the central ice sheet. This image shows the glacier in 2001, flowing from upper right to lower left. Terminus locations before 2001 were determined by surveys and more recent contours were derived from Landsat data. Thinning of the glacier leads to less back pressure, allowing for accelerated flow. Image courtesy NASA Earth Observatory
24 Back Pressure Issues Fiord walls and sills (bedrock protuberances at the glacier bed) exert a back pressure (friction) With a thinner glacier, not as much back pressure can be exerted by the walls As the glacier thins, it may float off the sills, again meaning less back pressure A thinner glacier exerts less pressure on its bed. For tidewater glaciers (glaciers that reach out into the sea, like Jacobshavn), the ocean water exerts a buoyancy effect, which becomes more important as the glacier thins. This leads to less back pressure (friction). Thinning occurs from the top (more melt) and, if the glacier is floating, from the bottom (warmer ocean waters), again yielding less back pressure. Thinning can act as a feedback thinning accelerates the flow, the acceleration leads to thinning and less back pressure. However, eventually, this can lead back to a new stable situation. This is the classic tidewater glacier cycle.
25 Polar desert Low precipitation Low annual mean temperature Generally high continentality
 [adapted from Charlier, 1969, also see Webber, 1974, courtesy of N.")
26 Distribution of Arctic polar desert (dark shading) and approximate southern limit of tundra (bold line) [adapted from Charlier, 1969, also see Webber, 1974, courtesy of N. Saliman, NSIDC, Boulder, CO].


27 Polar desert, Ellesmere Island Photos by C. Allen
28 Mean annual cycles of surface air temperature, precipitation, cloud cover and downwelling shortwave radiation for the polar desert site Resolute Bay, NWT, based on a number of different data sources [courtesy of M. Lavrakas, NSIDC, Boulder, CO]. Precipitation for even the wettest month (July) is less than 35 mm, and winter precipitation is very scant. February temperatures are below -30 deg. C.
29 Maritime Arctic Extensive cloudiness High relative humidity Small annual range in temperature

30 Svalbard a maritime Arctic site Photo by M. Serreze
31 Mean annual cycles of surface air temperature, precipitation, cloud cover and downwelling shortwave radiation for the maritime site Isfjord Radio (Svalbard),based on a number of different data sources [courtesy of M. Lavrakas, NSIDC, Boulder, CO]. Cloud cover is extensive year round. Precipitation is much more abundant compared to polar desert. The annual temperature range is quite small (only about 10 deg. C, compared to over 30 deg. C at Resolute)
32 Mean annual cycles of surface air temperature, precipitation, cloud cover and downwelling shortwave radiation for Barrow, AK, based on a number of different data sources [courtesy of M. Lavrakas, NSIDC, Boulder, CO]. While often categorized as a maritime site, Barrow has a large temperature range similar to polar desert sites.
33 Central Arctic Ocean Fairly large annual temperature range Summer temperatures close to freezing point Extensive low level stratus in summer Late summer/early autumn precip. maximum

34 The ice-covered central Arctic Ocean
35 Mean annual cycles of surface air temperature, precipitation, cloud cover and downwelling shortwave radiation for the central Arctic Ocean, based on data from the Russian North Pole program [courtesy of M. Lavrakas, NSIDC, Boulder, CO]. Due to the melting ice surface, the surface air temperature in July hovers near the freezing point. Cloud cover peaks in summer much of this is low-level Arctic stratus.
Climate Regimes of the Arctic
 Climate Regimes of the Arctic The climate of Greenland Map of Greenland, showing elevation and the location of GC- Net automatic weather stations (+), expedition stations (x), and coastal settlements (o)
The Arctic Climate System GEOG 4271/5271. Mark C. Serreze Department of Geography University of Colorado, Boulder CO
 The Arctic Climate System GEOG 4271/5271 Mark C. Serreze Department of Geography University of Colorado, Boulder CO serreze@nsidc.org Why study the Arctic climate system? The fascinating processes that
The Hydrologic Cycle
 The Hydrologic Cycle Monthly precipitation for the central Arctic Ocean based on data from the Russian North Pole manned camps with daily bias adjustments. Raw precipitation totals are shown along with
Today s Lecture: Land, biosphere, cryosphere (All that stuff we don t have equations for... )
") Today s Lecture: Land, biosphere, cryosphere (All that stuff we don t have equations for... ) 4 Land, biosphere, cryosphere 1. Introduction 2. Atmosphere 3. Ocean 4. Land, biosphere, cryosphere 4.1 Land
Today s Lecture: Land, biosphere, cryosphere (All that stuff we don t have equations for... ) 4 Land, biosphere, cryosphere 1. Introduction 2. Atmosphere 3. Ocean 4. Land, biosphere, cryosphere 4.1 Land
The Arctic Energy Budget
 The Arctic Energy Budget The global heat engine [courtesy Kevin Trenberth, NCAR]. Differential solar heating between low and high latitudes gives rise to a circulation of the atmosphere and ocean that
Brita Horlings
 Knut Christianson Brita Horlings brita2@uw.edu https://courses.washington.edu/ess431/ Natural Occurrences of Ice: Distribution and environmental factors of seasonal snow, sea ice, glaciers and permafrost
Contributions to The State of Climate 2004 Recent Greenland climate variability and consequences to ice sheet mass balance
 Contributions to The State of Climate 2004 Recent Greenland climate variability and consequences to ice sheet mass balance Jason E. Box AMS Committee on Polar Meteorology Byrd Polar Research Center, The
The Atmospheric Circulation
 The Atmospheric Circulation Vertical structure of the Atmosphere http://www.uwsp.edu/geo/faculty/ritter/geog101/textbook/atmosphere/atmospheric_structure.html The global heat engine [courtesy Kevin Trenberth,
Modeling the Arctic Climate System
 Modeling the Arctic Climate System General model types Single-column models: Processes in a single column Land Surface Models (LSMs): Interactions between the land surface, atmosphere and underlying surface
General Circulation. Nili Harnik DEES, Lamont-Doherty Earth Observatory
 General Circulation Nili Harnik DEES, Lamont-Doherty Earth Observatory nili@ldeo.columbia.edu Latitudinal Radiation Imbalance The annual mean, averaged around latitude circles, of the balance between the
Outline: 1) Extremes were triggered by anomalous synoptic patterns 2) Cloud-Radiation-PWV positive feedback on 2007 low SIE
 Extremes were triggered by anomalous synoptic patterns 2) Cloud-Radiation-PWV positive feedback on 2007 low SIE") Identifying Dynamical Forcing and Cloud-Radiative Feedbacks Critical to the Formation of Extreme Arctic Sea-Ice Extent in the Summers of 2007 and 1996 Xiquan Dong University of North Dakota Outline: 1)
Identifying Dynamical Forcing and Cloud-Radiative Feedbacks Critical to the Formation of Extreme Arctic Sea-Ice Extent in the Summers of 2007 and 1996 Xiquan Dong University of North Dakota Outline: 1)
SEVERE WEATHER AND FRONTS TAKE HOME QUIZ
 1. Most of the hurricanes that affect the east coast of the United States originally form over the A) warm waters of the Atlantic Ocean in summer B) warm land of the southeastern United States in summer
Sep May Ppt Anomaly (N = 60)
") balance (annual net balance and its summer/winter components) measures how climate affects the health of Arctic glaciers. As most 2007 08 measurements are not yet available, we report results for the 2006
balance (annual net balance and its summer/winter components) measures how climate affects the health of Arctic glaciers. As most 2007 08 measurements are not yet available, we report results for the 2006
Polar Portal Season Report 2016
 Polar Portal Season Report 2016 Less ice both on land and at sea This year s report is the fourth since the Polar Portal was launched, and as an introduction, we have chosen to take a look at the trends
Exemplar for Internal Achievement Standard. Mathematics and Statistics Level 3
 Exemplar for internal assessment resource Mathematics and Statistics for Achievement Standard 91580 Exemplar for Internal Achievement Standard Mathematics and Statistics Level 3 This exemplar supports
1 What Is Climate? TAKE A LOOK 2. Explain Why do areas near the equator tend to have high temperatures?
 CHAPTER 17 1 What Is Climate? SECTION Climate BEFORE YOU READ After you read this section, you should be able to answer these questions: What is climate? What factors affect climate? How do climates differ
THE ATMOSPHERE IN MOTION
 Funding provided by NOAA Sectoral Applications Research Project THE ATMOSPHERE IN MOTION Basic Climatology Oklahoma Climatological Survey Factor 1: Our Energy Source Hi, I m the Sun! I provide 99.9999+
The Northern Hemisphere Sea ice Trends: Regional Features and the Late 1990s Change. Renguang Wu
 The Northern Hemisphere Sea ice Trends: Regional Features and the Late 1990s Change Renguang Wu Institute of Atmospheric Physics, Chinese Academy of Sciences, Beijing World Conference on Climate Change
Global Atmospheric Circulation
 Global Atmospheric Circulation Polar Climatology & Climate Variability Lecture 11 Nov. 22, 2010 Global Atmospheric Circulation Global Atmospheric Circulation Global Atmospheric Circulation The Polar Vortex
Climate versus Weather
 Climate versus Weather What is climate? Climate is the average weather usually taken over a 30-year time period for a particular region and time period. Climate is not the same as weather, but rather,
Trends in Climate Teleconnections and Effects on the Midwest
 Trends in Climate Teleconnections and Effects on the Midwest Don Wuebbles Zachary Zobel Department of Atmospheric Sciences University of Illinois, Urbana November 11, 2015 Date Name of Meeting 1 Arctic
Terrestrial Snow Cover: Properties, Trends, and Feedbacks. Chris Derksen Climate Research Division, ECCC
 Terrestrial Snow Cover: Properties, Trends, and Feedbacks Chris Derksen Climate Research Division, ECCC Outline Three Snow Lectures: 1. Why you should care about snow: Snow and the cryosphere Classes of
Glaciers form wherever snow and ice can accumulate High latitudes High mountains at low latitudes Ice temperatures vary among glaciers Warm
 The Cryosphere Glaciers form wherever snow and ice can accumulate High latitudes High mountains at low latitudes Ice temperatures vary among glaciers Warm (temperate) glaciers: at pressure melting point,
Radiative Climatology of the North Slope of Alaska and the Adjacent Arctic Ocean
 Radiative Climatology of the North Slope of Alaska and the Adjacent Arctic Ocean C. Marty, R. Storvold, and X. Xiong Geophysical Institute University of Alaska Fairbanks, Alaska K. H. Stamnes Stevens Institute
Name the surface winds that blow between 0 and 30. GEO 101, February 25, 2014 Monsoon Global circulation aloft El Niño Atmospheric water
 GEO 101, February 25, 2014 Monsoon Global circulation aloft El Niño Atmospheric water Name the surface winds that blow between 0 and 30 What is the atmospheric pressure at 0? What is the atmospheric pressure
1 What Is Climate? TAKE A LOOK 2. Explain Why do areas near the equator tend to have high temperatures?
 CHAPTER 17 1 What Is Climate? SECTION Climate BEFORE YOU READ After you read this section, you should be able to answer these questions: What is climate? What factors affect climate? How do climates differ
Arctic Ocean-Sea Ice-Climate Interactions
 Arctic Ocean-Sea Ice-Climate Interactions Sea Ice Ice extent waxes and wanes with the seasons. Ice extent is at a maximum in March (typically 14 million square km, about twice the area of the contiguous
Polar Portal Season Report 2018
 Polar Portal Season Report 2018 Unusual weather resulted in an atypical melting season in the Arctic The 2017-18 season in the Arctic has once again been extraordinary. A cold summer with high levels of
1 What Is Climate? TAKE A LOOK 2. Explain Why do areas near the equator tend to have high temperatures?
 CHAPTER 3 1 What Is Climate? SECTION Climate BEFORE YOU READ After you read this section, you should be able to answer these questions: What is climate? What factors affect climate? How do climates differ
Earth s Climate Patterns
 Earth s Climate Patterns Reading: Chapter 17, GSF 10/2/09 Also Jackson (linked on course web site) 1 What aspects of climate affect plant distributions? Climate: long-term distribution of weather in an
Interannual Variations of Arctic Cloud Types:
 Interannual Variations of Arctic Cloud Types: Relationships with Sea Ice and Surface Temperature Ryan Eastman Stephen Warren University of Washington Department of Atmospheric Sciences Changes in Arctic
XVI. Warming and the cryosphere
 XVI. Warming and the cryosphere review temperature from thermometers, satellites, glacier lengths and boreholes all show significant warming in the 20th C+ reconstruction of past temperatures from corals,
Regional Outlook for the Bering-Chukchi-Beaufort Seas Contribution to the 2018 Sea Ice Outlook
 Regional Outlook for the Bering-Chukchi-Beaufort Seas Contribution to the 2018 Sea Ice Outlook 25 July 2018 Matthew Druckenmiller (National Snow and Ice Data Center, Univ. Colorado Boulder) & Hajo Eicken
Thomas P. Phillips CIRES Prof K. Steffen, L. Colgan PhD ABD, D. McGrath MA
 Thomas P. Phillips CIRES Prof K. Steffen, L. Colgan PhD ABD, D. McGrath MA Problem: we know very little about the processes happening within the Greenland Ice Sheet. What is the velocity at the base? What
ICE is less dense than water about 92% of the density of water; it floats. This is unlike the behavior of most substances, which generally are denser
 ICE is less dense than water about 92% of the density of water; it floats. This is unlike the behavior of most substances, which generally are denser as solids than as liquids (right). This is a result
Day 1 of Global Warming. Copyright 2008 Pearson Education, Inc., publishing as Pearson Benjamin Cummings
 Day 1 of Global Warming Copyright 2008 Pearson Education, Inc., publishing as Pearson Benjamin Cummings The Atmosphere Atmosphere = the thin layer (1/100 th of Earth s diameter) of gases that surrounds
Future Climate Change
 Future Climate Change How do you know whether to trust a prediction about the future? All predictions are based on global circulation models (GCMs, AOGCMs) - model accuracy is verified by its ability to
Polar Portal Season Report 2013
 Polar Portal Season Report 2013 All in all, 2013 has been a year with large melting from both the Greenland Ice Sheet and the Arctic sea ice but not nearly as large as the record-setting year of 2012.
Supraglacial Lake Formation and What it Means for Greenland s Future
 Supraglacial Lake Formation and What it Means for Greenland s Future GreenPeace Ulyana Nadia Horodyskyj GEOG 5271 questions of interest How, when and where do these lakes form in Greenland? How do these
Exploring The Polar Connection to Sea Level Rise NGSS Disciplinary Core Ideas Science & Engineering Crosscutting Concepts
 Exploring The Polar Connection to Sea Level Rise NGSS Disciplinary Core Ideas Science & Engineering Crosscutting Concepts Practices MS - ESS: Earth & Space Science 1. Ask questions 2. Developing and using
Canadian Ice Service
 Canadian Ice Service Key Points and Details concerning the 2009 Arctic Minimum Summer Sea Ice Extent October 1 st, 2009 http://ice-glaces.ec.gc.ca 1 Key Points of Interest Arctic-wide The Arctic-wide minimum
Activity 2.2: Recognizing Change (Observation vs. Inference)
") Activity 2.2: Recognizing Change (Observation vs. Inference) Teacher Notes: Evidence for Climate Change PowerPoint Slide 1 Slide 2 Introduction Image 1 (Namib Desert, Namibia) The sun is on the horizon
Activity 2.2: Recognizing Change (Observation vs. Inference) Teacher Notes: Evidence for Climate Change PowerPoint Slide 1 Slide 2 Introduction Image 1 (Namib Desert, Namibia) The sun is on the horizon
IMPACTS OF A WARMING ARCTIC
 The Earth s Greenhouse Effect Most of the heat energy emitted from the surface is absorbed by greenhouse gases which radiate heat back down to warm the lower atmosphere and the surface. Increasing the
The State of the cryosphere
 The State of the cryosphere Course outline Introduction The cryosphere; what is it? The Earth; a unique planet Cryospheric components Classifications Lecture outlines The State of the cryosphere The State
L.O Students will learn about factors that influences the environment
 Name L.O Students will learn about factors that influences the environment Date 1. At the present time, glaciers occur mostly in areas of A) high latitude or high altitude B) low latitude or low altitude
Orbital-Scale Interactions in the Climate System. Speaker:
 Orbital-Scale Interactions in the Climate System Speaker: Introduction First, many orbital-scale response are examined.then return to the problem of interactions between atmospheric CO 2 and the ice sheets
ATOC OUR CHANGING ENVIRONMENT Class 19 (Chp 6) Objectives of Today s Class: The Cryosphere [1] Components, time scales; [2] Seasonal snow
![ATOC OUR CHANGING ENVIRONMENT Class 19 (Chp 6) Objectives of Today s Class: The Cryosphere [1] Components, time scales; [2] Seasonal snow](/thumbs/95/126309683.jpg "ATOC OUR CHANGING ENVIRONMENT Class 19 (Chp 6) Objectives of Today s Class: The Cryosphere [1] Components, time scales; [2] Seasonal snow") ATOC 1060-002 OUR CHANGING ENVIRONMENT Class 19 (Chp 6) Objectives of Today s Class: The Cryosphere [1] Components, time scales; [2] Seasonal snow cover, permafrost, river and lake ice, ; [3]Glaciers and
ATOC 1060-002 OUR CHANGING ENVIRONMENT Class 19 (Chp 6) Objectives of Today s Class: The Cryosphere [1] Components, time scales; [2] Seasonal snow cover, permafrost, river and lake ice, ; [3]Glaciers and
The Wedge, Grease and Heat: Why Ice Sheets Hate Water
 The Wedge, Grease and Heat: Why Ice Sheets Hate Water Dr. Robert Bindschadler Chief Scientist Laboratory for Hydrospheric and Biospheric Sciences NASA Goddard Space Flight Center Robert.A.Bindschadler@nasa.gov
Ice Sheets and Sea Level -- Concerns at the Coast (Teachers Guide)
") Ice Sheets and Sea Level -- Concerns at the Coast (Teachers Guide) Roughly 153 million Americans (~53% of the US population) live in coastal counties. World wide some 3 billion people live within 200 km
Ice Sheets and Sea Level -- Concerns at the Coast (Teachers Guide) Roughly 153 million Americans (~53% of the US population) live in coastal counties. World wide some 3 billion people live within 200 km
Tropical Moist Rainforest
 Tropical or Lowlatitude Climates: Controlled by equatorial tropical air masses Tropical Moist Rainforest Rainfall is heavy in all months - more than 250 cm. (100 in.). Common temperatures of 27 C (80 F)
Meltdown Evidence of Climate Change from Polar Science. Eric Wolff
 Meltdown Evidence of Climate Change from Polar Science Eric Wolff (ewwo@bas.ac.uk) Why are the polar regions important for climate? Heat engine Why are the polar regions important for climate? Heat engine
Our climate system is based on the location of hot and cold air mass regions and the atmospheric circulation created by trade winds and westerlies.
 CLIMATE REGIONS Have you ever wondered why one area of the world is a desert, another a grassland, and another a rainforest? Or have you wondered why are there different types of forests and deserts with
Glacier (and ice sheet) Mass Balance
 Mass Balance") Glacier (and ice sheet) Mass Balance The long-term average position of the highest (late summer) firn line is termed the Equilibrium Line Altitude (ELA) Firn is old snow How an ice sheet works (roughly):
Glacier (and ice sheet) Mass Balance The long-term average position of the highest (late summer) firn line is termed the Equilibrium Line Altitude (ELA) Firn is old snow How an ice sheet works (roughly):
Energy Systems, Structures and Processes Essential Standard: Analyze patterns of global climate change over time Learning Objective: Differentiate
 Energy Systems, Structures and Processes Essential Standard: Analyze patterns of global climate change over time Learning Objective: Differentiate between weather and climate Global Climate Focus Question
Welcome to ATMS 111 Global Warming.
 Welcome to ATMS 111 Global Warming http://www.atmos.washington.edu/2010q1/111 http://cgz.e2bn.net/e2bn/leas/c99/schools/cgz/accounts/staff/rchambers/geobytes/gcse/case%20studies/causes_of_flooding_in_bangladesh.jpg
Weather Notes. Chapter 16, 17, & 18
 Weather Notes Chapter 16, 17, & 18 Weather Weather is the condition of the Earth s atmosphere at a particular place and time Weather It is the movement of energy through the atmosphere Energy comes from
This satellite image of an Ellesmere Island glacier that reaches the sea in the Greely Fjord reveals growing meltwater ponds on the glacier's surface
 This satellite image of an Ellesmere Island glacier that reaches the sea in the Greely Fjord reveals growing meltwater ponds on the glacier's surface as well as icebergs that have calved off the glacier
3) What is the difference between latitude and longitude and what is their affect on local and world weather and climate?
 What is the difference between latitude and longitude and what is their affect on local and world weather and climate?") www.discoveryeducation.com 1) Describe the difference between climate and weather citing an example of each. Describe how water (ocean, lake, river) has a local effect on weather and climate and provide
www.discoveryeducation.com 1) Describe the difference between climate and weather citing an example of each. Describe how water (ocean, lake, river) has a local effect on weather and climate and provide
Mediterranean Climates (Csa, Csb)
") Climatic Zones & Types Part II I've lived in good climate, and it bores the hell out of me. I like weather rather than climate. 1 John Steinbeck Mediterranean Climates (Csa, Csb) Main locations Western
Climatic Zones & Types Part II I've lived in good climate, and it bores the hell out of me. I like weather rather than climate. 1 John Steinbeck Mediterranean Climates (Csa, Csb) Main locations Western
LAB J - WORLD CLIMATE ZONES
 Introduction LAB J - WORLD CLIMATE ZONES The objective of this lab is to familiarize the student with the various climates around the world and the climate controls that influence these climates. Students
CLIMATE READY BOSTON. Climate Projections Consensus ADAPTED FROM THE BOSTON RESEARCH ADVISORY GROUP REPORT MAY 2016
 CLIMATE READY BOSTON Sasaki Steering Committee Meeting, March 28 nd, 2016 Climate Projections Consensus ADAPTED FROM THE BOSTON RESEARCH ADVISORY GROUP REPORT MAY 2016 WHAT S IN STORE FOR BOSTON S CLIMATE?
ESCI 344 Tropical Meteorology Lesson 7 Temperature, Clouds, and Rain
 ESCI 344 Tropical Meteorology Lesson 7 Temperature, Clouds, and Rain References: Forecaster s Guide to Tropical Meteorology (updated), Ramage Tropical Climatology, McGregor and Nieuwolt Climate and Weather
The Global Scope of Climate. The Global Scope of Climate. Keys to Climate. Chapter 8
 The Global Scope of Climate Chapter 8 The Global Scope of Climate In its most general sense, climate is the average weather of a region, but except where conditions change very little during the course
Chapter outline. Reference 12/13/2016
 Chapter 2. observation CC EST 5103 Climate Change Science Rezaul Karim Environmental Science & Technology Jessore University of science & Technology Chapter outline Temperature in the instrumental record
Bell Work. REVIEW: Our Planet Earth Page 29 Document A & B Questions
 9.12.16 Bell Work REVIEW: Our Planet Earth Page 29 Document A & B Questions Intro to Climate & Weather https://www.youtube.com/watch?v=vhgyoa70q7y Weather vs. Climate Video Climate & Weather 3.1 Weather
NASA Images of Antarctica and the Arctic covered in both land and sea ice
 ICE SHELVES ACTIVITY 1: DECODING THE ROLE OF ANTARCTIC ICE IN GLOBAL CLIMATE Ice Shelves play a critical role in Antarctica, serving as a buffer between the ocean and the continental ice sheet covering
Snow cover measurement and variation analysis
 Snow cover measurement and variation analysis Konosuke Sugiura / Associate Professor, University of Toyama Fig.1 The rapid progression of snow cover extent in the northern hemisphere in October 2012. Red:
The Distribution of Cold Environments
 The Distribution of Cold Environments Over 25% of the surface of our planet can be said to have a cold environment, but defining what we actually mean by that can be very challenging. This is because cold
Arctic System Reanalysis Depiction of Arctic Atmospheric Circulation
 Arctic System Reanalysis Depiction of Arctic Atmospheric Circulation David H. Bromwich A.B. Wilson, L.-S. Bai, G.W.K. Moore, K.M. Hines, S.-H. Wang, W. Kuo, Z. Liu, H.-C. Lin, T.-K. Wee, M. Barlage, M.C.
Energy and Seasons A B1. 9. Which graph best represents the general relationship between latitude and average surface temperature?
 Energy and Seasons A B1 1. Which type of surface absorbs the greatest amount of electromagnetic energy from the Sun? (1) smooth, shiny, and light colored (2) smooth, shiny, and dark colored (3) rough,
Seasons, Global Wind and Climate Study Guide
 Seasons, Global Wind and Climate Study Guide Seasons 1. Know what is responsible for the change in seasons on Earth. 2. Be able to determine seasons in the northern and southern hemispheres given the position
Development and Validation of Polar WRF
 Polar Meteorology Group, Byrd Polar Research Center, The Ohio State University, Columbus, Ohio Development and Validation of Polar WRF David H. Bromwich 1,2, Keith M. Hines 1, and Le-Sheng Bai 1 1 Polar
Weather, Air Masses, Fronts and Global Wind Patterns. Meteorology
 Weather, Air Masses, Fronts and Global Wind Patterns Meteorology Weather is what conditions of the atmosphere are over a short period of time. Climate is how the atmosphere "behaves" over long periods
Amazing Ice: Glaciers and Ice Ages
 Amazing Ice: Glaciers and Ice Ages Updated by: Rick Oches, Professor of Geology & Environmental Sciences Bentley University Waltham, Massachusetts Based on slides prepared by: Ronald L. Parker, Senior
Factors that Affect Climate
 Factors that Affect Climate What is climate? Climate is the average weather conditions over a long period of time Includes average temperatures and precipitation, wind patterns, humidity, air pressure
How do glaciers form?
 Glaciers What is a Glacier? A large mass of moving ice that exists year round is called a glacier. Glaciers are formed when snowfall exceeds snow melt year after year Snow and ice remain on the ground
Satellites, Weather and Climate Module??: Polar Vortex
 Satellites, Weather and Climate Module??: Polar Vortex SWAC Jan 2014 AKA Circumpolar Vortex Science or Hype? Will there be one this year? Today s objectives Pre and Post exams What is the Polar Vortex
Coastal Antarctic polynyas: A coupled process requiring high model resolution in the ocean and atmosphere
 Coastal Antarctic polynyas: A coupled process requiring high model resolution in the ocean and atmosphere Mike Dinniman and John Klinck Center for Coastal Physical Oceanography Old Dominion University
Storm and Storm Systems Related Vocabulary and Definitions. Magnitudes are measured differently for different hazard types:
 Storm and Storm Systems Related Vocabulary and Definitions Magnitude: this is an indication of the scale of an event, often synonymous with intensity or size. In natural systems, magnitude is also related
Table of Contents. Chapter: Atmosphere. Section 1: Earth's Atmosphere. Section 2: Energy Transfer in the Atmosphere. Section 3: Air Movement
 Table of Contents Chapter: Atmosphere Section 1: Earth's Atmosphere Section 2: Energy Transfer in the Atmosphere Section 3: Air Movement Table of Contents Chapter 4: Atmosphere Section 1: Earth's Atmosphere
Precipitation processes in the Middle East
 Precipitation processes in the Middle East J. Evans a, R. Smith a and R.Oglesby b a Dept. Geology & Geophysics, Yale University, Connecticut, USA. b Global Hydrology and Climate Center, NASA, Alabama,
Multiple Choice Identify the choice that best completes the statement or answers the question.
 CH.15 practice TEST Multiple Choice Identify the choice that best completes the statement or answers the question. 1) The short-term state of the atmosphere is called a) climate. c) water cycle. b) weather.
5) The amount of heat needed to raise the temperature of 1 gram of a substance by 1 C is called: Page Ref: 69
 The amount of heat needed to raise the temperature of 1 gram of a substance by 1 C is called: Page Ref: 69") Homework #2 Due 9/19/14 1) If the maximum temperature for a particular day is 26 C and the minimum temperature is 14 C, what would the daily mean temperature be? (Page Ref: 66) 2) How is the annual mean
Homework #2 Due 9/19/14 1) If the maximum temperature for a particular day is 26 C and the minimum temperature is 14 C, what would the daily mean temperature be? (Page Ref: 66) 2) How is the annual mean
ARCTIC SEA ICE ALBEDO VARIABILITY AND TRENDS,
 ARCTIC SEA ICE ALBEDO VARIABILITY AND TRENDS, 1982-1998 Vesa Laine Finnish Meteorological Institute (FMI), Helsinki, Finland Abstract Whole-summer and monthly sea ice regional albedo averages, variations
Ocean s Influence on Weather and Climate
 Earth is often called the Blue Planet because so much of its surface (about 71%) is covered by water. Of all the water on Earth, about 96.5%, is held in the world s oceans. As you can imagine, these oceans
Earth Science and Climate Change
 Earth Science and Climate Change Dr. Mary L. Cleave February 7, 2007 YOU ARE HERE 3 Land Use Changes Over Time Lingering Doubts on Temperature Trends Have Been Resolved 1st CCSP Synthesis & Assessment
Name Period 4 th Six Weeks Notes 2013 Weather
 Name Period 4 th Six Weeks Notes 2013 Weather Radiation Convection Currents Winds Jet Streams Energy from the Sun reaches Earth as electromagnetic waves This energy fuels all life on Earth including the
Unit 4 Review Guide: Weather
 Unit 4 Review Guide: Weather Weather: The condition of the atmosphere at a specific time and place. Freezing: To become hardened into ice or into a solid body Deposition: The change in state of matter
2015: A YEAR IN REVIEW F.S. ANSLOW
 2015: A YEAR IN REVIEW F.S. ANSLOW 1 INTRODUCTION Recently, three of the major centres for global climate monitoring determined with high confidence that 2015 was the warmest year on record, globally.
WHAT CAN MAPS TELL US ABOUT THE GEOGRAPHY OF ANCIENT GREECE? MAP TYPE 1: CLIMATE MAPS
 WHAT CAN MAPS TELL US ABOUT THE GEOGRAPHY OF ANCIENT GREECE? MAP TYPE 1: CLIMATE MAPS MAP TYPE 2: PHYSICAL AND/OR TOPOGRAPHICAL MAPS MAP TYPE 3: POLITICAL MAPS TYPE 4: RESOURCE & TRADE MAPS Descriptions
Ice Cap Glaciers in the Arctic Region. John Evans Glacier, Ellesmere Island (Robert Bingham, U. Aberdeen)
") Ice Cap Glaciers in the Arctic Region John Evans Glacier, Ellesmere Island (Robert Bingham, U. Aberdeen) Iceland Svalbard Ellesmere and Baffin Islands Severny and Anzhu Islands Topics: Temperate vs non-temperate
Ice Cap Glaciers in the Arctic Region John Evans Glacier, Ellesmere Island (Robert Bingham, U. Aberdeen) Iceland Svalbard Ellesmere and Baffin Islands Severny and Anzhu Islands Topics: Temperate vs non-temperate
Week: Dates: 3/2 3/20 Unit: Climate
 clementaged.weebly.com Name: EVEN Period: Week: 28 30 Dates: 3/2 3/20 Unit: Climate Monday Tuesday Wednesday Thursday Friday 2 O 3 E *Vocabulary *Water in the Atmosphere and Clouds Notes *Cloud Drawings
Climate change: Rain melting Greenland ice sheet 'even in winter'
 Climate change: Rain melting Greenland ice sheet 'even in winter' By David Shukman Science editor 8 hours ago JOSEPH COOK After it rains the surface darkens, which speeds up melting Rain is becoming more
What a Hurricane Needs to Develop
 Weather Weather is the current atmospheric conditions, such as air temperature, wind speed, wind direction, cloud cover, precipitation, relative humidity, air pressure, etc. 8.10B: global patterns of atmospheric
Climate Change in Newfoundland & Labrador
 Climate Change in Newfoundland & Labrador Impacts and Adaptation Newleef Conference 08 October 2015 Met-Ocean Services The Team 55 personnel; 24/7 operational weather forecast desk; Equipment technician
Climate modeling: 1) Why? 2) How? 3) What?
 Why? 2) How? 3) What?") Climate modeling: 1) Why? 2) How? 3) What? Matthew Widlansky mwidlans@hawaii.edu 1) Why model the climate? Hawaii Fiji Sachs and Myhrvold: A Shifting Band of Rain 1 Evidence of Past Climate Change? Mean
Climate modeling: 1) Why? 2) How? 3) What? Matthew Widlansky mwidlans@hawaii.edu 1) Why model the climate? Hawaii Fiji Sachs and Myhrvold: A Shifting Band of Rain 1 Evidence of Past Climate Change? Mean
APPENDIX B PHYSICAL BASELINE STUDY: NORTHEAST BAFFIN BAY 1
 APPENDIX B PHYSICAL BASELINE STUDY: NORTHEAST BAFFIN BAY 1 1 By David B. Fissel, Mar Martínez de Saavedra Álvarez, and Randy C. Kerr, ASL Environmental Sciences Inc. (Feb. 2012) West Greenland Seismic
A Tutorial on Climate Change Science: The. 4 th National Climate Assessment CLIMATE SCIENCE. Don Wuebbles
 CLIMATE SCIENCE S P E C I A L R E P O R T A Tutorial on Climate Change Science: The Fourth National Climate Assessment Volume I 4 th National Climate Assessment Don Wuebbles Department of Atmospheric Sciences
Glacial Modification of Terrain
 Glacial Modification Part I Stupendous glaciers and crystal snowflakes -- every form of animate or inanimate existence leaves its impress upon the soul of man. 1 -Orison Swett Marden Glacial Modification
Science 1206 Chapter 1 - Inquiring about Weather
 Science 1206 Chapter 1 - Inquiring about Weather 1.1 - The Atmosphere: Energy Transfer and Properties (pp. 10-25) Weather and the Atmosphere weather the physical conditions of the atmosphere at a specific