EPS 50 Lab 6: Maps Topography, geologic structures and relative age determinations
|
|
|
- Marion Rose
- 5 years ago
- Views:
Transcription
1 Name: EPS 50 Lab 6: Maps Topography, geologic structures and relative age determinations Introduction: Maps are some of the most interesting and informative printed documents available. We are familiar with simple maps that indicate places and the roads you are going to take from one place to another, but maps can reveal much more information. In this lab we will learn to interpret two very important types of maps used in geology and related disciplines: topographic maps and geologic maps. We will also learn to interpret geologic structures, and learn how they can be inferred from geologic maps. Objective: This laboratory will introduce you to topographic and geologic maps and also cover some geologic structures associated with folding and faulting. You will practice making relative age determinations of rocks and structures, and you will construct a geologic cross-section based on information you obtain from maps. Answers: All answers should be your own, but we encourage you to discuss and check your answers with other students. This lab will be graded out of 100 points. Part 1: Topographic maps (21 points) Topographic maps provide information about Earth s surface. The main feature of topographic maps is topography: ridges, valleys, mountains, plains and other Earth surface features. Maps usually contain a lot of information (i.e. roads, highways, buildings, water bodies, railroads, etc.), but for this exercise we will focus only on topography, (i.e. elevation data). Changes in elevation are depicted on topographic maps using contour lines. Contour lines are lines representing equal elevation across the landscape. Contours are drawn at regular intervals of elevation; these intervals vary between maps, but are typically specified at the bottom of the map or in the map legend. In addition, topographic maps provide a wealth of information regarding both natural and manmade features (see the topographic map symbol key). Map scale is another critical piece of information on all maps. Scale is a number on a map that relates the distances on the map to those in the real world. For instance, a map with a 1 to 12,000 scale (1:12000), tells the user that one unit of distance on the map represents 12,000 units in the real world. The scale, therefore, indicates the level of detail for the features on the map. The key feature of topographic maps is the contour line. Contour lines connect points with equal elevation. They serve as imaginary boundaries separating areas above a given elevation from areas below it to show the general shape of the terrain. The elevation difference between two contour lines is called the contour interval. For most scientific maps, the units of the contour
 are often marked by thicker lines with elevations")
2 lines, the distances and the elevation are all in metric units: meters and kilometers. However, older American maps frequently use units of feet and miles. In order to help the user determine the elevation at certain locations on a map, the index contours (usually every fourth or fifth contour line) are often marked by thicker lines with elevations labeled. Contour maps relay extensive information. Contours that are very close to each other represent steep slopes. Conversely, widely spaced contours (or an absence of contours) represent shallow slopes. The slope direction is always perpendicular to a contour line. Alternating convergent and divergent contour lines reflect a ridge and valley topography. A ridge line is an ideal line parallel to divergent contours passing through the point of maximum divergence (where the curvature of the contour is greatest). Similarly, a valley axis passes along contours of maximum convergence. Streams tend to follow the valley axes and contour lines intersecting them have a V (or U) shape with the bottom of the V (or U) pointing uphill. Closed contours without other contour lines inside are either high points (e.g., a peak) or low points (e.g., a depression). A saddle is an area bound by higher contours in two opposite directions and lower contours in the other two opposite directions. A watershed (or catchment) is the extent of land which can drain water to a common pour point. It can be identified on a topographic map by tracing two uphill lines in two directions running perpendicular to the contours until a ridge is found. The ridge line is then followed (possibly through peaks and saddles) until the other line perpendicular to the contours is met.
3
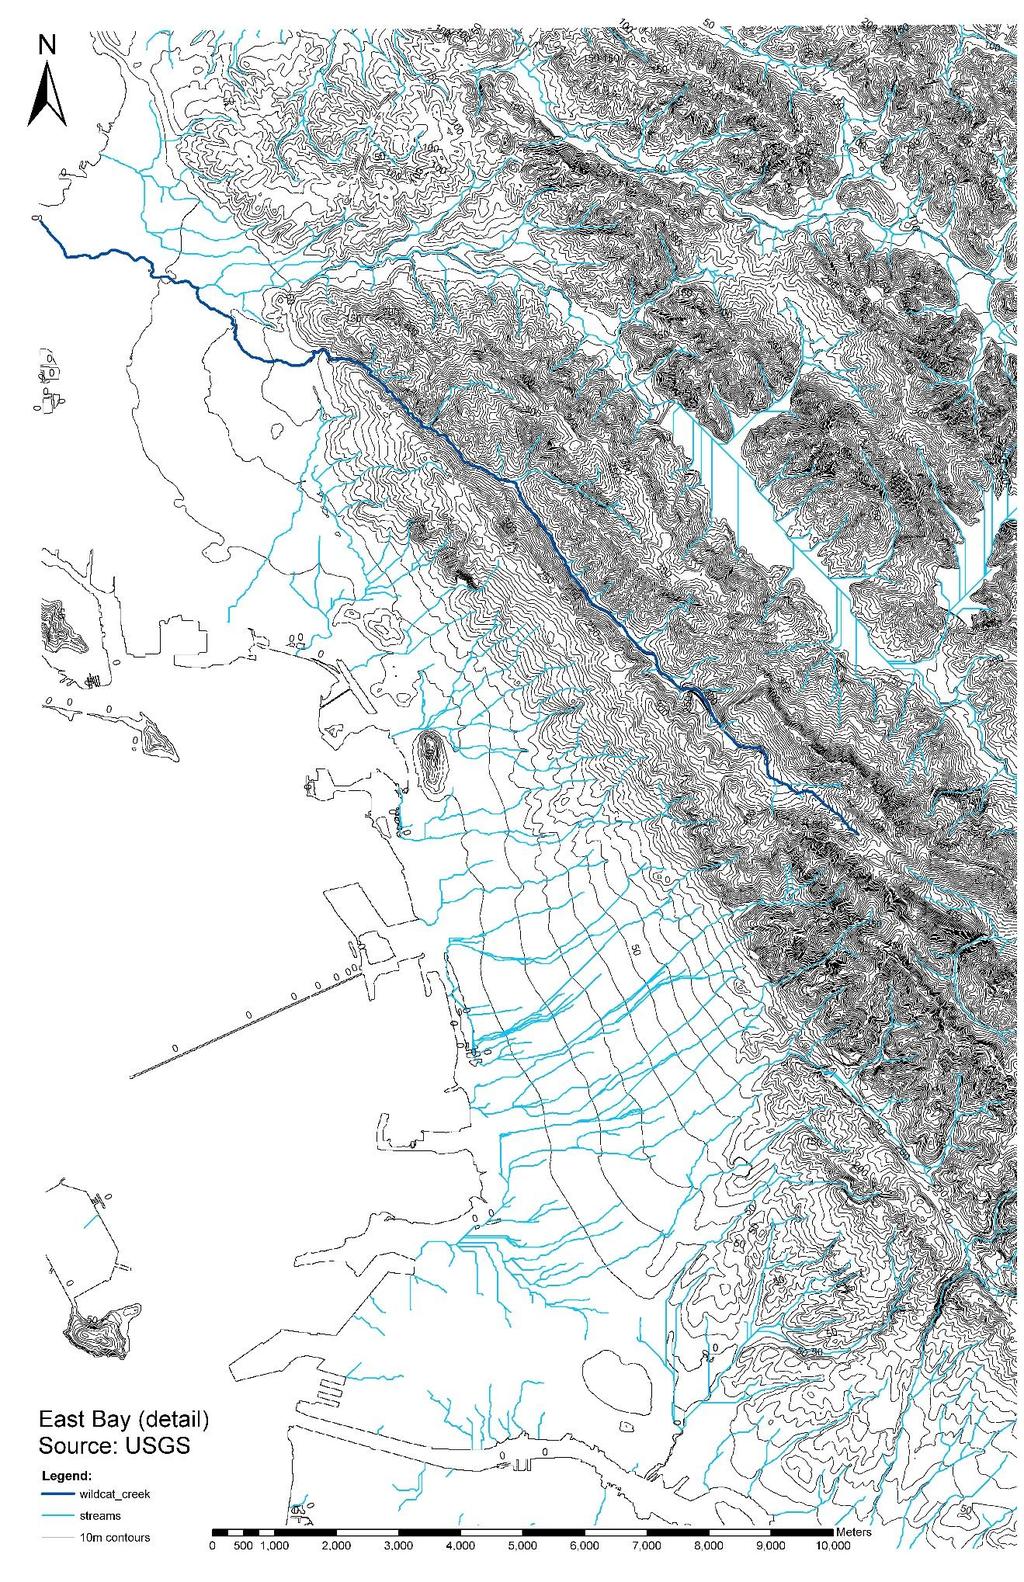
4 On the previous page is a topographic map of the East Bay. The contour intervals (black) are 10 m, and the streams (light blue) are automatically generated. The Wildcat Creek (dark blue) runs from the Berkeley Hills northwestward into Richmond. 1) What kind of structural feature determines the linearity and flow path of Wildcat Creek? (1 pt) 2) Outline on the map or sketch below the alluvial fan that Wildcat Creek has built. (1 pt) We will now make some measurements from this map. In particular, we are interested in determining the slope of Wildcat Creek near its source, in an intermediate reach and near the mouth. The slope between two points is defined by the difference in elevation divided by the distance (rise over run). Elevation difference can be obtained by counting the contours between two points (multiplied by the contour interval), while distance can be measured using a ruler. As the units on your ruler are not the same as on the map, determine the appropriate conversion by measuring the scale bar at the bottom of each map. For example, if 1000 m on the map scale is 5 cm on your ruler, you would know that 1 cm on your ruler is 200 m on the map. Note that since we will work on some maps with detail views of the East Bay area in different scales, the scale bars will not be the same on different maps. There is no path of Wildcat Creek in the maps, so the first step of each exercise will be recognizing Wildcat Creek from the contour lines. When tracing the path of the creek between the indicated points, remember that contours intersect streams forming a V or a U with the apex of the V pointing upstream. Below is a detail showing the source area of Wildcat Creek.
5 3) Trace the path of the creek between point A and point A. What is the distance (in map units) between A and A? The elevation change? The slope? Show your work. (3 pts) Below is a detail showing an intermediate reach of Wildcat Creek.
 Below is a detail showing the mouth of Wildcat Creek.")
6 4) Trace the path of the creek between point B and point B. What is the distance (in map units) between B and B? The elevation change? The slope? Show your work. (3 pts) Below is a detail showing the mouth of Wildcat Creek. As no information is available between the contour lines between C and C, refer to the large map to estimate the path of the creek.
7 5) Trace the path of the creek between point C and point C. What is the distance (in map units) between C and C? The elevation change? The slope? Show your work. (3 pts) 6) Using the measurements you just made, estimate the type of particles (e.g. boulders, cobbles, pebbles, sand, silt) you may find on the bed of Wildcat Creek in reaches A, B and C. In what depositional environment would you expect to find conglomerate deposits? (3 pts)

8 The burst of light detection and ranging (LiDAR) technology gives the ability of generating high-resolution data to topographic maps. LiDAR is an optical remote sensing technology that measures properties of scattered light to find range and/or other information of a distant target. The map shown below is a detail of the Lone Tree watershed in Marin Co., California. The LiDAR data are in sub-meter spacing. Notice how details of the terrain are captured. Below is another detail of the same area. Notice the streams and ridges.
 The figure below shows a detail of the landslide scar.")
9 7) Outline the watershed above point B. In other words determine the region from which water could flow to point B. You will need to trace from B outward, and then follow the ridge all the way around. This region is the contributing area of point B. For extra credit, estimate the contributing area in square meters. (4 pts) The figure below shows a detail of the landslide scar. Notice the kinks in the contours above and below the landslide. At these kinks the contours become closer to each other, indicating an
10 increase in slope. Use this information to visualize the outer perimeter of the landslide and think about how deep it might be. The 5 contours closest to each other at the top of the scar (on the right in the map) could give you an indication of its maximum depth. In contrast, the opposite end is much shallower. 8) Estimate the volume of this landslide in cubic meters. Use an approximate perimeter and an average depth. Do not worry about being exact, but show your work. You can quickly obtain a ball-park figure by assuming a rectangular shape and vertical walls. (3 pts) Part 2: Geologic maps (13 points) The geologic map of Marble Canyon, Arizona is on your table. The purpose of a geologic map is
11 to show surface geologic features (e.g., rock types, ages) in terms of different colors and symbols. All geologic maps have several common features: [1] colored areas and letter symbols to represent the rock units on the surface in any given area, [2] lines to show the types and locations of contacts and faults and [3] strike and dip symbols to show the orientations of the formations. Rock units or geologic strata are normally shown by color or symbols to indicate where they are exposed at the surface. Because the geology of different regions can vary considerably, each map will have its own color labels. The creation of any geologic map often demands skilled interpretation by the authors as to the location of contacts between lithologies, the occurrence and character of faults and folds and identification of different rock units. Different colors on this map represent different geologic units. A geologic unit is a volume of a certain kind of rock in a given age range. For example, a sandstone in one age might be colored bright orange, while a sandstone of a different age might be colored pale brown. In addition to color, each geologic unit is assigned a set of letters to symbolize it on the map. Usually the symbol is the combination of an initial capital letter followed by one or more small letters. The capital letter represents the age of the geologic unit. 9) What is the scale and total area of this map (in meters squared)? (1 pt) 10) What major river occurs on this map? (1 pt) 11) What type of rock dominates this map? (2 pts) 12) What are the oldest exposed rock types in this map area, and what age are they? Where are they exposed on this map and what famous geologic structure are they from? (4 pts) 13) You want to study events from the Jurassic-Cretaceous boundary. Is this a good area to focus on your field work? Why or why not? (2 pts)
12 14) Faults are shown by heavy black lines. Note the location and general orientation of faults on this map. (2 pts) 15) Valuable ore deposits of gold, copper and silver are commonly associated with contacts between metamorphic and igneous rocks. Is Marble Canyon a good prospecting location? (1 pt) Part 3: Geologic structure (30 points) Geology exists in three dimensions, but when we display it on a map, we see only two dimensions. To convey accurately the nature of geologic objects, we must use a shorthand notation to specify orientation in three dimensions. For a planar feature, its three-dimensional orientation is described by its strike and dip. Strike is the line formed by the intersection of a horizontal plane with the plane of the feature. The strike of a rock layer fixes its orientation with respect to compass direction. The angle the layer dips into the ground is its dip. It is always perpendicular to strike. To visualize strike and dip, consider a tilted board placed in a tub of water. The board s strike corresponds to the line traced on the board by the surface of the water. The dip is the direction water poured on the board would flow down. The strike-and-dip symbol is T-shaped. The long line is parallel to the strike, and the tick mark indicates the direction of dip. These two lines (and strike and dip) are always at right angles to each other. A number next to the strike-and-dip symbol indicates the number of degrees the bed dips from the horizontal. The quantitative value of the strike is not shown explicitly with the strike-and-dip symbol. It is obtained by measuring the angle between the strike line of the
.")
. Measure the strike of each layer and report it in azimuthal form (e.g.")
13 symbol and a line pointing north. Strike is expressed in terms of quadrant (e.g. S45ºE) or as an azimuth (e.g. 135º). In addition to the general T-shaped strike-and-dip symbol, three unique orientations of rock layers require special strike-and-dip symbols (see below). 16) Label the arrows below as either strike or dip. (1 pt) 17) Each of the six map views below show the outcrop pattern of a different rock layer. On each unit, draw the strike-and-dip symbol (you can choose either dip direction). Measure the strike of each layer and report it in azimuthal form (e.g. 122 ) in the provided blank space above each map. (6 pts) Strike: Strike: Strike:

 18) Below are")


, (d) and (e)")
14 (a) (b) (c) Strike: Strike: Strike: (d) (e) (f) 18) Below are five block diagrams illustrating different orientations of a planar rock unit. On the top of each block, draw the proper strike-and-dip symbol. Estimate the dip of the layer for (b), (d) and (e) and write it next to the dip symbol. (5 pts) (a) (b) (c)


 consider that the layers are dipping toward north with an angle of 45.")


15 (d) (e) 19) The following block diagrams will help you visualize in three dimensions. Each block provides incomplete information about some rock layer as it would show on cubes cut from the Earth s crust. The top of each block is a horizontal surface. The other two visible sides are crosssections formed when the cube was cut from the crust. Complete the subsurface view on the blank face(s) of each block. For (d) consider that the layers are dipping toward north with an angle of 45. (6 pts) N (a) (b) (c) (d) (e) (f) On flat surfaces, rock layers have fairly simple outcrop patterns. On a map, horizontal layers underlying flat topography will produce a map pattern showing only one pattern. However, a distinct pattern develops when beds cross stream valleys or gullies. If a valley cuts the same sequence, more layers will appear on the map, and those layers will define a particular pattern: a V shape. Interpreting these patterns leads to the rule of V s. From it, you can determine the dip direction of rock layers and something about the subsurface nature of an area.
: upstream downstream and parallel cross contour lines c.")
16 20) Complete these 4 rules of V s: (6 pts) a. If a bed is vertical, contacts will (check one): point upstream point downstream run straight across a valley b. The contacts of horizontal beds will point (check one from each group): upstream downstream and parallel cross contour lines c. If a bed dips upstream, its contacts will point (check one from each group): upstream downstream and parallel cross contour lines d. Beds that dip downstream will have contacts that point (check one): upstream downstream 21) Below are two maps of rock units crossing a stream valley. Black bands on opposite sides of the maps identify the outcrops of the unit, and the numbers indicate the elevations of the contour lines. Complete the outcrop pattern for a rock body with a horizontal dip (A) and a vertical dip (B). (2 pts)


17 (A) Bed follows contour interval (B) Bed only visible downstream In general, most rock layers will have dips that are between horizontal and vertical. When a valley cuts such beds, the map outcrop pattern will be deflected along the valley. The direction of the deflection is determined by the bed s dip relative to the slope of the valley. The diagram below shows two dipping units across a small stream valley in block diagrams (left) and map views (right). Both types of diagrams should illustrate how contour lines deflect in the valley, but the outcrop pattern in the map view is only shown up to the valley rim. 22) Complete the outcrop pattern on each map. (4 pts) A B Part 4: Geologic cross-sections (36 points)

18 Geologic cross-sections are useful for visualizing spatial and temporal relationships of geologic units that occur in an area. Steep river canyons, sea cliffs, mountain sides and road cuts yield natural cross-sections, but most cross-sections are made by projecting surface features into the Earth or by interpreting data from seismic waves. From geologic maps, we can construct geologic cross sections (vertical planes of the subsurface) that show geologic structures beneath the surface. The top of a cross-section shows the topography of the land and below that the geometric relations of the different rock units that crop out at the surface. Geologic information such as strike and dip is used to project the units that crop out at the surface into the subsurface. Cross-sections are extremely useful for visualizing the spatial and temporal relationships of the geologic units that occur in an area. With a little bit of practice, it is a fairly straightforward procedure to create a cross-section from a map. Definitions Disconformity: A disconformity is an unconformity between parallel layers of sedimentary rocks which represents a
![period of erosion or non-deposition. [1] Paraconformity is a type of disconformity in which the separation is a simple bedding plane (i.e. there is no obvious buried erosional surface).](/docs-images/93/113198031/images/19-0.jpg "[2] Blended unconformity is a type of disconformity or nonconformity with no distinct separation plane or contact, sometimes consisting of soils, paleosols or beds of pebbles derived from the")
19 period of erosion or non-deposition. [1] Paraconformity is a type of disconformity in which the separation is a simple bedding plane (i.e. there is no obvious buried erosional surface). [2] Blended unconformity is a type of disconformity or nonconformity with no distinct separation plane or contact, sometimes consisting of soils, paleosols or beds of pebbles derived from the underlying rock. Nonconformity: A nonconformity exists between sedimentary rocks and metamorphic or igneous rocks when the sedimentary rock lies above and was deposited on the pre-existing and eroded metamorphic or igneous rock. Namely, if the rock below the break is igneous or has lost its bedding by metamorphism, the plane of juncture is a nonconformity. Angular unconformity: An angular unconformity is an unconformity where horizontally parallel strata of sedimentary rock are deposited on tilted and eroded layers, producing an angular discordance with the overlying horizontal layers. The whole sequence may be deformed and tilted by orogenic activity afterward. Below is a map of a region with generally flat topography and the corresponding legends. A blank cross-section template is shown below this map. The best orientation for your cross section is a horizontal line which cuts all the rock units exposed. This traverse line is drawn on the map with the right end marked A and the left marked A. Your cross-section (currently blank) is also labeled this way. Complete the following steps: 23) Assign a number to each unique geologic unit, starting with 1 for the youngest. (3 pts)
 in the section by drawing a wavy line over a horizontal line to the right of the time scale.")
20 24) According to the time period (the right column of the geologic time scale to the right), write the numbers of the units that were formed during which time (i.e., from 1 to 13). Indicate each unconformity (identifiable by a lack of rocks from that time period) in the section by drawing a wavy line over a horizontal line to the right of the time scale. Label each line with a Roman numeral starting with I for the youngest. (Hint: you should find three.) On the map, mark the location of each unconformity with a wavy line and label it with its proper Roman numeral. (4 pts) 25) Using the steps described earlier in this lab, complete the cross-section in the box in the previous figure. Be sure to mark the unconformities with a wavy line. (9 pts) 26) Three more unconformities of limited time spans cannot be identified using the previous procedure. Use your cross-section to locate these additional unconformities. Identify each with a capital letter (A for youngest) at the top of the map. Mark their positions on the map with wavy lines. (3 pts) 27) In the first column of the table below, list the letters and Roman numerals of the unconformities (in chronological order). In the second column, match the letters with the type of unconformity (angular, disconformity or nonconformity). Report the geologic processes (uplift, deposition and/or erosion) that are indicated by each unconformity in the third column. (Hint: it usually requires more than one process.) (6 pts) Letter Type of unconformity Geologic event
21 28) Review the geologic map of Marble Canyon, Arizona and try to imagine the structures in three dimensions. How many unconformities are present? (1 pt) 29) The map below presents a slightly more complicated configuration in an area of different rock types, but still similar to those you've just seen in the previous example. Construct a crosssection across line A-A' and then answer the questions. (3 pts)
22 30) What is the oldest rock unit here? (1 pt) 31) What is the youngest rock unit here? (1 pt) 32) What two types of folds can you identify in the cross-section? (2 pts) 33) Label each fold on the cross-section with the corresponding fold type and label the fold axes. (1 pt) 34) What is the plunge of a fold? Assuming north is at the top of the map, in which direction do these folds plunge? (2 pts)
Structural Geology Lab. The Objectives are to gain experience
 Geology 2 Structural Geology Lab The Objectives are to gain experience 1. Drawing cross sections from information given on geologic maps. 2. Recognizing folds and naming their parts on stereoscopic air
Structural Geology Lab. The Objectives are to gain experience
 Geology 2 Structural Geology Lab The Objectives are to gain experience 1. Drawing cross sections from information given on geologic maps. 2. Recognizing folds and naming their parts on stereoscopic air
A. Refer to Appendix F in back of lab manual for list of commonly used geologic map symbols
 Structural Geology Lab 2: Outcrop Patterns and Structure Contours I. Geologic Map Symbols A. Refer to Appendix F in back of lab manual for list of commonly used geologic map symbols 1. Emphasis: a. strike
Name. GEOL.5220 Structural Geology Faults, Folds, Outcrop Patterns and Geologic Maps. I. Properties of Earth Materials
 I. Properties of Earth Materials GEOL.5220 Structural Geology Faults, Folds, Outcrop Patterns and Geologic Maps Name When rocks are subjected to differential stress the resulting build-up in strain can
Part I. PRELAB SECTION To be completed before labs starts:
 Student Name: Physical Geology 101 Laboratory #13 Structural Geology II Drawing and Analyzing Folds and Faults Grade: Introduction & Purpose: Structural geology is the study of how geologic rock units
GEOL 02: Historical Geology Lab 14: Topographic Maps. Name: Date:
 GEOL 02: Historical Geology Lab 14: Topographic Maps Name: Date: A topographic map is a two dimensional (flat) representation (model) of a three dimensional land surface (landscape). It shows landforms
EOSC 110 Reading Week Activity, February Visible Geology: Building structural geology skills by exploring 3D models online
 EOSC 110 Reading Week Activity, February 2015. Visible Geology: Building structural geology skills by exploring 3D models online Geological maps show where rocks of different ages occur on the Earth s
Geology 101 Lab Worksheet: Geologic Structures
 Name: Geology 101 Lab Worksheet: Geologic Structures Refer to the Geologic Structures Lab for the information you need to complete this worksheet (http://commons.wvc.edu/rdawes/g101ocl/labs/structurelab.html).
Lab 6: Plate tectonics, structural geology and geologic maps
 Geology 103 Name(s): Lab 6: Plate tectonics, structural geology and geologic maps Objective: To show the effects of plate tectonics on a large-scale set of rocks and to reconstruct the geological history
GLY 155 Introduction to Physical Geology, W. Altermann. Press & Siever, compressive forces. Compressive forces cause folding and faulting.
 Press & Siever, 1995 compressive forces Compressive forces cause folding and faulting. faults 1 Uplift is followed by erosion, which creates new horizontal surface. lava flows Volcanic eruptions cover
EROSIONAL FEATURES. reflect
 reflect Have you ever looked at the land around you and wondered what processes shaped what you see? Perhaps you see mountains, valleys, rivers, or canyons. Do you know how long these geologic features
Staple this part to part one of lab 6 and turn in. Lab 6, part two: Structural geology (analysis)
") Geology 101 Staple this part to part one of lab 6 and turn in Lab 6, part two: Structural geology (analysis) Recall that the objective of this lab is to describe the geologic structures of Cougar Mountain
Geology 101 Staple this part to part one of lab 6 and turn in Lab 6, part two: Structural geology (analysis) Recall that the objective of this lab is to describe the geologic structures of Cougar Mountain
Section 7. Reading the Geologic History of Your Community. What Do You See? Think About It. Investigate. Learning Outcomes
 Chapter 3 Minerals, Rocks, and Structures Section 7 Reading the Geologic History of Your Community What Do You See? Learning Outcomes In this section, you will Goals Text Learning Outcomes In this section,
Geologic Mapping Regional Tournament Trial Event
 Geologic Mapping Regional Tournament Trial Event A TEAM OF UP TO: 2 Team Name AVAILABLE TIME: 50 min Required Materials: Each team MUST have a protractor, ruler, non-programmable calculator, colored pencils,
Erosional Features. What processes shaped this landscape?
 Have you ever looked at the land around you and wondered what processes shaped what you see? Perhaps you see mountains, valleys, rivers, or canyons. Do you know how long these geologic features have been
Geology 101 Lab Worksheet: Topographic Maps
 Geology 101 Lab Worksheet: Topographic Maps Name: Refer to the Topographic Maps Lab for the information you need to complete this worksheet (http://commons.wvc.edu/rdawes/g101ocl/labs/topomapslab.html).
Chapter 8: Geological Structures. Part 1: Strike, Dip, and Structural Cross-Sections
 Chapter 8: Geological Structures Part 1: Strike, Dip, and Structural Cross-Sections Adapted by Karla Panchuk, Joyce M. McBeth, Lyndsay R. Hauber, & Michael B. Cuggy (2018) University of Saskatchewan from
LAB 1: ORIENTATION OF LINES AND PLANES
 LAB 1: ORIENTATION OF LINES AND PLANES Read the introductory section, chapter 1, pages 1-3, of the manual by Rowland et al (2007) and make sure you understand the concepts of bearing, strike, dip, trend,
Directed Reading page
 Skills Worksheet Directed Reading page 185-190 Section: Determining Relative Age 1. How old is Earth estimated to be? 2. Who originated the idea that Earth is billions of years old? 3. On what did the
GEOL 3700 STRUCTURE AND TECTONICS LABORATORY EXERCISE 3
 GEOL 3700 STRUCTURE AND TECTONICS LABORATORY EXERCISE 3 Goals: 1. Improve your map-reading and map-making skills. 2. Learn to generate and interpret structure contour maps. 3. Learn to generate and interpret
Chapter 3 SECTION 1 OBJECTIVES
 Chapter 3 SECTION 1 OBJECTIVES Distinguish between latitude and longitude and locate coordinates on maps. Explain how latitude and longitude can be used to locate places on Earth s surface. Explain the
Team Name. Name(s) SSSS Unome Geologic Mapping Test Packet p1
 SSSS Unome Geologic Mapping Test Packet p1") Scioly Summer Study Session 2018-2019 Geologic Mapping Test Packet Written by Unome Instructions 1) This test is based on the 2016 rules for Geologic Mapping. 2) This test is out of 115 points. Questions
Scioly Summer Study Session 2018-2019 Geologic Mapping Test Packet Written by Unome Instructions 1) This test is based on the 2016 rules for Geologic Mapping. 2) This test is out of 115 points. Questions
Notes and Summary pages:
 Topographic Mapping 8.9C Interpret topographical maps and satellite views to identify land and erosional features and predict how these shapes may be reshaped by weathering ATL Skills: Communication taking
UNDERSTANDING GEOLOGIC M APS
 Name: Lab Section: work in groups, but each person turns in his/her own GEOSCIENCE 001 L AB UNDERSTANDING GEOLOGIC M APS Geologic maps are colorful and even beautiful, but they also contain an amazing
In this lab, we will study and analyze geologic maps from a few regions, including the Grand Canyon, western Wyoming, and coastal California.
 Name: Lab Section: work in groups, but each person turns in his/her own GEOSCIENCE 001 LAB UNDERSTANDING GEOLOGIC MAPS Geologic maps are colorful and even beautiful, but they also contain an amazing amount
Name Geo 4 Practice Match the principle on the left (column A) with the definition (or part of the definition) on the right (column B).
 with the definition (or part of the definition) on the right (column B).") Name Geo 4 Practice 1 Target 1 2 3 4 Geo 4 I can define the create, alter and/or destroy the rock record. I can interpret a diagram to determine the sequence of events (relative age) in Earth s history
Name Geo 4 Practice 1 Target 1 2 3 4 Geo 4 I can define the create, alter and/or destroy the rock record. I can interpret a diagram to determine the sequence of events (relative age) in Earth s history
Topographic Maps. Take Notes as you view the slides
 Topographic Maps Take Notes as you view the slides Lesson Objectives Define a topographic map and state its uses. Describe how contour lines show the elevations, shape, and slope of the land. Identify
Field Trip to Tempe Butte
 Synopsis Field Trip to Tempe Butte So far you have been identifying rocks and mapping their locations without actually going there. Now it is your chance to put it all together and see real rocks out in
UNCONFORMITY. Commonly four types of unconformities are distinguished by geologists: a) Disconformity (Parallel Unconformity)
 Disconformity (Parallel Unconformity)") UNCONFORMITY Unconformities are gaps in the geologic record that may indicate episodes of crustal deformation, erosion, and sea level variations. They are a feature of stratified rocks, and are therefore
UNCONFORMITY Unconformities are gaps in the geologic record that may indicate episodes of crustal deformation, erosion, and sea level variations. They are a feature of stratified rocks, and are therefore
GEOLOGIC MAPS PART II
 EARTH AND ENVIRONMENT THROUGH TIME LABORATORY - EES 1005 LABORATORY FIVE GEOLOGIC MAPS PART II Introduction Geologic maps of orogenic belts are much more complex than maps of the stable interior. Just
N30 E-45 SE S25 E-10 SW N85 W-80 NE
 Geologic aps and tructures Name Geology 100 Harbor section Read h. 7 before you begin. The objectives of this lab are for you to learn the basic geologic structures in 3- and to develop some facility in
Lab 7: STRUCTURAL GEOLOGY FOLDS AND FAULTS
 Lab 7: STRUCTURAL GEOLOGY FOLDS AND FAULTS This set of labs will focus on the structures that result from deformation in earth s crust, namely folds and faults. By the end of these labs you should be able
Ge Problem Set 1
 Ge 101 2012 Problem Set 1 This problem set covers basic techniques in structural geology, geomorphology and the construction of cross sections. Questions 2 and 3 are simple exercises; 1 and 4 are reallife
Using Map and Compass Together
 Using Map and Compass Together In situations where you foresee a potential evacuation on foot, where there are no roads, and no indication as to the direction of travel (i.e., road signs), it is recommended
You must take the exam in the lecture section for which you are registered. Any exceptions must be cleared with the instructor in advance.
 Geo 101, Fall 2000 Review Questions for Final Exam GEOLOGIC TIME AND FOLDING AND FAULTING THE FINAL EXAM FOR MWF CLASS WILL BE TUESDAY 1400 THE FINAL EXAM FOR TR CLASS WILL BE FRIDAY 930 These questions
Topographic Maps and Landforms Geology Lab
 Topographic Maps and Landforms Geology Lab Ray Rector: Instructor Today s Lab Activities 1) Discussion of Last Week s Lab 2) Lecture on Topo Maps and Elevation Contours 3) Construct Topographic Maps and
Geologic Mapping Invitational Trial Event
 Geologic Mapping Invitational Trial Event A TEAM OF UP TO: 2 Team Name AVAILABLE TIME: 50 min Required Materials: Each team MUST have a protractor, ruler, non-programmable calculator, colored pencils,
Lab 4: Structures and Geologic Maps
 Key Questions: GEOL 1311 Earth Science Lab 4 Structures and Geologic Maps What shapes do rock bodies take in the Earth? How do two-dimensional visualizations of the Earth, such as maps and cross-sections
STAAR Science Tutorial 40 TEK 8.9C: Topographic Maps & Erosional Landforms
 Name: Teacher: Pd. Date: STAAR Science Tutorial 40 TEK 8.9C: Topographic Maps & Erosional Landforms TEK 8.9C: Interpret topographic maps and satellite views to identify land and erosional features and
depression above scarp scarp
 1 LAB 1: FIELD TRIP TO McKINLEYVILLE AND MOUTH OF THE MAD RIVER OBJECTIVES: a. to look at geomorphic and geologic evidence for large scale thrust-faulting of young sediments in the Humboldt Bay region
Structural Geology and Geology Maps Lab
 Structural Geology and Geology Maps Lab Mesa College Geology 101 Lab Ray Rector: Instructor Structural Geology Lab Pre-Lab Resources Pre-Lab Internet Links 1) Fundamentals of Structural Geology 2) Visualizing
Law of Superposition Law of Superposition
 History of Earth Relative Dating In the same way that a history book shows an order of events, layers of rock (called strata) show the sequence of events that took place in the past. Using a few basic
Compass Basics. Quick Map Basics Review For Compass Use
 Compass Basics Quick Map Basics Review For Compass Use A topographic map tells you where things are and how to get to them, whether you're hiking, biking, hunting, fishing, or just interested in the world
Stratigraphic Cross-Section
 Stratigraphic cross-sections are used to show stratigraphic relationships of strata along some path. They differ from structural cross-sections in three ways. First, their goals differ. Stratigraphic cross-sections
Page 1. Name:
 Name: Questions 1 through 3 refer to the following: The diagrams below represent two rock outcrops found several miles apart in New York State. Individual rock layers are lettered, and fossils and rock
Geohistory Review. Things you need to know:
 Geohistory Review Things you need to know: a) The earth and the solar system are 4.5 billion years old (4.5 X 10 9 ) b) Law of original horizontality: Sedimentary rock layers are always deposited as horizontal
General Geology Lab #7: Geologic Time & Relative Dating
 General Geology 89.101 Name: General Geology Lab #7: Geologic Time & Relative Dating Purpose: To use relative dating techniques to interpret geological cross sections. Procedure: Today we will be interpreting
Objectives: Define Relative Age, Absolute Age
 S6E5. Students will investigate the scientific view of how the earth s surface is formed. c. Classify rocks by their process of formation. g. Describe how fossils show evidence of the changing surface
State the principle of uniformitarianism. Explain how the law of superposition can be used to determine the relative age of rocks.
 Objectives State the principle of uniformitarianism. Explain how the law of superposition can be used to determine the relative age of rocks. Compare three types of unconformities. Apply the law of crosscutting
Geoscience 001 Fall Rock Identification and Contextual Interpretation
 Geoscience 00 Fall 2005 Rock Identification and Contextual Interpretation The purpose of this week s lab is to gain some more experience and practice in identifying rocks and then interpreting the geologic
Name. 4. The diagram below shows a soil profile formed in an area of granite bedrock. Four different soil horizons, A, B, C, and D, are shown.
 Name 1. In the cross section of the hill shown below, which rock units are probably most resistant to weathering? 4. The diagram below shows a soil profile formed in an area of granite bedrock. Four different
Answers: Internal Processes and Structures (Isostasy)
") Answers: Internal Processes and Structures (Isostasy) 1. Analyse the adjustment of the crust to changes in loads associated with volcanism, mountain building, erosion, and glaciation by using the concept
Answers: Internal Processes and Structures (Isostasy) 1. Analyse the adjustment of the crust to changes in loads associated with volcanism, mountain building, erosion, and glaciation by using the concept
Examining the Terrestrial Planets (Chapter 20)
") GEOLOGY 306 Laboratory Instructor: TERRY J. BOROUGHS NAME: Examining the Terrestrial Planets (Chapter 20) For this assignment you will require: a calculator, colored pencils, a metric ruler, and your geology
GEOLOGY 306 Laboratory Instructor: TERRY J. BOROUGHS NAME: Examining the Terrestrial Planets (Chapter 20) For this assignment you will require: a calculator, colored pencils, a metric ruler, and your geology
56H. This system allows definition of points on the Earth s surface to within 100 meters. Page 20. Navigation Systems Basics of Maps
 Grid References Many maps are provided with the standard grid overlaying them. This provides a simple and accurate method for finding features on the map. It is a network of intersecting parallel lines
Unit 7.2 W.E.D. & Topography Test
 Name: Score: Unit 7.2 W.E.D. & Topography Test 1. 2. 3. 4. 5. 6. 7. 8. 9. 10. 11. 12. 13. 14. 15. 16. 17. 18. 19. 20. 21. 22. 23. 24. 25. 1. The formation of mountains is due mainly to while the destruction
Today you will be able to: Utilize the SEVEN rules of rock age identification to describe the geologic age of this rock sequence!
 Mr. Sandomenico Welcome!!!! Today we will begin a new unit! The Earth s History!!!!! Today you will be able to: Utilize the SEVEN rules of rock age identification to describe the geologic age of this rock
***When doing the lab report write-up, be sure to follow the guidelines.***
 Topographic Maps Lab Vocabulary: topography - study of the shapes and features of the earth's surface elevation - height above sea level bench mark - a point that has been accurately measured for its position
Name: Mid-Year Review #2 SAR
 Name: Mid-Year Review #2 SAR Base your answers to questions 1 through 3 on on the diagram below, which shows laboratory materials used for an investigation of the effects of sediment size on permeability,
Landforms and Rock Structure
 Landforms and Rock Structure Rock Structure as a Landform Control Landforms of Horizontal Strata and Coastal Plains Landforms of Warped Rock Layers Landforms Developed on Other Land-Mass Types Landforms
Relative Age-dating -- Discovery of Important Stratigraphic Principles
 Roger Steinberg Assistant Professor of Geology Del Mar College 101 Baldwin Corpus Christi, TX 78404 361-698-1665 rsteinb@delmaredu Abstract: When piecing together the geologic history of the Earth, geologists
Relative Dating Exercises
 Laboratory 1 Relative Dating Exercises Pamela J. W. Gore Department of Geology, Georgia Perimeter College Clarkston, GA 30021 Copyright 1998-2005 Pamela J. W. Gore Examine the geologic cross sections which
Topographic Maps. More than a Road Map
 Topographic Maps More than a Road Map What is a Topographic Map? Scaled representation of features on the surface of the Earth such as roads, rivers, and plains Provides information about land elevations
UNIT 1C. USING TOPOGRAPHIC MAPS WHERE IN THE WORLD... ARE YOU?
 UNIT 1C. USING TOPOGRAPHIC MAPS WHERE IN THE WORLD... ARE YOU? TIME 60-90 minutes LEVEL All BENCHMARKS Next Generation Science Standards MS-LS1.D Science & Engineering Practices Developing and Using Models
Structural Analysis of Rocks and Regions 2017 Maps and cross-sections
 Structural Analysis of Rocks and Regions 2017 Maps and cross-sections The practicals in SARR will introduce you to (or remind you of) the tools and skills that are typically used to reconstruct and quantify
Section 5. Rock Units and Your Community. What Do You See? Think About It. Investigate. Learning Outcomes
 Chapter 3 Minerals, Rocks, and Structures Section 5 Rock Units and Your Community What Do You See? Learning Outcomes In this section, you will Recognize that rocks are arranged in Earth s crust as well-defined
Relative Dating. The Rock Cycle. Key Concept Scientists can interpret the sequence of events in Earth s history by studying rock layers.
 2 What You Will Learn The rock cycle includes the formation and recycling of rock. Relative dating establishes the order in which rocks formed or events took place. The principle of superposition states
4. The map below shows a meandering stream. Points A, B, C, and D represent locations along the stream bottom.
 1. Sediment is deposited as a river enters a lake because the A) velocity of the river decreases B) force of gravity decreases C) volume of water increases D) slope of the river increases 2. Which diagram
Geological mapwork: using surface geology to make a geological map Match the photos to a map to see how a geological map works
 eological mapwork: using surface geology to make a geological map Match the photos to a map to see how a geological map works For each of the photographs: 1. Draw straight lines to link each photograph
6. 地質圖 6.1 岩層於地形圖上的分布 6.2 地質剖面圖 6.3 地質圖判識 地調所五萬分之一地質圖台中圖幅
 6. 地質圖 6.1 岩層於地形圖上的分布 6.2 地質剖面圖 6.3 地質圖判識 A geological shows how geological features (rock units, faults, etc.) are distributed across a region. It is a twodimensional representation of part of the Earth
Writing Earth s History
 Earths History Writing Earth s History How is Earths History like writing in your Journal? Everyday, something happens and, with a pen, it is written down in the pages of your journal. As you continue,
Principles of Geology
 Principles of Geology Essential Questions What is Uniformitarianism? What is Catastrophism? What is Steno s s Law? What are the other geologic principles? How is relative age determined using these principles?
Geology 101 Lab Worksheet: Geologic Time
 Geology 101 Lab Worksheet: Geologic Time Name: Refer to the Geologic Time Lab for the information you need to complete this worksheet (http://commons.wvc.edu/rdawes/g101ocl/labs/geotimelab.html). All calculations
Unconformities are depositional contacts that overlie rocks distinctly older than they are. They are often called gaps in the sedimentary record.
 UNCONFORMITIES Unconformities are depositional contacts that overlie rocks distinctly older than they are. They are often called gaps in the sedimentary record. The contact represents time when no sediment
6. Relative and Absolute Dating
 6. Relative and Absolute Dating Adapted by Sean W. Lacey & Joyce M. McBeth (2018) University of Saskatchewan from Deline B, Harris R, & Tefend K. (2015) "Laboratory Manual for Introductory Geology". First
THE CONTACT BETWEEN THE PRECAMBRIAN SHIELD AND THE PHANEROZOIC SEDIMENTARY ROCKS Lab Report (Lab #2) Submitted to: Professor Simone Dumas
 Submitted to: Professor Simone Dumas") THE CONTACT BETWEEN THE PRECAMBRIAN SHIELD AND THE PHANEROZOIC SEDIMENTARY ROCKS Lab Report (Lab #2) Submitted to: Professor Simone Dumas For the course Introduction to Earth Materials (GE01115) By: Gabriella
THE CONTACT BETWEEN THE PRECAMBRIAN SHIELD AND THE PHANEROZOIC SEDIMENTARY ROCKS Lab Report (Lab #2) Submitted to: Professor Simone Dumas For the course Introduction to Earth Materials (GE01115) By: Gabriella
Geological mapwork from scratch 2: valley with simple geology Draw your own cross sections and 3D geological model
 Geological mapwork scratch 2: valley with simple geology Draw your own cross sections and 3D geological model A valley with a stream looks like this: Modified the Geograph project collection. Copyright
GY 112L Earth History
 GY 112L Earth History Lab 2 Vertical Successions and Sequences of Events GY 112L Instructors: Douglas Haywick, James Connors, Mary Anne Connors Department of Earth Sciences, University of South Alabama
11. ALPINE GLACIAL LANDFORMS
 Geomorphology 11. Alpine Glacial Landforms 11. ALPINE GLACIAL LANDFORMS 40 Points One objective of this exercise is for you be able to identify alpine glacial landforms and measure their characteristics.
Cross-Cutting Relationships Cross-Cutting and Sequencing Lab Earth Science Essentials-Advanced by Russ Colson
 Cross-Cutting Relationships Cross-Cutting and Sequencing Lab Earth Science Essentials-Advanced by Russ Colson Introduction: It isn't possible to bring all of outdoors into the classroom, and stratigraphic
Earth Science 11: Geologic Time Unit
 Earth Science 11: Geologic Time Unit Text: Chapters 8 Lab: Exercise 6 Name Earth Science 11: Geologic Time Page 1 Geology 12: Geologic Time 8.1: The Geologic Time Scale Today, we know that Earth is approximately
B) color B) Sediment must be compacted and cemented before it can change to sedimentary rock. D) igneous, metamorphic, and sedimentary rocks
 color B) Sediment must be compacted and cemented before it can change to sedimentary rock. D) igneous, metamorphic, and sedimentary rocks") 1. Which characteristic of nonsedimentary rocks would provide the least evidence about the environment in which the rocks were formed? A) structure B) color C) crystal size D) mineral composition 2. Which
1. Which characteristic of nonsedimentary rocks would provide the least evidence about the environment in which the rocks were formed? A) structure B) color C) crystal size D) mineral composition 2. Which
Earth s Changing Surface Chapter 4
 Name Hour Due Date Earth s Changing Surface Chapter (You do not need your book) Page 1 Fossils Summary Page 2 Traces of Tracks Page 3 Finding the Relative Age of Rocks Summary. Page - Finding the Relative
Interpreting Rock Layers
 Science Concept: Sedimentary rocks can be aged using the law of superposition. Unconformities can create exceptions to this law. Objectives: The student will: explain how rocks are dated by relative position
Determining geological ages
 Determining geological ages Relative ages placing rocks and geologic events in their proper sequence, oldest to youngest. Absolute dates define the actual numerical age of a particular geologic event.
Part 1: Observations for the Edwards Formation
 Name: Spring 2018 Professor name: Class Time: The Virtual Field trip is to be completed by your self. You should not work with a partner. This is not group work. Nor should you search for answers on the
Chapter 3 Models of the Earth. 3.1 Finding Locations on the Earth. 3.1 Objectives
 Chapter 3 Models of the Earth 3.1 Finding Locations on the Earth 3.1 Objectives Explain latitude and longitude. How can latitude and longitude be used to find locations on Earth? How can a magnetic compass
Ch 10 Deposition Practice Questions
 1. Base your answer to the following question on the data table below. Six identical cylinders, A through F, were filled with equal volumes of sorted spherical particles. The data table shows the particle
Earth and Space: Topographic Maps Satellite Images
 Earth and Space: Topographic Maps Satellite Images Earth and Space: Formative Assessment Activities for Earth and Space Topographic Maps Satellite Images Teacher Pages Purpose The purpose of this station
Relative Age-dating -- Discovery of Important Stratigraphic Principles Y
 R Steinberg DMC/4-08 EARTH HISTORY 1404 Example 1: Y S P Q Four different rock units (layers of different rock types), labeled Y, S, P, and Q, are seen in a road cut, as shown schematically above: 1) Are
SSSS Unome Geologic Mapping Answer Key p1
 Scioly Summer Study Session 2018-2019 Geologic Mapping Answer Key Written by Unome Instructions Because this test is written for SSSS, the answer key includes explanations for most questions. It is also
Geologic Time: Concepts and Principles
 Geologic Time: Concepts and Principles Introduction - An appreciation for the immensity of geologic time is essential for understanding the history of our planet - Geologists use two references for time
Geological Mapping C Answer Key
 Northern Regional: January 19 th, 2019 Geological Mapping C Answer Key Name(s): Team Name: School Name: Team Number: Rank: Score: UF GEOMAP KEY Multiple Choice- Select All: 1. A, B, C 2. A, E 3. B, D 4.
Structural Geology, GEOL 330 Fold mapping lab: Even folds get parasites Spring, 2012
 Structural Geology, GEOL 330 Name: Fold mapping lab: Even folds get parasites Spring, 2012 This exercise is meant to mimic a field experience in which you, the student, will measure beddingcleavage relationships
GEOL 10: Environmental Geology Activity 9: Topographic Maps and Mt. St. Helens. Name: Date:
 GEOL 10: Environmental Geology Activity 9: Topographic Maps and Mt. St. Helens Name: Date: A topographic map is a two dimensional (flat) representation (model) of a three dimensional land surface (landscape).
Starting at Rock Bottom
 Starting at Rock Bottom At rock bottom of the Brushy Creek site s geological column lies the first clue to human habitation: A smelting and heattreating furnace, and mold, carved into Bed Ked: Figure 15
Module/Unit: Landforms Grade Level: Fifth
 Module/Unit: Landforms Grade Level: Fifth PA Academic Standards for Science and Technology and Environment and Ecology: 3.1.7.B Describe the use of models as an application or scientific or technological
As compaction and cementation of these sediments eventually occur, which area will become siltstone? A) A B) B C) C D) D
 A B) B C) C D) D") 1. A student obtains a cup of quartz sand from a beach. A saltwater solution is poured into the sand and allowed to evaporate. The mineral residue from the saltwater solution cements the sand grains together,
1. A student obtains a cup of quartz sand from a beach. A saltwater solution is poured into the sand and allowed to evaporate. The mineral residue from the saltwater solution cements the sand grains together,
APPENDIX A GLOSSARY. Appendix A.1
 APPENDIX A GLOSSARY Appendix A.1 Appendix A.2 Back Bearing A back bearing is measured from the object to your position. It is the exact opposite of a direct bearing. Base Line An imaginary line on the
Before the 1700 s, scientists thought that the Earth was only 6,000 years old. This mindset was based on biblical references.
 Before the 1700 s, scientists thought that the Earth was only 6,000 years old. This mindset was based on biblical references. However, as scientists began to better understand the processes that shape
APPENDIX F PRE-COURSE WORK
 APPENDIX F PRE-COURSE WORK F-1 Pre-Course Work F-2 Pre-Course Work Intermediate Wildland Fire Behavior, S-290 Pre-Course Work The pre-course work is designed to ensure that students come to class with