Aldo Ferrero, Francesco Vidotto, Fernando De Palo. RUNOFF team
|
|
|
- Bryan Hubbard
- 6 years ago
- Views:
Transcription
")

1 TOPPS ACADEMY th June 2015 Grugliasco (TO) Aldo Ferrero, Francesco Vidotto, Fernando De Palo RUNOFF team


 risk")


2 DIAGNOSIS what data do we need? collection of territorial data (soils, elevation, slope, water network, field boundaries, etc.) risk classification by using dashboards field visits to validate classification and collect additional info maps of runoff risk


3 Dashboard 1: Infiltration restriction
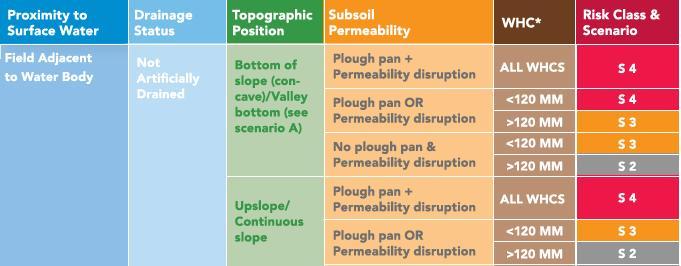

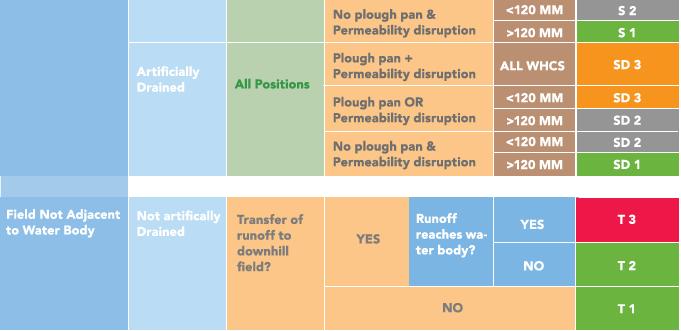
4 * WHC = Waterholding capacity Dashboard 2: Saturation excess
 slope Digital maps may")

5 Runoff Dashboards: main determining factors INFILTRATION RESTRICTION soil permeability (cappings) slope Digital maps may contain this info? yes yes SATURATION EXCESS plough pan water holding capacity no yes Catchment diagnosis may be performed (at least in part) using GIS


6 GIS: VECTOR and RASTER maps VECTOR maps geographical entities are represented by points, lines or polygons each point/vertex/node is numerically defined in terms of coordinates water network administrative boundaries RASTER maps earth surface is divided in to an oriented grid. Each cell of the grid (pixel) is the minimum geographic entity DTM

 Also used for aerial and satellite imagery")
7 GIS: VECTOR and RASTER maps Vector vs Raster representation of a same geographic entity Vector good for capturing and storing spatial details Raster good for data that vary continuously from location to location (e.g. elevation, temperature, soil ph, etc.) Also used for aerial and satellite imagery


8 GIS: VECTOR and RASTER maps RASTER MAPS several image formats tiff jpg png...
 Items included (some)")

9 Regional Tecnical Map Available maps (Tiglione Valley) Items included (some) field limits soil use (some) raod network watercourses contour lines (every 10 m)
 WMS layer from Geoportale")

10 Ortophoto Available maps (Tiglione Valley) WMS layer from Geoportale Nazionale [ only available on-line (cannot be downloaded) 2006
 WHC map (for dashboard 2")
11 Available maps (Tiglione Valley) Soil characteristics: PIEMONTE SOIL MAP (1:10000) - vector map Soil characteristics. TEXTURE topsoil can be used to obtain capping risk map (for dashboard 1 application) WHC map (for dashboard 2 application)
12 Dashboard 1: Infiltration restriction Soil capping Capping risk is one of the most important indicators or topsoil permeability capping risk maps are often not available capping risk may be estimated from soil texture R= (1.5 fine silt %)+(0.75 coarse silt %) clay %+ (10 organic matter %) R capping risk permeability of the topsoil* < 1.2 LOW HIGH MEDIUM MEDIUM > 1.6 HIGH LOW * for the application of dashboard 1 (infiltration restriction)

 clay %+ (10 organic matter")
13 Soil capping Dashboard 1: Infiltration restriction calculation of R index from texture data R= (1.5 fine silt %)+ (0.75 coarse silt %) clay %+ (10 organic matter %) capping not-capping
14 Dashboard 2: Saturation excess How to know water holding capacity (WHC) some soil maps can already include this info (e.g. PIEMONTE SOIL MAP) WHC can be estimated from soil texture Texture WHC (mm/cm) Sand 0.4 Loamy sand (coarse) 0.8 Loamy sand (fine) 1.0 Sandy loam 1.3 Loam Silt loam 1.7 Sil Clay loam Sandy clay loam 1.8 Silty clay loam Sandy clay Silty clay 1.7 Clay Example: a) texture: sandy loam b) depth: 100 cm Water holding capacity 1,3 mm/cm x 100 cm = 130mm
 In Tiglione valley: always > 120")
15 Dashboard 2: Saturation excess Water Holding Capacity (WHC) In Tiglione valley: always > 120 mm
")
 raster map of")

 elevation")
16 Available maps (Tiglione Valley) Digital terrain model (DTM) raster map of elevation data can be used to obtain slope map (for dashboard 1 application) elevation (m asl) slope (%)
17 about slope Slope in dashboards, slope is measured as percentage! 2% 2 m 100 m 5% 5 m 100 m

18 Dashboard 1: Infiltration restriction Slope From DTM Slope is classified in 3 classes

19 Dashboard 1: Infiltration restriction Runoff risk estimation Runoff risk maps is produced by overlapping raster maps of SLOPE and CAPPING RISK and applying dashboard 1 criteria on a pixel-by-pixel basis slope 0-2% 2-5% >5% capping risk HIGH permeability MEDIUM permeability HIGH permeability very low low medium low medium high medium high high
20 Dashboard 1: Infiltration restriction slope capping risk runoff risk


21 Diagnosi del rischio di ruscellamento: Valle Tiglione (Piemonte) capping risk slope runoff risk map
22 software used Geographical data visualization/elaboration QGIS reasons of this choice very limited previous experience on GIS need to learn from scratch no previous conditioning to use a specific software licence cost elimination: both are free open-source projects multi-platform (runs on Windows, MacOSX, Linux) very fast increase of users and available plugins public authorities largely relying on GIS will use QGIS as future standard productive platform largely fexible: new plugins could be developed for specific purposes and distributed as public domain technician and stakeholders in general can use a free tool that does not requires (very) expensive licences
Basin characteristics
 Basin characteristics From hydrological processes at the point scale to hydrological processes throughout the space continuum: point scale à river basin The watershed characteristics (shape, length, topography,
Introduction to GIS I
 Introduction to GIS Introduction How to answer geographical questions such as follows: What is the population of a particular city? What are the characteristics of the soils in a particular land parcel?
INTRODUCTION TO GIS. Dr. Ori Gudes
 INTRODUCTION TO GIS Dr. Ori Gudes Outline of the Presentation What is GIS? What s the rational for using GIS, and how GIS can be used to solve problems? Explore a GIS map and get information about map
Italian experience with the interpretation of FOCUS surface water scenarios from a regulatory point of view
 Italian experience with the interpretation of FOCUS surface water scenarios from a regulatory point of view G. Azimonti, G. Triacchini, D. Auteri, E. Redolfi, International Centre for Pesticides and Health
Popular Mechanics, 1954
 Introduction to GIS Popular Mechanics, 1954 1986 $2,599 1 MB of RAM 2017, $750, 128 GB memory, 2 GB of RAM Computing power has increased exponentially over the past 30 years, Allowing the existence of
Soil Erosion Calculation using Remote Sensing and GIS in Río Grande de Arecibo Watershed, Puerto Rico
 Soil Erosion Calculation using Remote Sensing and GIS in Río Grande de Arecibo Watershed, Puerto Rico Alejandra M. Rojas González Department of Civil Engineering University of Puerto Rico at Mayaguez.
Basics of GIS. by Basudeb Bhatta. Computer Aided Design Centre Department of Computer Science and Engineering Jadavpur University
 Basics of GIS by Basudeb Bhatta Computer Aided Design Centre Department of Computer Science and Engineering Jadavpur University e-governance Training Programme Conducted by National Institute of Electronics
USE OF RADIOMETRICS IN SOIL SURVEY
 USE OF RADIOMETRICS IN SOIL SURVEY Brian Tunstall 2003 Abstract The objectives and requirements with soil mapping are summarised. The capacities for different methods to address these objectives and requirements
QGIS FLO-2D Integration
 EPiC Series in Engineering Volume 3, 2018, Pages 1575 1583 Engineering HIC 2018. 13th International Conference on Hydroinformatics Karen O Brien, BSc. 1, Noemi Gonzalez-Ramirez, Ph. D. 1 and Fernando Nardi,
Welcome to NR502 GIS Applications in Natural Resources. You can take this course for 1 or 2 credits. There is also an option for 3 credits.
 Welcome to NR502 GIS Applications in Natural Resources. You can take this course for 1 or 2 credits. There is also an option for 3 credits. The 1st credit consists of a series of readings, demonstration,
Soil Map Boulder County Area, Colorado (Planet Blue Grass) Web Soil Survey National Cooperative Soil Survey
 Web Soil Survey National Cooperative Soil Survey") 475910 476000 476090 476180 476270 476360 105 16' 21'' W 476450 476540 476630 476720 476810 4453350 4453440 4453260 4453350 4453170 4453260 4453080 4453170 4453080 475820 475910 4452990 476000 476090 476180
475910 476000 476090 476180 476270 476360 105 16' 21'' W 476450 476540 476630 476720 476810 4453350 4453440 4453260 4453350 4453170 4453260 4453080 4453170 4453080 475820 475910 4452990 476000 476090 476180
Existing NWS Flash Flood Guidance
 Introduction The Flash Flood Potential Index (FFPI) incorporates physiographic characteristics of an individual drainage basin to determine its hydrologic response. In flash flood situations, the hydrologic
Watershed Modeling for QGIS-GRASS GIS. Purpose: To find the water and sediment discharge of a small watershed catchment (1-10 square kilometers).
.") Watershed Modeling for QGIS-GRASS GIS Purpose: To find the water and sediment discharge of a small watershed catchment (1-10 square kilometers). Help and Support: Please see http://www.qgis.org/en/community.html
Watershed Modeling for QGIS-GRASS GIS Purpose: To find the water and sediment discharge of a small watershed catchment (1-10 square kilometers). Help and Support: Please see http://www.qgis.org/en/community.html
Standards and Procedures for Site Specific Soil Mapping in Rhode Island. Pg 1
 Standards and Procedures for Site Specific Soil Mapping in Rhode Island Pg 1 The Task Take This and Create This The Task Take This and Create This and a Report Pg 2 How is this different than the RI Soil
4. GIS Implementation of the TxDOT Hydrology Extensions
 4. GIS Implementation of the TxDOT Hydrology Extensions A Geographic Information System (GIS) is a computer-assisted system for the capture, storage, retrieval, analysis and display of spatial data. It
Procedure for Determining Near-Surface Pollution Sensitivity
 Procedure for Determining Near-Surface Pollution Sensitivity Minnesota Department of Natural Resources Division of Ecological and Water Resources County Geologic Atlas Program March 2014 Version 2.1 I.
Remote Sensing and GIS Applications for Hilly Watersheds SUBASHISA DUTTA DEPARTMENT OF CIVIL ENGINEERING IIT GUWAHATI
 Remote Sensing and GIS Applications for Hilly Watersheds SUBASHISA DUTTA DEPARTMENT OF CIVIL ENGINEERING IIT GUWAHATI Deciding Alternative Land Use Options in a Watershed Using GIS Source: Anita Prakash
GIS Viewshed Analysis to Identify Zones of Potential Visual Impact on Protected Landscapes
 GIS Viewshed Analysis to Identify Zones of Potential Visual Impact on Protected Landscapes Background Natural England is consulted by local planning authorities on increasing numbers of development proposals,
GIS Workshop Data Collection Techniques
 GIS Workshop Data Collection Techniques NOFNEC Conference 2016 Presented by: Matawa First Nations Management Jennifer Duncan and Charlene Wagenaar, Geomatics Technicians, Four Rivers Department QA #: FRG
Appendix 2b. NRCS Soil Survey
 Appendix 2b NRCS Soil Survey 118 19' 25'' W Nonirrigated Capability Class Antelope Valley Area, California (Del Sur Solar Site) 118 17' 28'' W 378900 379200 379500 379800 380100 380400 380700 381000 381300
Integrating Remote Sensing and Observations into Decision Support Systems for Invasive Weeds
 Integrating Remote Sensing and Observations into Decision Support Systems for Invasive Weeds E. Raymond Hunt, Jr. USDA-ARS Hydrology and Remote Sensing Laboratory Beltsville, Maryland, USA Objectives Predict
Break Time. Cornell Short Course
 Break Time Poor Plant Health Root Depth & Soil Type Active Root Zone The depth of soil containing the majority of feeder roots } Soil type Basic infiltration rate (mm/hour) } Sand > 30 (1.2-4 in./hr.)
NR402 GIS Applications in Natural Resources
 NR402 GIS Applications in Natural Resources Lesson 1 Introduction to GIS Eva Strand, University of Idaho Map of the Pacific Northwest from http://www.or.blm.gov/gis/ Welcome to NR402 GIS Applications in
Geographic Information Systems. Introduction to Data and Data Sources
 Geographic Information Systems Introduction to Data and Data Sources Presented by John Showler, NJDA-SSCC NJ SCD GIS Training Session December 10, 209 The Objectives of this session are 3-fold: 1. Introduce
WMS 9.0 Tutorial GSSHA Modeling Basics Infiltration Learn how to add infiltration to your GSSHA model
 v. 9.0 WMS 9.0 Tutorial GSSHA Modeling Basics Infiltration Learn how to add infiltration to your GSSHA model Objectives This workshop builds on the model developed in the previous workshop and shows you
These modules are covered with a brief information and practical in ArcGIS Software and open source software also like QGIS, ILWIS.
 Online GIS Training and training modules covered are: 1. ArcGIS, Analysis, Fundamentals and Implementation 2. ArcGIS Web Data Sharing 3. ArcGIS for Desktop 4. ArcGIS for Server These modules are covered
Hydrology and Floodplain Analysis, Chapter 10
 Hydrology and Floodplain Analysis, Chapter 10 Hydrology and Floodplain Analysis, Chapter 10.1 Introduction to GIS GIS Geographical Information System Spatial Data Data linked with geographical location
A SIMPLE GIS METHOD FOR OBTAINING FLOODED AREAS
 A SIMPLE GIS METHOD FOR OBTAINING FLOODED AREAS ROMAN P., I. 1, OROS C., R. 2 ABSTRACT. A simple GIS method for obtaining flooded areas. This paper presents a method for obtaining flooded areas near to
Floodplain modeling. Ovidius University of Constanta (P4) Romania & Technological Educational Institute of Serres, Greece
 Romania & Technological Educational Institute of Serres, Greece") Floodplain modeling Ovidius University of Constanta (P4) Romania & Technological Educational Institute of Serres, Greece Scientific Staff: Dr Carmen Maftei, Professor, Civil Engineering Dept. Dr Konstantinos
Floodplain modeling Ovidius University of Constanta (P4) Romania & Technological Educational Institute of Serres, Greece Scientific Staff: Dr Carmen Maftei, Professor, Civil Engineering Dept. Dr Konstantinos
Custom Soil Resource Report for Forrest County, Mississippi
 United States Department of Agriculture Natural Resources Conservation Service A product of the National Cooperative Soil Survey, a joint effort of the United States Department of Agriculture and other
Integrating LiDAR data into the workflow of cartographic representation.
 Integrating LiDAR data into the workflow of cartographic representation. Cartographic Workflow I. 1 2 3 4 5 Surveying Vector (Nat. GDB) GPS, Laser Range Finder Yes/ No Scanning old maps LiDARflights Capture
Research Themes The development of GIS based methodology for the identification of potential wet grassland restoration sites
 Catchment and Coastal Environments Research Group Research Themes The development of GIS based methodology for the identification of potential wet grassland restoration sites Dr Andrew Williams email a.williams@plymouth.ac.uk
Yaneev Golombek, GISP. Merrick/McLaughlin. ESRI International User. July 9, Engineering Architecture Design-Build Surveying GeoSpatial Solutions
 Yaneev Golombek, GISP GIS July Presentation 9, 2013 for Merrick/McLaughlin Conference Water ESRI International User July 9, 2013 Engineering Architecture Design-Build Surveying GeoSpatial Solutions Purpose
A Help Guide for Using gssurgo to Find Potential Wetland Soil Landscapes
 A Help Guide for Using gssurgo to Find Potential Wetland Soil Landscapes Wetland Mapping Consortium Webinar September 17, 2014 Dr. John M. Galbraith Crop & Soil Environmental Sciences Virginia Tech Wetland
AGRICULTURAL LAND CLASSIFICATION ST HELENS UDP BIRCH TREE FARM (SITE 33)
") / ' '' / / AGRICULTURAL LAND CLASSIFICATION ST HELENS UDP BIRCH TREE FARM (SITE 33) R D Metcalfe Resource Planning Team ADAS Statutory Group WOLVERHAMPTON ADAS Ref: Job No: MAFFRef: 25/RPT/D689 135/95
/ ' '' / / AGRICULTURAL LAND CLASSIFICATION ST HELENS UDP BIRCH TREE FARM (SITE 33) R D Metcalfe Resource Planning Team ADAS Statutory Group WOLVERHAMPTON ADAS Ref: Job No: MAFFRef: 25/RPT/D689 135/95
INTERNATIONAL JOURNAL OF PURE AND APPLIED RESEARCH IN ENGINEERING AND TECHNOLOGY
 INTERNATIONAL JOURNAL OF PURE AND APPLIED RESEARCH IN ENGINEERING AND TECHNOLOGY A PATH FOR HORIZING YOUR INNOVATIVE WORK SPECIAL ISSUE FOR NATIONAL LEVEL CONFERENCE "SUSTAINABLE TECHNOLOGIES IN CIVIL
Lecture 6 - Raster Data Model & GIS File Organization
 Lecture 6 - Raster Data Model & GIS File Organization I. Overview of Raster Data Model Raster data models define objects in a fixed manner see Figure 1. Each grid cell has fixed size (resolution). The
ESTIMATING AND MAPPING TORRENTIALITY RISK IN SMALL FORESTED WATERSHEDS
 Bulletin of the Transilvania University of Braşov Series II: Forestry Wood Industry Agricultural Food Engineering Vol. 4 (53) No. 1-2011 ESTIMATING AND MAPPING TORRENTIALITY RISK IN SMALL FORESTED WATERSHEDS
GEOMATICS. Shaping our world. A company of
 GEOMATICS Shaping our world A company of OUR EXPERTISE Geomatics Geomatics plays a mayor role in hydropower, land and water resources, urban development, transport & mobility, renewable energy, and infrastructure
C) D) 3. Which graph best represents the relationship between soil particle size and the rate at which water infiltrates permeable soil?
 D) 3. Which graph best represents the relationship between soil particle size and the rate at which water infiltrates permeable soil?") 1. Which earth material covering the surface of a landfill would permit the least amount of rainwater to infiltrate the surface? A) silt B) clay C) sand D) pebbles 2. Which graph best represents the relationship
1. Which earth material covering the surface of a landfill would permit the least amount of rainwater to infiltrate the surface? A) silt B) clay C) sand D) pebbles 2. Which graph best represents the relationship
GeoWEPP Tutorial Appendix
 GeoWEPP Tutorial Appendix Chris S. Renschler University at Buffalo - The State University of New York Department of Geography, 116 Wilkeson Quad Buffalo, New York 14261, USA Prepared for use at the WEPP/GeoWEPP
Display data in a map-like format so that geographic patterns and interrelationships are visible
 Vilmaliz Rodríguez Guzmán M.S. Student, Department of Geology University of Puerto Rico at Mayagüez Remote Sensing and Geographic Information Systems (GIS) Reference: James B. Campbell. Introduction to
Determination of flood risks in the yeniçiftlik stream basin by using remote sensing and GIS techniques
 Determination of flood risks in the yeniçiftlik stream basin by using remote sensing and GIS techniques İrfan Akar University of Atatürk, Institute of Social Sciences, Erzurum, Turkey D. Maktav & C. Uysal
Comparison of Geomatics Approach and Mathematical Model in Assessment of Soil Erosion Prone Areas Kolli Hills, Namakkal District Tamilnadu, India
 Cloud Publications International Journal of Advanced Earth Science and Engineering 2013, Volume 2, Issue 1, pp. 43-56, Article ID Sci-20 Research Article Open Access Comparison of Geomatics Approach and
Introduction-Overview. Why use a GIS? What can a GIS do? Spatial (coordinate) data model Relational (tabular) data model
 data model Relational (tabular) data model") Introduction-Overview Why use a GIS? What can a GIS do? How does a GIS work? GIS definitions Spatial (coordinate) data model Relational (tabular) data model intro_gis.ppt 1 Why use a GIS? An extension
Introduction-Overview Why use a GIS? What can a GIS do? How does a GIS work? GIS definitions Spatial (coordinate) data model Relational (tabular) data model intro_gis.ppt 1 Why use a GIS? An extension
Techniques for Science Teachers: Using GIS in Science Classrooms.
 Techniques for Science Teachers: Using GIS in Science Classrooms. After ESRI, 2008 GIS A Geographic Information System A collection of computer hardware, software, and geographic data used together for
Introduction to Geographic Information Systems (GIS): Environmental Science Focus
: Environmental Science Focus") Introduction to Geographic Information Systems (GIS): Environmental Science Focus September 9, 2013 We will begin at 9:10 AM. Login info: Username:!cnrguest Password: gocal_bears Instructor: Domain: CAMPUS
Introduction to Geographic Information Systems (GIS): Environmental Science Focus September 9, 2013 We will begin at 9:10 AM. Login info: Username:!cnrguest Password: gocal_bears Instructor: Domain: CAMPUS
MAPPING POTENTIAL LAND DEGRADATION IN BHUTAN
 MAPPING POTENTIAL LAND DEGRADATION IN BHUTAN Moe Myint, Geoinformatics Consultant Rue du Midi-8, CH-1196, Gland, Switzerland moemyint@bluewin.ch Pema Thinley, GIS Analyst Renewable Natural Resources Research
Introduction to Soil Science and Wetlands Kids at Wilderness Camp
 Introduction to Soil Science and Wetlands Kids at Wilderness Camp Presented by: Mr. Brian Oram, PG, PASEO B.F. Environmental Consultants http://www.bfenvironmental.com and Keystone Clean Water Team http://www.pacleanwater.org
CHAPTER VII FULLY DISTRIBUTED RAINFALL-RUNOFF MODEL USING GIS
 80 CHAPTER VII FULLY DISTRIBUTED RAINFALL-RUNOFF MODEL USING GIS 7.1GENERAL This chapter is discussed in six parts. Introduction to Runoff estimation using fully Distributed model is discussed in first
Web Soil Survey National Cooperative Soil Survey
 122 14' 27'' W () 122 13' 37'' W 40 8' 40'' N 564700 564800 564900 565000 565100 565200 565300 565400 565500 565600 565700 565800 40 8' 40'' N 4443400 4443500 4443600 4443700 4443800 4443900 4444000 4443400
The effect of soil physical parameters on soil erosion. Introduction. The K-factor
 Geographical Bulletin 2004. Tom. LIII. No. 1 2. pp.77 84. The effect of soil physical parameters on soil erosion ÁDÁM KERTÉSZ TAMÁS HUSZÁR GERGELY JAKAB 1 Introduction The factor K of the Universal Soil
Modeling Surface Runoff Path and Soil Erosion in Catchment Area of Hanp River of District Kabeerdham, CG, INDIA, Using GIS
 International Journal of Scientific and Research Publications, Volume 6, Issue 5, May 2016 645 Modeling Surface Runoff Path and Soil Erosion in Catchment Area of Hanp River of District Kabeerdham, CG,
Soil Taxonomy Classification Osage County, Kansas. Web Soil Survey National Cooperative Soil Survey
 95 45' 5'' W Soil Taxonomy Classification Osage County, Kansas 95 44' 3'' W 260300 260400 260500 260600 260700 260800 260900 261000 261100 261200 261300 261400 261500 261600 261700 38 33' 4'' N 38 32'
Comparison of Methods for Deriving a Digital Elevation Model from Contours and Modelling of the Associated Uncertainty
 Comparison of Methods for Deriving a Digital Elevation Model from Contours and Modelling of the Associated Uncertainty Anicet Sindayihebura 1, Marc Van Meirvenne 1 and Stanislas Nsabimana 2 1 Department
Development and operation of GIS exercise materials for undergraduate students
 Development and operation of GIS exercise materials for undergraduate students Since around 2000, GIS researchers in Japan have collaborated to provide materials for GIS lecture classes for university
Using the Web Soil Survey Resilience and Resistance Score Sheet Soils Report
 Using the Resilience and Resistance Score Sheet Soils Report 1. Go to http://websoilsurvey.nrcs.usda.gov/app/ and click on the Start WSS button. 2. Create an Area of Interest (AOI) using any of the available
Geography 38/42:376 GIS II. Topic 1: Spatial Data Representation and an Introduction to Geodatabases. The Nature of Geographic Data
 Geography 38/42:376 GIS II Topic 1: Spatial Data Representation and an Introduction to Geodatabases Chapters 3 & 4: Chang (Chapter 4: DeMers) The Nature of Geographic Data Features or phenomena occur as
Web Soil Survey National Cooperative Soil Survey
 95 27' 24'' W Soil Taxonomy Classification Franklin County, Kansas 95 26' 23'' W 285800 285900 286000 286100 286200 286300 286400 286500 286600 286700 286800 286900 287000 287100 287200 38 29' 34'' N 38
Monday, October 15 th Grab a textbook! Objective: We will explain the formation of different soils and classify soils according to particle size.
 Soil Mr. Gilmore Monday, October 15 th Grab a textbook! Objective: We will explain the formation of different soils and classify soils according to particle size. Review: 1. The four limestone samples
Soil Taxonomy Classification Jackson County, Florida (Chipola River) Web Soil Survey National Cooperative Soil Survey
 Web Soil Survey National Cooperative Soil Survey") 85 10' 20'' W Soil Taxonomy Classification Jackson County, Florida () 85 9' 8'' W 30 37' 42'' N 30 37' 42'' N 30 37' 2'' N 30 37' 2'' N 85 10' 20'' W N Map Scale: 1:8,740 if printed on A landscape (11"
85 10' 20'' W Soil Taxonomy Classification Jackson County, Florida () 85 9' 8'' W 30 37' 42'' N 30 37' 42'' N 30 37' 2'' N 30 37' 2'' N 85 10' 20'' W N Map Scale: 1:8,740 if printed on A landscape (11"
An Introduction to Geographic Information System
 An Introduction to Geographic Information System PROF. Dr. Yuji MURAYAMA Khun Kyaw Aung Hein 1 July 21,2010 GIS: A Formal Definition A system for capturing, storing, checking, Integrating, manipulating,
Hydric Rating by Map Unit Harrison County, Mississippi
 89 6' 12'' W 89 5' 54'' W 30 28' 47'' N 30 28' 26'' N 3373210 3373290 3373370 3373450 3373530 3373610 3373690 3373770 3373850 298080 298160 298240 298320 298400 298480 298560 30 28' 47'' N Soil Map may
ENGRG Introduction to GIS
 ENGRG 59910 Introduction to GIS Michael Piasecki March 17, 2014 Lecture 08: Terrain Analysis Outline: Terrain Analysis Earth Surface Representation Contour TIN Mass Points Digital Elevation Models Slope
Web Soil Survey National Cooperative Soil Survey
 95 30' 19'' W Soil Taxonomy Classification Franklin County, Kansas 95 29' 28'' W 38 33' 8'' N 281700 281800 281900 282000 282100 282200 282300 282400 282500 282600 282700 282800 282900 38 33' 8'' N 4269300
River bank erosion risk potential with regards to soil erodibility
 River Basin Management VII 289 River bank erosion risk potential with regards to soil erodibility Z. A. Roslan 1, Y. Naimah 1 & Z. A. Roseli 2 1 Infrastructure University, Kuala Lumpur, Malaysia 2 Humid
Hydric Rating by Map Unit Harrison County, Mississippi. Web Soil Survey National Cooperative Soil Survey
 89 9' 7'' W 89 8' 38'' W 30 34' 13'' N 30 33' 57'' N 3383480 3383560 3383640 3383720 3383800 3383880 3383960 293640 293720 293800 293880 293960 294040 294120 294200 294280 294360 3383480 3383560 3383640
What is GIS? Introduction to data. Introduction to data modeling
 What is GIS? Introduction to data Introduction to data modeling 2 A GIS is similar, layering mapped information in a computer to help us view our world as a system A Geographic Information System is a
ENGRG Introduction to GIS
 ENGRG 59910 Introduction to GIS Michael Piasecki November 17, 2017 Lecture 11: Terrain Analysis Outline: Terrain Analysis Earth Surface Representation Contour TIN Mass Points Digital Elevation Models Slope
CPT: Geopractica Contracting (Pty) Ltd Total depth: m, Date:
 Ltd Total depth: m, Date:") The plot below presents the cross correlation coeficient between the raw qc and fs values (as measured on the field). X axes presents the lag distance (one lag is the distance between two sucessive CPT
The plot below presents the cross correlation coeficient between the raw qc and fs values (as measured on the field). X axes presents the lag distance (one lag is the distance between two sucessive CPT
Object Based Imagery Exploration with. Outline
 Object Based Imagery Exploration with Dan Craver Portland State University June 11, 2007 Outline Overview Getting Started Processing and Derivatives Object-oriented classification Literature review Demo
USING GIS CARTOGRAPHIC MODELING TO ANALYSIS SPATIAL DISTRIBUTION OF LANDSLIDE SENSITIVE AREAS IN YANGMINGSHAN NATIONAL PARK, TAIWAN
 CO-145 USING GIS CARTOGRAPHIC MODELING TO ANALYSIS SPATIAL DISTRIBUTION OF LANDSLIDE SENSITIVE AREAS IN YANGMINGSHAN NATIONAL PARK, TAIWAN DING Y.C. Chinese Culture University., TAIPEI, TAIWAN, PROVINCE
Soil Surveys. What are the most important properties to consider in a taxonomic system used for making a soil survey?
 Soil Surveys What are the most important properties to consider in a taxonomic system used for making a soil survey? What is a Soil Survey? Inventory of soil resources Delineation of spatial distribution
Assessment of spatial analysis techniques for estimating impervious cover
 University of Wollongong Research Online Faculty of Engineering - Papers (Archive) Faculty of Engineering and Information Sciences 2006 Assessment of spatial analysis techniques for estimating impervious
Applied Cartography and Introduction to GIS GEOG 2017 EL. Lecture-2 Chapters 3 and 4
 Applied Cartography and Introduction to GIS GEOG 2017 EL Lecture-2 Chapters 3 and 4 Vector Data Modeling To prepare spatial data for computer processing: Use x,y coordinates to represent spatial features
Web Soil Survey National Cooperative Soil Survey
 95 40' 40'' W 95 40' 0'' W 38 44' 27'' N 4290200 4290300 4290400 4290500 4290600 4290700 4290800 4290900 4291000 4291100 4291200 4291300 4291400 267300 267400 267500 267600 267700 267800 267900 268000
Groundwater Investigation SOUTHGATE GRAVEL PIT Part of Lot 15, Concession 15 (formerly Township of Proton), Township of Southgate.
, Township of Southgate.") Groundwater Investigation SOUTHGATE GRAVEL PIT Part of Lot 15, Concession 15 (formerly Township of Proton), Township of Southgate County of Grey October, 2014 Prepared for: Drysdale Aggregate Consulting
Groundwater Investigation SOUTHGATE GRAVEL PIT Part of Lot 15, Concession 15 (formerly Township of Proton), Township of Southgate County of Grey October, 2014 Prepared for: Drysdale Aggregate Consulting
Data Aggregation with InfraWorks and ArcGIS for Visualization, Analysis, and Planning
 Data Aggregation with InfraWorks and ArcGIS for Visualization, Analysis, and Planning Stephen Brockwell President, Brockwell IT Consulting, Inc. Join the conversation #AU2017 KEYWORD Class Summary Silos
Appendix I SOIL RATING CHART. (Storie soil Index Rating = factor A* factor B* factor C* factor X) FACTOR A- Rating on character of Physical Profile
 FACTOR A- Rating on character of Physical Profile") Appendix I SOIL RATING CHART (Storie soil Index Rating = factor A* factor B* factor C* factor X) FACTOR A- Rating on character of Physical Profile Sr. No Particulars Percentage I Soil on recent alluvial
Appendix I SOIL RATING CHART (Storie soil Index Rating = factor A* factor B* factor C* factor X) FACTOR A- Rating on character of Physical Profile Sr. No Particulars Percentage I Soil on recent alluvial
A Basic Introduction to Geographic Information Systems (GIS) ~~~~~~~~~~
 ~~~~~~~~~~") A Basic Introduction to Geographic Information Systems (GIS) ~~~~~~~~~~ Rev. Ronald J. Wasowski, C.S.C. Associate Professor of Environmental Science University of Portland Portland, Oregon 3 September
A Basic Introduction to Geographic Information Systems (GIS) ~~~~~~~~~~ Rev. Ronald J. Wasowski, C.S.C. Associate Professor of Environmental Science University of Portland Portland, Oregon 3 September
Gully erosion and associated risks in the Tutova basin Moldavian Plateau
 Landform Analysis, Vol. 17: 193 197 (2011) Gully erosion and associated risks in the Tutova basin Moldavian Plateau University Alexandru Ioan Cuza of Iasi, Department of Geography, Romania, e-mail: catiul@yahoo.com
Bachelor of Biosystems Technology Faculty of Technology South Eastern University of Sri Lanka
 Bachelor of Biosystems Technology Faculty of Technology South Eastern University of Sri Lanka BSE 11042 Principles of Irrigation Furrow Irrigation Running water in small channels (furrows) Water infiltration
DATA APPLIANCE FOR ARCGIS
 DATA APPLIANCE FOR ARCGIS Data Appliance for ArcGIS Provides Access to Multi-Scale Basemaps Down to Medium Scale Levels Worldwide And Large Scale for Most of the World The Data Appliance includes Several
6. Circle the correct answer: SINK A drains faster or SINK B drains faster Why?
 NAME date ROY G BIV Water Cycle and Water Movement in the Ground Test 5. 6. Circle the correct answer: SINK A drains faster or SINK B drains faster Why? 7. Circle the correct answer: SINK A retains more
AgBufferBuilder: A Filter Strip Design Tool for GIS
 University of Kentucky UKnowledge Plant and Soil Sciences Research Tools Plant and Soil Sciences 2012 AgBufferBuilder: A Filter Strip Design Tool for GIS Surendran Neelakantan University of Kentucky Tom
Digital Elevation Models (DEM) / DTM
 / DTM") Digital Elevation Models (DEM) / DTM Uses in remote sensing: queries and analysis, 3D visualisation, classification input Fogo Island, Cape Verde Republic ASTER DEM / image Banks Peninsula, Christchurch,
Digital Elevation Models (DEM) / DTM Uses in remote sensing: queries and analysis, 3D visualisation, classification input Fogo Island, Cape Verde Republic ASTER DEM / image Banks Peninsula, Christchurch,
International Journal of Advance Engineering and Research Development
 Scientific Journal of Impact Factor (SJIF): 4.72 International Journal of Advance Engineering and Research Development Volume 4, Issue 5, May -2017 Watershed Delineation of Purna River using Geographical
Hydric Rating by Map Unit Harrison County, Mississippi 30 27' 27'' 30 26' 57''
 Hydric Rating by Map Unit Harrison County, Mississippi 30 27' 27'' 30 26' 57'' 3370400 3370500 3370600 3370700 3370800 3370900 3371000 3371100 3371200 89 2' 40'' 89 2' 41'' 303700 303700 303800 303800
INTRODUCTION Water resources are vitally important for the future of humankind. Groundwater from karst aquifers is among the most important drinking w
 Vulnerability Mapping for the Protection of Carbonate (Karst) Aquifers (Ramallah-Al Bireh District) Eng. Amjad da Assi House of fw Water and de Environment May, 2007 INTRODUCTION Water resources are vitally
![)UDQFR54XHQWLQ(DQG'tD]'HOJDGR&](/thumbs/95/125846872.jpg ")UDQFR54XHQWLQ(DQG'tD]'HOJDGR&") &21&(37,21$1',03/(0(17$7,212)$1+
&21&(37,21$1',03/(0(17$7,212)$1+ Introduction to GIS - 2
 Introduction to GIS - 2 Outline Using GIS Representation of spatial objects in GIS Prof. D. Nagesh Kumar Department of Civil Engineering Indian Institute of Science Bangalore 560 012, India http://www.civil.iisc.ernet.in/~nagesh
GIS APPLICATIONS IN SOIL SURVEY UPDATES
 GIS APPLICATIONS IN SOIL SURVEY UPDATES ABSTRACT Recent computer hardware and GIS software developments provide new methods that can be used to update existing digital soil surveys. Multi-perspective visualization
INSTITUTE OF AERONAUTICAL ENGINEERING (Autonomous) Dundigal, Hyderabad
 Dundigal, Hyderabad") INSTITUTE OF AERONAUTICAL ENGINEERING (Autonomous) Dundigal, Hyderabad -00 0 CIVIL ENGINEERING TUTORIAL QUESTION BANK Course Name : Remote Sensing and GIS Course Code : A00 Class : IV B. Tech I Semester
INSTITUTE OF AERONAUTICAL ENGINEERING (Autonomous) Dundigal, Hyderabad -00 0 CIVIL ENGINEERING TUTORIAL QUESTION BANK Course Name : Remote Sensing and GIS Course Code : A00 Class : IV B. Tech I Semester
SWAMP GIS: A spatial decision support system for predicting and treating stormwater runoff. Michael G. Wing 1 * and Derek Godwin
 Journal of Spatial Hydrology Vol. 11, No. 2 Fall 2011 SWAMP GIS: A spatial decision support system for predicting and treating stormwater runoff Michael G. Wing 1 * and Derek Godwin Abstract SWAMP GIS
Anjana Dewanji, Anindita Chatterjee & Achyut Kumar Banerjee. Agricultural & Ecological Research Unit Indian Statistical Institute Kolkata, India
 Anjana Dewanji, Anindita Chatterjee & Achyut Kumar Banerjee Agricultural & Ecological Research Unit Indian Statistical Institute Kolkata, India World wide distribution Distribution in India Present scenario
USING HYPERSPECTRAL IMAGERY
 USING HYPERSPECTRAL IMAGERY AND LIDAR DATA TO DETECT PLANT INVASIONS 2016 ESRI CANADA SCHOLARSHIP APPLICATION CURTIS CHANCE M.SC. CANDIDATE FACULTY OF FORESTRY UNIVERSITY OF BRITISH COLUMBIA CURTIS.CHANCE@ALUMNI.UBC.CA
PROANA A USEFUL SOFTWARE FOR TERRAIN ANALYSIS AND GEOENVIRONMENTAL APPLICATIONS STUDY CASE ON THE GEODYNAMIC EVOLUTION OF ARGOLIS PENINSULA, GREECE.
 PROANA A USEFUL SOFTWARE FOR TERRAIN ANALYSIS AND GEOENVIRONMENTAL APPLICATIONS STUDY CASE ON THE GEODYNAMIC EVOLUTION OF ARGOLIS PENINSULA, GREECE. Spyridoula Vassilopoulou * Institute of Cartography
Mapping and Modeling for Regional Planning
 Mapping and Modeling for Regional Planning Carol W. Witham Sacramento Valley Chapter California Native Plant Society contributors: David Ackerly John Dittes Julie Evens Josephine Guardino Robert F. Holland
Creation of high resolution soil parameter data by use of artificial neural network technologies (advangeo )
") Creation of high resolution soil parameter data by use of artificial neural network technologies (advangeo ) A. Knobloch 1, F. Schmidt 1, M.K. Zeidler 1, A. Barth 1 1 Beak Consultants GmbH, Freiberg /
Creation of high resolution soil parameter data by use of artificial neural network technologies (advangeo ) A. Knobloch 1, F. Schmidt 1, M.K. Zeidler 1, A. Barth 1 1 Beak Consultants GmbH, Freiberg /
Solution:Example 1. Example 2. Solution: Example 2. clay. Textural Soil Classification System (USDA) CE353 Soil Mechanics Dr.
 CE353 Soil Mechanics Dr.") CE353 Soil Mechanics CE353 Lecture 5 Geotechnical Engineering Laboratory SOIL CLASSIFICATION Lecture 5 SOIL CLASSIFICATION Dr. Talat A Bader Dr. Talat Bader 2 Requirements of a soil Systems Why do we need
CE353 Soil Mechanics CE353 Lecture 5 Geotechnical Engineering Laboratory SOIL CLASSIFICATION Lecture 5 SOIL CLASSIFICATION Dr. Talat A Bader Dr. Talat Bader 2 Requirements of a soil Systems Why do we need