March 31, Dear Ms. Shreve:
|
|
|
- Maryann Patterson
- 5 years ago
- Views:
Transcription
1
2
3
4
5 March 31, 2005 Ms. Kathy Shreve Wyoming Department of Environmental Quality NPDES Permit Section 122 W. 25 th Street Herschler Building 4W Cheyenne, WY Subject: Response to Complete but Technically Inadequate Letter, March 8, 2005 Kennedy Oil Company NPDES Discharge Permit Application, Ruby Flying E CBM Operations, WY Powder River Watershed, Johnson County Dear Ms. Shreve: Kennedy Oil Company would like to respond to your letter that lists technical inadequacies, dated March 8, Your letter listed multiple concerns in the Ruby-Flying E CBM Operation permit application, WY Although the permittee provided information related to existing permits in the Flying E Creek drainage, the information provided did not consider applications still in the pre-public notice phase. At this time, the Division will require all permittees to either contain all untreated effluent during dry operating conditions, or to treat discharges to a level that will not impact Powder River water quality. Therefore, the Division has determined that, for the most part, channel infiltration losses are unavailable for consumption of CBM produced water within the Flying E Creek basin. The Division will not at this time entertain proposals that rely on in-channel infiltration to consume losses, or direct discharges of untreated effluent. This proposal contains one outfall that will be discharging untreated effluent directly to Bear Draw. Attached to this letter is a revised water balance, Tables A1 through A8, which accounts for the deletion of Icebox Reservoir and the addition of misters to the remaining ponds. The use of misters eliminates the reliance on channel infiltration loss. Water from the reservoirs will be atomized for enhanced evaporation, and the water will be sprayed over the reservoirs to protect the nearby vegetation, soils, and groundwater. Produced water will be atomized whenever permitted by the weather, including during winter. The atomizers will be placed in the centers of the reservoirs, and no water is expected to reach the ground outside the impounded areas. If water, snow, or ice falls to the land outside the reservoirs, Kennedy will modify the atomizers by changing their locations, water pressures, or nozzles, or by shutting-in the atomizers. The reservoirs will be able to hold 28 wells and 3.15 wells can be contained in Coal Gulch s Federal 5-1 Reservoir, WY , accounting for all thirty one wells associated with this permit. Kennedy has decreased the facility s maximum permitted flow from MGD to MGD; the expected flow per well has been decreased from 50 gpm per well to 27.3 gpm per well, after reevaluating the coal thickness. Infiltration data from Kennedy s nearby Cat Creek facility (WY ) suggest that the average infiltration rate is cfs/mile, based on seven months of monitoring. The data suggest that the infiltration rate is highest during summer and lowest in winter. Based on an infiltration rate of cfs/mile and there being miles of stream channel below Kennedy s outfall, up to 1.3 cfs could be discharge into the channels without the water reaching the Powder River. Kennedy therefore respectfully requests that water be allowed to discharge from the reservoirs in a limited quantity during warm weather. When Kennedy is discharging from the reservoirs, the confluence of Deep Draw and Flying E Creek will monitored; if water reaches this point, discharge from the reservoirs will be stopped. This location is more than 10 miles from the mouth of Flying E Creek. Kennedy will also monitor the channel infiltration rates during discharge to determine if the infiltration rate changes. Kennedy Oil is committed to complying with all effluent limits, self-monitoring and reporting requirements and other conditions of the permit. Kennedy Oil: 2005/03/22, New Option 2 resubmittal, HUC# , Ruby-Flying E CBM Operations, WY , page 1
6 Kennedy Oil March 31, 2005 Ruby Flying E CBM Operations Kennedy Oil appreciates your review and approval at the earliest possible convenience. Sincerely, Tami Henry Kennedy Oil Attachments: Table A1: Reservoir Storage Summary Kennedy Oil Ruby-Flying E CBM Facility Tables A2 through A8: Water Balances for Reservoirs Kennedy Oil: 2005/03/22, New Option 2 resubmittal, HUC# , Ruby-Flying E CBM Operations, WY , page 2
7 Table A1: Reservoir Storage Summary Kennedy Oil - Ruby-Flying E CBM Facility Reservoir Maximum Flow Wells Stored Watershed Outfall Name Legal Location Total Height (ft) Area (ac) Capacity (ac-ft) MGD gpm cfs (# Big George, 27.3 gpm) Area (ac) 10-yr, 24-hr Runoff (ac-ft) 25-yr, 24-hr Runoff (ac-ft) 001, 002 Federal 6-1 T50NR78W6SWSW Federal 7-1 T50NR78W7NESW Federal 8-1 T50NR78W8SWNW Deep Draw #3 T50NR78W8SESW Deep Draw #2 T50NR78W17NWNE State Ruby 16-1 T50NR78W16SWNW Federal 17-1 T50NR78WSESW Totals = Reservoir Infiltration - as determined from 10-month field study in K-Bar field = 29 acre-ft/acre/yr Evaporation (net) - from 45 in. evaporation/yr. and 13.5 in. precipitation/yr. = 1.6 gpm/acre Kennedy well flow rate gpm Kennedy Oil, 2005/ 03/ 31, Ruby-Flying E CBM Operations, New Option 2 resubmittal, HUC# , WY
8 Table A2: Water Balance for Reservoir Federal 6-1 Reservoir: Area at CBM Flow HWL (ac) = 0.52 Capacity at CBM Flow HWL (ac-ft) = 3.6 Wells: Number of Wells = 2.51 Initial Flowrate (gpm) = Time Period Decline Curve (% Production (gpm) Total Flow (gpm) of prev.) April-June ' July-Sept '05 87% Oct-Dec '05 85% Jan-March '06 82% Apr '06-Mar '07 83% Apr '07-Mar '08 50% Apr '08-Mar '09 50% Apr '09-Mar '10 50% Apr '10-Mar '11 50% Apr '11-Mar '12 50% Number of Misters = 1 Rate (gpm) = Water Balance: Maximum Storage (ac-ft) = 3.6 Month CBM Inflow (gallons) CBM Inflow (acre-ft) Pond Evaporation Rate (gpm/acre) Pond Evaporation (gallons) Infiltration 1 (gallons) In Use? Efficiency Evaporation Rate/ Mister (gpm) Pond Mister Evaporation (gallons) Total Losses (gallons) Total Losses (acre-ft) Apr-05 3,006, , ,548 Yes 30% 45 1,971,000 2,401, May-05 3,006, , ,548 Yes 50% 75 3,285,000 3,724, Jun-05 3,006, , ,548 Yes 70% 105 4,599,001 5,045, Jul-05 2,605, , ,548 Yes 80% 120 5,256,001 5,753, Aug-05 2,605, , ,548 Yes 80% 120 5,256,001 5,740, Sep-05 2,605, , ,548 Yes 60% 90 3,942,000 4,388, Oct-05 2,204, , ,548 Yes 50% 75 3,285,000 3,715, Nov-05 2,204, , ,548 Yes 20% 30 1,314,000 1,729, Dec-05 2,204, , ,548 Yes 20% 30 1,314,000 1,727, Jan-06 1,803, , ,548 Yes 20% 30 1,314,000 1,724, Feb-06 1,803, , ,548 Yes 20% 30 1,314,000 1,729, Mar-06 1,803, , ,548 Yes 20% 30 1,314,000 1,736, Apr-06 1,503, , ,548 Yes 30% 45 1,971,000 2,401, May-06 1,503, , ,548 Yes 50% 75 3,285,000 3,724, Jun-06 1,503, , ,548 Yes 70% 105 4,599,001 5,045, Jul-06 1,503, , ,548 Yes 80% 120 5,256,001 5,753, Aug-06 1,503, , ,548 Yes 80% 120 5,256,001 5,740, Sep-06 1,503, , ,548 Yes 60% 90 3,942,000 4,388, Oct-06 1,503, , ,548 Yes 50% 75 3,285,000 3,715, Nov-06 1,503, , ,548 Yes 20% 30 1,314,000 1,729, Dec-06 1,503, , ,548 Yes 20% 30 1,314,000 1,727, Jan-07 1,503, , ,548 Yes 20% 30 1,314,000 1,724, Feb-07 1,503, , ,548 Yes 20% 30 1,314,000 1,729, Mar-07 1,503, , ,548 Yes 20% 30 1,314,000 1,736, Mar-2008* 9,018, ,540 4,914,572 Yes 43% 65 2,825,100 8,077, Mar-2009* 4,509, ,540 4,914,572 Yes 43% 65 2,825,100 8,077, Mar-2010* 2,254, ,540 4,914,572 No 43% 0 0 5,252, Mar-2011* 1,127, ,540 4,914,572 No 43% 0 0 5,252, Mar-2012* ,540 4,914,572 No 43% 0 0 5,252, Reservoir Infiltration - as determined from 10-month field study in K-Bar field = 29 acre-ft/acre/yr * Values in table are for 12 month period Net Inflow (ac-ft) Storage (acre-ft) Kennedy Oil, 2005/ 03/ 31, Ruby-Flying E CBM Operations, New Option 2 resubmittal, HUC# , WY
9 Table A3: Water Balance for Reservoir Federal 7-1 Reservoir: Area at CBM Flow HWL (ac) = 0.24 Capacity at CBM Flow HWL (ac-ft) = 1.8 Wells: Number of Wells = 1.96 Initial Flowrate (gpm) = Time Period Decline Curve (% of prev.) Production (gpm) Total Flow (gpm) April-June ' July-Sept '05 87% Oct-Dec '05 85% Jan-March '06 82% Apr '06-Mar '07 83% Apr '07-Mar '08 50% Apr '08-Mar '09 50% Apr '09-Mar '10 50% Apr '10-Mar '11 50% Apr '11-Mar '12 50% Number of Misters = 1 Rate (gpm) = Water Balance: Maximum Storage (ac-ft) = 1.8 Month CBM Inflow (gallons) CBM Inflow (acre-ft) Pond Evaporation Rate(gpm/acre) Pond Evaporation (gallons) Infiltration 1 (gallons) In Use? Efficiency Evaporation Rate/ Mister (gpm) Pond Mister Evaporation (gallons) Total Losses (gallons) Total Losses (acre-ft) Net Inflow (ac-ft) Storage (acre-ft) Apr-05 2,337, , ,022 Yes 30% 45 1,971,000 2,169, May-05 2,337, , ,022 Yes 50% 75 3,285,000 3,487, Jun-05 2,337, , ,022 Yes 70% 105 4,599,001 4,804, Jul-05 2,026, , ,022 Yes 80% 120 5,256,001 5,485, Aug-05 2,026, , ,022 Yes 80% 120 5,256,001 5,479, Sep-05 2,026, , ,022 Yes 60% 90 3,942,000 4,147, Oct-05 1,714, , ,022 Yes 50% 75 3,285,000 3,483, Nov-05 1,714, , ,022 Yes 20% 30 1,314,000 1,505, Dec-05 1,714, , ,022 Yes 20% 30 1,314,000 1,505, Jan-06 1,402, ,022 Yes 20% 30 1,314,000 1,503, Feb-06 1,402, , ,022 Yes 20% 30 1,314,000 1,505, Mar-06 1,402, , ,022 Yes 20% 30 1,314,000 1,508, Apr-06 1,168, , ,022 Yes 30% 45 1,971,000 2,169, May-06 1,168, , ,022 Yes 50% 75 3,285,000 3,487, Jun-06 1,168, , ,022 Yes 70% 105 4,599,001 4,804, Jul-06 1,168, , ,022 Yes 80% 120 5,256,001 5,485, Aug-06 1,168, , ,022 Yes 80% 120 5,256,001 5,479, Sep-06 1,168, , ,022 Yes 60% 90 3,942,000 4,147, Oct-06 1,168, , ,022 Yes 50% 75 3,285,000 3,483, Nov-06 1,168, , ,022 Yes 20% 30 1,314,000 1,505, Dec-06 1,168, , ,022 Yes 20% 30 1,314,000 1,505, Jan-07 1,168, ,022 Yes 20% 30 1,314,000 1,503, Feb-07 1,168, , ,022 Yes 20% 30 1,314,000 1,505, Mar-07 1,168, , ,022 Yes 20% 30 1,314,000 1,508, Mar-2008* 7,013, ,788 2,268,264 Yes 43% 65 2,825,100 5,249, Mar-2009* 3,506, ,788 2,268,264 Yes 43% 65 2,825,100 5,249, Mar-2010* 1,753, ,788 2,268,264 No 43% 0 0 2,424, Mar-2011* 876, ,788 2,268,264 No 43% 0 0 2,424, Mar-2012* ,788 2,268,264 No 43% 0 0 2,424, Reservoir Infiltration - as determined from 10-month field study in K-Bar field = 29 acre-ft/acre/yr * Values in table are for 12 month period Kennedy Oil, 2005/ 03/ 31, Ruby-Flying E CBM Operations, New Option 2 resubmittal, HUC# , WY
10 Table A4: Water Balance for Reservoir Federal 8-1 Reservoir: Area at CBM Flow HWL (ac) = 0.82 Capacity at CBM Flow HWL (ac-ft) = 5.2 Wells: Number of Wells = 2.95 Initial Flowrate (gpm) = Time Period Decline Curve (% of prev.) Production (gpm) Total Flow (gpm) April-June ' July-Sept '05 87% Oct-Dec '05 85% Jan-March '06 82% Apr '06-Mar '07 83% Apr '07-Mar '08 50% Apr '08-Mar '09 50% Apr '09-Mar '10 50% Apr '10-Mar '11 50% Apr '11-Mar '12 50% Number of Misters = 1 Rate (gpm) = Water Balance: Maximum Storage (ac-ft) = 5.2 Month CBM Inflow (gallons) CBM Inflow (acre-ft) Pond Evaporation Rate (gpm/acre) Pond Evaporation (gallons) Infiltration 1 (gallons) In Use? Efficiency Evaporation Rate/ Mister (gpm) Pond Mister Evaporation (gallons) Total Losses (gallons) Total Losses (acre-ft) Apr-05 3,532, , ,825 Yes 30% 45 1,971,000 2,650, May-05 3,532, , ,825 Yes 50% 75 3,285,000 3,977, Jun-05 3,532, , ,825 Yes 70% 105 4,599,001 5,302, Jul-05 3,061, , ,825 Yes 80% 120 5,256,001 6,039, Aug-05 3,061, , ,825 Yes 80% 120 5,256,001 6,019, Sep-05 3,061, , ,825 Yes 60% 90 3,942,000 4,645, Oct-05 2,590, , ,825 Yes 50% 75 3,285,000 3,964, Nov-05 2,590, , ,825 Yes 20% 30 1,314,000 1,968, Dec-05 2,590, , ,825 Yes 20% 30 1,314,000 1,966, Jan-06 2,119, , ,825 Yes 20% 30 1,314,000 1,961, Feb-06 2,119, , ,825 Yes 20% 30 1,314,000 1,968, Mar-06 2,119, , ,825 Yes 20% 30 1,314,000 1,979, Apr-06 1,766, , ,825 Yes 30% 45 1,971,000 2,650, May-06 1,766, , ,825 Yes 50% 75 3,285,000 3,977, Jun-06 1,766, , ,825 Yes 70% 105 4,599,001 5,302, Jul-06 1,766, , ,825 Yes 80% 120 5,256,001 6,039, Aug-06 1,766, , ,825 Yes 80% 120 5,256,001 6,019, Sep-06 1,766, , ,825 Yes 60% 90 3,942,000 4,645, Oct-06 1,766, , ,825 Yes 50% 75 3,285,000 3,964, Nov-06 1,766, , ,825 Yes 20% 30 1,314,000 1,968, Dec-06 1,766, , ,825 Yes 20% 30 1,314,000 1,966, Jan-07 1,766, , ,825 Yes 20% 30 1,314,000 1,961, Feb-07 1,766, , ,825 Yes 20% 30 1,314,000 1,968, Mar-07 1,766, , ,825 Yes 20% 30 1,314,000 1,979, Mar-2008* 10,598, ,275 7,749,902 Yes 43% 65 2,825,100 11,107, Mar-2009* 5,299, ,275 7,749,902 No 43% 0 0 8,282, Mar-2010* 2,649, ,275 7,749,902 No 43% 0 0 8,282, Mar-2011* 1,324, ,275 7,749,902 No 43% 0 0 8,282, Mar-2012* ,275 7,749,902 No 43% 0 0 8,282, termined from 10-month field study in K-Bar field = 29 acre-ft/acre/yr in table are for 12 month period Net Inflow (ac-ft) Storage (acre-ft) Kennedy Oil, 2005/ 03/ 31, Ruby-Flying E CBM Operations, New Option 2 resubmittal, HUC# , WY
11 Table A5: Water Balance for Reservoir Deep Draw 3 Reservoir: Area at CBM Flow HWL (ac) = 3.00 Capacity at CBM Flow HWL (ac-ft) = 19.4 Wells: Number of Wells = 6.17 Initial Flowrate (gpm) = Time Period Decline Curve Production (gpm) (% of prev.) Total Flow (gpm) April-June ' July-Sept '05 87% Oct-Dec '05 85% Jan-March '06 82% Apr '06-Mar '07 83% Apr '07-Mar '08 50% Apr '08-Mar '09 50% Apr '09-Mar '10 50% Apr '10-Mar '11 50% Apr '11-Mar '12 50% Number of Misters = 1 Rate (gpm) = Water Balance: Maximum Storage (ac-ft) = 19.4 Month CBM Inflow (gallons) CBM Inflow (acre-ft) Pond Pond Evaporation Evaporation Rate (gallons) (gpm/acre) Infiltration 1 (gallons) In Use? Efficiency Evaporation Rate/ Mister (gpm) Pond Mister Evaporation (gallons) Total Losses (gallons) Total Losses (acre-ft) Apr-05 7,372, ,202 2,362,775 Yes 30% 45 1,971,000 4,455, May-05 7,372, ,820 2,362,775 Yes 50% 75 3,285,000 5,818, Jun-05 7,372, ,554 2,362,775 Yes 70% 105 4,599,001 7,173, Jul-05 6,389, ,576 2,362,775 Yes 80% 120 5,256,001 8,123, Aug-05 6,389, ,306 2,362,775 Yes 80% 120 5,256,001 8,051, Sep-05 6,389, ,554 2,362,775 Yes 60% 90 3,942,000 6,516, Oct-05 5,406, ,202 2,362,775 Yes 50% 75 3,285,000 5,769, Nov-05 5,406, ,850 2,362,775 Yes 20% 30 1,314,000 3,709, Dec-05 5,406, ,966 2,362,775 Yes 20% 30 1,314,000 3,701, Jan-06 4,423, ,884 2,362,775 Yes 20% 30 1,314,000 3,684, Feb-06 4,423, ,850 2,362,775 Yes 20% 30 1,314,000 3,709, Mar-06 4,423, ,584 2,362,775 Yes 20% 30 1,314,000 3,750, Apr-06 3,686, ,202 2,362,775 Yes 30% 45 1,971,000 4,455, May-06 3,686, ,820 2,362,775 Yes 50% 75 3,285,000 5,818, Jun-06 3,686, ,554 2,362,775 Yes 70% 105 4,599,001 7,173, Jul-06 3,686, ,576 2,362,775 Yes 80% 120 5,256,001 8,123, Aug-06 3,686, ,306 2,362,775 Yes 80% 120 5,256,001 8,051, Sep-06 3,686, ,554 2,362,775 Yes 60% 90 3,942,000 6,516, Oct-06 3,686, ,202 2,362,775 Yes 50% 75 3,285,000 5,769, Nov-06 3,686, ,850 2,362,775 Yes 20% 30 1,314,000 3,709, Dec-06 3,686, ,966 2,362,775 Yes 20% 30 1,314,000 3,701, Jan-07 3,686, ,884 2,362,775 Yes 20% 30 1,314,000 3,684, Feb-07 3,686, ,850 2,362,775 Yes 20% 30 1,314,000 3,709, Mar-07 3,686, ,584 2,362,775 Yes 20% 30 1,314,000 3,750, Mar-2008* 22,117, ,947,348 28,353,300 Yes 43% 65 2,825,100 33,125, Mar-2009* 11,058, ,947,348 28,353,300 7 months 43% ,300, Mar-2010* 5,529, ,947,348 28,353,300 7 months 43% ,300, Mar-2011* 2,764, ,947,348 28,353,300 7 months 43% ,300, Mar-2012* ,947,348 28,353,300 7 months 43% ,300, Reservoir Infiltration - as determined from 10-month field study in K-Bar field = 29 acre-ft/acre/yr * Values in table are for 12 month period Net Inflow (ac-ft) Storage (acre-ft) Kennedy Oil, 2005/ 03/ 31, Ruby-Flying E CBM Operations, New Option 2 resubmittal, HUC# , WY
12 Table A6: Water Balance for Reservoir Deep Draw #2 Reservoir: Area at CBM Flow HWL (ac) = 2.78 Capacity at CBM Flow HWL (ac-ft) = 11.2 Wells: Number of Wells = 5.41 Initial Flowrate (gpm) = Time Period Decline Curve (% Production (gpm) of prev.) Total Flow (gpm) April-June ' July-Sept. '05 87% Oct-Dec '05 85% Jan-March '06 82% Apr '06-Mar '07 83% Apr '07-Mar '08 50% Apr '08-Mar '09 50% Apr '09-Mar '10 50% Apr '10-Mar '11 50% Apr '11-Mar '12 50% Number of Misters = 1 Rate (gpm) = Water Balance: Maximum Storage (ac-ft) = 11.2 Month CBM Inflow (gallons) CBM Inflow (acre-ft) Pond Evaporation Rate(gpm/acre) Pond Evaporation (gallons) Infiltration 1 (gallons) In Use? Efficiency Evaporation Rate/ Mister (gpm) Pond Mister Evaporation (gallons) Total Losses (gallons) Total Losses (acre-ft) Apr-05 6,468, ,241 2,189,505 Yes 30% 45 1,971,000 4,273, May-05 6,468, ,293 2,189,505 Yes 50% 75 3,285,000 5,632, Jun-05 6,468, ,040 2,189,505 Yes 70% 105 4,599,001 6,984, Jul-05 5,606, ,574 2,189,505 Yes 80% 120 5,256,001 7,913, Aug-05 5,606, ,604 2,189,505 Yes 80% 120 5,256,001 7,846, Sep-05 5,606, ,040 2,189,505 Yes 60% 90 3,942,000 6,327, Oct-05 4,743, ,241 2,189,505 Yes 50% 75 3,285,000 5,587, Nov-05 4,743, ,441 2,189,505 Yes 20% 30 1,314,000 3,533, Dec-05 4,743, ,135 2,189,505 Yes 20% 30 1,314,000 3,526, Jan-06 3,881, ,306 2,189,505 Yes 20% 30 1,314,000 3,510, Feb-06 3,881, ,441 2,189,505 Yes 20% 30 1,314,000 3,533, Mar-06 3,881, ,188 2,189,505 Yes 20% 30 1,314,000 3,571, Apr-06 3,234, ,241 2,189,505 Yes 30% 45 1,971,000 4,273, May-06 3,234, ,293 2,189,505 Yes 50% 75 3,285,000 5,632, Jun-06 3,234, ,040 2,189,505 Yes 70% 105 4,599,001 6,984, Jul-06 3,234, ,574 2,189,505 Yes 80% 120 5,256,001 7,913, Aug-06 3,234, ,604 2,189,505 Yes 80% 120 5,256,001 7,846, Sep-06 3,234, ,040 2,189,505 Yes 60% 90 3,942,000 6,327, Oct-06 3,234, ,241 2,189,505 Yes 50% 75 3,285,000 5,587, Nov-06 3,234, ,441 2,189,505 Yes 20% 30 1,314,000 3,533, Dec-06 3,234, ,135 2,189,505 Yes 20% 30 1,314,000 3,526, Jan-07 3,234, ,306 2,189,505 Yes 20% 30 1,314,000 3,510, Feb-07 3,234, ,441 2,189,505 Yes 20% 30 1,314,000 3,533, Mar-07 3,234, ,188 2,189,505 Yes 20% 30 1,314,000 3,571, Mar-2008* 19,406, ,804,543 26,274,058 No 43% ,078, Mar-2009* 9,703, ,804,543 26,274,058 No 43% ,078, Mar-2010* 4,851, ,804,543 26,274,058 No 43% ,078, Mar-2011* 2,425, ,804,543 26,274,058 No 43% ,078, Mar-2012* ,804,543 26,274,058 No 43% ,078, Reservoir Infiltration - as determined from 10-month field study in K-Bar field = 29 acre-ft/acre/yr * Values in table are for 12 month period Net Inflow (ac-ft) Storage (acre-ft) Kennedy Oil, 2005/ 03/ 31, Ruby-Flying E CBM Operations, New Option 2 resubmittal, HUC# , WY
13 Table A7: Water Balance for Reservoir State Ruby 16-1 Reservoir: Area at CBM Flow HWL (ac) = 3.18 Capacity at CBM Flow HWL (ac-ft) = 17.3 Wells: Number of Wells = 6.26 Initial Flowrate (gpm) = Time Period Decline Curve Production (gpm) (% of prev.) Total Flow (gpm) April-June ' July-Sept '05 87% Oct-Dec '05 85% Jan-March '06 82% Apr '06-Mar '07 83% Apr '07-Mar '08 50% Apr '08-Mar '09 50% Apr '09-Mar '10 50% Apr '10-Mar '11 50% Apr '11-Mar '12 50% Number of Misters = 1 Rate (gpm) = Water Balance: Maximum Storage (ac-ft) = 17.3 Month CBM Inflow (gallons) CBM Inflow (acre-ft) Pond Evaporation Rate (gpm/acre) Pond Evaporation (gallons) Infiltration 1 (gallons) In Use? Efficiency Evaporation Rate/ Mister (gpm) Pond Mister Evaporation (gallons) Total Losses (gallons) Total Losses (acre-ft) Apr-05 7,490, ,534 2,504,542 Yes 30% 45 1,971,000 4,605, May-05 7,490, ,069 2,504,542 Yes 50% 75 3,285,000 5,970, Jun-05 7,490, ,247 2,504,542 Yes 70% 105 4,599,001 7,327, Jul-05 6,492, ,851 2,504,542 Yes 80% 120 5,256,001 8,295, Aug-05 6,492, ,244 2,504,542 Yes 80% 120 5,256,001 8,218, Sep-05 6,492, ,247 2,504,542 Yes 60% 90 3,942,000 6,670, Oct-05 5,493, ,534 2,504,542 Yes 50% 75 3,285,000 5,919, Nov-05 5,493, ,821 2,504,542 Yes 20% 30 1,314,000 3,853, Dec-05 5,493, ,464 2,504,542 Yes 20% 30 1,314,000 3,845, Jan-06 4,494, ,357 2,504,542 Yes 20% 30 1,314,000 3,826, Feb-06 4,494, ,821 2,504,542 Yes 20% 30 1,314,000 3,853, Mar-06 4,494, ,999 2,504,542 Yes 20% 30 1,314,000 3,896, Apr-06 3,745, ,534 2,504,542 Yes 30% 45 1,971,000 4,605, May-06 3,745, ,069 2,504,542 Yes 50% 75 3,285,000 5,970, Jun-06 3,745, ,247 2,504,542 Yes 70% 105 4,599,001 7,327, Jul-06 3,745, ,851 2,504,542 Yes 80% 120 5,256,001 8,295, Aug-06 3,745, ,244 2,504,542 Yes 80% 120 5,256,001 8,218, Sep-06 3,745, ,247 2,504,542 Yes 60% 90 3,942,000 6,670, Oct-06 3,745, ,534 2,504,542 Yes 50% 75 3,285,000 5,919, Nov-06 3,745, ,821 2,504,542 Yes 20% 30 1,314,000 3,853, Dec-06 3,745, ,464 2,504,542 Yes 20% 30 1,314,000 3,845, Jan-07 3,745, ,357 2,504,542 Yes 20% 30 1,314,000 3,826, Feb-07 3,745, ,821 2,504,542 Yes 20% 30 1,314,000 3,853, Mar-07 3,745, ,999 2,504,542 Yes 20% 30 1,314,000 3,896, Mar-2008* 22,472, ,064,189 30,054,498 7 months 43% ,118, Mar-2009* 11,236, ,064,189 30,054,498 7 months 43% ,118, Mar-2010* 5,618, ,064,189 30,054,498 7 months 43% ,118, Mar-2011* 2,809, ,064,189 30,054,498 7 months 43% ,118, Mar-2012* ,064,189 30,054,498 7 months 43% ,118, Reservoir Infiltration - as determined from 10-month field study in K-Bar field = 29 acre-ft/acre/yr * Values in table are for 12 month period Net Inflow (ac-ft) Storage (acre-ft) Kennedy Oil, 2005/ 03/ 31, Ruby-Flying E CBM Operations, New Option 2 resubmittal, HUC# , WY
14 Table A8: Water Balance for Reservoir Federal 17-1 Reservoir: Area at CBM Flow HWL (ac) = 0.87 Capacity at CBM Flow HWL (ac-ft) = 6.0 Wells: Number of Wells = 3.07 Initial Flowrate (gpm) = Time Period Decline Curve (% of prev.) Production (gpm) Total Flow (gpm) April-June ' July-Sept '05 87% Oct-Dec '05 85% Jan-March '06 82% Apr '06-Mar '07 83% Apr '07-Mar '08 50% Apr '08-Mar '09 50% Apr '09-Mar '10 50% Apr '10-Mar '11 50% Apr '11-Mar '12 50% Number of Misters = 1 Rate (gpm) = Water Balance: Maximum Storage (ac-ft) = 6.0 Month CBM Inflow (gallons) CBM Inflow (acre-ft) Pond Evaporation Rate (gpm/acre) Pond Evaporation (gallons) Infiltration 1 (gallons) In Use? Efficiency Evaporation Rate/ Mister (gpm) Pond Mister Evaporation (gallons) Total Losses (gallons) Total Losses (acre-ft) Apr-05 3,670, , ,205 Yes 30% 45 1,971,000 2,691, May-05 3,670, , ,205 Yes 50% 75 3,285,000 4,019, Jun-05 3,670, , ,205 Yes 70% 105 4,599,001 5,345, Jul-05 3,181, , ,205 Yes 80% 120 5,256,001 6,087, Aug-05 3,181, , ,205 Yes 80% 120 5,256,001 6,066, Sep-05 3,181, , ,205 Yes 60% 90 3,942,000 4,688, Oct-05 2,692, , ,205 Yes 50% 75 3,285,000 4,005, Nov-05 2,692, , ,205 Yes 20% 30 1,314,000 2,008, Dec-05 2,692, , ,205 Yes 20% 30 1,314,000 2,006, Jan-06 2,202, , ,205 Yes 20% 30 1,314,000 2,001, Feb-06 2,202, , ,205 Yes 20% 30 1,314,000 2,008, Mar-06 2,202, , ,205 Yes 20% 30 1,314,000 2,020, Apr-06 1,835, , ,205 Yes 30% 45 1,971,000 2,691, May-06 1,835, , ,205 Yes 50% 75 3,285,000 4,019, Jun-06 1,835, , ,205 Yes 70% 105 4,599,001 5,345, Jul-06 1,835, , ,205 Yes 80% 120 5,256,001 6,087, Aug-06 1,835, , ,205 Yes 80% 120 5,256,001 6,066, Sep-06 1,835, , ,205 Yes 60% 90 3,942,000 4,688, Oct-06 1,835, , ,205 Yes 50% 75 3,285,000 4,005, Nov-06 1,835, , ,205 Yes 20% 30 1,314,000 2,008, Dec-06 1,835, , ,205 Yes 20% 30 1,314,000 2,006, Jan-07 1,835, , ,205 Yes 20% 30 1,314,000 2,001, Feb-07 1,835, , ,205 Yes 20% 30 1,314,000 2,008, Mar-07 1,835, , ,205 Yes 20% 30 1,314,000 2,020, Mar-2008* 11,012, ,731 8,222,457 Yes 43% 65 2,825,100 11,612, Mar-2009* 5,506, ,731 8,222,457 7 months 43% 0 0 8,787, Mar-2010* 2,753, ,731 8,222,457 7 months 43% 0 0 8,787, Mar-2011* 1,376, ,731 8,222,457 7 months 43% 0 0 8,787, Mar-2012* ,731 8,222,457 7 months 43% 0 0 8,787, Reservoir Infiltration - as determined from 10-month field study in K-Bar field = 29 acre-ft/acre/yr * Values in table are for 12 month period Net Inflow (ac-ft) Storage (acre-ft) Kennedy Oil, 2005/ 03/ 31, Ruby-Flying E CBM Operations, New Option 2 resubmittal, HUC# , WY
15
16
17
18
19
20
21
22
23
24
25
26
27

28
29
30

31

32
33
34
35
36
37
38
39
40
41
42
43
44
45
46
47
48
49
50
51
52
53
54
55
56
57
58
59
60

61
62
63
64
65
66
67
68
69
70
71
72
73
74
75
76 Jackie Dice - WDEQ Response 4_18_05 WY doc Page 1 April 22, 2005 Ms. Kathy Shreve Wyoming Department of Environmental Quality NPDES Permit Section 122 W. 25 th Street Herschler Building 4W Cheyenne, WY Subject: Response to Complete but Technically Inadequate Letter, April 18, 2005 Kennedy Oil Company NPDES Discharge Permit Application, Ruby Flying E CBM Operations, WY Powder River Watershed, Johnson County Dear Ms. Shreve: Kennedy Oil (Kennedy) would like to respond to your letter that lists technical inadequacies, dated April 18, The letter s concern was regarding the use of the Icebox Reservoir, which is below discharge points proposed by Lance Oil and Gas: This facility is proposing to utilize containment on a stretch of Bear Draw already proposed for utilization by Lance Oil and Gas. The Lance proposal (WYO052639) has been advertised in public notice with requirements that will allow direct discharge of up to 1.29 MGD of treated effluent in the NENE, Section 18, Township 50 North, Range 78 West, above the "Icebox" reservoir proposed for partial containment of discharges at this facility. As such, it appears that this channel segment, including the Icebox reservoir, is already being utilized for channel and reservoir infiltrative losses. Kennedy could construct a bypass around the "Icebox" reservoir capable of diverting 1.29 MGD (Lance's flow) around the reservoir, thus avoiding comingling, or Kennedy could relocate these outfalls (010,011, and 012) and the associated reservoir to a different portion of Bear Draw above Lance's outfall. Kennedy intends to build a bypass around the Icebox reservoir; it has been designed to divert Lance s flow, 1.29 MGD (2.0 cfs), and runoff from minor storm events past the reservoir. The bypass facility will consist of a triangular ditch around the reservoir. The ditch will flow into a 12 pipe for the water to pass through the embankment. With the addition of the bypass, Kennedy feels the recently submitted water balance is still valid. That application requested a permit flow limit of MGD. Infiltration data from Kennedy s nearby Cat Creek facility (WY ) suggest that the average infiltration rate is cfs/mile, based on seven months of monitoring. The data suggest that the infiltration rate is highest during summer and lowest in winter. Based on an infiltration rate of cfs/mile in the lower reaches of Cat Creek, between Coyer Draw and the mouth of Cat Creek, and there being miles of stream channel below Kennedy s outfall, up to 1.3 cfs could be discharged into the channels without the water reaching the Powder River. Kennedy therefore respectfully requests that water be allowed to discharge from the reservoirs in a limited quantity during warm weather. When Kennedy is discharging from the reservoirs, the confluence of Deep Draw and Flying E Creek will monitored, as well as a flow monitoring point (FMP) immediately above Lance s treatment facility. If CBM flow from Kennedy s operations is observed at either FMP, discharge from the reservoirs will be stopped immediately. The FMPs are listed in the attached Table 1, and they are shown on the revised Map 1. The mouth of Deep Draw is more than 10 miles from the mouth of Flying E Creek. There are a total of 5.56 miles of stream channel between the proposed outfalls and the FMPs; using the observed infiltration rate of cfs/mile, cfs can be discharged from the reservoirs without the CBM water commingling with Lance s treated water, or the water in Flying E Creek. This extra capacity for water disposal was not included in the MGD permit limit to be conservative. Kennedy will also monitor the channel infiltration rates during discharge to determine if the infiltration rate changes. Kennedy Oil: 2005/04/22, New Option 2 resubmittal, HUC# , Ruby-Flying E CBM Operations, WY , page 1
77 Jackie Dice - WDEQ Response 4_18_05 WY doc Page 2 Kennedy Oil April 22, 2005 Ruby Flying E CBM Operations Kennedy Oil is committed to complying with all effluent limits, self-monitoring and reporting requirements and other conditions of the permit. Kennedy Oil appreciates your review and approval at the earliest possible convenience. Sincerely, Tami Henry Kennedy Oil Attachments: Table 1: Outfall Information Map 1: Ruby-Flying E CBM Operations Kennedy Oil: 2005/04/22, New Option 2 resubmittal, HUC# , Ruby-Flying E CBM Operations, WY , page 2
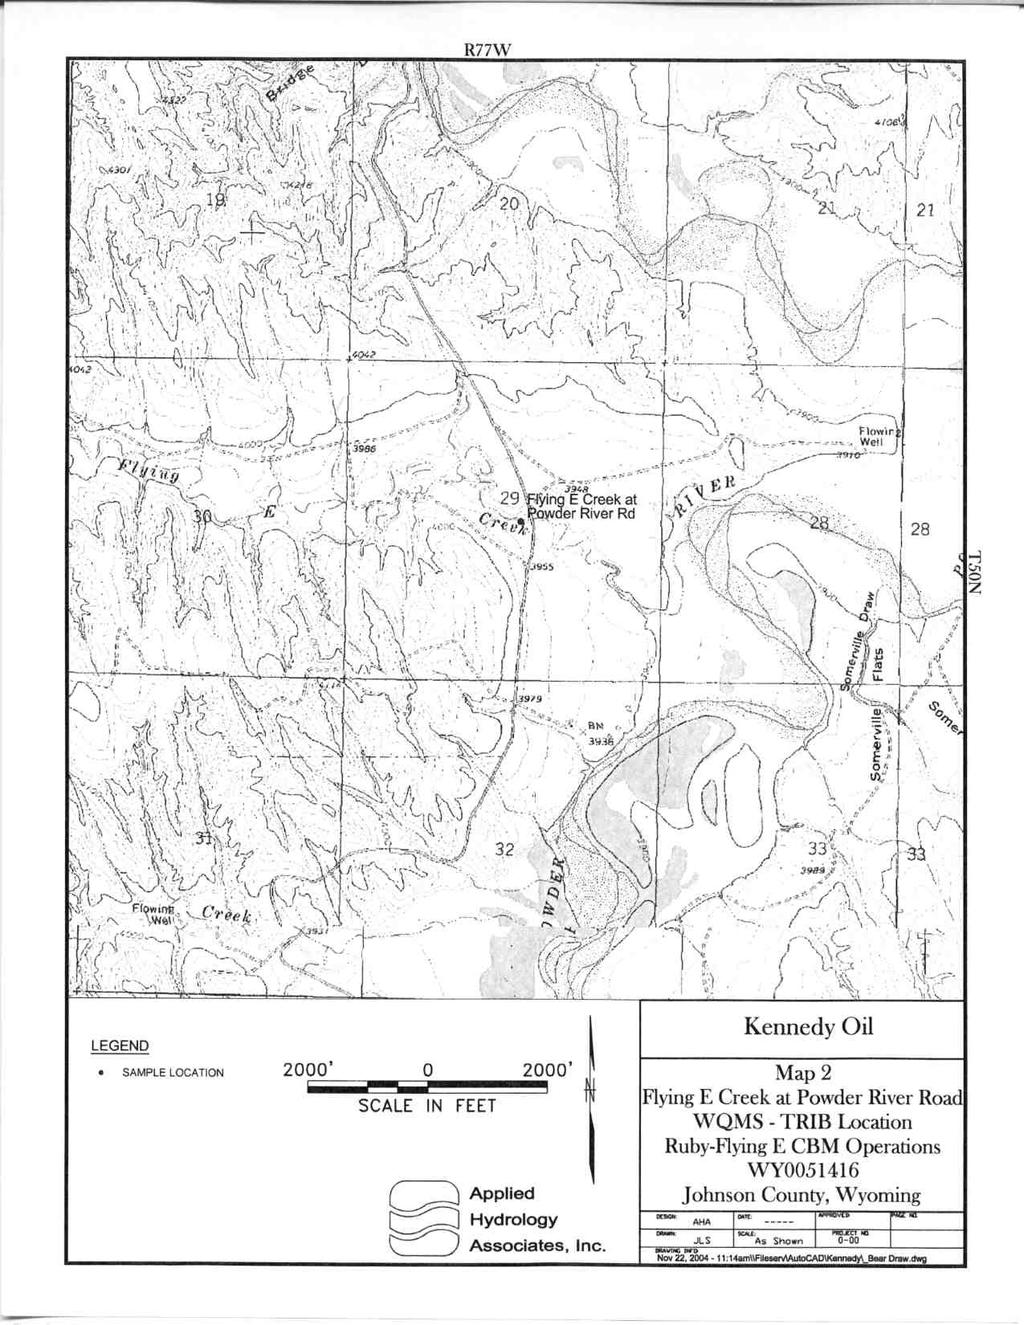
78 Jackie Dice - Table 1- Bear Draw 4_18_05.xls Page 1 Discharge Point #(Outfall) Immediate Receiving Stream Mainstem Distance from outfall to mainstem (stream miles) Q/Q Sec Tnp Rng Latitude Longitude County Reservoir Permit Application Submitted to SEO? SEO Reservoir Permit #** Reservoir Nam 001 UT to Bear Draw Powder River SWSW 6 T50N R78W Johnson Yes 32/6/76S Federal UT to Bear Draw Powder River SWSW 6 T50N R78W Johnson Yes 32/6/76S Federal Bear Draw Powder River NESW 7 T50N R78W Johnson Yes 32/2/76S Federal Bear Draw Powder River SWSE 7 T50N R78W Johnson Yes P6275R Icebox 005 Deep Draw Powder River SWNW 8 T50N R78W Johnson Yes 32/1/77S Federal Deep Draw Powder River SESW 8 T50N R78W Johnson Yes 32/6/75S Deep Draw #3 008 Deep Draw Powder River NWNE 17 T50N R78W Johnson Yes 32/5/75S Deep Draw #2 009 Bear Draw Powder River SENE 17 T50N R78W Johnson Yes 32/4/76S State Ruby Bear Draw Powder River SESW 17 T50N R78W Johnson Yes P6275R Icebox 011 Bear Draw Powder River SWSE 17 T50N R78W Johnson Yes P6275R Icebox 012 UT to Bear Draw Powder River SWSW 17 T50N R78W Johnson Yes 32/5/76S Federal 17-1 * Reservoir applications are being submitted concurrently. ** SEO Reservoir Permit #s will be submitted when they become available Flow Monitoring Points FMP-Bear Bear Draw Powder River NENE 18 T50N R78W Johnson Bear Draw above Lan FMP-Deep Deep Draw Powder River NENW 21 T50N R78W Johnson Deep Draw Water Quality Monitoring Stations TRIB Flying E Creek Powder River 1.06 NWSE 29 T50N R77W Johnson Flying E Creek at Po UPRS Powder River Powder River NA NENE 32 T50N R77W Johnson Powder River above DPRS Powder River Powder River NA SWNW 28 T50N R77W Johnson Powder River below U.T. - Unnamed Tributary
79 Jackie Dice - Table 1- Bear Draw 4_18_05.xls Page 2 TOWNSHIP RANGE SEC. API NUMBER 1/4 1/4 DISCHARGE POINT-001 T50N R78W 6 SW/SW DISCHARGE POINT-002 T50N R78W 6 SW/SW DISCHARGE POINT-003 T50N R78W 7 NE/SW DISCHARGE POINT-004 T50N R78W 7 SW/SE DISCHARGE POINT-005 T50N R78W 8 SW/NW DISCHARGE POINT-006 T50N R78W 8 NW/NE DISCHARGE POINT-007 T50N R78W 8 SE/SW DISCHARGE POINT-008 T50N R78W 17 NW/NE DISCHARGE POINT-009 T50N R78W 17 NW/SW DISCHARGE POINT-010 T50N R78W 17 SE/SW DISCHARGE POINT-011 T50N R78W 17 SW/SE DISCHARGE POINT-012 T50N R78W 17 SW/SW DISCHARGE POINT-013 T50N R78W 18 SE/SW
80 Jackie Dice - Table 1- Bear Draw 4_18_05.xls Page 3 LATITUDE LONGITUDE FORMATION WELL DEPTH RECEIVING STREAM OUTFALL
81 Jackie Dice - Table 1- Bear Draw 4_18_05.xls Page 4 TOWNSHIP RANGE SEC. API NUMBER 1/4 1/4 DISCHARGE POINT-001 T50N R78W 6 SW/SW CW Fed 12-7 T50N R78W SW/NW CW Fed 21-7 T50N R78W NE/NW CW Fed 34-6 T50N R78W SW/SE DISCHARGE POINT-002 T50N R78W 6 SW/SW CW Fed 14-6 T50N R78W SW/SW DISCHARGE POINT-003 T50N R78W 7 NE/SW CW Fed 14-7 T50N R78W SW/SW CW Fed 23-7 T50N R78W NE/SW DISCHARGE POINT-004 T50N R78W 7 SW/SE CW Fed 32-7 T50N R78W SW/NE CW Fed 34-7 T50N R78W SW/SE CW Fed 43-7 T50N R78W NE/SE DISCHARGE POINT-005 T50N R78W 8 SW/NW CW Fed 12-8 T50N R78W SW/NW CW Fed 14-5 T50N R78W SW/SW CW Fed 41-7 T50N R78W NE/NE DISCHARGE POINT-006 T50N R78W 8 NW/NE CW Fed 21-8 T50N R78W NE/NW CW Fed 32-8 T50N R78W SW/NE CW Fed 34-5 T50N R78W SW/SE DISCHARGE POINT-007 T50N R78W 8 SE/SW CW Fed 23-8 T50N R78W NE/SW DISCHARGE POINT-008 T50N R78W 17 NW/NE CW Fed 14-8 T50N R78W SW/SW CW Fed T50N R78W NE/NW CW Fed T50N R78W SW/NE CW Fed T50N R78W NE/SE DISCHARGE POINT-009 T50N R78W 17 NW/SW CW Fed 34-8 T50N R78W SW/SE CW Fed T50N R78W NE/NE CW Fed 43-8 T50N R78W NE/SE DISCHARGE POINT-010 T50N R78W 17 SE/SW CW Fed T50N R78W SW/NW CW Fed T50N R78W NE/SW DISCHARGE POINT-011 T50N R78W 17 SW/SE CW Fed T50N R78W SW/SE DISCHARGE POINT-012 T50N R78W 17 SW/SW CW Fed T50N R78W SW/SW CW Fed T50N R78W SW/SE CW Fed T50N R78W NE/SE DISCHARGE POINT-013 T50N R78W 18 SE/SW CW Fed T50N R78W SW/SW CW Fed T50N R78W NE/SW
82 Jackie Dice - Table 1- Bear Draw 4_18_05.xls Page 5 LATITUDE LONGITUDE FORMATION WELL DEPTH RECEIVING STREAM OUTFALL BIG GEORGE 1,850 FT BIG GEORGE 2,045 FT BIG GEORGE 2,000 FT BIG GEORGE 2,080 FT BIG GEORGE 1,870 FT BIG GEORGE 1,850 FT BIG GEORGE 1,970 FT BIG GEORGE 1,820 FT BIG GEORGE 1,965 FT BIG GEORGE 1,925 FT BIG GEORGE 2,110 FT BIG GEORGE 1,950 FT BIG GEORGE 1,965 FT BIG GEORGE 1,920 FT BIG GEORGE 2,100 FT BIG GEORGE 1,920 FT BIG GEORGE 1,860 FT BIG GEORGE 1,845 FT BIG GEORGE 1,790 FT BIG GEORGE 1,755 FT BIG GEORGE 1,860 FT BIG GEORGE 1,785 FT BIG GEORGE 1,870 FT BIG GEORGE 1,820 FT BIG GEORGE 1,790 FT BIG GEORGE 1,740 FT BIG GEORGE 1,785 FT BIG GEORGE 1,925 FT BIG GEORGE 1,770 FT BIG GEORGE 1,990 FT BIG GEORGE 1,995 FT.
83
Stream Discharge and the Water Budget
 Regents Earth Science Unit 6: Water Cycle & Climate Name: Lab # Stream Discharge and the Water Budget Introduction: The United States Geological Survey (USGS) measures and publishes values for the daily
GAMINGRE 8/1/ of 7
 FYE 09/30/92 JULY 92 0.00 254,550.00 0.00 0 0 0 0 0 0 0 0 0 254,550.00 0.00 0.00 0.00 0.00 254,550.00 AUG 10,616,710.31 5,299.95 845,656.83 84,565.68 61,084.86 23,480.82 339,734.73 135,893.89 67,946.95
Low-flow Estimates for Cedar Creek at Galesburg, Illinois
 ISWS CR 587 ntract Report 587 Low-flow Estimates for Cedar Creek at Galesburg, Illinois by Krishan P. Singh and Robert S. Larson Office of Surface Water Resources: Systems, Information & GIS Prepared for
REDWOOD VALLEY SUBAREA
 Independent Science Review Panel Conceptual Model of Watershed Hydrology, Surface Water and Groundwater Interactions and Stream Ecology for the Russian River Watershed Appendices A-1 APPENDIX A A-2 REDWOOD
Northwest FCS - Non-Producing Property Report Create Date: 10/30/2018
 Page 1 of 15 County: ADA 1 10 002N 001E NW4SW4 13 10016 MINERAL 40.00 0.5000000 20.00 2 10 002N 001E NW4 14 10017 MINERAL 160.00 0.5000000 80.00 3 09 003N 001E PART OF THE S2: LYING N OF THE RR R/W 18
The Colorado Drought of 2002 in Perspective
 The Colorado Drought of 2002 in Perspective Colorado Climate Center Nolan Doesken and Roger Pielke, Sr. Prepared by Tara Green and Odie Bliss http://climate.atmos.colostate.edu Known Characteristics of
Typical Hydrologic Period Report (Final)
") (DELCORA) (Final) November 2015 (Updated April 2016) CSO Long-Term Control Plant Update REVISION CONTROL REV. NO. DATE ISSUED PREPARED BY DESCRIPTION OF CHANGES 1 4/26/16 Greeley and Hansen Pg. 1-3,
(DELCORA) (Final) November 2015 (Updated April 2016) CSO Long-Term Control Plant Update REVISION CONTROL REV. NO. DATE ISSUED PREPARED BY DESCRIPTION OF CHANGES 1 4/26/16 Greeley and Hansen Pg. 1-3,
Climate also has a large influence on how local ecosystems have evolved and how we interact with them.
 The Mississippi River in a Changing Climate By Paul Lehman, P.Eng., General Manager Mississippi Valley Conservation (This article originally appeared in the Mississippi Lakes Association s 212 Mississippi
WOLF CREEK GARRARD DITCH DIVESION GRINNELL DITCH DIVERSION ON WOLF CREEK
 WOLF CREEK GARRARD DITCH DIVESION GRINNELL DITCH DIVERSION ON WOLF CREEK WOLF CREEK DRAINAGE INTRODUCTION BIG PICTURE Wolf Creek flows out of the east slope of the Bighorn Mountains, between the tributaries
Attachment B to Technical Memorandum No.2. Operations Plan of Ross Valley Detention Basins
 Attachment B to Technical Memorandum No.2 Operations Plan of Ross Valley Detention Basins Operations Plan of Ross Valley Detention Basins Stetson Engineers Inc. January 26, 2011 1.0 Introduction Achieving
Jackson County 2013 Weather Data
 Jackson County 2013 Weather Data 61 Years of Weather Data Recorded at the UF/IFAS Marianna North Florida Research and Education Center Doug Mayo Jackson County Extension Director 1952-2008 Rainfall Data
2001 ANNUAL REPORT on INTERBASIN TRANSFERS for RTP South and the Towns of Cary, Apex, and Morrisville
 2001 ANNUAL REPORT on INTERBASIN TRANSFERS for RTP South and the Towns of Cary, Apex, and Morrisville Prepared for: Town of Cary Town of Apex Town of Morrisville RTP South/Wake County Submitted to: North
2015 Fall Conditions Report
 2015 Fall Conditions Report Prepared by: Hydrologic Forecast Centre Date: December 21 st, 2015 Table of Contents Table of Figures... ii EXECUTIVE SUMMARY... 1 BACKGROUND... 2 SUMMER AND FALL PRECIPITATION...
Illinois State Water Survey Division
 Illinois State Water Survey Division SURFACE WATER SECTION SWS Miscellaneous Publication 108 SEDIMENT YIELD AND ACCUMULATION IN THE LOWER CACHE RIVER by Misganaw Demissie Champaign, Illinois June 1989
A Review of the 2007 Water Year in Colorado
 A Review of the 2007 Water Year in Colorado Nolan Doesken Colorado Climate Center, CSU Mike Gillespie Snow Survey Division, USDA, NRCS Presented at the 28 th Annual AGU Hydrology Days, March 26, 2008,
PRELIMINARY DRAFT FOR DISCUSSION PURPOSES
 Memorandum To: David Thompson From: John Haapala CC: Dan McDonald Bob Montgomery Date: February 24, 2003 File #: 1003551 Re: Lake Wenatchee Historic Water Levels, Operation Model, and Flood Operation This
3.0 TECHNICAL FEASIBILITY
 3.0 TECHNICAL FEASIBILITY 3.1 INTRODUCTION To enable seasonal storage and release of water from Lake Wenatchee, an impoundment structure would need to be constructed on the lake outlet channel. The structure
Lower Tuolumne River Accretion (La Grange to Modesto) Estimated daily flows ( ) for the Operations Model Don Pedro Project Relicensing
 Estimated daily flows ( ) for the Operations Model Don Pedro Project Relicensing") Lower Tuolumne River Accretion (La Grange to Modesto) Estimated daily flows (1970-2010) for the Operations Model Don Pedro Project Relicensing 1.0 Objective Using available data, develop a daily time series
Lower Tuolumne River Accretion (La Grange to Modesto) Estimated daily flows (1970-2010) for the Operations Model Don Pedro Project Relicensing 1.0 Objective Using available data, develop a daily time series
FORECAST-BASED OPERATIONS AT FOLSOM DAM AND LAKE
 FORECAST-BASED OPERATIONS AT FOLSOM DAM AND LAKE 255 237 237 237 217 217 217 200 200 200 0 163 131 Bridging the Gap163Conference 255 0 132 255 0 163 122 The Dana on Mission Bay San Diego, CA January 28,
San Francisco Public Utilities Commission Hydrological Conditions Report For April 2014
 San Francisco Public Utilities Commission Hydrological Conditions Report For April 2014 J. Chester, C. Graham, A. Mazurkiewicz, & M. Tsang, May 13, 2014 Snow in the High Country The view from Bond Pass
Jackson County 2018 Weather Data 67 Years of Weather Data Recorded at the UF/IFAS Marianna North Florida Research and Education Center
 Jackson County 2018 Weather Data 67 Years of Weather Data Recorded at the UF/IFAS Marianna North Florida Research and Education Center Doug Mayo Jackson County Extension Director 1952-2008 Rainfall Data
San Francisco Public Utilities Commission Hydrological Conditions Report For March 2016
 San Francisco Public Utilities Commission Hydrological Conditions Report For March 2016 J. Chester, C. Graham, A. Mazurkiewicz, & M. Tsang, April 7, 2016 Snow Surveyor Chris Graham crossing Huckleberry
Table 1 - Infiltration Rates
 Stantec Consulting Ltd. 100-300 Hagey Boulevard, Waterloo ON N2L 0A4 November 14, 2017 File: 161413228/10 Attention: Mr. Michael Witmer, BES, MPA, MCIP, RPP City of Guelph 1 Carden Street Guelph ON N1H
Jackson County 2014 Weather Data
 Jackson County 2014 Weather Data 62 Years of Weather Data Recorded at the UF/IFAS Marianna North Florida Research and Education Center Doug Mayo Jackson County Extension Director 1952-2008 Rainfall Data
January 25, Summary
 January 25, 2013 Summary Precipitation since the December 17, 2012, Drought Update has been slightly below average in parts of central and northern Illinois and above average in southern Illinois. Soil
Atlantic Rim Coalbed Methane Play: The Newest SuccessfulCBM Play in the Rockies
 Atlantic Rim Coalbed Methane Play: The Newest SuccessfulCBM Play in the Rockies Robert A. Lamarre Lamarre Geological, Denver, Colorado Stephen K. Ruhl Anadarko Petroleum Corporation, The Woodlands, Texas
INFLOW DESIGN FLOOD CONTROL SYSTEM PLAN 40 C.F.R. PART PLANT YATES ASH POND 2 (AP-2) GEORGIA POWER COMPANY
 GEORGIA POWER COMPANY") INFLOW DESIGN FLOOD CONTROL SYSTEM PLAN 40 C.F.R. PART 257.82 PLANT YATES ASH POND 2 (AP-2) GEORGIA POWER COMPANY EPA s Disposal of Coal Combustion Residuals from Electric Utilities Final Rule (40 C.F.R.
INFLOW DESIGN FLOOD CONTROL SYSTEM PLAN 40 C.F.R. PART 257.82 PLANT YATES ASH POND 2 (AP-2) GEORGIA POWER COMPANY EPA s Disposal of Coal Combustion Residuals from Electric Utilities Final Rule (40 C.F.R.
Chiang Rai Province CC Threat overview AAS1109 Mekong ARCC
 Chiang Rai Province CC Threat overview AAS1109 Mekong ARCC This threat overview relies on projections of future climate change in the Mekong Basin for the period 2045-2069 compared to a baseline of 1980-2005.
Evapo-transpiration Losses Produced by Irrigation in the Snake River Basin, Idaho
 Nov 7, 2007 DRAFT Evapo-transpiration Losses Produced by Irrigation in the Snake River Basin, Idaho Wendell Tangborn and Birbal Rana HyMet Inc. Vashon Island, WA Abstract An estimated 8 MAF (million acre-feet)
Integrating Weather Forecasts into Folsom Reservoir Operations
 Integrating Weather Forecasts into Folsom Reservoir Operations California Extreme Precipitation Symposium September 6, 2016 Brad Moore, PE US Army Corps of Engineers Biography Brad Moore is a Lead Civil
A Report on a Statistical Model to Forecast Seasonal Inflows to Cowichan Lake
 A Report on a Statistical Model to Forecast Seasonal Inflows to Cowichan Lake Prepared by: Allan Chapman, MSc, PGeo Hydrologist, Chapman Geoscience Ltd., and Former Head, BC River Forecast Centre Victoria
HYDROLOGIC AND WATER RESOURCES EVALUATIONS FOR SG. LUI WATERSHED
 HYDROLOGIC AND WATER RESOURCES EVALUATIONS FOR SG. LUI WATERSHED 1.0 Introduction The Sg. Lui watershed is the upper part of Langat River Basin, in the state of Selangor which located approximately 20
National Integrated Drought Information System Southeast US Pilot for Apalachicola- Flint-Chattahoochee River Basin. 22 May 2012
 National Integrated Drought Information System Southeast US Pilot for Apalachicola- Flint-Chattahoochee River Basin 22 May 2012 Outline Welcome Keith Ingram, UF, Southeast Climate Consortium Current drought
Webinar and Weekly Summary February 15th, 2011
 Webinar and Weekly Summary February 15th, 2011 -Assessment of current water conditions - Precipitation Forecast - Recommendations for Drought Monitor Upper Colorado Normal Precipitation Upper Colorado
Folsom Dam Water Control Manual Update Joint Federal Project, Folsom Dam
 Folsom Dam Water Control Manual Update Joint Federal Project, Folsom Dam Public Workshop May 25, 2016 Sacramento Library Galleria 828 I Street, Sacramento, CA US Army Corps of Engineers BUILDING STRONG
APPLICATION FOR CONDITIONAL ABSOLUTE WATER STORAGE RIGHT
 District Court, Water Division, Colorado Court Address: CONCERNING THE APPLICATION FOR WATER RIGHTS OF Applicant: In the River or its Tributaries In COUNTY Attorney or Party Without Attorney (Name and
Missouri River Basin Water Management
 Missouri River Basin Water Management US Army Corps of Engineers Missouri River Navigator s Meeting February 12, 2014 Bill Doan, P.E. Missouri River Basin Water Management US Army Corps of Engineers BUILDING
Disentangling Impacts of Climate & Land Use Changes on the Quantity & Quality of River Flows in Southern Ontario
 Disentangling Impacts of Climate & Land Use Changes on the Quantity & Quality of River Flows in Southern Ontario by Trevor Dickinson & Ramesh Rudra, Water Resources Engineering University of Guelph Acknowledgements
Three main areas of work:
 Task 2: Climate Information 1 Task 2: Climate Information Three main areas of work: Collect historical and projected weather and climate data Conduct storm surge and wave modeling, sea-level rise (SLR)
Study of Hydrometeorology in a Hard Rock Terrain, Kadirischist Belt Area, Anantapur District, Andhra Pradesh
 Open Journal of Geology, 2012, 2, 294-300 http://dx.doi.org/10.4236/ojg.2012.24028 Published Online October 2012 (http://www.scirp.org/journal/ojg) Study of Hydrometeorology in a Hard Rock Terrain, Kadirischist
Lake Michigan. St. Joseph River Assessment. Figure 1. The St. Joseph River watershed. Paw Paw River Paw Paw. Nottawa Creek. Watervliet Decatur
 Michigan Paw Paw River Paw Paw Nottawa Creek Benton Harbor St. Joseph Watervliet Decatur Schoolcraft Burlington Berrien Springs Dowagiac Dowagiac River Three Rivers Mendon Sturgis Dam Union City Tekonsha
The Climate of Payne County
 The Climate of Payne County Payne County is part of the Central Great Plains in the west, encompassing some of the best agricultural land in Oklahoma. Payne County is also part of the Crosstimbers in the
January 22, Coronado National Forest 300 West Congress Street Tucson, AZ Jim Upchurch, Forest Supervisor. Dear Mr.
 January 22, 2015 Coronado National Forest 300 West Congress Street Tucson, AZ 85701 Attn: Jim Upchurch, Forest Supervisor Dear Mr. Upchurch: In your letter dated January 16, 2015, you requested that Hudbay
Climate Change and Water Supply Research. Drought Response Workshop October 8, 2013
 Climate Change and Water Supply Research Drought Response Workshop October 8, 2013 DWR Photo Oroville Reservoir, 2009 Talk Overview Expectations History Atmospheric Rivers and Water Supply Current Research
Weather History on the Bishop Paiute Reservation
 Weather History on the Bishop Paiute Reservation -211 For additional information contact Toni Richards, Air Quality Specialist 76 873 784 toni.richards@bishoppaiute.org Updated 2//214 3:14 PM Weather History
National Integrated Drought Information System. Southeast US Pilot for Apalachicola- Flint-Chattahoochee River Basin 20-March-2012
 National Integrated Drought Information System Southeast US Pilot for Apalachicola- Flint-Chattahoochee River Basin 20-March-2012 Current drought status from Drought Monitor http://www.drought.unl.edu/dm/monitor.html
8.1 Attachment 1: Ambient Weather Conditions at Jervoise Bay, Cockburn Sound
 8.1 Attachment 1: Ambient Weather Conditions at Jervoise Bay, Cockburn Sound Cockburn Sound is 20km south of the Perth-Fremantle area and has two features that are unique along Perth s metropolitan coast
2003 Moisture Outlook
 2003 Moisture Outlook Nolan Doesken and Roger Pielke, Sr. Colorado Climate Center Prepared by Tara Green and Odie Bliss http://climate.atmos.colostate.edu Through 1999 Through 1999 Fort Collins Total Water
Global Climates. Name Date
 Global Climates Name Date No investigation of the atmosphere is complete without examining the global distribution of the major atmospheric elements and the impact that humans have on weather and climate.
9. PROBABLE MAXIMUM PRECIPITATION AND PROBABLE MAXIMUM FLOOD
 9. PROBABLE MAXIMUM PRECIPITATION AND PROBABLE MAXIMUM FLOOD 9.1. Introduction Due to the size of Watana Dam and the economic importance of the Project to the Railbelt, the Probable Maximum Flood (PMF)
Monthly Long Range Weather Commentary Issued: APRIL 18, 2017 Steven A. Root, CCM, Chief Analytics Officer, Sr. VP,
 Monthly Long Range Weather Commentary Issued: APRIL 18, 2017 Steven A. Root, CCM, Chief Analytics Officer, Sr. VP, sroot@weatherbank.com MARCH 2017 Climate Highlights The Month in Review The average contiguous
APPLICATIONS OF DOWNSCALING: HYDROLOGY AND WATER RESOURCES EXAMPLES
 APPLICATIONS OF DOWNSCALING: HYDROLOGY AND WATER RESOURCES EXAMPLES Dennis P. Lettenmaier Department of Civil and Environmental Engineering For presentation at Workshop on Regional Climate Research NCAR
Changing Hydrology under a Changing Climate for a Coastal Plain Watershed
 Changing Hydrology under a Changing Climate for a Coastal Plain Watershed David Bosch USDA-ARS, Tifton, GA Jeff Arnold ARS Temple, TX and Peter Allen Baylor University, TX SEWRU Objectives 1. Project changes
2011 Flood: Technical Review of Lake Manitoba, Lake St. Martin and Assiniboine River Water Levels Summary
 2011 Flood: Technical Review of Lake Manitoba, Lake St. Martin and Assiniboine River Water Levels Summary October 2013 Introduction Manitoba experienced unprecedented flooding in 2011. While flooding was
UTILITY REPORT FOR THORNTON SELF STORAGE THORNTON, COLORADO
 UTILITY REPORT FOR THORNTON SELF STORAGE THORNTON, COLORADO Prepared by: Bowman Consulting 63 Park Point Dr. Suite 1 Golden, CO 841 (33)-81-29 June 29, 215 Revised August 14, 215 Revised September 3, 215
Water Management for Environmental Restoration Flows In the Big Bend reach, Rio Grande Rio Bravo
 University of California, Davis Department of Land, Air and Water Resources Water Management for Environmental Restoration Flows In the Big Bend reach, Rio Grande Rio Bravo 46 th Annual Meeting 8 9 March,
CoCoRaHS Monitoring Colorado s s Water Resources through Community Collaborations
 CoCoRaHS Monitoring Colorado s s Water Resources through Community Collaborations Nolan Doesken Colorado Climate Center Atmospheric Science Department Colorado State University Presented at Sustaining
Hydrologic Conditions in the Delaware River Basin
 Hydrologic Conditions in the Delaware River Basin April : Flooding in Lambertville, New Jersey Aerial photo used with permission of www.elevated-images.com Annual Report Prepared by Operations Staff June
2. PHYSICAL SETTING FINAL GROUNDWATER MANAGEMENT PLAN. 2.1 Topography. 2.2 Climate
 FINAL GROUNDWATER MANAGEMENT PLAN 2. PHYSICAL SETTING Lassen County is a topographically diverse area at the confluence of the Cascade Range, Modoc Plateau, Sierra Nevada and Basin and Range geologic provinces.
Proposal to limit Namakan Lake to 1970 Upper Rule Curve for remainder of summer
 July 7, 214 Subject: Proposal to limit Namakan Lake to 197 Upper Rule Curve for remainder of summer Background: Flooding in 214 has resulted in the highest water levels on Namakan Lake since 1968, and
The Climate of Bryan County
 The Climate of Bryan County Bryan County is part of the Crosstimbers throughout most of the county. The extreme eastern portions of Bryan County are part of the Cypress Swamp and Forest. Average annual
Hydrology and Hydraulics Design Report. Background Summary
 To: National Park Services Montezuma Castle National Monument Richard Goepfrich, Facility Manager From: Multicultural Technical Engineers Date: Tuesday - February 13, 2018 Subject: 30% Hydrology and Hydraulics
Colorado s 2003 Moisture Outlook
 Colorado s 2003 Moisture Outlook Nolan Doesken and Roger Pielke, Sr. Colorado Climate Center Prepared by Tara Green and Odie Bliss http://climate.atmos.colostate.edu How we got into this drought! Fort
STORMWATER REPORT FRITO LAY SUBDIVISION NO. 3
 STORMWATER REPORT FRITO LAY SUBDIVISION NO. 3 May 2018 STORMWATER REPORT I. Subdivision Data a. The parcel is adjacent to the existing Frito Lay property in Topeka; and the subject plat application encompasses
Appendix B - Alabama-Coosa-Tallapoosa (ACT) Basin
 Basin") Appendix B - Alabama-Coosa-Tallapoosa (ACT) Basin 1 ACT BASIN 1.1 DESCRIPTION OF BASIN The headwater streams of the Alabama-Coosa-Tallapoosa (ACT) System rise in the Blue Ridge Mountains of Georgia and
Appendix B - Alabama-Coosa-Tallapoosa (ACT) Basin 1 ACT BASIN 1.1 DESCRIPTION OF BASIN The headwater streams of the Alabama-Coosa-Tallapoosa (ACT) System rise in the Blue Ridge Mountains of Georgia and
Chapter 5 CALIBRATION AND VERIFICATION
 Chapter 5 CALIBRATION AND VERIFICATION This chapter contains the calibration procedure and data used for the LSC existing conditions model. The goal of the calibration effort was to develop a hydraulic
FINAL STREAM. Prepared For: Discharge. Draft Stream. Level Hay Street, Subiaco WA Indiana Street. Golden, CO USA
 Draft Stream Discharge and Water Supply Estimates S F FINAL STREAM DISCHARGE AND WATER SUPPLYS ESTIMATES CITRONEN FJORD F DEVELOPMENT PROJECT Prepared For: Ironbark Zinc Limited Level 1 350 Hay Street,
Water Supply Conditions and Outlook June 4, 2018
 Water Supply Conditions and Outlook June 4, 2018 Flow Forecasting & Operations Planning Water Security Agency Overview Water supply conditions across Saskatchewan are generally good with most reservoir
Missouri River Basin Climate Outlook 1 May Dr. Dennis Todey State Climatologist South Dakota State Univ.
 Missouri River Basin Climate Outlook 1 May 2014 Dr. Dennis Todey State Climatologist South Dakota State Univ. dennis.todey@sdstate.edu 605-688-5141 Photo taken Feb 19, 2013 General Information Providing
The Climate of Seminole County
 The Climate of Seminole County Seminole County is part of the Crosstimbers. This region is a transition region from the Central Great Plains to the more irregular terrain of southeastern Oklahoma. Average
DELTA COUNTY. CASE NO. 2017CW43
 IN THE DISTRICT COURT IN AND FOR WATER DIVISION NO. 4 STATE OF COLORADO TO: ALL PERSONS INTERESTED IN WATER APPLICATIONS IN SAID WATER DIVISION NO. 4 Pursuant to C.R.S. 37-92-302, as amended, you are notified
North Wales PRP for Wissahickon Creek Nutrients
 North Wales PRP for Wissahickon Creek Nutrients July 14, 2017 Revised September 7, 2017 Revised August 9, 2018 Prepared for: North Wales Borough 300 School Street North Wales, PA 19454 Corporate Headquarters
The Colorado Drought : 2003: A Growing Concern. Roger Pielke, Sr. Colorado Climate Center.
 The Colorado Drought 2001-2003: 2003: A Growing Concern Roger Pielke, Sr. Colorado Climate Center Prepared by Tara Green and Odie Bliss http://climate.atmos.colostate.edu 2 2002 Drought History in Colorado
Modeling the Effects of Climate and Land Cover Change in the Stoney Brook Subbasin of the St. Louis River Watershed
 Modeling the Effects of Climate and Land Cover Change in the Stoney Brook Subbasin of the St. Louis River Watershed Joe Johnson and Jesse Pruette 214 NASA Research Internship Geospatial Technologies Program
THE STATE OF SURFACE WATER GAUGING IN THE NAVAJO NATION
 THE STATE OF SURFACE WATER GAUGING IN THE NAVAJO NATION Aregai Tecle Professor of Hydrology Northern Arizona University Flagstaff, AZ Acknowledgement Many thanks to my research team mates and Elisabeth
The Climate of Marshall County
 The Climate of Marshall County Marshall County is part of the Crosstimbers. This region is a transition region from the Central Great Plains to the more irregular terrain of southeastern Oklahoma. Average
In the Matter of Emergency Regulation of the Level of
 INTERNATIONAL JOINT COMMISSION In the Matter of Emergency Regulation of the Level of Rainy Lake and of other Boundary Waters in the Rainy Lake Watershed. Supplementary Order to the Order Prescribing Method
February 10, Mr. Jeff Smith, Chairman Imperial Valley Water Authority E County Road 1000 N Easton, IL Dear Chairman Smith:
 February 1, 1 Mr. Jeff Smith, Chairman Imperial Valley Water Authority 8 E County Road 1 N Easton, IL Dear Chairman Smith: The Illinois State Water Survey (ISWS), under contract to the Imperial Valley
Quenching the Valley s thirst: The connection between Sierra Nevada snowpack & regional water supply
 Quenching the Valley s thirst: The connection between Sierra Nevada snowpack & regional water supply Roger Bales, UC Merced Snow conditions Snow & climate change Research directions Sierra Nevada snow
Climatography of the United States No
 Climate Division: AK 5 NWS Call Sign: ANC Month (1) Min (2) Month(1) Extremes Lowest (2) Temperature ( F) Lowest Month(1) Degree s (1) Base Temp 65 Heating Cooling 90 Number of s (3) Jan 22.2 9.3 15.8
TO: ALL PERSONS INTERESTED IN WATER APPLICATIONS IN SAID WATER DIVISION NO. 7
 DISTRICT COURT, WATER DIVISION 7, COLORADO WATER RESUME TO: ALL PERSONS INTERESTED IN WATER APPLICATIONS IN SAID WATER DIVISION NO. 7 Pursuant to C.R.S. 37-92-302, you are notified that the following is
Name of Applicant Mailing Address address Telephone Number
 District Court, Water Division, Colorado Court Address: CONCERNING THE APPLICATION FOR WATER RIGHTS OF Applicant: In the River or its Tributaries In COUNTY Attorney or Party Without Attorney (Name and
HISTORY OF CONSTRUCTION FOR EXISTING CCR SURFACE IMPOUNDMENT PLANT GASTON ASH POND 40 CFR (c)(1)(i) (xii)
(1)(i) (xii)") HISTORY OF CONSTRUCTION FOR EXISTING CCR SURFACE IMPOUNDMENT PLANT GASTON ASH POND 40 CFR 257.73(c)(1)(i) (xii) (i) Site Name and Ownership Information: Site Name: E.C. Gaston Steam Plant Site Location:
HISTORY OF CONSTRUCTION FOR EXISTING CCR SURFACE IMPOUNDMENT PLANT GASTON ASH POND 40 CFR 257.73(c)(1)(i) (xii) (i) Site Name and Ownership Information: Site Name: E.C. Gaston Steam Plant Site Location:
A Recap of Colorado s Water Year 2018
 A Recap of Colorado s Water Year 2018 For further inquiries, please contact: Russ Schumacher, State Climatologist (970) 491-8084 Becky Bolinger, Assistant State Climatologist (970) 491-8506 Peter Goble,
The Climate of Pontotoc County
 The Climate of Pontotoc County Pontotoc County is part of the Crosstimbers. This region is a transition region from the Central Great Plains to the more irregular terrain of southeast Oklahoma. Average
Streamflow, Sediment, and Nutrient Simulation of the Bitterroot Watershed using SWAT
 Streamflow, Sediment, and Nutrient Simulation of the Bitterroot Watershed using SWAT by Dr. Michael Van Liew Montana Department of Environmental Quality Helena, Montana, USA Site Map of SWAT Watersheds
Eric Snodgrass Co-Founder and Senior Atmospheric Scientist of Agrible, Inc Director of Undergraduate Studies Department of Atmospheric Sciences
 Eric Snodgrass Co-Founder and Senior Atmospheric Scientist of Agrible, Inc Director of Undergraduate Studies Department of Atmospheric Sciences University Of Illinois Urbana-Champaign snodgrss@illinois.edu
Climatography of the United States No
 Climate Division: TN 1 NWS Call Sign: Month (1) Min (2) Month(1) Extremes Lowest (2) Temperature ( F) Lowest Month(1) Degree s (1) Base Temp 65 Heating Cooling 100 Number of s (3) Jan 47.6 24.9 36.3 81
Highlights of the 2006 Water Year in Colorado
 Highlights of the 2006 Water Year in Colorado Nolan Doesken, State Climatologist Atmospheric Science Department Colorado State University http://ccc.atmos.colostate.edu Presented to 61 st Annual Meeting
Folsom Dam Water Control Manual Update Joint Federal Project, Folsom Dam
 Folsom Dam Water Control Manual Update Joint Federal Project, Folsom Dam Public Workshop May 28, 2015 Library Galleria 828 I Street, Sacramento, CA US Army Corps of Engineers BUILDING STRONG WELCOME &
Project Delivery Team Meeting. December 14, Trusted Partners Delivering Value Today for a Better Tomorrow
 LOXAHATCHEE RIVER WATERSHED RESTORATION PROJECT Project Delivery Team Meeting December 14, 2016 One of the Last Old Growth Cypress Floodplains in the SE Florida Federally designated as a National Wild
Climate Variability. Eric Salathé. Climate Impacts Group & Department of Atmospheric Sciences University of Washington. Thanks to Nathan Mantua
 Climate Variability Eric Salathé Climate Impacts Group & Department of Atmospheric Sciences University of Washington Thanks to Nathan Mantua Northwest Climate: the mean Factors that influence local/regional
Plant Water Stress Frequency and Periodicity in Western North Dakota
 Plant Water Stress Frequency and Periodicity in Western North Dakota Llewellyn L. Manske PhD, Sheri Schneider, John A. Urban, and Jeffery J. Kubik Report DREC 10-1077 Range Research Program Staff North
Application of SWAT for the modelling of sediment yield at Pong reservoir, India
 Application of SWAT for the modelling of sediment yield at Pong reservoir, India A. R. Senthil kumar Tanmoyee Bhattacharya Suhas D Khobragade Manohar Arora National Institute of Hydrology Roorkee-247667,
Technical Note: Hydrology of the Lake Chilwa wetland, Malawi
 Technical Note: Hydrology of the Lake Chilwa wetland, Malawi Matthew McCartney June 27 Description Lake Chilwa is located in the Southern region of Malawi on the country s eastern boarder with Mozambique
SEPTEMBER 2013 REVIEW
 Monthly Long Range Weather Commentary Issued: October 21, 2013 Steven A. Root, CCM, President/CEO sroot@weatherbank.com SEPTEMBER 2013 REVIEW Climate Highlights The Month in Review The average temperature
Climatography of the United States No
 Climate Division: TN 3 NWS Call Sign: BNA Month (1) Min (2) Month(1) Extremes Lowest (2) Temperature ( F) Lowest Month(1) Degree s (1) Base Temp 65 Heating Cooling 100 Number of s (3) Jan 45.6 27.9 36.8
 Water Supply Forecast - THE DALLES http://www.nwrfc.noaa.gov/water_supply/ws_forecasts.php?id=tdao3 Page 1 of 1 3/7/2013 Close Archive Data/Normals Rankings Adjustments Verification Verify All Years Help
Extreme Weather and Climate Change: the big picture Alan K. Betts Atmospheric Research Pittsford, VT NESC, Saratoga, NY
 Extreme Weather and Climate Change: the big picture Alan K. Betts Atmospheric Research Pittsford, VT http://alanbetts.com NESC, Saratoga, NY March 10, 2018 Increases in Extreme Weather Last decade: lack
FORM A GEOGRAPHY 1114 LABORATORY FINAL EXAM Teaching Assistant SAMPLE Lab Meeting. Place all answers on the answer sheet; 2 points per question
 FORM A GEOGRAPHY 1114 NAME LABORATORY FINAL EXAM Teaching Assistant SAMPLE Lab Meeting Place all answers on the answer sheet; 2 points per question FORMULAS PPT = (PET-D) + S ± = Δ SOIL G = V H Q = V A