Protein Sequencing and Identification by Mass Spectrometry
|
|
|
- Milton Melvin Rodgers
- 5 years ago
- Views:
Transcription
1 Protein Sequencing and Identification by Mass Spectrometry
2 Outline Tandem Mass Spectrometry De Novo Peptide Sequencing Spectrum Graph Protein Identification via Database Search Identifying Post Translationally Modified Peptides Spectral Convolution Spectral Alignment


3 Different Amino Acid Have Different Masses H...-HN-CH-CO-NH-CH-CO-NH-CH-CO- OH N-terminus R i-1 R i R i+1 C-terminus AA residue i-1 AA residue i AA residue i+1


4 Peptide Fragmentation Collision Induced Dissociation H...-HN-CH-CO... NH-CH-CO-NH-CH-CO- OH R i-1 R i R i+1 H + Prefix Fragment Suffix Fragment Peptides tend to fragment along the backbone. Mass spectrometer is a sophisticated (and rather expensive!) scale to measure the masses of these fragments
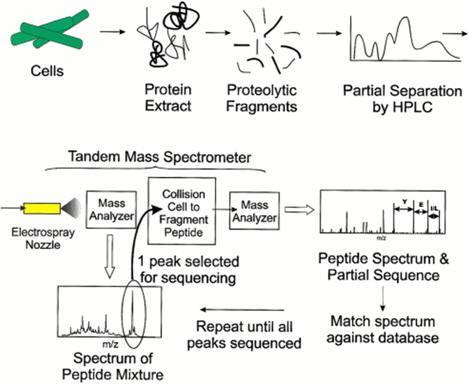
5 Breaking Protein into Peptides and Peptides into Fragment Ions Most mass spectrometers can only measure masses of short peptides (e.g., 20 amino acids or less) rather than masses of entire proteins (usually hundreds of amino acids). That s why: Proteases, e.g. trypsin, break protein into short peptides. A Tandem Mass Spectrometer further breaks the peptides down into fragment ions and measures the mass of each piece. Mass Spectrometer accelerates the fragmented ions; heavier ions accelerate slower than lighter ones. Mass Spectrometer measure mass/charge ratio of an ion.
6 N- and C-terminal Peptides
7 Terminal peptides and ion types Peptide Mass (D) = 415
8 Masses of fragment ions Peptide Mass (D) = 415 Peptide without Mass (D) = 397
9 N- and C-terminal Peptides
10 N- and C-terminal Peptides
11 Theoretical Spectrum Reconstruct peptide from the set of masses of fragment ions (mass-spectrum)
12 Reconstructing Peptides Reconstruct peptide from the set of masses of fragment ions (mass-spectrum)
13 Reconstructing Peptides Reconstruct peptide from the set of masses of fragment ions (mass-spectrum)
14 Reconstructing Peptides Reconstruct peptide from the set of masses of fragment ions (mass-spectrum)
15 Peptide Fragmentation b 2 -H 2 O b 3 - NH 3 a 2 b 2 a 3 b 3 HO NH + 3 R 1 O R 2 O R 3 O R 4 H -- N --- C --- C --- N --- C --- C --- N --- C --- C --- N --- C -- COOH H H H H H H H y 3 y 2 y 1 y 3 -H 2 O y 2 - NH 3
16 H 2 O Mass Spectra G V D L K 57 Da = K L G 99 Da = V D V G 0 mass The peaks in the mass spectrum: Prefix and Suffix Fragments. Fragments with neutral losses (-H 2 O, -NH 3 ) Noise and missing peaks.
17 Intensity Protein Identification with MS/MS Protein database MS/MS Peptide Identification 0 mass
18 Relative Abundance Tandem Mass Spectrum Tandem Mass Spectrometry mainly generates N- and C-terminal fragment ions Chemical noise often complicates the spectrum. Represented in 2-D: mass/charge axis vs. intensity axis S#: 1708 RT: AV: 1 NL: 5.27E6 T: + c d Full ms [ ] m/z
19 Tandem Mass-Spectrometry
20 Breaking Proteins into Peptides MPSERGTDIMRPAKID... protein GTDIMR PAKID MPSER peptides HPLC To MS/MS
 From lectures by")
21 Mass Spectrometry Matrix-Assisted Laser Desorption/Ionization (MALDI) From lectures by Vineet Bafna (UCSD)
22 Relative Abundance Relative Abundance Relative Abundance Tandem Mass Spectrometry RT: LC Time (min) NL: 1.52E8 Base Peak F: + c Full ms [ ] S#: 1707 RT: AV: 1 NL: 2.41E7 F: + c Full ms [ ] MS Scan m/z S#: 1708 RT: AV: 1 NL: 5.27E6 T: + c d Full ms [ ] Ion Source MS-1 collision cell MS MS/MS Scan m/z
23 Relative Abundance Protein Identification by Tandem Mass Spectrometry (MS/MS) S e q u e n c e MS/MS instrument database search Sequest, Mascot, etc 0 de novo interpretation Lutefisk, Peaks, etc S#: 1708 RT: AV: 1 NL: 5.27E6 T: + c d Full ms [ ] m/z
24 S#: 1708 RT: AV: 1 NL: 5.27E6 T: + c d Full ms [ ] Relative Abundance m/z De Novo vs. Database Search Database Search De Novo Database of known peptides MDERHILNM, KLQWVCSDL, PTYWASDL, ENQIKRSACVM, TLACHGGEM, NGALPQWRT, HLLERTKMNVV, GGPASSDA, GGLITGMQSD, MQPLMNWE, ALKIIMNVRT, AVGELTK, HEWAILF, GHNLWAMNAC, GVFGSVLRA, EKLNKAATYIN.. Mass, Score W Database of all peptides = 20 n A V AAAAAAAA,AAAAAAAC,AAAAAAAD,AAAAAAAE, L G T AAAAAAAG,AAAAAAAF,AAAAAAAH,AAAAAAI, E P C L K AVGELTI, AVGELTK W, AVGELTL, AVGELTM, D T YYYYYYYS,YYYYYYYT,YYYYYYYV,YYYYYYYY R AVGELTK
25 De Novo vs. Database Search: A Paradox The database of all peptides is huge 20 n peptides of length n The database of all known peptides is much smaller 10 8 peptides However, de novo algorithms can be much faster, even though their search space is much larger! A database search scans all peptides in the database of all known peptides to find best one. De novo eliminates the need to scan database of all peptides by modeling the problem as a graph search.
26 Three Algorithmic Problems Searching for a million words in a text. Suppose it takes 1 sec to find a word in a text. How much time would it take to find 1 million words in the text? Searching for a word without even looking at % of the text. Suppose you search for a word in a text. Would it be possible to ignore % of the text, scan only the remaining part and guarantee that the word you are looking for will be found? Finding spelling errors in a book written in an unknown language. Given a book (in an unknown language) and a misspelled word (with insertions, deletions, and substitutions of letters) correct spelling errors in the word.
27 Three Algorithmic Problems Searching for a million words in a text. Suppose it takes 1 sec to find a word in a text. How much time would it take to find 1 million words in the text? 1 million seconds? Searching for a word without even looking at % of the text. Suppose you search for a word in a text. Would it be possible to ignore % of the text, scan only the remaining part and guarantee that the word you are looking for will be found? Finding spelling errors in a book written in an unknown language. Given a book (in an unknown language) and a misspelled word (with insertions, deletions, and substitutions of letters) correct spelling errors in the word.
28 Genomics: Problems Solved. Searching for a million words in a text. Aho-Corasik algorithm takes roughly the same time with a million words as it takes with a single word. Searching for a word without even looking at % of the text. Filtration algorithms (like FASTA or BLAST) ignore % of the text. Finding spelling errors. Sequence alignment algorithms (like Smith- Waterman) do it in quadratic time
29 Proteomics: Three Problems Comparing a million spectra against a database. Suppose it takes 1 sec to interpret a spectrum. How much time would it take to interpret 1 million spectra? Mass-spectrometry database search without even looking at % of the database. Suppose you compare a spectrum against a database. Would it be possible to ignore % of the database, scan only the remaining part and guarantee that you still can identify a peptide of interest? Blind PTM search and discovery of new PTM types. Given a spectrum of a peptide with unknown PTM types, find this peptide in the database. Discover new PTM types by data mining of large MS/MS datasets.
30 Three Solutions Comparing a million spectra against a database. InsPecT (Tanner et al., Anal. Chem, 2005) MS/MS database search without even looking at % of the database. InsPecT (Tanner et al., Anal. Chem, 2005) Blind PTM search and discovery of new PTM types. Given a spectrum of a peptide with unknown PTM types, find this peptide in the database. Discover new PTM types by data mining of large MS/MS datasets. MS-Alignment (Tsur et al., Nature Biotech., 2005)
31 Filtration: Combining De Novo Sequencing and Database Search in Mass-Spectrometry So far de novo and database search were presented as two separate techniques Database search is rather slow: many labs generate more than 100,000 spectra per day. SEQUEST takes approximately 1 minute to compare a single spectrum against SWISS-PROT (54Mb) on a desktop. It will take SEQUEST more than 2 months to analyze the MS/MS data produced in a single day. Can slow database search be combined with fast de novo analysis?
32 Relative Abundance De novo Peptide Sequencing S#: 1708 RT: AV: 1 NL: 5.27E6 T: + c d Full ms [ ] m/z Sequence
33 Building Spectrum Graph How to create vertices (from masses) How to create edges (from mass differences) How to score vertices How to score paths How to find the best path
34 b-ions (prefix or N-terminal ions) S E Q U E N C E Mass/Charge (M/Z)
35 a-ions = b-ions - CO = b-ions - 28 S E Q U E N C E Mass/Charge (M/Z)
36 Shifting Peaks: a-ions = b-ions - CO = b-ions - 28 S E Q U E N C E Mass/Charge (M/Z)
37 y-ions (suffix of C-terminal ions) E C N E U Q E S Mass/Charge (M/Z)
38 Intensity An Introduction to Bioinformatics Algorithms Mass/Charge (M/Z)
39 Intensity An Introduction to Bioinformatics Algorithms Mass/Charge (M/Z)
40 noise Mass/Charge (M/Z)
41 Intensity MS/MS Spectrum Mass/Charge (M/z)
42 Some Mass Differences between Peaks Correspond to Amino Acids u s e s e c e q n q u u e e e n n q c c e e s e
43 Some Mass Differences between Peaks Correspond to Amino Acids u s e s e c e q n q u u e e e n n q c c e e s e
44 Ion Types Some masses correspond to fragment ions, others are just random noise Knowing ion types Δ={δ 1, δ 2,, δ k } allows one to distinguish fragment ions from noise We can learn ion types δ i and their probabilities q i by analyzing a large test sample of annotated spectra.
45 Example of Ion Type Δ={δ 1, δ 2,, δ k } Ion types correspond to {b, b-nh 3, b-h 2 O, b-co} Δ={0, 17, 18, 28} *Note: In reality the δ value of ion type b is -1 but we will hide it for the sake of simplicity
46 Match between Spectra and the Shared Peak Count The match between two spectra is the number of masses (peaks) they share (Shared Peak Count or SPC) In practice mass-spectrometrists use the weighted SPC that reflects intensities of the peaks Match between experimental and theoretical spectra is defined similarly
47 Peptide Sequencing Problem Goal: Find a peptide with maximal match between an experimental and theoretical spectrum. Input: S: experimental spectrum Δ: set of possible ion types Output: A peptide whose theoretical spectrum matches the experimental spectrum the best
48 Shifting Peaks: a-ions = b-ions - CO = b-ions - 28 S E Q U E N C E Mass/Charge (M/Z)
49 Reverse Shifts Shift in H 2 O Shift in H 2 O+NH 3
50 Vertices of the Spectrum Graph Masses of potential N-terminal peptides Vertices are generated by reverse shifts corresponding to ion types Δ={δ 1, δ 2,, δ k } Every N-terminal peptide can generate up to k ions m-δ 1, m-δ 2,, m-δ k Every mass s in an MS/MS spectrum generates k vertices V(s) = {s+δ 1, s+δ 2,, s+δ k } corresponding to potential N-terminal peptides Vertices of the spectrum graph: {initial vertex} V(s 1 ) V(s 2 )... V(s m ) {terminal vertex}
51 Edges of the Spectrum Graph Two vertices with mass difference corresponding to an amino acid A: Connect with an edge labeled by A Gap edges corresponding to the mass of pairs of amino acids (optional)
52 Paths Paths in the labeled graph spell out amino acid sequences There are many paths, how to find the correct one? We need scoring to evaluate paths
53 Path Score p(p,s) = probability that peptide P produces spectrum S= {s 1,s 2, s q } p(p, s) = the probability that peptide P generates a peak s Scoring = computing probabilities p(p,s) = π sєs p(p, s)
54 Peak Score For a position t that represents ion type d j : p(p,s t ) = q j, if peak is generated at t 1-q j, otherwise
55 Peak Score (cont d) For a position t that is not associated with an ion type: p R (P,s t ) = q R, if peak is generated at t 1-q R, otherwise q R = the probability of a noisy peak that does not correspond to any ion type
56 Finding Optimal Paths in the Spectrum Graph For a given MS/MS spectrum S, find a peptide P maximizing p(p,s) over all possible peptides P: p(p',s) max P p(p,s) Peptides = paths in the spectrum graph P = the optimal path in the spectrum graph
57 Ions and Probabilities Tandem mass spectrometry is characterized by a set of ion types {δ 1,δ 2,..,δ k } and their probabilities {q 1,...,q k } δ i -ions of a partial peptide are produced independently with probabilities q i
58 Ions and Probabilities A peptide has all k peaks with probability k q i i 1 and no peaks with probability i k 1 (1 q i ) A peptide also produces a ``random noise'' with uniform probability q R in any position.
59 Ratio Test Scoring for Partial Peptides Incorporates premiums for observed ions and penalties for missing ions. Example: for k=4, assume that for a partial peptide P we only see ions δ 1,δ 2,δ 4. The score is calculated as: q R q q R (1 (1 q q q R ) ) q q R
60 Scoring Peptides T- set of all positions. T i ={t δ1,, t δ2,...,,t δk, }- set of positions that represent ions of partial peptides P i. A peak at position t δj probability q j. is generated with R=T- U T i - set of positions that are not associated with any partial peptides (noise).
61 Probabilistic Model For a position t δj T i the probability p(t, P,S) that peptide P produces a peak at position t. P( t, P, S) 1 q j q j if a peak is generatedat position t otherwise j Similarly, for t R, the probability that P produces a random noise peak at t is: P R ( t) 1 q R q R if a peak is generatedat position t otherwise
62 Probabilistic Score For a peptide P with n amino acids, the score for the whole peptides is expressed by the following ratio test: n i k j i R i R j j t p S P t p S p S P p 1 1 ) ( ),, ( ) ( ), (
63 S#: 1708 RT: AV: 1 NL: 5.27E6 T: + c d Full ms [ ] Relative Abundance m/z De Novo vs. Database Search Database Search De Novo Database of known peptides MDERHILNM, KLQWVCSDL, PTYWASDL, ENQIKRSACVM, TLACHGGEM, NGALPQWRT, HLLERTKMNVV, GGPASSDA, GGLITGMQSD, MQPLMNWE, ALKIIMNVRT, AVGELTK, HEWAILF, GHNLWAMNAC, GVFGSVLRA, EKLNKAATYIN.. A C L V G P W W E T L R T D K AVGELTK
64 De Novo vs. Database Search: A Paradox de novo algorithms are much faster, even though their search space is much larger! A database search scans all peptides to find the best one. De novo eliminates the need to scan all peptides by modeling the problem as a graph search. Why not sequence de novo?
65 Why Not Sequence De Novo? De novo sequencing is not very accurate: Algorithm Amino Acid Accuracy Less than 30% of the peptides sequenced were completely correct! Whole Peptide Accuracy Lutefisk, SHERENGA, Peaks, PepNovo,
66 Pros and Cons of de novo Sequencing Advantage: Gets the sequences that are not necessarily in the database. An additional similarity search step using these sequences may identify the related proteins in the database. Disadvantage: Requires higher quality spectra to be accurate.
67 Peptide Sequencing Problem Goal: Find a peptide with maximal match between an experimental and theoretical spectrum. Input: S: experimental spectrum Δ: set of possible ion types Output: A peptide whose theoretical spectrum matches the experimental S spectrum the best
68 Peptide Identification Problem Goal: Find a peptide from the database with maximal match between an experimental and theoretical spectrum. Input: S: experimental spectrum database of peptides Δ: set of possible ion types Output: A peptide from the database whose theoretical spectrum matches the experimental S spectrum the best
69 MS/MS Database Search Database search in mass-spectrometry has been successful in identification of already known proteins. Experimental spectrum can be compared with theoretical spectra of database peptides to find the best fit. SEQUEST (Yates et al., 1995) But reliable algorithms for identification of modified peptides is a much more difficult problem.
 These pathways may lead to other genes being switched on or off Mass spectrometry is key to probing")
70 The dynamic nature of the proteome The proteome of the cell is changing Various extra-cellular, and other signals activate various protein pathways. A key mechanism of protein activation is post-translational modification (PTM) These pathways may lead to other genes being switched on or off Mass spectrometry is key to probing the proteome and detecting PTMs
71 Post-Translational Modifications Proteins are involved in cellular signaling and metabolic regulation. They are subject to a large number of biological modifications. Most protein sequences are post-translationally modified and 600 types (!) of modifications of amino acid residues are known.


72 Examples of Post-Translational Modification Post-translational modifications increase the number of letters in amino acid alphabet and lead to a combinatorial explosion in both database search and de novo approaches.
73 Peptide Masses
74 Peptide Masses: Modification +16 on N
75 Reconstructing Modified Peptides Reconstruct peptide from the set of masses of fragment ions (mass-spectrum)
76 Reconstructing Modified Peptides Reconstruct peptide from the set of masses of fragment ions (mass-spectrum)
77 Peptide Identification Problem Revisited Goal: Find a peptide from the database with maximal match between an experimental and theoretical spectrum. Input: S: experimental spectrum database of peptides Δ: set of possible ion types Output: A peptide from the database whose theoretical spectrum matches the experimental S spectrum the best
78 Modified Peptide Identification Problem Goal: Find a modified peptide from the database with maximal match between an experimental and theoretical spectrum. Input: S: experimental spectrum database of peptides Δ: set of possible ion types Parameter k (# of mutations/modifications) Output: A peptide that is at most k mutations/modifications apart from a database peptide and whose theoretical spectrum matches the experimental S spectrum the best
79 Search for Modified Peptides: Virtual Database Approach Yates et al.,1995: an exhaustive search in a virtual database of all modified peptides. YFDSTDYNMAK Combinatorial explosion, even for a small set of modifications types. A larger set of spurious matches must be filtered out. It s much more likely that incorrect matches will have high scores. Problem. Extend the virtual database approach to a large set of modifications. Oxidation? Phosphorylation? 2 5 =32 possibilities, with 2 types of modifications!
80 Restrictive vs Unrestrictive (Blind) Search for Modified Peptides Restrictive search requires the researcher to guess which modification types are present in the sample How would you feel if you were allowed to perform only 10 out of 20x19=380 possible point mutations (with all other forbidden) while aligning two proteins? This is exactly what the restrictive PTM search algorithms do.
81 Restrictive vs Unrestrictive (Blind) Search for Modified Peptides Restrictive search requires the researcher to guess which modification types are present in the sample Blind search performs an unrestrictive search for all possible modification offsets at once.
82 Database Search: Sequence Analysis vs. MS/MS Analysis Sequence analysis: similar peptides (that a few mutations apart) have similar sequences MS/MS analysis: similar peptides (that a few mutations apart) have dissimilar spectra
83 Peptide Identification Problem: Challenge Very similar peptides may have very different spectra! Goal: Define a notion of spectral similarity that correlates well with the sequence similarity. If peptides are a few mutations/modifications apart, the spectral similarity between their spectra should be high.
84 Deficiency of the Shared Peaks Count Shared peaks count (SPC): intuitive measure of spectral similarity. Problem: SPC diminishes very quickly as the number of mutations increases. Only a small portion of correlations between the spectra of mutated peptides is captured by SPC.
 = {98, 133, 155, 256, 296, 385, 425, 526, 548, 583} no mutations SPC=10 1 mutation SPC=5 2 mutations SPC=2")
85 SPC Diminishes Quickly S(PRTEIN) = {98, 133, 246, 254, 355, 375, 476, 484, 597, 632} S(PRTEYN) = {98, 133, 254, 296, 355, 425, 484, 526, 647, 682} S(PGTEYN) = {98, 133, 155, 256, 296, 385, 425, 526, 548, 583} no mutations SPC=10 1 mutation SPC=5 2 mutations SPC=2
86 Spectral Convolution S2 Number of S1 {s2 pairs s1 ( S 2 s1:s1 S1,s2 S2 } S1, s2 S2with s2 S )( x) 1 s 1 x : The shared peaks count ( S S )(0) 2 1 (SPC peak):

87 Elements of S 2 S 1 represented as elements of a difference matrix. The elements with multiplicity >2 are colored; the elements with multiplicity =2 are circled. The SPC takes into account only the red entries

88 Spectral Convolution: An Example x
89 Spectral Comparison: Difficult Case S = {10, 20, 30, 40, 50, 60, 70, 80, 90, 100} Which of the spectra S = {10, 20, 30, 40, 50, 55, 65, 75,85, 95} or S = {10, 15, 30, 35, 50, 55, 70, 75, 90, 95} fits the spectrum S the best? SPC: both S and S have 5 peaks in common with S. Spectral Convolution: reveals the peaks at 0 and 5.

90 Spectral Comparison: Difficult Case S S S S
91 Limitations of the Spectrum Convolutions Spectral convolution does not reveal that spectra S and S are similar, while spectra S and S are not. Clumps of shared peaks: the matching positions in S come in clumps while the matching positions in S don't. This important property was not captured by spectral convolution.
92 Sequence Alignment=Path in a Grid Finding similarities between two peptides A R N G A L R A 1 1 R 1 1 N 1 G 1 Z A 1 1 L 1 R 1 1 is equivalent to finding an optimal path in a Manhattan-like grid (sequence alignment).
93 Sequence Alignment=Path in a Grid Finding similarities between two peptides A R N G A L R A 1 1 R 1 1 N 1 G 1 Z A 1 1 L 1 R 1 1 is equivalent to finding an optimal path in a Manhattan-like grid (sequence alignment). Every horizontal/vertical segment in this path corresponds to insertion/deletion of an amino acid.
94 Sequence Alignment=Path in a Grid A R N G A L R A 1 1 R 1 1 N 1 G 1 Z A 1 1 L 1 R 1 1 Finding similarities between two peptides is equivalent to finding an optimal path in a Manhattan-like grid (sequence alignment). Every horizontal/vertical segment in this path corresponds to insertion/deletion of an amino acid. Can we find similarities between a spectrum and a peptide using a similar approach (spectral alignment)?

95 Converting Spectra into 0-1 Sequences Convert spectrum into a 0-1 string with 1s corresponding to the positions of the peaks.
96 Modified peptide Modifications are modeled as insertion (or deletions) of blocks of zeroes Spectrum Peptide A modification with positive offset - inserting a block of 0s A modification with negative offset - deleting a block of 0s
97 Spectra Comparison vs. String Comparison Comparison of theoretical and experimental spectra (represented as 0-1 strings) corresponds to a (somewhat unusual) edit distance/alignment between 0-1 strings where elementary edit operations are insertions and deletions of blocks of 0s Use sequence alignment algorithms!
98 Spectral Alignment Graph A B C D E Horizontal axis: Experimental spectrum Vertical axis: Theoretical spectrum of a peptide
99 Spectral Alignment Graph A B C D E Like in alignment algorithms, every path in the spectral alignment graph represents a possible interpretation of a spectra. A path covering maximal number of 1s is the best interpretation of the spectrum. Vertical / horizontal segment in the optimal path are modifications
100 Spectral Alignment vs. Sequence Alignment Alignment graph with different alphabet and scoring. Movement can be diagonal (matching masses) or horizontal/vertical (insertions/deletions corresponding to PTMs). At most k horizontal/vertical moves.
101 Shifts A = {a 1 < < a n } : an ordered set of natural numbers. A shift (i, ) is characterized by two parameters, the position (i) and the length ( ). The shift (i, ) transforms into {a 1,., a n } {a 1,.,a i-1,a i +,,a n + }
102 Shifts: An Example The shift (i, ) transforms {a 1,., a n } into {a 1,.,a i-1,a i +,,a n + } e.g shift (4, -5) shift (7,-3)
103 Spectral Alignment Problem Find a series of k shifts that make the sets A={a 1,., a n } and B={b 1,.,b n } as similar as possible. k-similarity between sets D(k) - the maximum number of elements in common between sets after k shifts.
104 Comparing Spectra=Comparing 0-1 Strings A modification with positive offset corresponds to inserting a block of 0s A modification with negative offset corresponds to deleting a block of 0s Comparison of theoretical and experimental spectra (represented as 0-1 strings) corresponds to a (somewhat unusual) edit distance/alignment problem where elementary edit operations are insertions/deletions of blocks of 0s Use sequence alignment algorithms!
105 Spectral Product A={a 1,., a n } and B={b 1,., b n } Spectral product A B: two-dimensional matrix with nm 1s corresponding to all pairs of indices (a i,b j ) and remaining elements being 0s SPC: the number of 1s at the main diagonal. -shifted SPC: the number of 1s on the diagonal (i,i+ )
106 Spectral Alignment: k-similarity k-similarity between spectra: the maximum number of 1s on a path through this graph that uses at most k+1 diagonals. k-optimal spectral alignment = a path. The spectral alignment allows one to detect more and more subtle similarities between spectra by increasing k.
107 Use of k-similarity SPC reveals only D(0)=3 matching peaks. Spectral Alignment reveals more hidden similarities between spectra: D(1)=5 and D(2)=8 and detects corresponding mutations.
 represents the path for")
108 Black line represent the path for k=0 Red lines represent the path for k=1 Blue lines (right) represents the path for k=2
109 Spectral Convolution Limitation The spectral convolution considers diagonals separately without combining them into feasible mutation scenarios D(1) =10 shift function score = 10 D(1) =6
110 Dynamic Programming for Spectral Alignment D ij (k): the maximum number of 1s on a path to (a i,b j ) that uses at most k+1 diagonals. D ij ( k) max ( i', j') ( i, j) { D i' j' D i' j' ( k) 1, if ( i', D( k) max D ( k) j') ~ ( i, j) ( k 1) 1, otherwise ij ij (i,j ) ~ (i,j): the points are located on the same diagonal Running time: O(n 4 k)
")
111 Edit Graph for Fast Spectral Alignment diag(i,j) the position of previous 1 on the same diagonal as (i,j)
112 Fast Spectral Alignment Algorithm Running time: O(n 2 k) M D M ij ij ij ( k) max Di ' j' ( k) ( k) ( i', j') max max ( i, j) D M M M diag( i, j) i 1, j D ij i 1, j i, j 1 ( k) 1 ( k) ( k ( k) ( k) ( k) 1 1) 1
113 Spectral Alignment: Complications Spectra are combinations of an increasing (Nterminal ions) and a decreasing (C-terminal ions) number series. These series form two diagonals in the spectral product, the main diagonal and the perpendicular diagonal. The described algorithm deals with the main diagonal only.
114 Spectral Alignment: Complications Simultaneous analysis of N- and C-terminal ions Taking into account the intensities and charges Analysis of minor ions

115 MS/MS and East-West Traveling Salesman Problem
116 Anti-symmetric paths De-novo problem Input: Output: Spectrum graph Anti-symmetric longest path E D T E S S S S E T D E E Anti-symmetric path problem (Tim Chen, SODA 2001) avoids reusing the same peak twice (as both b- and y-ions) in the optimal path Without anti-symmetric condition, the correct peptide SETDE would be missed and the algorithm would output a symmetric peptide: Why? ESESE
117 PTM Frequency Matrix A C D E F G H I K L M N P Q R S T V W Y ## ## ## ## ## ## ,000 spectra (IKKb sample) were searched in blind mode, and identifications with p-value <0.05 were retained Shading of the cell (x,y) reflects the number of annotations with modification: (offset x, amino acid y)
118 PTM Frequency Matrix 14 on K - Methylation 16 on M - Oxidation A C D E F G H I K L M N P Q R S T V W Y ## ## ## ## ## ## on W - Oxidation 22 - Sodium 28 on K - Dimethylation 32 on M - Double oxidation
119 Filtration in Similarity Searches Sequence Alignment: Smith-Waterman BLAST Algorithm Protein Query Sequence matches Filtration Scoring Database actgcgctagctacggatagctgatcc agatcgatgccataggtagctgatcc atgctagcttagacataaagcttgaat cgatcgggtaacccatagctagctcg atcgacttagacttcgattcgatcgaat tcgatctgatctgaatatattaggtccg atgctagctgtggtagtgatgtaaga BLAST filters out very few correct matches and is almost as accurate as Smith Waterman algorithm.
120 Filtration and MS/MS Peptide Sequencing SEQUEST / Mascot MS/MS spectrum Sequence matches Filtration Scoring Database MDERHILNMKLQWVCSDLPT YWASDLENQIKRSACVMTLA CHGGEMNGALPQWRTHLLE RTYKMNVVGGPASSDALITG MQSDPILLVCATRGHEWAILF GHNLWACVNMLETAIKLEGVF GSVLRAEKLNKAAPETYIN..
121 Filtration in MS/MS Sequencing Filtration in MS/MS is more difficult than in BLAST. Early approaches using Peptide Sequence Tags were not able to substitute the complete database search. Can we design a filtration based search that can replace the database search, and is orders of magnitude faster?
122 Asking the Old Question Again: Why Not Sequence De Novo? De novo sequencing is still not very accurate! Algorithm Amino Acid Accuracy Whole Peptide Accuracy Lutefisk (Taylor and Johnson, 1997) SHERENGA (Dancik et. al., 1999) Peaks (Ma et al., 2003) PepNovo (Frank and Pevzner, 2005)
123 So What Can be Done with De Novo? Given an MS/MS spectrum: Can de novo predict the entire peptide sequence? (accuracy is less than 30%). - No! Can de novo predict partial sequences? (accuracy is 50% for GutenTag and 80% for PepNovo ) - No! Can de novo predict a set of partial sequences, that with high probability, contains at least one correct tag? A Covering Set of Tags - Yes!
124 Peptide Sequence Tags A Peptide Sequence Tag is short substring of a peptide. Example: Tags: G V D L K G V D V D L D L K
125 Filtration with Peptide Sequence Tags Peptide sequence tags can be used as filters in database searches. The Filtration: Consider only database peptides that contain the tag (in its correct relative mass location). First suggested by Mann and Wilm (1994). Similar concepts also used by: GutenTag - Tabb et. al MultiTag - Sunayev et. al OpenSea - Searle et. al
126 Why Filter Database Candidates? Filtration makes genomic database searches practical (BLAST). Effective filtration can greatly speed-up the process, enabling expensive searches involving post-translational modifications. Goal: generate a small set of covering tags and use them to filter the database peptides.
127 Tag Generation - Global Tags A C L V W G P W E T L T D R K AVGELTK TAG Prefix Mass AVG 0.0 VGE 71.0 GEL ELT LTK Parse tags from de novo reconstruction. Only a small number of tags can be generated. If the de novo sequence is completely incorrect, none of the tags will be correct.

128 Tag Generation - Local Tags W R TAG Prefix Mass A C L V P W G E T L D T K AVG 0.0 WTD PET Extract the highest scoring subspaths from the spectrum graph. Sometimes gets misled by locally promising-looking garden paths.
129 Ranking Tags Each additional tag used to filter increases the number of database hits and slows down the database search. Tags can be ranked according to their scores, however this ranking is not very accurate. It is better to determine for each tag the probability that it is correct, and choose most probable tags.
130 Reliability of Amino Acids in Tags For each amino acid in a tag we want to assign a probability that it is correct. Each amino acid, which corresponds to an edge in the spectrum graph, is mapped to a feature space that consists of the features that correlate with reliability of amino acid prediction, e.g. score reduction due to edge removal
131 Score Reduction Due to Edge Removal The removal of an edge corresponding to a genuine amino acid usually leads to a reduction in the score of the de novo path. However, the removal of an edge that does not correspond to a genuine amino acid tends to leave the score unchanged. W R A C V G K D W L P T L T W R A C V G K D W L P T L T W R A C V G K D W L P T L T E W W R A C V G K D L P T L T
132 Probabilities of Tags How do we determine the probability of a predicted tag? We use the predicted probabilities of its amino acids and follow the concept: a chain is only as strong as its weakest link
133 Experimental Results Length 3 Length 4 Length 5 Algorithm \ #tags GlobalTag LocalTag GutenTag
134 Tag-based Database Search Candidate Peptides (700) Db 55M peptides Tag filter Tag extension Score Significance De novo
135 Matching Multiple Tags Matching of a sequence tag against a database is fast Even matching many tags against a database is fast k tags can be matched against a database in time proportional to database size, but independent of the number of tags. keyword trees (Aho-Corasick algorithm) Scan time can be amortized by combining scans for many spectra all at once. build one keyword tree from multiple spectra
136 Keyword Trees Y F A K N S F YFAK YFNS FNTA N T A..Y F R A Y F N T A..
137 Tag Extension Candidate Peptides (700) Db 55M peptides Filter Extension Score Significance De novo
138 Fast Extension Given: tag with prefix and suffix masses <m P > xyz <m S > match in the database <m P >xyz<m S > xyz Compute if a suffix and prefix match with allowable modifications. Compute a candidate peptide with most likely positions of modifications (attachment points).
139 Scoring Modified Peptides Db 55M peptides Filter Extension Score Significance De novo
140 Scoring Input: Candidate peptide with attached modifications Spectrum Output: Score function that normalizes for length, as variable modifications can change peptide length.
141 Assessing Reliability of Identifications Db 55M peptides Filter extension Score Significance De novo
142 Selecting Features for Separating Correct and Incorrect Predictions Features: Score S: as computed Explained Intensity I: fraction of total intensity explained by annotated peaks. b-y score B: fraction of b+y ions annotated Explained peaks P: fraction of top 25 peaks annotated. Each of I,S,B,P features is normalized (subtract mean and divide by s.d.) Problem: separate correct and incorrect identifications using I,S,B,P
143 Separating power of features

144 Separating power of features Quality scores: Q = w I I + w S S + w B B + w P P The weights are chosen to minimize the mis-classification error

145 Distribution of Quality Scores
146 Results on ISB data-set All ISB spectra were searched. The top match is valid for 2978 spectra (2765 for Sequest) InsPecT-Sequest: 644 spectra (I-S dataset) Sequest-InsPecT: 422 spectra (S-I dataset) Average explained intensity of I-S = 52% Average explained intensity of S-I = 28% Average explained intensity I S = 58% ~70 Met. Oxidations Run time is 0.7 secs. per spectrum (2.7 secs. for Sequest)
147 Filtration Results PTMs Tag Length # Tags Filtration InsPecT Runtime SEQUEST Runtime None sec > 1 minute sec Phosphory sec > 2 minutes lation sec The search was done against SWISS-PROT (54Mb). With 10 tags of length 3: The filtration is 1500 more efficient. Less than 4% of spectra are filtered out. The search time per spectrum is reduced by two orders of magnitude as compared to SEQUEST.
148 SPIDER: Yet Another Application of de novo Sequencing Suppose you have a good MS/MS spectrum of an elephant peptide Suppose you even have a good de novo reconstruction of this spectra However, until elephant genome is sequenced, it is hard to verify this de novo reconstruction Can you search de novo reconstruction of a peptide from elephant against human protein database? SPIDER algorithm addresses this comparative proteomics problem Slides from Bin Ma, University of Western Ontario

149 Common de novo sequencing errors N and GG have the same mass GG
150 From de novo Reconstruction to Database Candidate through Real Sequence Given a sequence with errors, search for the similar sequences in a DB. (Seq) X: LSCFAV (Real) Y: SLCFAV (Match) Z: SLCF-V sequencing error Homology mutations (Seq) X: LSCF-AV (Real) Y: EACF-AV (Match) Z: DACFKAV mass(ls)=mass(ea)
151 Alignment between de novo Candidate and Database Candidate (Seq) X: LSCF-AV (Real) Y: EACF-AV (Match) Z: DACFKAV If real sequence Y is known then: d(x,z) = seqerror(x,y) + editdist(y,z)
152 Alignment between de novo Candidate and Database Candidate (Seq) X: LSCF-AV (Real) Y: EACF-AV (Match) Z: DACFKAV If real sequence Y is known then: d(x,z) = seqerror(x,y) + editdist(y,z) If real sequence Y is unknown then the distance between de novo candidate X and database candidate Z: d(x,z) = min Y ( seqerror(x,y) + editdist(y,z) )
153 Alignment between de novo Candidate and Database Candidate (Seq) X: LSCF-AV (Real) Y: EACF-AV (Match) Z: DACFKAV If real sequence Y is known then: d(x,z) = seqerror(x,y) + editdist(y,z) If real sequence Y is unknown then the distance between de novo candidate X and database candidate Z: d(x,z) = min Y ( seqerror(x,y) + editdist(y,z) ) Problem: search a database for Z that minimizes d(x,z) The core problem is to compute d(x,z) for given X and Z.
154 Computing seqerror(x,y) Align X and Y (according to mass). (Seq) X: LSCFAV (Real) Y: EACFAV A segment of X can be aligned to a segment of Y only if their mass is the same! For each erroneous mass block (X i,y i ), the cost is f(x i,y i )=f(mass(x i )). f(m) depends on how often de novo sequencing makes errors on a segment with mass m. seqerror(x,y) is the sum of all f(mass(x i )). X Y Z seqerror editdist
155 Computing d(x,z) (Seq) X: LSCF-AV (Real) Y: EACF-AV (Match) Z: DACFKAV Dynamic Programming: Let D[i,j]=d(X[1..i], Z[1..j]) We examine the last block of the alignment of X[1..i] and Z[1..j].
![Dynamic Programming: Four Cases D[i,j]=D[i,j-1]+indel D[i,j]=D[i-1,j]+indel Cases A, B, C - no de novo sequencing errors Case D: de](/docs-images/82/86839460/images/156-0.jpg "novo sequencing error D[i,j]=D[i-1,j-1]+dist(X[i],Z[j]) D[i,j]=D[i -1,j -1]+alpha(X[i..i],Z[j..j]) D[i,j] is the minimum of the four cases.")
156 Dynamic Programming: Four Cases D[i,j]=D[i,j-1]+indel D[i,j]=D[i-1,j]+indel Cases A, B, C - no de novo sequencing errors Case D: de novo sequencing error D[i,j]=D[i-1,j-1]+dist(X[i],Z[j]) D[i,j]=D[i -1,j -1]+alpha(X[i..i],Z[j..j]) D[i,j] is the minimum of the four cases.
157 Computing alpha(.,.) alpha(x[i..i],z[j..j]) = min m(y)=m(x[i..i]) [seqerror (X[i..i],y)+editDist(y,Z[j..j])] = min m(y)=m[i..i] [f(m[i..i])+editdist(y,z[j..j])]. = f(m[i..i]) + min m(y)=m[i..i] editdist(y,z[j..j]). This is like to align a mass with a string. Mass-alignment Problem: Given a mass m and a peptide P, find a peptide of mass m that is most similar to P (among all possible peptides)
![Solving Mass-Alignment Problem ]) [, ( 1)])..( [ ), ( ( min 1)])..( [, ( ]).](/docs-images/82/86839460/images/158-0.jpg ". [ ), ( ( min min ]).")
158 Solving Mass-Alignment Problem ]) [, ( 1)])..( [ ), ( ( min 1)])..( [, ( ]).. [ ), ( ( min min ]).. [, ( j Z y dist j i Z y m m indel j i Z m indel j i Z y m m j i Z m y y
159 Improving the Efficiency Homology Match mode: Assumes tagging (only peptides that share a tag of length 3 with de novo reconstruction are considered) and extension of found hits by dynamic programming around the hits. Non-gapped homology match mode: Sequencing error and homology mutations do not overlap. Segment Match mode: No homology mutations. Exact Match mode: No sequencing errors and homology mutations.

160 Experiment Result The correct peptide sequence for each spectrum is known. The proteins are all in Swissprot but not in Human database. SPIDER searches 144 spectra against both Swissprot and human databases
161 Example Using de novo reconstruction X=CCQWDAEACAFNNPGK, the homolog Z was found in human database. At the same time, the correct sequence Y, was found in SwissProt database. sequencing errors Seq(X): CCQ[W ]DAEAC[AF]<NN><PG>K Real(Y): CCK AD DAEAC FA VE GP K Database(Z): CCK[AD]DKETC[FA]<EE><GK>K homology mutations
Protein Sequencing and Identification by Mass Spectrometry
 Protein Sequencing and Identification by Mass Spectrometry Tandem Mass Spectrometry De Novo Peptide Sequencing Spectrum Graph Protein Identification via Database Search Identifying Post Translationally
Protein Sequencing and Identification by Mass Spectrometry
 Protein Sequencing and Identification by Mass Spectrometry Tandem Mass Spectrometry De Novo Peptide Sequencing Spectrum Graph Protein Identification via Database Search Identifying Post Translationally
Mass spectrometry in proteomics
 I519 Introduction to Bioinformatics, Fall, 2013 Mass spectrometry in proteomics Haixu Tang School of Informatics and Computing Indiana University, Bloomington Modified from: www.bioalgorithms.info Outline
Tandem Mass Spectrometry: Generating function, alignment and assembly
 Tandem Mass Spectrometry: Generating function, alignment and assembly With slides from Sangtae Kim and from Jones & Pevzner 2004 Determining reliability of identifications Can we use Target/Decoy to estimate
Lecture 15: Realities of Genome Assembly Protein Sequencing
 Lecture 15: Realities of Genome Assembly Protein Sequencing Study Chapter 8.10-8.15 1 Euler s Theorems A graph is balanced if for every vertex the number of incoming edges equals to the number of outgoing
Was T. rex Just a Big Chicken? Computational Proteomics
 Was T. rex Just a Big Chicken? Computational Proteomics Phillip Compeau and Pavel Pevzner adjusted by Jovana Kovačević Bioinformatics Algorithms: an Active Learning Approach 215 by Compeau and Pevzner.
Introduction to spectral alignment
 SI Appendix C. Introduction to spectral alignment Due to the complexity of the anti-symmetric spectral alignment algorithm described in Appendix A, this appendix provides an extended introduction to the
Efficiency of Database Search for Identification of Mutated and Modified Proteins via Mass Spectrometry
 Methods Efficiency of Database Search for Identification of Mutated and Modified Proteins via Mass Spectrometry Pavel A. Pevzner, 1,3 Zufar Mulyukov, 1 Vlado Dancik, 2 and Chris L Tang 2 Department of
De Novo Peptide Sequencing
 De Novo Peptide Sequencing Outline A simple de novo sequencing algorithm PTM Other ion types Mass segment error De Novo Peptide Sequencing b 1 b 2 b 3 b 4 b 5 b 6 b 7 b 8 A NELLLNVK AN ELLLNVK ANE LLLNVK
Peptide Sequence Tags for Fast Database Search in Mass-Spectrometry
 Peptide Sequence Tags for Fast Database Search in Mass-Spectrometry Ari Frank,*, Stephen Tanner, Vineet Bafna, and Pavel Pevzner Department of Computer Science & Engineering, University of California,
Computational Methods for Mass Spectrometry Proteomics
 Computational Methods for Mass Spectrometry Proteomics Eidhammer, Ingvar ISBN-13: 9780470512975 Table of Contents Preface. Acknowledgements. 1 Protein, Proteome, and Proteomics. 1.1 Primary goals for studying
Algorithms in Bioinformatics FOUR Pairwise Sequence Alignment. Pairwise Sequence Alignment. Convention: DNA Sequences 5. Sequence Alignment
 Algorithms in Bioinformatics FOUR Sami Khuri Department of Computer Science San José State University Pairwise Sequence Alignment Homology Similarity Global string alignment Local string alignment Dot
De Novo Peptide Sequencing: Informatics and Pattern Recognition applied to Proteomics
 De Novo Peptide Sequencing: Informatics and Pattern Recognition applied to Proteomics John R. Rose Computer Science and Engineering University of South Carolina 1 Overview Background Information Theoretic
via Tandem Mass Spectrometry and Propositional Satisfiability De Novo Peptide Sequencing Renato Bruni University of Perugia
 De Novo Peptide Sequencing via Tandem Mass Spectrometry and Propositional Satisfiability Renato Bruni bruni@diei.unipg.it or bruni@dis.uniroma1.it University of Perugia I FIMA International Conference
MS-MS Analysis Programs
 MS-MS Analysis Programs Basic Process Genome - Gives AA sequences of proteins Use this to predict spectra Compare data to prediction Determine degree of correctness Make assignment Did we see the protein?
CSE182-L8. Mass Spectrometry
 CSE182-L8 Mass Spectrometry Project Notes Implement a few tools for proteomics C1:11/2/04 Answer MS questions to get started, select project partner, select a project. C2:11/15/04 (All but web-team) Plan
Mass spectrometry has been used a lot in biology since the late 1950 s. However it really came into play in the late 1980 s once methods were
 Mass spectrometry has been used a lot in biology since the late 1950 s. However it really came into play in the late 1980 s once methods were developed to allow the analysis of large intact (bigger than
Effective Strategies for Improving Peptide Identification with Tandem Mass Spectrometry
 Effective Strategies for Improving Peptide Identification with Tandem Mass Spectrometry by Xi Han A thesis presented to the University of Waterloo in fulfillment of the thesis requirement for the degree
Supplementary Material for: Clustering Millions of Tandem Mass Spectra
 Supplementary Material for: Clustering Millions of Tandem Mass Spectra Ari M. Frank 1 Nuno Bandeira 1 Zhouxin Shen 2 Stephen Tanner 3 Steven P. Briggs 2 Richard D. Smith 4 Pavel A. Pevzner 1 October 4,
Protein Identification Using Tandem Mass Spectrometry. Nathan Edwards Informatics Research Applied Biosystems
 Protein Identification Using Tandem Mass Spectrometry Nathan Edwards Informatics Research Applied Biosystems Outline Proteomics context Tandem mass spectrometry Peptide fragmentation Peptide identification
De novo Protein Sequencing by Combining Top-Down and Bottom-Up Tandem Mass Spectra. Xiaowen Liu
 De novo Protein Sequencing by Combining Top-Down and Bottom-Up Tandem Mass Spectra Xiaowen Liu Department of BioHealth Informatics, Department of Computer and Information Sciences, Indiana University-Purdue
DE NOVO PEPTIDE SEQUENCING FOR MASS SPECTRA BASED ON MULTI-CHARGE STRONG TAGS
 DE NOVO PEPTIDE SEQUENCING FO MASS SPECTA BASED ON MULTI-CHAGE STONG TAGS KANG NING, KET FAH CHONG, HON WAI LEONG Department of Computer Science, National University of Singapore, 3 Science Drive 2, Singapore
CISC 889 Bioinformatics (Spring 2004) Sequence pairwise alignment (I)
 Sequence pairwise alignment (I)") CISC 889 Bioinformatics (Spring 2004) Sequence pairwise alignment (I) Contents Alignment algorithms Needleman-Wunsch (global alignment) Smith-Waterman (local alignment) Heuristic algorithms FASTA BLAST
CISC 889 Bioinformatics (Spring 2004) Sequence pairwise alignment (I) Contents Alignment algorithms Needleman-Wunsch (global alignment) Smith-Waterman (local alignment) Heuristic algorithms FASTA BLAST
Identification of Post-translational Modifications via Blind Search of Mass-Spectra
 Identification of Post-translational Modifications via Blind Search of Mass-Spectra Dekel Tsur Computer Science and Engineering UC San Diego dtsur@cs.ucsd.edu Vineet Bafna Computer Science and Engineering
Mass Spectrometry and Proteomics - Lecture 5 - Matthias Trost Newcastle University
 Mass Spectrometry and Proteomics - Lecture 5 - Matthias Trost Newcastle University matthias.trost@ncl.ac.uk Previously Proteomics Sample prep 144 Lecture 5 Quantitation techniques Search Algorithms Proteomics
CMPS 6630: Introduction to Computational Biology and Bioinformatics. Structure Comparison
 CMPS 6630: Introduction to Computational Biology and Bioinformatics Structure Comparison Protein Structure Comparison Motivation Understand sequence and structure variability Understand Domain architecture
Workflow concept. Data goes through the workflow. A Node contains an operation An edge represents data flow The results are brought together in tables
 PROTEOME DISCOVERER Workflow concept Data goes through the workflow Spectra Peptides Quantitation A Node contains an operation An edge represents data flow The results are brought together in tables Protein
Proteomics. November 13, 2007
 Proteomics November 13, 2007 Acknowledgement Slides presented here have been borrowed from presentations by : Dr. Mark A. Knepper (LKEM, NHLBI, NIH) Dr. Nathan Edwards (Center for Bioinformatics and Computational
Bioinformatics (GLOBEX, Summer 2015) Pairwise sequence alignment
 Pairwise sequence alignment") Bioinformatics (GLOBEX, Summer 2015) Pairwise sequence alignment Substitution score matrices, PAM, BLOSUM Needleman-Wunsch algorithm (Global) Smith-Waterman algorithm (Local) BLAST (local, heuristic) E-value
Bioinformatics (GLOBEX, Summer 2015) Pairwise sequence alignment Substitution score matrices, PAM, BLOSUM Needleman-Wunsch algorithm (Global) Smith-Waterman algorithm (Local) BLAST (local, heuristic) E-value
SPECTRA LIBRARY ASSISTED DE NOVO PEPTIDE SEQUENCING FOR HCD AND ETD SPECTRA PAIRS
 SPECTRA LIBRARY ASSISTED DE NOVO PEPTIDE SEQUENCING FOR HCD AND ETD SPECTRA PAIRS 1 Yan Yan Department of Computer Science University of Western Ontario, Canada OUTLINE Background Tandem mass spectrometry
Sequence analysis and Genomics
 Sequence analysis and Genomics October 12 th November 23 rd 2 PM 5 PM Prof. Peter Stadler Dr. Katja Nowick Katja: group leader TFome and Transcriptome Evolution Bioinformatics group Paul-Flechsig-Institute
Molecular Modeling Lecture 7. Homology modeling insertions/deletions manual realignment
 Molecular Modeling 2018-- Lecture 7 Homology modeling insertions/deletions manual realignment Homology modeling also called comparative modeling Sequences that have similar sequence have similar structure.
A New Hybrid De Novo Sequencing Method For Protein Identification
 A New Hybrid De Novo Sequencing Method For Protein Identification Penghao Wang 1*, Albert Zomaya 2, Susan Wilson 1,3 1. Prince of Wales Clinical School, University of New South Wales, Kensington NSW 2052,
On Optimizing the Non-metric Similarity Search in Tandem Mass Spectra by Clustering
 On Optimizing the Non-metric Similarity Search in Tandem Mass Spectra by Clustering Jiří Novák, David Hoksza, Jakub Lokoč, and Tomáš Skopal Siret Research Group, Faculty of Mathematics and Physics, Charles
Nature Methods: doi: /nmeth Supplementary Figure 1. Fragment indexing allows efficient spectra similarity comparisons.
 Supplementary Figure 1 Fragment indexing allows efficient spectra similarity comparisons. The cost and efficiency of spectra similarity calculations can be approximated by the number of fragment comparisons
QuasiNovo: Algorithms for De Novo Peptide Sequencing
 University of South Carolina Scholar Commons Theses and Dissertations 2013 QuasiNovo: Algorithms for De Novo Peptide Sequencing James Paul Cleveland University of South Carolina Follow this and additional
Sara C. Madeira. Universidade da Beira Interior. (Thanks to Ana Teresa Freitas, IST for useful resources on this subject)
") Bioinformática Sequence Alignment Pairwise Sequence Alignment Universidade da Beira Interior (Thanks to Ana Teresa Freitas, IST for useful resources on this subject) 1 16/3/29 & 23/3/29 27/4/29 Outline
Bioinformática Sequence Alignment Pairwise Sequence Alignment Universidade da Beira Interior (Thanks to Ana Teresa Freitas, IST for useful resources on this subject) 1 16/3/29 & 23/3/29 27/4/29 Outline
An Introduction to Bioinformatics Algorithms Hidden Markov Models
 Hidden Markov Models Outline 1. CG-Islands 2. The Fair Bet Casino 3. Hidden Markov Model 4. Decoding Algorithm 5. Forward-Backward Algorithm 6. Profile HMMs 7. HMM Parameter Estimation 8. Viterbi Training
Mass Spectrometry Based De Novo Peptide Sequencing Error Correction
 Mass Spectrometry Based De Novo Peptide Sequencing Error Correction by Chenyu Yao A thesis presented to the University of Waterloo in fulfillment of the thesis requirement for the degree of Master of Mathematics
Pairwise & Multiple sequence alignments
 Pairwise & Multiple sequence alignments Urmila Kulkarni-Kale Bioinformatics Centre 411 007 urmila@bioinfo.ernet.in Basis for Sequence comparison Theory of evolution: gene sequences have evolved/derived
De Novo Peptide Identification Via Mixed-Integer Linear Optimization And Tandem Mass Spectrometry
 17 th European Symposium on Computer Aided Process Engineering ESCAPE17 V. Plesu and P.S. Agachi (Editors) 2007 Elsevier B.V. All rights reserved. 1 De Novo Peptide Identification Via Mixed-Integer Linear
Lecture 5,6 Local sequence alignment
 Lecture 5,6 Local sequence alignment Chapter 6 in Jones and Pevzner Fall 2018 September 4,6, 2018 Evolution as a tool for biological insight Nothing in biology makes sense except in the light of evolution
Tutorial 1: Setting up your Skyline document
 Tutorial 1: Setting up your Skyline document Caution! For using Skyline the number formats of your computer have to be set to English (United States). Open the Control Panel Clock, Language, and Region
MACFP: Maximal Approximate Consecutive Frequent Pattern Mining under Edit Distance
 MACFP: Maximal Approximate Consecutive Frequent Pattern Mining under Edit Distance Jingbo Shang, Jian Peng, Jiawei Han University of Illinois, Urbana-Champaign May 6, 2016 Presented by Jingbo Shang 2 Outline
Homology Modeling. Roberto Lins EPFL - summer semester 2005
 Homology Modeling Roberto Lins EPFL - summer semester 2005 Disclaimer: course material is mainly taken from: P.E. Bourne & H Weissig, Structural Bioinformatics; C.A. Orengo, D.T. Jones & J.M. Thornton,
Computational Methods For Identification Of Cyclic Peptides Using Mass Spectrometry. Julio Ng Bioinformatics Program, UCSD March, 26 th 2010
 Computational Methods or Identification Of Cyclic Peptides Using Mass Spectrometry Julio Ng Bioinformatics Program, UCSD March, 26 th 2010 Outline Importance of natural products Mass spectrometry on cyclic
BIOINFORMATICS: An Introduction
 BIOINFORMATICS: An Introduction What is Bioinformatics? The term was first coined in 1988 by Dr. Hwa Lim The original definition was : a collective term for data compilation, organisation, analysis and
Modeling Mass Spectrometry-Based Protein Analysis
 Chapter 8 Jan Eriksson and David Fenyö Abstract The success of mass spectrometry based proteomics depends on efficient methods for data analysis. These methods require a detailed understanding of the information
Background: Comment [1]: Comment [2]: Comment [3]: Comment [4]: mass spectrometry
![Background: Comment [1]: Comment [2]: Comment [3]: Comment [4]: mass spectrometry](/thumbs/78/77840982.jpg "Background: Comment [1]: Comment [2]: Comment [3]: Comment [4]: mass spectrometry") Background: Imagine it is time for your lunch break, you take your sandwich outside and you sit down to enjoy your lunch with a beautiful view of Montana s Rocky Mountains. As you look up, you see what
Background: Imagine it is time for your lunch break, you take your sandwich outside and you sit down to enjoy your lunch with a beautiful view of Montana s Rocky Mountains. As you look up, you see what
Algorithms in Bioinformatics
 Algorithms in Bioinformatics Sami Khuri Department of omputer Science San José State University San José, alifornia, USA khuri@cs.sjsu.edu www.cs.sjsu.edu/faculty/khuri Pairwise Sequence Alignment Homology
Module: Sequence Alignment Theory and Applications Session: Introduction to Searching and Sequence Alignment
 Module: Sequence Alignment Theory and Applications Session: Introduction to Searching and Sequence Alignment Introduction to Bioinformatics online course : IBT Jonathan Kayondo Learning Objectives Understand
3. SEQUENCE ANALYSIS BIOINFORMATICS COURSE MTAT
 3. SEQUENCE ANALYSIS BIOINFORMATICS COURSE MTAT.03.239 25.09.2012 SEQUENCE ANALYSIS IS IMPORTANT FOR... Prediction of function Gene finding the process of identifying the regions of genomic DNA that encode
UC San Diego UC San Diego Electronic Theses and Dissertations
 UC San Diego UC San Diego Electronic Theses and Dissertations Title Algorithms for tandem mass spectrometry-based proteomics Permalink https://escholarship.org/uc/item/89f7x81r Author Frank, Ari Michael
InsPecT: Identification of Posttranslationally Modified Peptides from Tandem Mass Spectra
 Anal. Chem. 2005, 77, 4626-4639 InsPecT: Identification of Posttranslationally Modified Peptides from Tandem Mass Spectra Stephen Tanner,*, Hongjun Shu, Ari Frank, Ling-Chi Wang, Ebrahim Zandi, Marc Mumby,
Computational Analysis of Mass Spectrometric Data for Whole Organism Proteomic Studies
 University of Tennessee, Knoxville Trace: Tennessee Research and Creative Exchange Doctoral Dissertations Graduate School 5-2006 Computational Analysis of Mass Spectrometric Data for Whole Organism Proteomic
A Dynamic Programming Approach to De Novo Peptide Sequencing via Tandem Mass Spectrometry
 A Dynamic Programming Approach to De Novo Peptide Sequencing via Tandem Mass Spectrometry Ting Chen Department of Genetics arvard Medical School Boston, MA 02115, USA Ming-Yang Kao Department of Computer
Sequence analysis and comparison
 The aim with sequence identification: Sequence analysis and comparison Marjolein Thunnissen Lund September 2012 Is there any known protein sequence that is homologous to mine? Are there any other species
Computational Biology
 Computational Biology Lecture 6 31 October 2004 1 Overview Scoring matrices (Thanks to Shannon McWeeney) BLAST algorithm Start sequence alignment 2 1 What is a homologous sequence? A homologous sequence,
Background: Imagine it is time for your lunch break, you take your sandwich outside and you sit down to enjoy your lunch with a beautiful view of
 Background: Imagine it is time for your lunch break, you take your sandwich outside and you sit down to enjoy your lunch with a beautiful view of Montana s Rocky Mountains. As you look up, you see what
Protein Bioinformatics. Rickard Sandberg Dept. of Cell and Molecular Biology Karolinska Institutet sandberg.cmb.ki.
 Protein Bioinformatics Rickard Sandberg Dept. of Cell and Molecular Biology Karolinska Institutet rickard.sandberg@ki.se sandberg.cmb.ki.se Outline Protein features motifs patterns profiles signals 2 Protein
TUTORIAL EXERCISES WITH ANSWERS
 TUTORIAL EXERCISES WITH ANSWERS Tutorial 1 Settings 1. What is the exact monoisotopic mass difference for peptides carrying a 13 C (and NO additional 15 N) labelled C-terminal lysine residue? a. 6.020129
Hidden Markov Models
 Hidden Markov Models Outline 1. CG-Islands 2. The Fair Bet Casino 3. Hidden Markov Model 4. Decoding Algorithm 5. Forward-Backward Algorithm 6. Profile HMMs 7. HMM Parameter Estimation 8. Viterbi Training
De novo peptide sequencing methods for tandem mass. spectra
 De novo peptide sequencing methods for tandem mass spectra A Thesis Submitted to the College of Graduate Studies and Research in Partial Fulfillment of the Requirements for the degree of Doctor of Philosophy
Chapter 5. Proteomics and the analysis of protein sequence Ⅱ
 Proteomics Chapter 5. Proteomics and the analysis of protein sequence Ⅱ 1 Pairwise similarity searching (1) Figure 5.5: manual alignment One of the amino acids in the top sequence has no equivalent and
Hidden Markov Models
 Hidden Markov Models Outline CG-islands The Fair Bet Casino Hidden Markov Model Decoding Algorithm Forward-Backward Algorithm Profile HMMs HMM Parameter Estimation Viterbi training Baum-Welch algorithm
UCD Conway Institute of Biomolecular & Biomedical Research Graduate Education 2009/2010
 EMERGING PROTEOMIC TECHNOLOGIES - MODULE SCHEDULE & OUTLINE 2010 Course Organiser: Dr. Giuliano Elia Module Co-ordinator: Dr Giuliano Elia Credits: 5 Date & Time Session & Topic Coordinator 14th April
Key questions of proteomics. Bioinformatics 2. Proteomics. Foundation of proteomics. What proteins are there? Protein digestion
 s s Key questions of proteomics What proteins are there? Bioinformatics 2 Lecture 2 roteomics How much is there of each of the proteins? - Absolute quantitation - Stoichiometry What (modification/splice)
An SVM Scorer for More Sensitive and Reliable Peptide Identification via Tandem Mass Spectrometry
 An SVM Scorer for More Sensitive and Reliable Peptide Identification via Tandem Mass Spectrometry Haipeng Wang, Yan Fu, Ruixiang Sun, Simin He, Rong Zeng, and Wen Gao Pacific Symposium on Biocomputing
Biological Mass Spectrometry
 Biochemistry 412 Biological Mass Spectrometry February 13 th, 2007 Proteomics The study of the complete complement of proteins found in an organism Degrees of Freedom for Protein Variability Covalent Modifications
In-Depth Assessment of Local Sequence Alignment
 2012 International Conference on Environment Science and Engieering IPCBEE vol.3 2(2012) (2012)IACSIT Press, Singapoore In-Depth Assessment of Local Sequence Alignment Atoosa Ghahremani and Mahmood A.
Single alignment: Substitution Matrix. 16 march 2017
 Single alignment: Substitution Matrix 16 march 2017 BLOSUM Matrix BLOSUM Matrix [2] (Blocks Amino Acid Substitution Matrices ) It is based on the amino acids substitutions observed in ~2000 conserved block
Last updated: Copyright
 Last updated: 2012-08-20 Copyright 2004-2012 plabel (v2.4) User s Manual by Bioinformatics Group, Institute of Computing Technology, Chinese Academy of Sciences Tel: 86-10-62601016 Email: zhangkun01@ict.ac.cn,
Computationally Analyzing Mass Spectra of Hydrogen Deuterium Exchange Experiments Kevin S. Drew University of Chicago May 21, 2005
 Computationally Analyzing Mass Spectra of Hydrogen Deuterium Exchange Experiments Kevin S. Drew University of Chicago May 21, 2005 1 Abstract Hydrogen deuterium exchange (HDX) using Mass Spectrometers
Pairwise Alignment. Guan-Shieng Huang. Dept. of CSIE, NCNU. Pairwise Alignment p.1/55
 Pairwise Alignment Guan-Shieng Huang shieng@ncnu.edu.tw Dept. of CSIE, NCNU Pairwise Alignment p.1/55 Approach 1. Problem definition 2. Computational method (algorithms) 3. Complexity and performance Pairwise
Protein Quantitation II: Multiple Reaction Monitoring. Kelly Ruggles New York University
 Protein Quantitation II: Multiple Reaction Monitoring Kelly Ruggles kelly@fenyolab.org New York University Traditional Affinity-based proteomics Use antibodies to quantify proteins Western Blot RPPA Immunohistochemistry
Computational Genomics and Molecular Biology, Fall
 Computational Genomics and Molecular Biology, Fall 2014 1 HMM Lecture Notes Dannie Durand and Rose Hoberman November 6th Introduction In the last few lectures, we have focused on three problems related
CAP 5510 Lecture 3 Protein Structures
 CAP 5510 Lecture 3 Protein Structures Su-Shing Chen Bioinformatics CISE 8/19/2005 Su-Shing Chen, CISE 1 Protein Conformation 8/19/2005 Su-Shing Chen, CISE 2 Protein Conformational Structures Hydrophobicity
Probabilistic Arithmetic Automata
 Probabilistic Arithmetic Automata Applications of a Stochastic Computational Framework in Biological Sequence Analysis Inke Herms PhD thesis defense Overview 1 Probabilistic Arithmetic Automata 2 Application
Grundlagen der Bioinformatik, SS 08, D. Huson, May 2,
 Grundlagen der Bioinformatik, SS 08, D. Huson, May 2, 2008 39 5 Blast This lecture is based on the following, which are all recommended reading: R. Merkl, S. Waack: Bioinformatik Interaktiv. Chapter 11.4-11.7
A graph-based filtering method for top-down mass spectral identification
 Yang and Zhu BMC Genomics 2018, 19(Suppl 7):666 https://doi.org/10.1186/s12864-018-5026-x METHODOLOGY Open Access A graph-based filtering method for top-down mass spectral identification Runmin Yang and
Overview - MS Proteomics in One Slide. MS masses of peptides. MS/MS fragments of a peptide. Results! Match to sequence database
 Overview - MS Proteomics in One Slide Obtain protein Digest into peptides Acquire spectra in mass spectrometer MS masses of peptides MS/MS fragments of a peptide Results! Match to sequence database 2 But
Bio nformatics. Lecture 3. Saad Mneimneh
 Bio nformatics Lecture 3 Sequencing As before, DNA is cut into small ( 0.4KB) fragments and a clone library is formed. Biological experiments allow to read a certain number of these short fragments per
Protein Quantitation II: Multiple Reaction Monitoring. Kelly Ruggles New York University
 Protein Quantitation II: Multiple Reaction Monitoring Kelly Ruggles kelly@fenyolab.org New York University Traditional Affinity-based proteomics Use antibodies to quantify proteins Western Blot Immunohistochemistry
Atomic masses. Atomic masses of elements. Atomic masses of isotopes. Nominal and exact atomic masses. Example: CO, N 2 ja C 2 H 4
 High-Resolution Mass spectrometry (HR-MS, HRAM-MS) (FT mass spectrometry) MS that enables identifying elemental compositions (empirical formulas) from accurate m/z data 9.05.2017 1 Atomic masses (atomic
LECTURE-13. Peptide Mass Fingerprinting HANDOUT. Mass spectrometry is an indispensable tool for qualitative and quantitative analysis of
 LECTURE-13 Peptide Mass Fingerprinting HANDOUT PREAMBLE Mass spectrometry is an indispensable tool for qualitative and quantitative analysis of proteins, drugs and many biological moieties to elucidate
Pairwise sequence alignment
 Department of Evolutionary Biology Example Alignment between very similar human alpha- and beta globins: GSAQVKGHGKKVADALTNAVAHVDDMPNALSALSDLHAHKL G+ +VK+HGKKV A+++++AH+D++ +++++LS+LH KL GNPKVKAHGKKVLGAFSDGLAHLDNLKGTFATLSELHCDKL
Sequence Alignment: A General Overview. COMP Fall 2010 Luay Nakhleh, Rice University
 Sequence Alignment: A General Overview COMP 571 - Fall 2010 Luay Nakhleh, Rice University Life through Evolution All living organisms are related to each other through evolution This means: any pair of
EECS730: Introduction to Bioinformatics
 EECS730: Introduction to Bioinformatics Lecture 03: Edit distance and sequence alignment Slides adapted from Dr. Shaojie Zhang (University of Central Florida) KUMC visit How many of you would like to attend
Comprehensive support for quantitation
 Comprehensive support for quantitation One of the major new features in the current release of Mascot is support for quantitation. This is still work in progress. Our goal is to support all of the popular
PeptideProphet: Validation of Peptide Assignments to MS/MS Spectra. Andrew Keller
 PeptideProphet: Validation of Peptide Assignments to MS/MS Spectra Andrew Keller Outline Need to validate peptide assignments to MS/MS spectra Statistical approach to validation Running PeptideProphet
Bioinformatics and BLAST
 Bioinformatics and BLAST Overview Recap of last time Similarity discussion Algorithms: Needleman-Wunsch Smith-Waterman BLAST Implementation issues and current research Recap from Last Time Genome consists
Introduction to Comparative Protein Modeling. Chapter 4 Part I
 Introduction to Comparative Protein Modeling Chapter 4 Part I 1 Information on Proteins Each modeling study depends on the quality of the known experimental data. Basis of the model Search in the literature
CSE182-L7. Protein Sequence Analysis Patterns (regular expressions) Profiles HMM Gene Finding CSE182
 Profiles HMM Gene Finding CSE182") CSE182-L7 Protein Sequence Analysis Patterns (regular expressions) Profiles HMM Gene Finding 10-07 CSE182 Bell Labs Honors Pattern matching 10-07 CSE182 Just the Facts Consider the set of all substrings
CSE182-L7 Protein Sequence Analysis Patterns (regular expressions) Profiles HMM Gene Finding 10-07 CSE182 Bell Labs Honors Pattern matching 10-07 CSE182 Just the Facts Consider the set of all substrings
Introduction to Bioinformatics
 CSCI8980: Applied Machine Learning in Computational Biology Introduction to Bioinformatics Rui Kuang Department of Computer Science and Engineering University of Minnesota kuang@cs.umn.edu History of Bioinformatics
Sequence Alignment (chapter 6)
") Sequence lignment (chapter 6) he biological problem lobal alignment Local alignment Multiple alignment Introduction to bioinformatics, utumn 6 Background: comparative genomics Basic question in biology:
Sequence lignment (chapter 6) he biological problem lobal alignment Local alignment Multiple alignment Introduction to bioinformatics, utumn 6 Background: comparative genomics Basic question in biology:
Analysis and Design of Algorithms Dynamic Programming
 Analysis and Design of Algorithms Dynamic Programming Lecture Notes by Dr. Wang, Rui Fall 2008 Department of Computer Science Ocean University of China November 6, 2009 Introduction 2 Introduction..................................................................
EECS730: Introduction to Bioinformatics
 EECS730: Introduction to Bioinformatics Lecture 07: profile Hidden Markov Model http://bibiserv.techfak.uni-bielefeld.de/sadr2/databasesearch/hmmer/profilehmm.gif Slides adapted from Dr. Shaojie Zhang
Protein Post-translational Modifications Mapping with MS/MS based Frequent Interval Pattern Mining
 Protein Post-translational Modifications Mapping with MS/MS based Frequent Interval Pattern Mining Han Liu Department of Computer Science University of Illinois at Urbana-Champaign Email: hanliu@ncsa.uiuc.edu
Tiffany Samaroo MB&B 452a December 8, Take Home Final. Topic 1
 Tiffany Samaroo MB&B 452a December 8, 2003 Take Home Final Topic 1 Prior to 1970, protein and DNA sequence alignment was limited to visual comparison. This was a very tedious process; even proteins with
Non-metric Similarity Search of Tandem Mass Spectra Including Posttranslational Modifications
 Non-metric Similarity Search of Tandem Mass Spectra Including Posttranslational Modifications Jiří Novák, Tomáš Skopal, David Hoksza and Jakub Lokoč SIRET Research Group Department of Software Engineering,