PeptideProphet: Validation of Peptide Assignments to MS/MS Spectra. Andrew Keller
|
|
|
- Derick Banks
- 6 years ago
- Views:
Transcription
1 PeptideProphet: Validation of Peptide Assignments to MS/MS Spectra Andrew Keller
2 Outline Need to validate peptide assignments to MS/MS spectra Statistical approach to validation Running PeptideProphet software Interpreting results of PeptideProphet Exercises
3 Most search results are wrong [M+2H] 2+ /[M+3H] 3+ uncertainty (LCQ) Non-peptide noise Incomplete database e.g. post-translational modifications Limitation of database search algorithm
4 Validation of peptide assignments In the past, a majority of analysis time was devoted to identifying the minority of correct search results from the majority of incorrect results Required manual judgment sample prep instrument time database search validation Peptide Identification Effort 8.3% 8.3% 8.3% manual validation 75.0%
5 Results of 50 Spectrum Test Consistency among Experts : Of 50 search results 9 had < 67% publishable, borderline, or not pub Consistency of Individual Experts : Of 10 duplicated search results, on average 0.4 were assessed publishable / not publishable 2 were assessed inconsistently The true validity of the search results are known. Accuracy of Experts : of 511 total publishable : 95% correct of 102 total borderline : 49% correct of 387 total not publishable : 14% correct Even Experts are not dependable!
6 Need for objective criteria Manual scrutiny of search results is not practical for large datasets common to high throughput proteomics As an alternative to relying on human judgment, many research groups employ search scores and properties of the assigned peptides to discriminate between correct and incorrect results
7 Traditional filtering criteria Each SEQUEST search result has a: Xcorr, dcn, Sp, NTT (number of tryptic termini) Accept all results that satisfy: [M+2H] 2+ : Xcorr 2, dcn 0.1, Sp 50 [M+3H] 3+ : Xcorr 2.5, dcn 0.1, Sp 50
8 Traditional filtering criteria Each SEQUEST search result has a: Xcorr, dcn, Sp, NTT (number of tryptic termini) Accept all results that satisfy: [M+2H] 2+ : Xcorr 2, dcn 0.1, Sp 50, NTT 1 [M+3H] 3+ : Xcorr 2.5, dcn 0.1, Sp 50, NTT 1
9 Traditional filtering criteria Each SEQUEST search result has a: Xcorr, dcn, Sp, NTT (number of tryptic termini) Accept all results that satisfy: [M+2H] 2+ : Xcorr 2, dcn 0.1, Sp 50 (NTT 1) [M+3H] 3+ : Xcorr 2.5, dcn 0.1, Sp 50 (NTT 1) [M+2H] 2+ : Xcorr 2, dcn 0.1, Sp 50 [M+3H] 3+ : Xcorr 2, dcn 0.1, Sp 50
10 Traditional filtering criteria Each SEQUEST search result has a: Xcorr, dcn, Sp, NTT (number of tryptic termini) Accept all results that satisfy: [M+2H] 2+ : Xcorr 2, dcn 0.1, Sp 50 (NTT 1) [M+3H] 3+ : Xcorr 2.5, dcn 0.1, Sp 50 (NTT 1) [M+2H] 2+ : Xcorr 2, dcn 0.1, Sp 50, NTT 1 [M+3H] 3+ : Xcorr 2, dcn 0.1, Sp 50, NTT 1
11 Traditional filtering criteria Each SEQUEST search result has a: Xcorr, dcn, Sp, NTT (number of tryptic termini) Accept all results that satisfy: [M+2H] 2+ : Xcorr 2, dcn 0.1, Sp 50 (NTT 1) [M+3H] 3+ : Xcorr 2.5, dcn 0.1, Sp 50 (NTT 1) [M+2H] 2+ : Xcorr 2, dcn 0.1, Sp 50 (NTT 1) [M+3H] 3+ : Xcorr 2, dcn 0.1, Sp 50 (NTT 1)
12 Problems with traditional filtering Different research groups use different thresholds Combines scores in unsatisfactory manner: What if Xcorr is just below its threshold, but dcn is far above? Divides data into correct and incorrect- no in between Unknown error rates (fraction of data passing filter that are incorrect) Unknown sensitivity (fraction of correct results passing filter) Appropriate threshold may depend on database, mass spectrometer type, sample, etc.
13 Statistical Approach Use search scores and properties of the assigned peptides to compute a probability that each search result is correct Desirable model properties: Accurate High power to discriminate correct and incorrect results Robust
14 Training dataset Want dataset of SEQUEST search results for which the true correct and incorrect peptide assignments are known Sample of 18 control proteins (bovine, yeast, bacterial) Collect ~40,000 MS/MS spectra, and search using SEQUEST vs. a Drosophila database appended with sequences of 18 control proteins and common sample contaminants

15 Training dataset Peptides corresponding to drosophila proteins are incorrect Peptides corresponding to 18 control proteins or contaminants are correct*
16 Combine multiple SEQUEST scores into single discrminant score F Want to combine together Xcorr, dcn, and Sp in a linear manner to produce a new score, F, that maximally separates the correct and incorrect search results in the training dataset: F = c 0 + c 1 Xcorr + c 2 dcn + c 3 Sp Actually first transform Xcorr and Sp: [M+2H] 2+ : Xcorr = log(xcorr) / (log 2 * peplength) [M+3H] 3+ : Xcorr = log(xcorr) / (log 4 * peplength) Sp = log Sp
17 Derive Discriminant Fucntion Derive F for each precursor ion charge separately: F = c 0 + c 1 Xcorr + c 2 dcn + c 3 Sp For [M+3H] 3 + search results in training datset, c 0 = -2.0 c 1 = c 2 = c 3 = -0.2 F = * Xcorr * dcn 0.2 * Sp
18 Compute Discriminant Score F = * Xcorr * dcn 0.2 * Sp Example: Peptide K.ARPEFTLPVHFYGR.V Xcorr = 3.29 dcn = Sp = 3 Precursor Ion Charge = 3 Peplength = 14 Xcorr = log(3.29)/(log 56) = Sp = log(3) = 1.09 F = * * * 1.09 = 3.56
19 Discriminant Score Distributions no of spectra incorrect (-) correct (+) discriminant score (F) Training dataset [M+2H] 2+ spectra
20 Computing probabilities from discriminant score distributions no of spectra incorrect (-) p = 0.5 correct (+) discriminant score (F) Probability of being correct, given discriminant score F obs, is: p = Number of correct search results with F obs Total number of search results with F obs
21 Computing probabilities from discriminant score distributions no of spectra incorrect (-) p = 0.5 correct (+) discriminant score (F) Probability of being correct, given discriminant score F obs, is: Model Incorrect results as Gamma Distribution Model Correct results as Normal Distribution p = Normal µ,σ (F obs ) * Total correct Normal µ,σ (F obs ) * Total correct + Gamma α,β,zero (F obs ) * Total incorrect
22 Employing peptide properties Properties of the assigned peptides, in addition to search scores, are useful information for distinguishing correct and incorrect results For example in unconstrained SEQUEST searches for MS/MS spectra collected from trypsinized samples, a majority of correct assigned peptides have 2 tryptic termini (preceded by K,R), whereas a majority of incorrect assigned peptides have 0 tryptic termini
23 Number of tryptic termini (NTT) NTT can equal 0, 1, or 2: G.HVEQLDSSS.D NTT = 0 K.HVEQLDSSS.D NTT = 1 G.HVEQLDSSR.D NTT = 1 K.HVEQLDSSR.D NTT = 2
24 F obs : p = 0.5 without NTT becomes p=0.99 using NTT Number of tryptic termini (NTT) For the same value of F, assigned peptides with higher NTT values are more likely to be correct Example: training dataset Correct: 0.03 NTT=0, 0.28 NTT=1, 0.69 NTT=2 Incorrect: 0.80 NTT=0, 0.19 NTT=1, 0.01 NTT=2 Probability of being correct, given discriminant score F obs with NTT=2 is: Normal µ,σ (F obs ) * Total corr * 0.69 p = Normal µ,σ (F obs ) * Total corr * Gamma α,β,zero (F obs ) * Total incorr * 0.01
25 F obs : p = 0.5 without NTT becomes p=.04 using NTT Number of tryptic termini (NTT) For the same value of F, assigned peptides with lower NTT values are less likely to be correct Example: training dataset Correct: 0.03 NTT=0, 0.28 NTT=1, 0.69 NTT=2 Incorrect: 0.80 NTT=0, 0.19 NTT=1, 0.01 NTT=2 Probability of being correct, given discriminant score F obs with NTT=0 is: Normal µ,σ (F obs ) * Total corr * 0.03 p = Normal µ,σ (Fobs) * Total corr * Gamma α,β,zero (F obs ) * Total incorr * 0.80
26 Additional peptide properties Number of missed tryptic cleavages (NMC) Mass difference between precursor ion and peptide Presence of light or heavy cysteine (ICAT) Presence of N-glyc motif (N-glycosylation capture) Calculated pi (FFE) Incorporate similar to NTT above, assuming independence of peptide properties and search scores among correct and incorrect results
27 Computed Probabilities Given training dataset distributions of F, NTT, NMC, Massdiff, ICAT, N-glyc, and pi among correct and incorrect search results, then the probability of any search result with F obs, NTTobs, NMCobs, Massdiffobs, ICATobs, N-glycobs, and pi obs can be computed as described above, with terms for each piece of information Accurate Discriminating
28 Robust Model One cannot rely on the training dataset distributions of F, NTT, NMC, Massdiff, ICAT, N- glyc, and pi among correct and incorrect search results These distributions are expected to vary depending on: Database used for search Mass spectrometer Spectrum quality Sample preparation and purity
29 EM Algorithm PeptideProphet learns the distributions of F and peptide properties among correct and incorrect search results in each dataset It then uses the learned distributions to compute probabilities that each search result is correct EM algorithm: unsupervised learning method that iteratively estimates the distributions given probabilities that each search result is correct, and then computes those probabilities given the distributions Initial settings help guide algorithm to good solution
30 E-M Algorithm learns test data score distributions Incorrect Peptide Assignments NTT = 0 NTT = 1 NTT = 2 No. of spectra Correct Peptide Assignments Discriminant search score
31 E-M Iteration 0 Incorrect Peptide Assignments NTT = 0 NTT = 1 NTT = 2 No. of spectra Correct Peptide Assignments Discriminant search score
32 E-M Iteration 1 Incorrect Peptide Assignments NTT = 0 NTT = 1 NTT = 2 No. of spectra Correct Peptide Assignments Discriminant search score
33 E-M Iteration 2 Incorrect Peptide Assignments NTT = 0 NTT = 1 NTT = 2 No. of spectra Correct Peptide Assignments Discriminant search score
34 E-M Iteration 3 Incorrect Peptide Assignments NTT = 0 NTT = 1 NTT = 2 No. of spectra Correct Peptide Assignments Discriminant search score
35 E-M Iteration 4 Incorrect Peptide Assignments NTT = 0 NTT = 1 NTT = 2 No. of spectra Correct Peptide Assignments Discriminant search score
36 E-M Iteration 7 Incorrect Peptide Assignments NTT = 0 NTT = 1 NTT = 2 No. of spectra Correct Peptide Assignments Discriminant search score
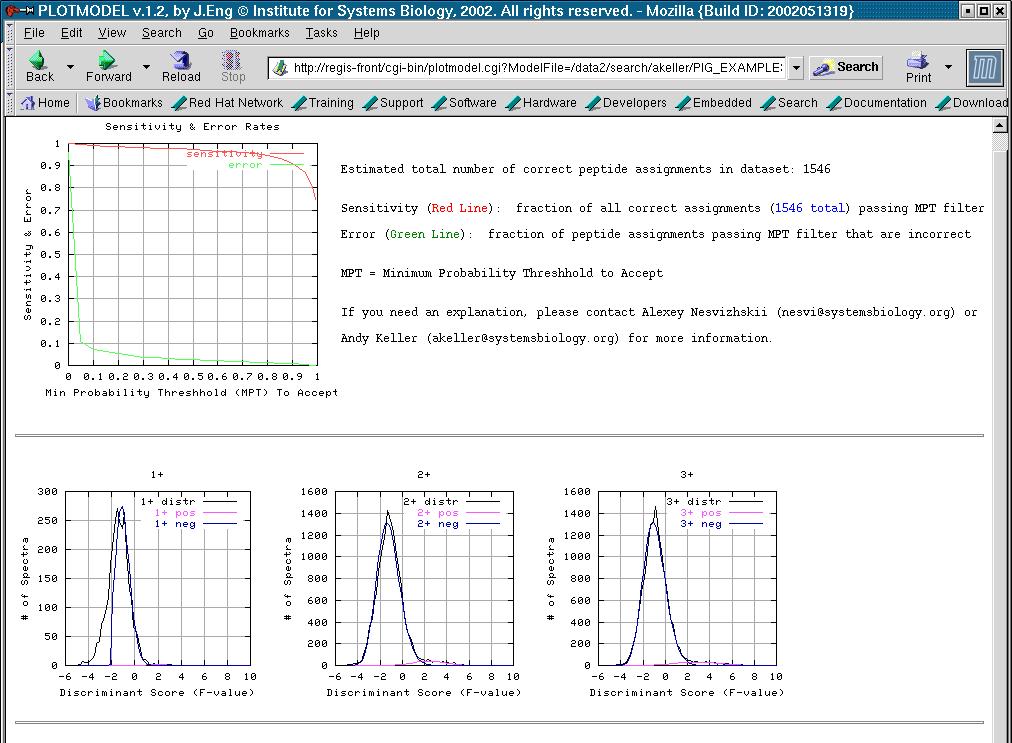
37 Accuracy of the Model ~ spectra with computed p ~ 0.9 model ideal p=0.9 90% of them (90) should be correct observed probability is around 0.9 test data: A. Keller et al. OMICS 6, 207 (2002) Model is accurate
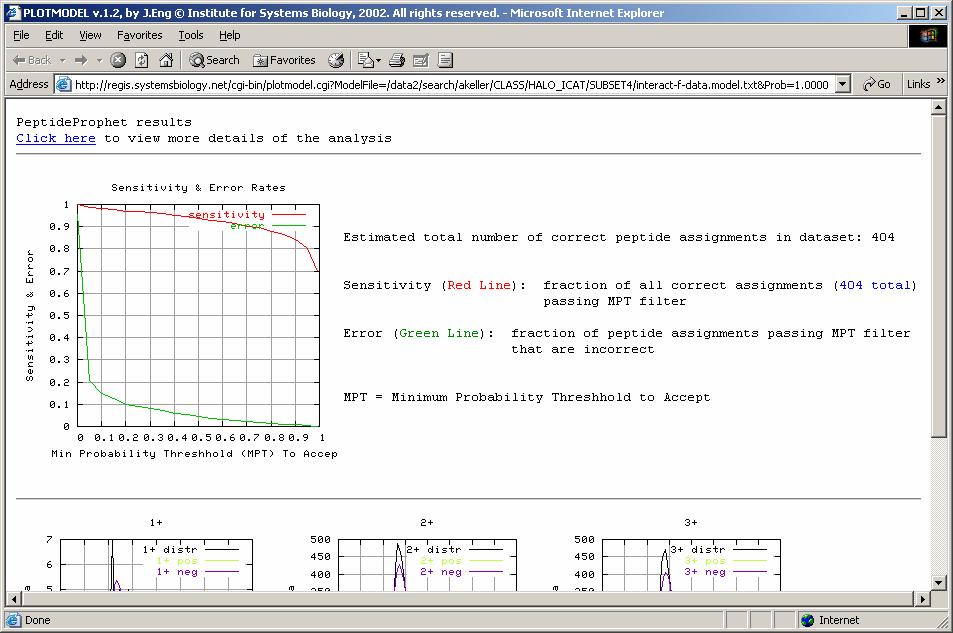
38 Discriminating Power of Computed Probabilities Sensitivity: fraction of all correct results passing filter Error: fraction of all results passing filter that are incorrect test data: A. Keller et al. OMICS 6, 207 (2002) Ideal Spot
39 Discriminating Power of Computed Probabilities sensitivity, error sensitivity error min. probability threshold observed predicted test data: A. Keller et al. OMICS 6, 207 (2002) Sensitivity: fraction of all correct results passing filter Error: fraction of all results passing filter that are incorrect
40 Discriminating Power : Example p sensitivity, error sensitivity error min. probability threshold observed predicted test data: A. Keller et al. OMICS 6, 207 (2002) 0.01 Sensitivity: fraction of all correct results passing filter Error: fraction of all results passing filter that are incorrect
41 Discriminating Power : Example p sensitivity, error sensitivity error min. probability threshold observed predicted test data: A. Keller et al. OMICS 6, 207 (2002) 0.07 Sensitivity: fraction of all correct results passing filter Error: fraction of all results passing filter that are incorrect
42 Can experts discriminate better than model? 20 of the test spectra were assigned probabilities close to 0.5 (in complete test dataset) Of those, 10 were correct: on average: 51% publishable, 24% borderline, 25% not pub and 10 were incorrect: on average: 11% publishable, 16% borderline, 74% not pub
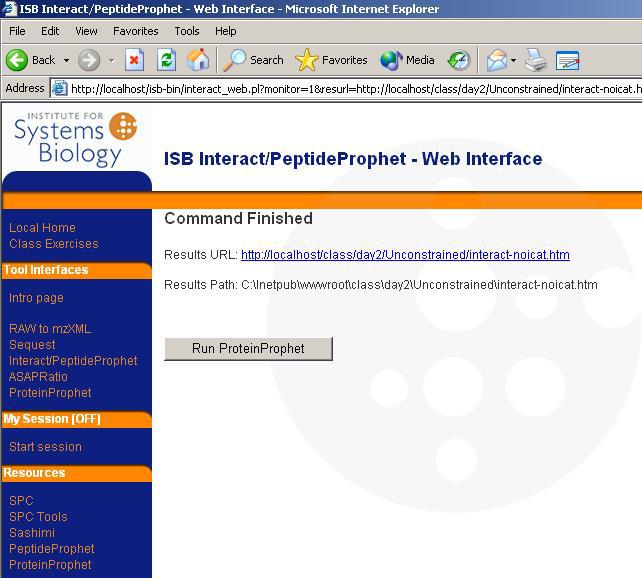
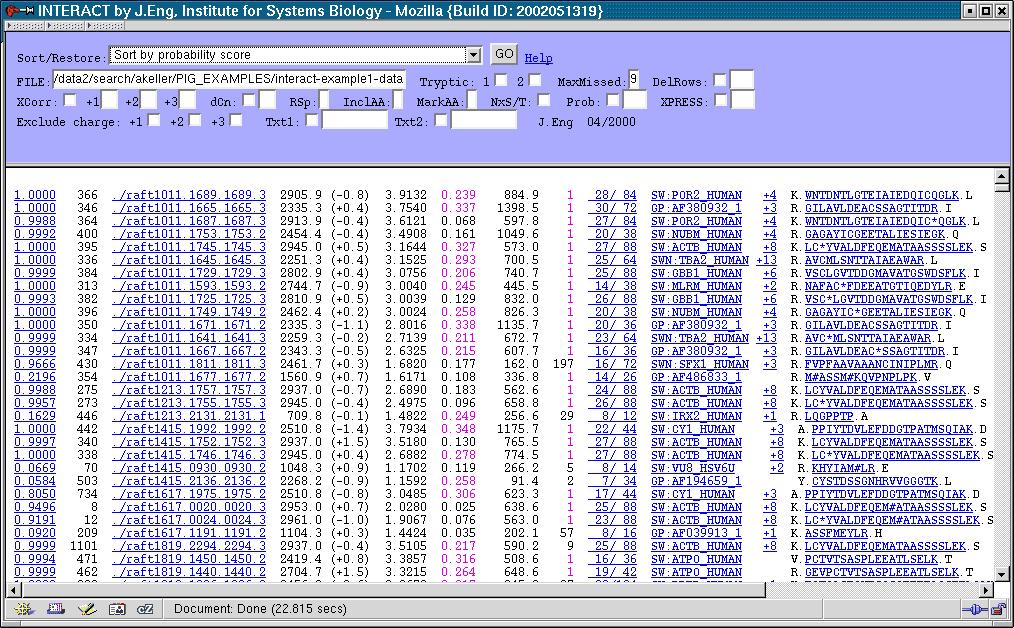
43 Getting started with PeptideProphet Input: SEQUEST summary html files (file.html) Interact merges files together into interact.htm, then PeptideProphet runs model, computes probabilities, and writes probabilities as first column Combine together runs that are similar (sample, database, search constraints, mass spectrometer)

44 Getting started with PeptideProphet
45 PeptideProphet Results
46 PeptideProphet Results: Model Summary
47 Reasonable Learned Discriminant Score Distributions
48 Suspicious Looking Learned Discriminant Score Distributions

49 PeptideProphet Results: Model Summary
50 PeptideProphet Results: Model Summary Good Not so good
51 PeptideProphet Results: Model Summary
52 PeptideProphet Results: Model Summary

53 PeptideProphet Results: Predicted Numbers of Correct and Incorrect Peptides
![PeptideProphet [M+2H] 2+](/docs-images/74/71044994/images/54-0.jpg "vs [M+3H] 3+ Precursor")
54 PeptideProphet [M+2H] 2+ vs [M+3H] 3+ Precursor Ions

55 PeptideProphet Results: Incomplete Analysis

56 Sort Data by Computed Probability

57 Some Options for Interact Rename Output File (e.g. to interact-noicat.htm):

58 Some Options for Interact no PeptideProphet analysis alternative minimum probability sample enzyme other than trypsin

59 Use of Supplemental Discriminating Information Use additional discriminating information, including ICAT or N-glyc, when relevant PeptideProphet automatically uses ICAT information when it thinks appropriate. Nevertheless, you can explicitly set whether or not ICAT information is utilized

60 DeltaCn* Example
 2. Leave alone (suitable for the context of homologues) 3.")
61 DeltaCn* Options There are three ways asterisked deltas can be treated by PeptideProphet: 1. Penalize (the default option, sets asterisked deltas to 0) 2. Leave alone (suitable for the context of homologues) 3. Exclude (the most conservative, assigns probability 0)
62 Ongoing Developments for PeptideProphet Optimize for various additional mass spectrometers New discriminant function Adapt to additional methods for assigning peptides to tandem mass spectra Mascot COMET X!Tandem Others
63 Pep3D mzxml Data Viewer Xiao-jun Li 1. Main features of Pep3D 2. Evaluating sample quality 3. Evaluating LC-ESI-MS/MS performance

64 1. Main Features of Pep3D interact
65 Pep3D Images: Type A

66 Pep3D Images: Type B CID (1198)

67 Pep3D Images: Type C peptide (221)
68 Pep3D Images: Type D peptide/cid (221/1196 = )
69 Display CID Spectrum

70 Features: 2720

71 Features: 2720 CIDs: 1633

72 Features: 2720 CIDs: 1633 IDs: 363 ID/CID: 22% ID/feature: 13%
73 2. Evaluating Sample Quality Good sample: Plenty well-localized spots without any particular large-scale pattern

74 Empty Sample peptide/cid (0/311 = 0) Very few localized spots Mainly background noise Distinguishable from no-spray
 CID (588); no positive")
75 Chemical Contamination CID (26) CID (588); no positive ID
76 Features of Chemical Contamination Long horizontal streaks Low m/z values Singly charged ions Many wasteful CID attempts Can be put on CID exclusive list

77 Polymer Contamination Repeat unit of 44 amu
78 Features of Polymer Contamination Localized spots running off-diagonally Equal distance in m/z Almost equal distance in time May be ionized in multiple charge states Many wasteful CID attempts Eliminated by better washing steps?

79 3. Evaluating LC-ESI-MS/MS performance Good performance: Peptide ions evenly distributed Smooth background Majority of intensive ions fragmented End too soon
 Large proportion of intensive ions not fragmented Insufficient SCX")
80 Insufficient Sample Separation peptide/cid (527/2150 = ) Large proportion of intensive ions not fragmented Insufficient SCX separation Non-optimal RP separation

81 Non-Optimal RP Gradient %B st ID: 42 min Effective range: mins Horizontal streaks Larger slope at beginning Slower slope in middle Higher %B at end 0

 (224/2760 = 0.")
82 Bad RP Column Same sample, same system, different columns peptide/cid (354/3004 = 0.12) (224/2760 = 0.08) 37% less IDs Quantification also suffers
83 Summary Pep3D can be used to evaluate sample quality and LC-ESI-MS/MS performance Other applications possible Suggestion: Use complex standard sample to check system performance
84 Exercises with PeptideProphet Accuracy of computed probabilities Utility of conventional SEQUEST score thresholds and PeptideProphet analysis Model results for ICAT data analyzed with and without ICAT information Model results for unconstrained vs. tryptic constrained search results
85 Exercise Datasets Many of the exercises utilize SEQUEST search results generated from datasets for which true results are known: HaloICAT: ICAT halobacterium sample searched against a halo_plus_human protein database PeptideProphet run on these datasets automatically colors all correct corresponding proteins red!
PeptideProphet: Validation of Peptide Assignments to MS/MS Spectra
 PeptideProphet: Validation of Peptide Assignments to MS/MS Spectra Andrew Keller Day 2 October 17, 2006 Andrew Keller Rosetta Bioinformatics, Seattle Outline Need to validate peptide assignments to MS/MS
Isotopic-Labeling and Mass Spectrometry-Based Quantitative Proteomics
 Isotopic-Labeling and Mass Spectrometry-Based Quantitative Proteomics Xiao-jun Li, Ph.D. Current address: Homestead Clinical Day 4 October 19, 2006 Protein Quantification LC-MS/MS Data XLink mzxml file
MS-MS Analysis Programs
 MS-MS Analysis Programs Basic Process Genome - Gives AA sequences of proteins Use this to predict spectra Compare data to prediction Determine degree of correctness Make assignment Did we see the protein?
Tutorial 1: Setting up your Skyline document
 Tutorial 1: Setting up your Skyline document Caution! For using Skyline the number formats of your computer have to be set to English (United States). Open the Control Panel Clock, Language, and Region
Workflow concept. Data goes through the workflow. A Node contains an operation An edge represents data flow The results are brought together in tables
 PROTEOME DISCOVERER Workflow concept Data goes through the workflow Spectra Peptides Quantitation A Node contains an operation An edge represents data flow The results are brought together in tables Protein
Protein Identification Using Tandem Mass Spectrometry. Nathan Edwards Informatics Research Applied Biosystems
 Protein Identification Using Tandem Mass Spectrometry Nathan Edwards Informatics Research Applied Biosystems Outline Proteomics context Tandem mass spectrometry Peptide fragmentation Peptide identification
Methods for proteome analysis of obesity (Adipose tissue)
") Methods for proteome analysis of obesity (Adipose tissue) I. Sample preparation and liquid chromatography-tandem mass spectrometric analysis Instruments, softwares, and materials AB SCIEX Triple TOF 5600
Methods for proteome analysis of obesity (Adipose tissue) I. Sample preparation and liquid chromatography-tandem mass spectrometric analysis Instruments, softwares, and materials AB SCIEX Triple TOF 5600
Empirical Statistical Model To Estimate the Accuracy of Peptide Identifications Made by MS/MS and Database Search
 Anal. Chem. 2002, 74, 5383-5392 Empirical Statistical Model To Estimate the Accuracy of Peptide Identifications Made by MS/MS and Database Search Andrew Keller,*, Alexey I. Nesvizhskii,*, Eugene Kolker,
Overview - MS Proteomics in One Slide. MS masses of peptides. MS/MS fragments of a peptide. Results! Match to sequence database
 Overview - MS Proteomics in One Slide Obtain protein Digest into peptides Acquire spectra in mass spectrometer MS masses of peptides MS/MS fragments of a peptide Results! Match to sequence database 2 But
Computational Methods for Mass Spectrometry Proteomics
 Computational Methods for Mass Spectrometry Proteomics Eidhammer, Ingvar ISBN-13: 9780470512975 Table of Contents Preface. Acknowledgements. 1 Protein, Proteome, and Proteomics. 1.1 Primary goals for studying
Improved Classification of Mass Spectrometry Database Search Results Using Newer Machine Learning Approaches*
 Research Improved Classification of Mass Spectrometry Database Search Results Using Newer Machine Learning Approaches* Peter J. Ulintz, Ji Zhu, Zhaohui S. Qin **, and Philip C. Andrews Manual analysis
Proteomics. November 13, 2007
 Proteomics November 13, 2007 Acknowledgement Slides presented here have been borrowed from presentations by : Dr. Mark A. Knepper (LKEM, NHLBI, NIH) Dr. Nathan Edwards (Center for Bioinformatics and Computational
HOWTO, example workflow and data files. (Version )
") HOWTO, example workflow and data files. (Version 20 09 2017) 1 Introduction: SugarQb is a collection of software tools (Nodes) which enable the automated identification of intact glycopeptides from HCD
HOWTO, example workflow and data files. (Version 20 09 2017) 1 Introduction: SugarQb is a collection of software tools (Nodes) which enable the automated identification of intact glycopeptides from HCD
Quan%ta%on with XPRESS. and. ASAPRa%o
 Quan%ta%on with XPRESS and ASAPRa%o 1 Pep%de and Protein Quan%ta%on Raw Mass Spec Data Pep%de Iden%fica%on Pep%de Valida%on Quan%ta%on Protein Assignment Protein List msconvert X!Tandem SpectraST SEQUEST*
DIA-Umpire: comprehensive computational framework for data independent acquisition proteomics
 DIA-Umpire: comprehensive computational framework for data independent acquisition proteomics Chih-Chiang Tsou 1,2, Dmitry Avtonomov 2, Brett Larsen 3, Monika Tucholska 3, Hyungwon Choi 4 Anne-Claude Gingras
SRM assay generation and data analysis in Skyline
 in Skyline Preparation 1. Download the example data from www.srmcourse.ch/eupa.html (3 raw files, 1 csv file, 1 sptxt file). 2. The number formats of your computer have to be set to English (United States).
Spectrum-to-Spectrum Searching Using a. Proteome-wide Spectral Library
 MCP Papers in Press. Published on April 30, 2011 as Manuscript M111.007666 Spectrum-to-Spectrum Searching Using a Proteome-wide Spectral Library Chia-Yu Yen, Stephane Houel, Natalie G. Ahn, and William
Qualitative Proteomics (how to obtain high-confidence high-throughput protein identification!)
") Qualitative Proteomics (how to obtain high-confidence high-throughput protein identification!) James A. Mobley, Ph.D. Director of Research in Urology Associate Director of Mass Spectrometry (contact: mobleyja@uab.edu)
Qualitative Proteomics (how to obtain high-confidence high-throughput protein identification!) James A. Mobley, Ph.D. Director of Research in Urology Associate Director of Mass Spectrometry (contact: mobleyja@uab.edu)
MALDI-HDMS E : A Novel Data Independent Acquisition Method for the Enhanced Analysis of 2D-Gel Tryptic Peptide Digests
 -HDMS E : A Novel Data Independent Acquisition Method for the Enhanced Analysis of 2D-Gel Tryptic Peptide Digests Emmanuelle Claude, 1 Mark Towers, 1 and Rachel Craven 2 1 Waters Corporation, Manchester,
A new algorithm for the evaluation of shotgun peptide sequencing in proteomics: support vector machine classification of peptide MS/MS spectra
 A new algorithm for the evaluation of shotgun peptide sequencing in proteomics: support vector machine classification of peptide MS/MS spectra and SEQUEST scores D.C. Anderson*, Weiqun Li, Donald G. Payan,
iprophet: Multi-level integrative analysis of shotgun proteomic data improves peptide and protein identification rates and error estimates
 MCP Papers in Press. Published on August 29, 2011 as Manuscript M111.007690 This is the Pre-Published Version iprophet: Multi-level integrative analysis of shotgun proteomic data improves peptide and protein
Improved 6- Plex TMT Quantification Throughput Using a Linear Ion Trap HCD MS 3 Scan Jane M. Liu, 1,2 * Michael J. Sweredoski, 2 Sonja Hess 2 *
 Improved 6- Plex TMT Quantification Throughput Using a Linear Ion Trap HCD MS 3 Scan Jane M. Liu, 1,2 * Michael J. Sweredoski, 2 Sonja Hess 2 * 1 Department of Chemistry, Pomona College, Claremont, California
TUTORIAL EXERCISES WITH ANSWERS
 TUTORIAL EXERCISES WITH ANSWERS Tutorial 1 Settings 1. What is the exact monoisotopic mass difference for peptides carrying a 13 C (and NO additional 15 N) labelled C-terminal lysine residue? a. 6.020129
Quality Assessment of Tandem Mass Spectra Based on Cumulative Intensity Normalization
 Quality Assessment of Tandem Mass Spectra Based on Cumulative Intensity Normalization Seungjin Na and Eunok Paek* Department of Mechanical and Information Engineering, University of Seoul, Seoul, Korea
MS-based proteomics to investigate proteins and their modifications
 MS-based proteomics to investigate proteins and their modifications Francis Impens VIB Proteomics Core October th 217 Overview Mass spectrometry-based proteomics: general workflow Identification of protein
Analysis of Peptide MS/MS Spectra from Large-Scale Proteomics Experiments Using Spectrum Libraries
 Anal. Chem. 2006, 78, 5678-5684 Analysis of Peptide MS/MS Spectra from Large-Scale Proteomics Experiments Using Spectrum Libraries Barbara E. Frewen, Gennifer E. Merrihew, Christine C. Wu, William Stafford
Properties of Average Score Distributions of SEQUEST
 Research Properties of Average Score Distributions of SEQUEST THE PROBABILITY RATIO METHOD* S Salvador Martínez-Bartolomé, Pedro Navarro, Fernando Martín-Maroto, Daniel López-Ferrer **, Antonio Ramos-Fernández,
PRIDE Cluster: building the consensus of proteomics data
 Supplementary Materials PRIDE Cluster: building the consensus of proteomics data Johannes Griss, Joseph Michael Foster, Henning Hermjakob and Juan Antonio Vizcaíno EMBL-European Bioinformatics Institute,
An Unsupervised, Model-Free, Machine-Learning Combiner for Peptide Identifications from Tandem Mass Spectra
 Clin Proteom (2009) 5:23 36 DOI 0.007/s204-009-9024-5 An Unsupervised, Model-Free, Machine-Learning Combiner for Peptide Identifications from Tandem Mass Spectra Nathan Edwards Xue Wu Chau-Wen Tseng Published
Last updated: Copyright
 Last updated: 2012-08-20 Copyright 2004-2012 plabel (v2.4) User s Manual by Bioinformatics Group, Institute of Computing Technology, Chinese Academy of Sciences Tel: 86-10-62601016 Email: zhangkun01@ict.ac.cn,
Tandem mass spectra were extracted from the Xcalibur data system format. (.RAW) and charge state assignment was performed using in house software
 and charge state assignment was performed using in house software") Supplementary Methods Software Interpretation of Tandem mass spectra Tandem mass spectra were extracted from the Xcalibur data system format (.RAW) and charge state assignment was performed using in house
Supplementary Methods Software Interpretation of Tandem mass spectra Tandem mass spectra were extracted from the Xcalibur data system format (.RAW) and charge state assignment was performed using in house
Improved Validation of Peptide MS/MS Assignments. Using Spectral Intensity Prediction
 MCP Papers in Press. Published on October 2, 2006 as Manuscript M600320-MCP200 Improved Validation of Peptide MS/MS Assignments Using Spectral Intensity Prediction Shaojun Sun 1, Karen Meyer-Arendt 2,
LECTURE-13. Peptide Mass Fingerprinting HANDOUT. Mass spectrometry is an indispensable tool for qualitative and quantitative analysis of
 LECTURE-13 Peptide Mass Fingerprinting HANDOUT PREAMBLE Mass spectrometry is an indispensable tool for qualitative and quantitative analysis of proteins, drugs and many biological moieties to elucidate
Nature Methods: doi: /nmeth Supplementary Figure 1. Fragment indexing allows efficient spectra similarity comparisons.
 Supplementary Figure 1 Fragment indexing allows efficient spectra similarity comparisons. The cost and efficiency of spectra similarity calculations can be approximated by the number of fragment comparisons
The Pitfalls of Peaklist Generation Software Performance on Database Searches
 Proceedings of the 56th ASMS Conference on Mass Spectrometry and Allied Topics, Denver, CO, June 1-5, 2008 The Pitfalls of Peaklist Generation Software Performance on Database Searches Aenoch J. Lynn,
Key questions of proteomics. Bioinformatics 2. Proteomics. Foundation of proteomics. What proteins are there? Protein digestion
 s s Key questions of proteomics What proteins are there? Bioinformatics 2 Lecture 2 roteomics How much is there of each of the proteins? - Absolute quantitation - Stoichiometry What (modification/splice)
Mass Spectrometry and Proteomics - Lecture 5 - Matthias Trost Newcastle University
 Mass Spectrometry and Proteomics - Lecture 5 - Matthias Trost Newcastle University matthias.trost@ncl.ac.uk Previously Proteomics Sample prep 144 Lecture 5 Quantitation techniques Search Algorithms Proteomics
Introduction to pepxmltab
 Introduction to pepxmltab Xiaojing Wang October 30, 2018 Contents 1 Introduction 1 2 Convert pepxml to a tabular format 1 3 PSMs Filtering 4 4 Session Information 5 1 Introduction Mass spectrometry (MS)-based
Mass spectrometry has been used a lot in biology since the late 1950 s. However it really came into play in the late 1980 s once methods were
 Mass spectrometry has been used a lot in biology since the late 1950 s. However it really came into play in the late 1980 s once methods were developed to allow the analysis of large intact (bigger than
ASCQ_ME: a new engine for peptide mass fingerprint directly from mass spectrum without mass list extraction
 ASCQ_ME: a new engine for peptide mass fingerprint directly from mass spectrum without mass list extraction Jean-Charles BOISSON1, Laetitia JOURDAN1, El-Ghazali TALBI1, Cécile CREN-OLIVE2 et Christian
STATISTICAL METHODS FOR THE ANALYSIS OF MASS SPECTROMETRY- BASED PROTEOMICS DATA. A Dissertation XUAN WANG
 STATISTICAL METHODS FOR THE ANALYSIS OF MASS SPECTROMETRY- BASED PROTEOMICS DATA A Dissertation by XUAN WANG Submitted to the Office of Graduate Studies of Texas A&M University in partial fulfillment of
MassHunter Software Overview
 MassHunter Software Overview 1 Qualitative Analysis Workflows Workflows in Qualitative Analysis allow the user to only see and work with the areas and dialog boxes they need for their specific tasks A
Mass Spectrometry Based De Novo Peptide Sequencing Error Correction
 Mass Spectrometry Based De Novo Peptide Sequencing Error Correction by Chenyu Yao A thesis presented to the University of Waterloo in fulfillment of the thesis requirement for the degree of Master of Mathematics
NPTEL VIDEO COURSE PROTEOMICS PROF. SANJEEVA SRIVASTAVA
 LECTURE-25 Quantitative proteomics: itraq and TMT TRANSCRIPT Welcome to the proteomics course. Today we will talk about quantitative proteomics and discuss about itraq and TMT techniques. The quantitative
Reagents. Affinity Tag (Biotin) Acid Cleavage Site. Figure 1. Cleavable ICAT Reagent Structure.
 Acid Cleavage Site. Figure 1. Cleavable ICAT Reagent Structure.") DATA SHEET Protein Expression Analysis Reagents Background The ultimate goal of proteomics is to identify and quantify proteins that are relevant to a given biological state; and to unearth networks of
DATA SHEET Protein Expression Analysis Reagents Background The ultimate goal of proteomics is to identify and quantify proteins that are relevant to a given biological state; and to unearth networks of
X!TandemPipeline (Myosine Anabolisée) validating, filtering and grouping MSMS identifications
 validating, filtering and grouping MSMS identifications") X!TandemPipeline 3.3.3 (Myosine Anabolisée) validating, filtering and grouping MSMS identifications Olivier Langella and Benoit Valot langella@moulon.inra.fr; valot@moulon.inra.fr PAPPSO - http://pappso.inra.fr/
X!TandemPipeline 3.3.3 (Myosine Anabolisée) validating, filtering and grouping MSMS identifications Olivier Langella and Benoit Valot langella@moulon.inra.fr; valot@moulon.inra.fr PAPPSO - http://pappso.inra.fr/
Self-assembling covalent organic frameworks functionalized. magnetic graphene hydrophilic biocomposite as an ultrasensitive
 Electronic Supplementary Material (ESI) for Nanoscale. This journal is The Royal Society of Chemistry 2017 Electronic Supporting Information for: Self-assembling covalent organic frameworks functionalized
Proteomics: the first decade and beyond. (2003) Patterson and Aebersold Nat Genet 33 Suppl: from
 Patterson and Aebersold Nat Genet 33 Suppl: from") Advances in mass spectrometry and the generation of large quantities of nucleotide sequence information, combined with computational algorithms that could correlate the two, led to the emergence of proteomics
Advances in mass spectrometry and the generation of large quantities of nucleotide sequence information, combined with computational algorithms that could correlate the two, led to the emergence of proteomics
Identification of proteins by enzyme digestion, mass
 Method for Screening Peptide Fragment Ion Mass Spectra Prior to Database Searching Roger E. Moore, Mary K. Young, and Terry D. Lee Beckman Research Institute of the City of Hope, Duarte, California, USA
Tandem MS = MS / MS. ESI-MS give information on the mass of a molecule but none on the structure
 Tandem MS = MS / MS ESI-MS give information on the mass of a molecule but none on the structure In tandem MS (MSMS) (pseudo-)molecular ions are selected in MS1 and fragmented by collision with gas. collision
The Power of LC MALDI: Identification of Proteins by LC MALDI MS/MS Using the Applied Biosystems 4700 Proteomics Analyzer with TOF/TOF Optics
 APPLICATION NOTE TOF MS The Power of LC MALDI: Identification of Proteins by LC MALDI MS/MS Using the Applied Biosystems 4700 Proteomics Analyzer with TOF/TOF Optics Purpose The Applied Biosystems 4700
Tutorial 1: Library Generation from DDA data
 Tutorial 1: Library Generation from DDA data 1. Introduction Before a targeted, peptide-centric DIA analysis can be performed, a spectral library containing peptide-query parameters needs to be generated.
Comprehensive support for quantitation
 Comprehensive support for quantitation One of the major new features in the current release of Mascot is support for quantitation. This is still work in progress. Our goal is to support all of the popular
Supplementary Figure 1
 Supplementary Figure 1 The correlation of n-score cutoff and FDR in both CID-only and CID-ETD fragmentation strategies. A bar diagram of different n-score thresholds applied in the search, plotted against
An SVM Scorer for More Sensitive and Reliable Peptide Identification via Tandem Mass Spectrometry
 An SVM Scorer for More Sensitive and Reliable Peptide Identification via Tandem Mass Spectrometry Haipeng Wang, Yan Fu, Ruixiang Sun, Simin He, Rong Zeng, and Wen Gao Pacific Symposium on Biocomputing
De novo Protein Sequencing by Combining Top-Down and Bottom-Up Tandem Mass Spectra. Xiaowen Liu
 De novo Protein Sequencing by Combining Top-Down and Bottom-Up Tandem Mass Spectra Xiaowen Liu Department of BioHealth Informatics, Department of Computer and Information Sciences, Indiana University-Purdue
Figure S1. Interaction of PcTS with αsyn. (a) 1 H- 15 N HSQC NMR spectra of 100 µm αsyn in the absence (0:1, black) and increasing equivalent
 1 H- 15 N HSQC NMR spectra of 100 µm αsyn in the absence (0:1, black) and increasing equivalent") Figure S1. Interaction of PcTS with αsyn. (a) 1 H- 15 N HSQC NMR spectra of 100 µm αsyn in the absence (0:1, black) and increasing equivalent concentrations of PcTS (100 µm, blue; 500 µm, green; 1.5 mm,
Figure S1. Interaction of PcTS with αsyn. (a) 1 H- 15 N HSQC NMR spectra of 100 µm αsyn in the absence (0:1, black) and increasing equivalent concentrations of PcTS (100 µm, blue; 500 µm, green; 1.5 mm,
Computational Analysis of Mass Spectrometric Data for Whole Organism Proteomic Studies
 University of Tennessee, Knoxville Trace: Tennessee Research and Creative Exchange Doctoral Dissertations Graduate School 5-2006 Computational Analysis of Mass Spectrometric Data for Whole Organism Proteomic
Modeling Mass Spectrometry-Based Protein Analysis
 Chapter 8 Jan Eriksson and David Fenyö Abstract The success of mass spectrometry based proteomics depends on efficient methods for data analysis. These methods require a detailed understanding of the information
Information Dependent Acquisition (IDA) 1
 1") Information Dependent Acquisition (IDA) Information Dependent Acquisition (IDA) enables on the fly acquisition of MS/MS spectra during a chromatographic run. Analyst Software IDA is optimized to generate
Information Dependent Acquisition (IDA) Information Dependent Acquisition (IDA) enables on the fly acquisition of MS/MS spectra during a chromatographic run. Analyst Software IDA is optimized to generate
Protein Quantitation II: Multiple Reaction Monitoring. Kelly Ruggles New York University
 Protein Quantitation II: Multiple Reaction Monitoring Kelly Ruggles kelly@fenyolab.org New York University Traditional Affinity-based proteomics Use antibodies to quantify proteins Western Blot Immunohistochemistry
A NESTED MIXTURE MODEL FOR PROTEIN IDENTIFICATION USING MASS SPECTROMETRY
 Submitted to the Annals of Applied Statistics A NESTED MIXTURE MODEL FOR PROTEIN IDENTIFICATION USING MASS SPECTROMETRY By Qunhua Li,, Michael MacCoss and Matthew Stephens University of Washington and
MassHunter TOF/QTOF Users Meeting
 MassHunter TOF/QTOF Users Meeting 1 Qualitative Analysis Workflows Workflows in Qualitative Analysis allow the user to only see and work with the areas and dialog boxes they need for their specific tasks
Protein Quantitation II: Multiple Reaction Monitoring. Kelly Ruggles New York University
 Protein Quantitation II: Multiple Reaction Monitoring Kelly Ruggles kelly@fenyolab.org New York University Traditional Affinity-based proteomics Use antibodies to quantify proteins Western Blot RPPA Immunohistochemistry
Mass Spectrometry. Hyphenated Techniques GC-MS LC-MS and MS-MS
 Mass Spectrometry Hyphenated Techniques GC-MS LC-MS and MS-MS Reasons for Using Chromatography with MS Mixture analysis by MS alone is difficult Fragmentation from ionization (EI or CI) Fragments from
Effective Strategies for Improving Peptide Identification with Tandem Mass Spectrometry
 Effective Strategies for Improving Peptide Identification with Tandem Mass Spectrometry by Xi Han A thesis presented to the University of Waterloo in fulfillment of the thesis requirement for the degree
A Software Suite for the Generation and Comparison of Peptide Arrays from Sets. of Data Collected by Liquid Chromatography-Mass Spectrometry
 MCP Papers in Press. Published on July 26, 2005 as Manuscript M500141-MCP200 A Software Suite for the Generation and Comparison of Peptide Arrays from Sets of Data Collected by Liquid Chromatography-Mass
Protein Post-translational Modifications Mapping with MS/MS based Frequent Interval Pattern Mining
 Protein Post-translational Modifications Mapping with MS/MS based Frequent Interval Pattern Mining Han Liu Department of Computer Science University of Illinois at Urbana-Champaign Email: hanliu@ncsa.uiuc.edu
Quantitative Proteomics
 Quantitative Proteomics Quantitation AND Mass Spectrometry Condition A Condition B Identify and quantify differently expressed proteins resulting from a change in the environment (stimulus, disease) Lyse
TOMAHAQ Method Construction
 TOMAHAQ Method Construction Triggered by offset mass accurate-mass high-resolution accurate quantitation (TOMAHAQ) can be performed in the standard method editor of the instrument, without modifications
Learning Score Function Parameters for Improved Spectrum Identification in Tandem Mass Spectrometry Experiments
 pubs.acs.org/jpr Learning Score Function Parameters for Improved Spectrum Identification in Tandem Mass Spectrometry Experiments Marina Spivak, Michael S. Bereman, Michael J. MacCoss, and William Stafford
Powerful Scan Modes of QTRAP System Technology
 Powerful Scan Modes of QTRAP System Technology Unique Hybrid Triple Quadrupole Linear Ion Trap Technology Provides Powerful Workflows to Answer Complex Questions with No Compromises While there are many
MSnID Package for Handling MS/MS Identifications
 Vladislav A. Petyuk December 1, 2018 Contents 1 Introduction.............................. 1 2 Starting the project.......................... 3 3 Reading MS/MS data........................ 3 4 Updating
A TMT-labeled Spectral Library for Peptide Sequencing
 A TMT-labeled Spectral Library for Peptide Sequencing by Jianqiao Shen A thesis presented to the University of Waterloo in fulfillment of the thesis requirement for the degree of Master of Mathematics
Purdue-UAB Botanicals Center for Age- Related Disease
 Purdue-UAB Botanicals Center for Age- Related Disease MALDI-TOF Mass Spectrometry Fingerprinting Technique Landon Wilson MALDI-TOF mass spectrometry is an advanced technique for rapid protein identification
profileanalysis Innovation with Integrity Quickly pinpointing and identifying potential biomarkers in Proteomics and Metabolomics research
 profileanalysis Quickly pinpointing and identifying potential biomarkers in Proteomics and Metabolomics research Innovation with Integrity Omics Research Biomarker Discovery Made Easy by ProfileAnalysis
MaSS-Simulator: A highly configurable MS/MS simulator for generating test datasets for big data algorithms.
 MaSS-Simulator: A highly configurable MS/MS simulator for generating test datasets for big data algorithms. Muaaz Gul Awan 1 and Fahad Saeed 1 1 Department of Computer Science, Western Michigan University,
Identification and Characterization of an Isolated Impurity Fraction: Analysis of an Unknown Degradant Found in Quetiapine Fumarate
 Identification and Characterization of an Isolated Impurity Fraction: Analysis of an Unknown Degradant Found in Quetiapine Fumarate Michael D. Jones, Xiang Jin Song, Robert S. Plumb, Peter J. Lee, and
Translational Biomarker Core
 Translational Biomarker Core Instrumentation Thermo Scientific TSQ Quantum Triple Quadrupole Mass Spectrometers. There are two TSQ Quantum Ultra AM instruments available in the TBC. The TSQ Quantum Ultra
Introduction to Proteomics: Fragmentation of protonated peptides and manual sequencing
 Introduction to Proteomics: ragmentation of protonated peptides and manual sequencing Árpád Somogyi CCIC SP SU Summer Workshop S/S hod using ESI Ion rap (Bottom up) 1 An alternative strategy for complex
ALIGNMENT OF LC-MS DATA USING PEPTIDE FEATURES. A Thesis XINCHENG TANG
 ALIGNMENT OF LC-MS DATA USING PEPTIDE FEATURES A Thesis by XINCHENG TANG Submitted to the Office of Graduate Studies of Texas A&M University in partial fulfillment of the requirements for the degree of
Q Exactive TM : A True Qual-Quan HR/AM Mass Spectrometer for Routine Proteomics Applications. Yi Zhang, Ph.D. ThermoFisher Scientific
 Q Exactive TM : A True Qual-Quan HR/AM Mass Spectrometer for Routine Proteomics Applications Yi Zhang, Ph.D. ThermoFisher Scientific Outline Introduction of Q Exactive Performance in Discovery Proteomics
Thermo Finnigan LTQ. Specifications
 IET International Equipment Trading Ltd. www.ietltd.com Proudly serving laboratories worldwide since 1979 CALL +847.913.0777 for Refurbished & Certified Lab Equipment Thermo Finnigan LTQ Specifications
PosterREPRINT COMPARISON OF PEAK PARKING VERSUS AUTOMATED FRACTION ANALYSIS OF A COMPLEX PROTEIN MIXTURE. Introduction
 Introduction The study of protein expression allows a greater understanding of biological function and can now routinely be performed using mass spectrometry. However, analysis of the post-translational
SPECTRA LIBRARY ASSISTED DE NOVO PEPTIDE SEQUENCING FOR HCD AND ETD SPECTRA PAIRS
 SPECTRA LIBRARY ASSISTED DE NOVO PEPTIDE SEQUENCING FOR HCD AND ETD SPECTRA PAIRS 1 Yan Yan Department of Computer Science University of Western Ontario, Canada OUTLINE Background Tandem mass spectrometry
for the Novice Mass Spectrometry (^>, John Greaves and John Roboz yc**' CRC Press J Taylor & Francis Group Boca Raton London New York
 Mass Spectrometry for the Novice John Greaves and John Roboz (^>, yc**' CRC Press J Taylor & Francis Group Boca Raton London New York CRC Press is an imprint of the Taylor & Francis Croup, an informa business
Thermo Scientific LTQ Orbitrap Velos Hybrid FT Mass Spectrometer
 IET International Equipment Trading Ltd. www.ietltd.com Proudly serving laboratories worldwide since 1979 CALL +847.913.0777 for Refurbished & Certified Lab Equipment Thermo Scientific LTQ Orbitrap Velos
Parallel Algorithms For Real-Time Peptide-Spectrum Matching
 Parallel Algorithms For Real-Time Peptide-Spectrum Matching A Thesis Submitted to the College of Graduate Studies and Research in Partial Fulfillment of the Requirements for the degree of Master of Science
Agilent MassHunter Profinder: Solving the Challenge of Isotopologue Extraction for Qualitative Flux Analysis
 Agilent MassHunter Profinder: Solving the Challenge of Isotopologue Extraction for Qualitative Flux Analysis Technical Overview Introduction Metabolomics studies measure the relative abundance of metabolites
Introduction to Proteomics & Bottom-up Proteomics
 Used for MS Short Course at Tsinghua by R. Graham Cooks, Hao Chen, Zheng Ouyang, Andy Tao, Yu Xia and Lingjun Li Introduction to Proteomics & Bottom-up Proteomics W. Andy Tao Purdue University watao@purdue.edu
On Optimizing the Non-metric Similarity Search in Tandem Mass Spectra by Clustering
 On Optimizing the Non-metric Similarity Search in Tandem Mass Spectra by Clustering Jiří Novák, David Hoksza, Jakub Lokoč, and Tomáš Skopal Siret Research Group, Faculty of Mathematics and Physics, Charles
Agilent ESI and APCI sources: for polar to non-polar compounds
 1 Agilent 6400 Series Triple Quadrupole Users Workshop 1 Agilent ESI and APCI sources: for polar to non-polar compounds Nebulizer Pressure Corona current Nebulizer Pressure Vaporizer Vcap Vcap Drying Gas
PC235: 2008 Lecture 5: Quantitation. Arnold Falick
 PC235: 2008 Lecture 5: Quantitation Arnold Falick falickam@berkeley.edu Summary What you will learn from this lecture: There are many methods to perform quantitation using mass spectrometry (any method
De novo peptide sequencing methods for tandem mass. spectra
 De novo peptide sequencing methods for tandem mass spectra A Thesis Submitted to the College of Graduate Studies and Research in Partial Fulfillment of the Requirements for the degree of Doctor of Philosophy
Finnigan LCQ Advantage MAX
 www.ietltd.com Proudly serving laboratories worldwide since 1979 CALL +847.913.0777 for Refurbished & Certified Lab Equipment Finnigan LCQ Advantage MAX The Finnigan LCQ Advantage MAX ion trap mass spectrometer
Electron Transfer Dissociation of N-linked Glycopeptides from a Recombinant mab Using SYNAPT G2-S HDMS
 Electron Transfer Dissociation of N-linked Glycopeptides from a Recombinant mab Using SYNAPT G2-S HDMS Jonathan P. Williams, Jeffery M. Brown, Stephane Houel, Ying Qing Yu, and Weibin Chen Waters Corporation,
Analyst Software. Peptide and Protein Quantitation Tutorial
 This document is provided to customers who have purchased AB Sciex equipment to use in the operation of such AB Sciex equipment. This document is copyright protected and any reproduction of this document
Towards the Prediction of Protein Abundance from Tandem Mass Spectrometry Data
 Towards the Prediction of Protein Abundance from Tandem Mass Spectrometry Data Anthony J Bonner Han Liu Abstract This paper addresses a central problem of Proteomics: estimating the amounts of each of
ADVANCEMENT IN PROTEIN INFERENCE FROM SHOTGUN PROTEOMICS USING PEPTIDE DETECTABILITY
 ADVANCEMENT IN PROTEIN INFERENCE FROM SHOTGUN PROTEOMICS USING PEPTIDE DETECTABILITY PEDRO ALVES, 1 RANDY J. ARNOLD, 2 MILOS V. NOVOTNY, 2 PREDRAG RADIVOJAC, 1 JAMES P. REILLY, 2 HAIXU TANG 1, 3* 1) School
Mass spectrometry in proteomics
 I519 Introduction to Bioinformatics, Fall, 2013 Mass spectrometry in proteomics Haixu Tang School of Informatics and Computing Indiana University, Bloomington Modified from: www.bioalgorithms.info Outline