And how to do them. Denise L Seman City of Youngstown
|
|
|
- Ursula Gaines
- 6 years ago
- Views:
Transcription


1 And how to do them Denise L Seman City of Youngstown
2 Quality Control (QC) is defined as the process of detecting analytical errors to ensure both reliability and accuracy of the data generated QC can be used to ensure the equipment is functioning properly, the reagents are good, and the technician is skilled at the analysis
3 QC involves a statistical evaluation of data and the use of quality control materials Ideally, the use of third party, certified materials Statistical evaluation acceptance criteria may be defined within the approved methodology
4 QC must be performed on a regular basis QC must be included in regular runs, not a special QC only run QC materials should be treated the same as samples, from beginning to end of run
5 Good QC means: regular calibration of the equipment Frequent checks of known standards against the calibration to verify the cal is working (do NOT use the same standard to verify cal)
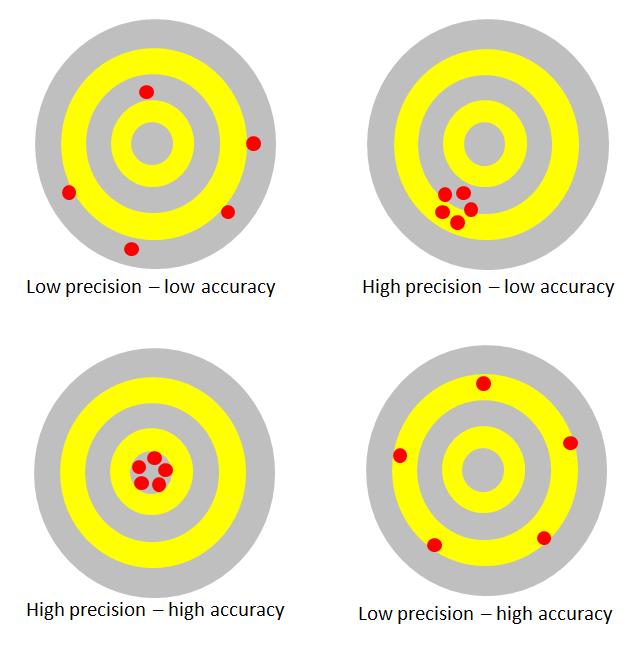
6 Mean Commonly called the average Standard deviation A statistic quantifying how close the numbers in a data set are to each other Accuracy How close to the true value you are Precision How close your duplicates are to each other
7 Coefficient of variation (CV) Ratio of the standard deviation to the mean Expressed as a percentage Coefficient of variation ratio Comparison of your labs CV to the values of a peer groups CV Standard Deviation Index Also peer based Mean of your lab minus the mean of the group Divided by the standard deviation of the group
8 These 2 will have the most impact on your analytical data You can be accurate and always fall within the acceptable range of a known standard You may be imprecise and your results are all over the spectrum within that acceptable range
9
10
11 Control charts are an important part of lab QC Levey-Jennings charts are used to track the day to day statistics of any analytical parameter. Charts are created for each test, and for each QC value within the test
12 A control chart gives you a visual display of method stability or instability over a period of time
13 Every method has some normal variation Use of control charts will allow you to track the normal variation, and quickly observe any abnormal variations
14 Some variation is simply the result of numerous, everpresent differences in the method. This is common cause variation
15 Chance occurrences Random issues that can t be controlled
16 Some variation may be the result of causes which are not normally present in the method This could be special cause variation
17 Incorrect reagents Expired reagents Inaccurate measurements Dirty glassware
18 Control Charts differentiate between these two types of variation
19 A corrective action investigation will isolate the possible special causes of a set of data
20 Control charts are tools used to determine whether or not an analytical process is in a state of statistical control, or stability
21 Stability is defined as the state in which a method has displayed a degree of consistency in the past and is expected to continue to do so in the future.
22 This consistency is demonstrated by a stream of data falling within control limits based on plus or minus 3 standard deviations of the calculated mean
23 Control charts can help you determine if any analysis is in control (statistically acceptable for all parameters) over a period of time
24 If the analysis is in control, the data generated can be reported with a relative degree of certainty
25 If the control chart indicates the analysis is NOT in control, a corrective action investigation should be conducted to correct the errors, and samples re-run before reporting
26 Control chart parameters should never be adjusted to be able to report data This will result in skewed, inaccurate data AND you will be reporting false data to the regulating agency
27
28 Calculate the mean and standard deviation to begin These 2 values will be used to determine the zones of the chart
29 The mean will be used as the center line on your chart The standard deviation will be used to develop the various zones of acceptance on the chart
30 When an analytical method is in control, 68% of the data will fall within +/- 1 std dev 96.5% of the data should fall within +/- 2 std dev
31 About 99.7% of the data will fall between +/- 3 std dev Data within the +/- 2 std dev is considered to be reportable, and method is well within control
32 Data that falls outside of the +/- 2 std dev, but within the +/- 3 std dev is considered reportable but you should start checking the method for any possible sources of problems
33 Things to look at: Age of reagents Does probe need to be cleaned Is equipment due to for maintenance
34 If you monitor your data as it falls outside of the +/- 2 std dev, but before it falls outside the +/- 3 std dev you can almost eliminate having any data fall outside the +/- 3 std dev (which indicates the method is out of control)
35 You should have at least 20 data points before developing a representative chart for quality control
36 Data should be updated frequently to incorporate new data into the values You don t need to do this daily
37 Ideally, you should work on developing an infinite set of data for the control charts This will give you more reliable QC than tossing half of your data set to add in a new group of data
38 After calculating the mean and standard deviation, it s time to set up a chart The chart is used as a visual aid for analysis
39 Plot the data on a graph Draw the Center Line (mean) Draw in the Warning limits Draw in the Control limits
40 Establish your zones on the chart Zone A is between 2 and 3 std dev Zone B is between 1 and 2 std dev Zone C is 1 std dev

41
42 New charts should be started for new methods or for any method that undergoes a significant change/ modification
43
44 All data points should be included in the evaluation of the control charts
45 Data that is affected by normal variability should be left in use
46 Data should ideally only be excluded if and when it can be linked to a specific cause variability.
47 Specific cause variability would be something linked directly to an error in the method: Incorrect reagents Dirty glassware Poor technique
48
49 There are other factors, or trends, that must be taken into consideration as well as whether the data is inside or outside the control limits to determine if a method/ data is in control
50 look for systematic patterns of points (e.g., means) across samples, because such patterns may indicate that the process average has shifted
51 A run of 9 consecutive points on the same side of the mean indicates the method is out of control
52 probability of this happening statistically is same probability that a point will fall outside the 3 std deviation line
53 if this pattern is detected, then chances are the average has probably changed
54 Successive samples with lessthan-average variability may be worth investigating, since they may provide hints on how to decrease the variation in the method
55 Note that it is assumed that the distribution of the data points will be symmetrical around the mean
56 6 points in a row steadily increasing or decreasing. This also signals a drift in the average
57 Often, such drift can be the result of equipment wear, deteriorating maintenance, improvement in skill, etc
58 14 points in a row alternating up and down. If this trend is present, it indicates that two systematically alternating causes are producing different results
59 2 out of 3 points in a row in Zone A or beyond. This provides an "early warning" of a process shift.
60 15 points in a row in Zone C (+/- 1 std dev) (above and below the center line). This test indicates a smaller variability than is expected (based on the current control limits)
61 8 points in a row in Zone B, A, or beyond, on either side of the center line (without points in Zone C). This indicates that different samples are affected by different factors, resulting in a bimodal distribution of means
62 This may happen, for example, if different samples were processed by two different techs, where one follows good measurement protocol and the other doesn t
63 A tend indicates a gradual loss of reliability in the test system Trends are often subtle The data slowly shifts from the norm to a new pattern
64 Trends may be caused by: Deterioration of instrument light source/ membrane, etc Gradual accumulation of dirt/ contaminants within the test system Age of reagents Gradual deterioration of control materials Gradual deterioration of calibration
65
66 An abrupt change in the control mean is a shift Shifts in the QC data represent a sudden and dramatic positive or negative change in the performance
67 Shifts may be caused by: Sudden failure of light source/ fouling of membrane Change in reagent formulation Change of reagent lot Major instrument maintenance Change of room temp/ humidity Failure of sampling system Failure of the automatic equipment Bad calibration
68
69 Once the data has been evaluated and a known variable for a source of error has been determined outliers can be removed from the statistical pattern
70 Using the outlier rules: If you continue to eliminate points without confirming there was special cause for them to occur, you will eventually end up with a control chart so tight you will almost always be out
71 Every time you eliminate outliers, you need to recalculate the mean, and the standard deviation
72
73 When evaluating the run, look at the QC from that run as it relates to the parameters generated from the control chart
74 If the data is in control, report the results If a data point is out of control, look for special causes and reanalyze the sample(s) affected
75 Good data is data that is accurate and precise and can be documented to demonstrate those characteristics.
76
77 Quality assurance is the program developed for the laboratory QC This involves rules on when to perform the QC, how to perform the QC, and storage of the QC data
78 This also includes documenting the instrument maintenance Written SOP s for all methods, based on the exact equipment you use to perform the analysis is part of a good QA program
79 Quality assurance is a necessary component of a good laboratory practice
80 Method detection limit
81 The level where you know the analysis can actually generate/ detect values within a given sample with a relative degree of certainty
82 This limit is based on the entire analytical process, including any distillation and/ or digestion steps, as it incorporates all avenues of potential error
83 Detection limits are a statistical evaluation of a series of known analytical results from the same sample/ standard
84 The concentration in the sample being used for the determination should be within 2 to 10 times the anticipated detection limit
85 If you are prepping a standard (a spiked blank) the conc should be 1 to 5 times the expected limit
86 A series of 7 analysis of the same sample are done, and the results calculated to determine the MDL
87 The average of the data is calculated, as well as the standard deviation The standard deviation is multiplied by the t-value for a 99% confidence interval (for 7 samples it is 3.14)
88 The resulting value is your MDL For a more realistic value use the S-pooled to calculate the result
89 From your 7 samples, calculate the variance of the data Using the previous set of data for the MDL of this analysis calculate the variance of that set
90
91 Xι; i=1 to n, are the analytical results in the final method reporting units obtained from the n sample aliquots and Σ refers to the sum of the X values from i=l to n. 6. (a) Compute the MDL as follows: MDL = t (n-1,1-α=0.99) (S) where: MDL = the method detection limit t (n-1,1-α=.99) = the students' t value appropriate for a 99% confidence level and a standard deviation estimate with n-1 degrees of freedom. See Table. S = standard deviation of the replicate analyses.
92 Divide the larger variance by the smaller variance to determine the ratio If this value is > 3.05 redo the analysis
93 If the ratio is less than 3.05 use this equation to determine the S pooled value: SQRT(((variance 1*6)+(variance 2*6))/12) Multiply by to determine the MDL (t (12,1 α=.99) )
94 MDL s should be revisited at least once a year. MDL s should be done for any new methods and method modifications MDL s are NOT the limit for most accurate reporting levels, but the point at which you are sure you CAN detect results
95 Questions? Contact info:
Clinical Chemistry Quality Control Policies, Processes, & Procedures
 Clinical Chemistry Quality Control Policies, Processes, & Procedures Prepared By: Brendan Jones Clinical Chemistry Quality Supervisor Laverty Pathology What is Quality Control? The statistical process
Objectives. Concepts in Quality Control Data Management. At the conclusion, the participant should be able to:
 Concepts in Quality Control Data Management Bio-Rad Laboratories Quality System Specialist Thomasine Newby Objectives At the conclusion, the participant should be able to: Describe how laboratory quality
Explain and apply the use of calibrators and controls in immunoassay Criteria for assay run acceptance/rejection, including Westgard rules
 RCPA Part II Exam Study Group WEEK 8 Objectives Explain and apply the use of calibrators and controls in immunoassay 2.1.1.1. Standardisation 2.1.1.2. Traceability of calibrators 2.1.1.3. Choice of control
Laboratory Techniques 100: Back To Basics. Carol Injasoulian Lab Manager City of Bay City April 29,2015
 Laboratory Techniques 100: Back To Basics Carol Injasoulian Lab Manager City of Bay City April 29,2015 QA/QC for Environmental Measurement What is quality assurance (QA)? Broad plan to maintain quality
This procedure describes the monitoring activities in a laboratory quality control (QC) program to ensure the quality of test results.
 program to ensure the quality of test results.") Page 1 of 8 Home Science & Research Field Science and Laboratories Laboratory Manual Science & Research Volume II - Assuring the Quality of Test Results ORA-LAB.5.9 ORA Laboratory Procedure Food and Drug
Page 1 of 8 Home Science & Research Field Science and Laboratories Laboratory Manual Science & Research Volume II - Assuring the Quality of Test Results ORA-LAB.5.9 ORA Laboratory Procedure Food and Drug
Copyright ENCO Laboratories, Inc. II. Quality Control. A. Introduction
 II. Quality Control A. Introduction ENCO adheres to strict quality control practices in order to assure our clients that the data provided are accurate and reliable. We are required by the EPA to analyze
EPAs New MDL Procedure What it Means, Why it Works, and How to Comply
 EPAs New MDL Procedure What it Means, Why it Works, and How to Comply Richard Burrows TestAmerica Inc. 1 A Revision to the Method Detection Limit EPA published a revision to the 40 CFR Part 136 MDL procedure
Statistics: Error (Chpt. 5)
") Statistics: Error (Chpt. 5) Always some amount of error in every analysis (How much can you tolerate?) We examine error in our measurements to know reliably that a given amount of analyte is in the sample
Statistics: Error (Chpt. 5) Always some amount of error in every analysis (How much can you tolerate?) We examine error in our measurements to know reliably that a given amount of analyte is in the sample
The New MDL Procedure How To s. Presented by: Marcy Bolek - Alloway
 The New MDL Procedure How To s Presented by: Marcy Bolek - Alloway Proposed MDL Revision 2015 MUR How to obtain a copy of the proposed MDL revision? https://www.gpo.gov/fdsys/pkg/fr-2015-02-19/pdf/2015-02841.pdf
Laboratory Quality Control Report: Why is it Important?
 Laboratory Quality Control Report: Why is it Important? Bradley J. Austin, Mike Daniels and Brian E. Haggard Arkansas Water Resources Center University of Arkansas System Division of Agriculture FS-2017-04
Proposed Procedures for Determining the Method Detection Limit and Minimum Level
 Proposed Procedures for Determining the Method Detection Limit and Minimum Level Published by: ACIL Environmental Services Section Technical Committee Revision 3.0 3/8/006 PROCEDURES These procedures set
ELISA QUALITY ASSURANCE Analytical Phase
 LOGO ELISA QUALITY ASSURANCE Analytical Phase - DR. ALI MIRJALILI QUALITY ASSURANCE Dept. PISHTAZ TEB DIAGNOSTICS 01/02/92 Quality improvement congress Definitions: Quality Assurance Quality Control:-
Saleh Nasiri (Ph.D.) IBTO-Research Center
 IBTO-Research Center") Quality and safety improvement of blood component products in blood transfusion by using statistical methods and control charts in screening test results Saleh Nasiri (Ph.D.) IBTO-Research Center What
Quality and safety improvement of blood component products in blood transfusion by using statistical methods and control charts in screening test results Saleh Nasiri (Ph.D.) IBTO-Research Center What
Calibration (The Good Curve) Greg Hudson EnviroCompliance Labs, Inc.
 Greg Hudson EnviroCompliance Labs, Inc.") Calibration (The Good Curve) Greg Hudson EnviroCompliance Labs, Inc. greghudson@envirocompliance.com www.envirocompliance.com Abstract It should come as no surprise that the correlation coefficient is
Calibration (The Good Curve) Greg Hudson EnviroCompliance Labs, Inc. greghudson@envirocompliance.com www.envirocompliance.com Abstract It should come as no surprise that the correlation coefficient is
How s that *new* LOD Coming? Rick Mealy WWOA Board of Directors DNR LabCert
 How s that *new* LOD Coming? Rick Mealy WWOA Board of Directors DNR LabCert The LOD Procedure has changed Federal Register /Vol. 82, No. 165 /Monday, August 28, 2017 ACTION: Final rule. DATES: This regulation
QUALITY CONTROL CRITERIA FOR CHEMISTRY EXCEPT RADIOCHEMISTRY.
 1 REVISOR 4740.2100 4740.2100 QUALITY CONTROL CRITERIA FOR CHEMISTRY EXCEPT RADIOCHEMISTRY. Subpart 1. Scope. This part applies to laboratories performing testing under the inorganic chemistry, metals,
Protean Instrument Dutchtown Road, Knoxville, TN TEL/FAX:
 Application Note AN-0210-1 Tracking Instrument Behavior A frequently asked question is How can I be sure that my instrument is performing normally? Before we can answer this question, we must define what
Part 14: Water quality Sampling. Guidance on quality assurance and quality control of environmental water sampling and handling
 Provläsningsexemplar / Preview INTERNATIONAL STANDARD ISO 5667-14 Second edition 2014-12-15 Water quality Sampling Part 14: Guidance on quality assurance and quality control of environmental water sampling
IE 316 Exam 1 Fall 2011
 IE 316 Exam 1 Fall 2011 I have neither given nor received unauthorized assistance on this exam. Name Signed Date Name Printed 1 1. Suppose the actual diameters x in a batch of steel cylinders are normally
Revision: 11 (MBAS) ALLOWAY METHOD OUTLINE. Standard Laboratory Method:
 ALLOWAY METHOD OUTLINE. Standard Laboratory Method:") ALLOWAY METHOD OUTLINE Standard Laboratory Method: SM Parameter: Methylene Blue Method: Colorimetric Reporting Level: Reference: 0.05 mg/l Standard Methods for the Examination Of Water and Wastewater;
ALLOWAY METHOD OUTLINE Standard Laboratory Method: SM Parameter: Methylene Blue Method: Colorimetric Reporting Level: Reference: 0.05 mg/l Standard Methods for the Examination Of Water and Wastewater;
ALLOWAY METHOD OUTLINE
 ALLOWAY METHOD OUTLINE Standard Laboratory Method SM4500-Cl -G Parameter Residual Chlorine & Free Chlorine Method DPD Colorimetric Test Kit Date Issued Originator: Section Supervisor: QA Manager Date:
Really, A Revised MDL Procedure
 NEMC 2016 Really, A Revised MDL Procedure Richard Burrows, Ph.D. TestAmerica Inc. 1 A Revision to the Method Detection Limit EPA published a revision to the 40 CFR Part 136 MDL procedure in the Federal
Quality Assurance is what we do to get the right answer for our purpose FITNESS FOR PURPOSE
 Quality Assurance is what we do to get the right answer for our purpose FITNESS FOR PURPOSE Use objectives: state purpose for which results will be used. Specifications: How good should the numbers be
Guide to the Expression of Uncertainty in Measurement (GUM)- An Overview
- An Overview") Estimation of Uncertainties in Chemical Measurement Guide to the Expression of Uncertainty in Measurement (GUM)- An Overview Angelique Botha Method of evaluation: Analytical measurement Step 1: Specification
Estimation of Uncertainties in Chemical Measurement Guide to the Expression of Uncertainty in Measurement (GUM)- An Overview Angelique Botha Method of evaluation: Analytical measurement Step 1: Specification
TNI V1M Standard Update Guidance on Detection and Quantitation
 TNI V1M4 2016 Standard Update Guidance on Detection and Quantitation GUID-3-109-Rev0 January 30, 2019 This material represents the opinion of its authors. It is intended solely as guidance and does not
QA/QC in the Wastewater Laboratory. Steve Roberts Ohio EPA Division of Environmental Services 05/11/2016
 QA/QC in the Wastewater Laboratory Steve Roberts Ohio EPA Division of Environmental Services 05/11/2016 What is Quality Assurance? Per Standard Methods for the Examination of Water and Wastewater, 21 st
Harris: Quantitative Chemical Analysis, Eight Edition CHAPTER 03: EXPERIMENTAL ERROR
 Harris: Quantitative Chemical Analysis, Eight Edition CHAPTER 03: EXPERIMENTAL ERROR Chapter 3. Experimental Error -There is error associated with every measurement. -There is no way to measure the true
Statistical Process Control
 Chapter 3 Statistical Process Control 3.1 Introduction Operations managers are responsible for developing and maintaining the production processes that deliver quality products and services. Once the production
Water Quality MDLs, PQLs, and Censored Values What Does It All Mean?
 Water Quality MDLs, PQLs, and Censored Values What Does It All Mean? Brad Austin, Thad Scott, M. Daniels, and Brian Haggard Arkansas Water Resources Center University of Arkansas System s Division of Agriculture
Harris: Quantitative Chemical Analysis, Eight Edition CHAPTER 03: EXPERIMENTAL ERROR
 Harris: Quantitative Chemical Analysis, Eight Edition CHAPTER 03: EXPERIMENTAL ERROR Chapter 3. Experimental Error -There is error associated with every measurement. -There is no way to measure the true
Chapter 5. Errors in Chemical Analysis 熊同銘.
 Chapter 5 Errors in Chemical Analysis 熊同銘 tmhsiung@gmail.com http://www.chem.ntou.edu.tw/ Slide 1 of 19 Contents in Chapter 5 5.1 Accuracy, Precision and Bias 5.2 Types of Errors in Experimental Data 5.3
Laboratory 101: A Guide to Understanding your Testing Laboratory
 Laboratory 101: A Guide to Understanding your Testing Laboratory Jim Cronin Product Ecology Manager Environmental Monitoring and Technologies, Inc. (EMT) Morton Grove, Illinois Abstract: Laboratory 101:
Calibration Verification Linearity in the Clinical Lab. Did I Pass or Fail? 2017 ASCLS New Jersey
 Calibration Verification Linearity in the Clinical Lab. Did I Pass or Fail? 2017 ASCLS New Jersey Presentation Topics & Objectives Calibration Verification Key Definitions Why do I need to perform CV?
CHAPTER VI ANALYTICAL METHODS & QUALITY CONTROL
 CHAPTER VI ANALYTICAL METHODS & QUALITY CONTROL Section A. Section B. Section C. Introduction Definitions and Terms Laboratory QA/QC 1. Sample Preservation and Holding Times 2. Sample Receiving 3. Sample
TNI Standard; EL-V1M4 Sections and (Detection and Quantitation) page1 of 8. TNI Standard VOLUME 1 MODULE 4
 page1 of 8. TNI Standard VOLUME 1 MODULE 4") page1 of 8 TNI Standard VOLUME 1 MODULE 4 QUALITY SYSTEMS FOR CHEMICAL TESTING SECTIONS 1.5.1 AND 1.5.2 January 2016 Description This TNI Standard has been taken through all of the voting stages and has
page1 of 8 TNI Standard VOLUME 1 MODULE 4 QUALITY SYSTEMS FOR CHEMICAL TESTING SECTIONS 1.5.1 AND 1.5.2 January 2016 Description This TNI Standard has been taken through all of the voting stages and has
EPA's Revision to the 40 CFR Part 136 Method Detection Limit (MDL) Procedure
 Procedure") Ask The Expert Webinar Series EPA's Revision to the 40 CFR Part 136 Method Detection Limit (MDL) Procedure Richard Burrows, Ph.D. Corporate Technical Director A Revision to the Method Detection Limit EPA
Ask The Expert Webinar Series EPA's Revision to the 40 CFR Part 136 Method Detection Limit (MDL) Procedure Richard Burrows, Ph.D. Corporate Technical Director A Revision to the Method Detection Limit EPA
Water Quality Reporting Limits, Method Detection Limits, and Censored Values: What Does It All Mean?
 Water Quality Reporting Limits, Method Detection Limits, and Censored Values: What Does It All Mean? Bradley J. Austin, J. Thad Scott, Mike Daniels and Brian E. Haggard Arkansas Water Resources Center
Schedule. Draft Section of Lab Report Monday 6pm (Jan 27) Summary of Paper 2 Monday 2pm (Feb 3)
 Summary of Paper 2 Monday 2pm (Feb 3)") Schedule Assignment Due Date Draft Section of Lab Report Monday 6pm (Jan 27) Quiz for Lab 2 Peer Review of Draft Complete Lab Report 1 Tuesday 9:30am Wednesday 6pm Friday 6pm Summary of Paper 2 Monday
Schedule Assignment Due Date Draft Section of Lab Report Monday 6pm (Jan 27) Quiz for Lab 2 Peer Review of Draft Complete Lab Report 1 Tuesday 9:30am Wednesday 6pm Friday 6pm Summary of Paper 2 Monday
Method Validation and Accreditation
 SELAMAT Mycotoxins Workshop China, 11-15th December 2006 Method Validation and Accreditation Dr Hamide Z Şenyuva Senior Research Scientist TÜBİTAK-ATAL, TURKEY hamide.senyuva@tubitak.gov.tr SELAMAT Mycotoxins
IE 316 Exam 1 Fall 2011
 IE 316 Exam 1 Fall 2011 I have neither given nor received unauthorized assistance on this exam. Name Signed Date Name Printed 1 1. Suppose the actual diameters x in a batch of steel cylinders are normally
Measurement Uncertainty: A practical guide to understanding what your results really mean.
 Measurement Uncertainty: A practical guide to understanding what your results really mean. Overview General Factors Influencing Data Variability Measurement Uncertainty as an Indicator of Data Variability
Uncertainty, Error, and Precision in Quantitative Measurements an Introduction 4.4 cm Experimental error
 Uncertainty, Error, and Precision in Quantitative Measurements an Introduction Much of the work in any chemistry laboratory involves the measurement of numerical quantities. A quantitative measurement
Laboratory ID. Laboratory Name. Analyst(s) Auditor. Date(s) of Audit. Type of Audit Initial Biennial Special ELCP TNI/NELAP.
 Auditor. Date(s) of Audit. Type of Audit Initial Biennial Special ELCP TNI/NELAP.") NEW JERSEY DEPARTMENT OF ENVIRONMENTAL PROTECTION OFFICE OF QUALITY ASSURANCE ENVIRONMENTAL LABORATORY CERTIFICATION PROGRAM ON-SITE LABORATORY EVALUATION RADIOCHEMISTRY PROCEDURES Gross Alpha-Gross Beta
NEW JERSEY DEPARTMENT OF ENVIRONMENTAL PROTECTION OFFICE OF QUALITY ASSURANCE ENVIRONMENTAL LABORATORY CERTIFICATION PROGRAM ON-SITE LABORATORY EVALUATION RADIOCHEMISTRY PROCEDURES Gross Alpha-Gross Beta
How to Describe Accuracy
 OK, so what s s the speed of dark? When everything is coming your way, you're obviously in the wrong lane MARS 450 Thursday, Feb 14 2008 A) Standard deviation B) Student s t-test - Test of a mean C) Q-test
NATIONAL ASSOCIATION OF TESTING AUTHORITIES (NATA) REQUIREMENTS FOR ACCREDITATION OF ICP-MS TECHNIQUES
 REQUIREMENTS FOR ACCREDITATION OF ICP-MS TECHNIQUES") NATIONAL ASSOCIATION OF TESTING AUTHORITIES (NATA) REQUIREMENTS FOR ACCREDITATION OF ICP-MS TECHNIQUES The National Association of Testing Authorities (NATA) requirements for accreditation have undergone
NATIONAL ASSOCIATION OF TESTING AUTHORITIES (NATA) REQUIREMENTS FOR ACCREDITATION OF ICP-MS TECHNIQUES The National Association of Testing Authorities (NATA) requirements for accreditation have undergone
1 Normal Distribution.
 Normal Distribution.. Introduction A Bernoulli trial is simple random experiment that ends in success or failure. A Bernoulli trial can be used to make a new random experiment by repeating the Bernoulli
ANALYTICAL METHODS & QUALITY CONTROL
 CHAPTER 6 ANALYTICAL METHODS & QUALITY CONTROL Section A. Section B. Section C. Introduction Definitions and Terms Laboratory QA/QC 1. Sample Preservation and Holding Times 2. Sample Receiving 3. Sample
Assessment of Accuracy and Precision
 2 chapter Assessment of Accuracy and Precision S.S. Nielsen, Food Analysis Laboratory Manual, Food Science Texts Series, DOI 10.1007/978-1-4419-1463-7_2, Springer Science+Business Media, LLC 2010 9 Chapter
1.11 Measurement Uncertainty
 Document #: 4968 Page 1 of 10 1.11 Measurement Uncertainty In an effort to comply with accreditation requirements, and because scientific measurements in general are subject to variability, a budget estimating
9/2/2010. Wildlife Management is a very quantitative field of study. throughout this course and throughout your career.
 Introduction to Data and Analysis Wildlife Management is a very quantitative field of study Results from studies will be used throughout this course and throughout your career. Sampling design influences
Precision and Accuracy Assessing your Calorimeter
 Bulletin No. 100 Precision and Accuracy Assessing your Calorimeter How to determine the range of acceptable results for your calorimeter. Standard methods specify parameters by which calorimetry results
Objective Experiments Glossary of Statistical Terms
 Objective Experiments Glossary of Statistical Terms This glossary is intended to provide friendly definitions for terms used commonly in engineering and science. It is not intended to be absolutely precise.
LAMBTON SCIENTIFIC (A Division of Technical Chemical Services Inc.)
") LAMBTON SCIENTIFIC (A Division of Technical Chemical Services Inc.) SOP-316 391 S. Vidal St., Sarnia, Ontario, N7T 7L1 Phone: (519) 344-4747 Fax: (519) 344-2350 E-Mail: info@lambtonscientific.com Method
LAMBTON SCIENTIFIC (A Division of Technical Chemical Services Inc.) SOP-316 391 S. Vidal St., Sarnia, Ontario, N7T 7L1 Phone: (519) 344-4747 Fax: (519) 344-2350 E-Mail: info@lambtonscientific.com Method
03.1 Experimental Error
 03.1 Experimental Error Problems: 15, 18, 20 Dr. Fred Omega Garces Chemistry 251 Miramar College 1 Making a measurement In general, the uncertainty of a measurement is determined by the precision of the
Is the laboratory s pledge or declaration of the quality of the results produced. to produce data compliant with the Safe Drinking Water Act (SDWA)
") QA/QC Is the laboratory s pledge or declaration of the quality of the results produced. to produce data compliant with the Safe Drinking Water Act (SDWA) Is a description of the policies, procedures, techniques
QA/QC Is the laboratory s pledge or declaration of the quality of the results produced. to produce data compliant with the Safe Drinking Water Act (SDWA) Is a description of the policies, procedures, techniques
Precision and Accuracy Assessing your Calorimeter
 Bulletin No. 100 Precision and Accuracy Assessing your Calorimeter How to determine the range of acceptable results for your calorimeter. Standard methods specify parameters by which calorimetry results
Chapter 15. Quality Assurance. In Chapter 14 we discussed the process of developing a standard method, including optimizing.
 Chapter 15 Chapter Overview Quality Assurance Section 15A The Analytical Perspective Revisited Section 15B Quality Control Section 15C Quality Assessment Section 15D Evaluating Quality Assurance Data Section
Guideline/SOP: Handling of Laboratory Gross Errors/Data History
 Guideline/SOP: Handling of Laboratory Gross Errors/Data History Introduction Laboratory gross errors are events in the laboratory that may produce erroneous results and can be usually attributed to either
Direct Determination of Aluminium in Milk by Graphite Furnace Atomic Absorption Spectrometry
 Direct Determination of Aluminium in Milk by Graphite Furnace Atomic Absorption Spectrometry NOTICE: This method has been developed by the EURL-CEFAO using the facilities available in its laboratories.
Liquid Scintillation Counter
 Instrumentation & Methods: s & Tritium Richard Sheibley Pennsylvania Dept of Env Protection Principle Beta particle emission Energy transferred to Solute Energy released as UV Pulse Intensity proportional
Biol/Chem 4900/4912. Forensic Internship Lecture 5
 Biol/Chem 4900/4912 Forensic Internship Lecture 5 Quality Assurance/ Quality Control Quality Assurance A set of activities that ensures that development and/or maintenance processes are adequate in order
Uncertainty of Measurement (Analytical) Maré Linsky 14 October 2015
 Maré Linsky 14 October 2015") Uncertainty of Measurement (Analytical) Maré Linsky 14 October 015 Introduction Uncertainty of Measurement GUM (Guide to the Expression of Uncertainty in Measurement ) (Analytical) Method Validation and
Uncertainty of Measurement (Analytical) Maré Linsky 14 October 015 Introduction Uncertainty of Measurement GUM (Guide to the Expression of Uncertainty in Measurement ) (Analytical) Method Validation and
VOTING DRAFT STANDARD
 page 1 of 7 VOTING DRAFT STANDARD VOLUME 1 MODULE 4 QUALITY SYSTEMS FOR CHEMICAL TESTING SECTIONS 1.5.1 AND 1.5.2 Description This Voting Draft Standard is a proposed revision of the 2009 standard (EL-
Control Charts Confidence Interval Student s t test. Quality Control Charts. Confidence Interval. How do we verify accuracy?
 Control Charts Confidence Interval Student s t test How do we verify accuracy? Quality Control Charts µ is known or assumed σ is known 3σ action line: 1 in 500 2.5 s action 1 in 100 (99%) 2σ warning: 1
-However, this definition can be expanded to include: biology (biometrics), environmental science (environmetrics), economics (econometrics).
, environmental science (environmetrics), economics (econometrics).") Chemometrics Application of mathematical, statistical, graphical or symbolic methods to maximize chemical information. -However, this definition can be expanded to include: biology (biometrics), environmental
Chemometrics Application of mathematical, statistical, graphical or symbolic methods to maximize chemical information. -However, this definition can be expanded to include: biology (biometrics), environmental
ADVANCED ANALYTICAL LAB TECH (Lecture) CHM
 CHM") ADVANCED ANALYTICAL LAB TECH (Lecture) CHM 4130-0001 Spring 2013 Professor Andres D. Campiglia Textbook: Principles of Instrumental Analysis Skoog, Holler and Crouch, 5 th Edition, 6 th Edition or newest
ADVANCED ANALYTICAL LAB TECH (Lecture) CHM 4130-0001 Spring 2013 Professor Andres D. Campiglia Textbook: Principles of Instrumental Analysis Skoog, Holler and Crouch, 5 th Edition, 6 th Edition or newest
IE 361 Exam 1 October 2004 Prof. Vardeman
 October 5, 004 IE 6 Exam Prof. Vardeman. IE 6 students Demerath, Gottschalk, Rodgers and Watson worked with a manufacturer on improving the consistency of several critical dimensions of a part. One of
Hach Method Total Organic Carbon in Finished Drinking Water by Catalyzed Ozone Hydroxyl Radical Oxidation Infrared Analysis
 Hach Method 1061 Total Organic Carbon in Finished Drinking Water by Catalyzed Ozone Hydroxyl Radical Oxidation Infrared Analysis Hach Company Method 1061 Revision 1. December 015 Organic Carbon in Finished
High-Speed Environmental Analysis Using the Agilent 7500cx with Integrated Sample Introduction System Discrete Sampling (ISIS DS)
") High-Speed Environmental Analysis Using the Agilent 7500cx with Integrated Sample Introduction System Discrete Sampling (ISIS DS) Application Note Environmental Authors Steve Wilbur Agilent Technologies,
High-Speed Environmental Analysis Using the Agilent 7500cx with Integrated Sample Introduction System Discrete Sampling (ISIS DS) Application Note Environmental Authors Steve Wilbur Agilent Technologies,
A. Incorrect! Replacing is not a method for solving systems of equations.
 ACT Math and Science - Problem Drill 20: Systems of Equations No. 1 of 10 1. What methods were presented to solve systems of equations? (A) Graphing, replacing, and substitution. (B) Solving, replacing,
Statistical Analysis of Engineering Data The Bare Bones Edition. Precision, Bias, Accuracy, Measures of Precision, Propagation of Error
 Statistical Analysis of Engineering Data The Bare Bones Edition (I) Precision, Bias, Accuracy, Measures of Precision, Propagation of Error PRIOR TO DATA ACQUISITION ONE SHOULD CONSIDER: 1. The accuracy
T.I.H.E. IT 233 Statistics and Probability: Sem. 1: 2013 ESTIMATION AND HYPOTHESIS TESTING OF TWO POPULATIONS
 ESTIMATION AND HYPOTHESIS TESTING OF TWO POPULATIONS In our work on hypothesis testing, we used the value of a sample statistic to challenge an accepted value of a population parameter. We focused only
Method Update Rule of 2015: New Method Detection Limit MDL Determination. David Caldwell OK DEQ Laboratory Accreditation Program
 Method Update Rule of 2015: New Method Detection Limit MDL Determination David Caldwell OK DEQ Laboratory Accreditation Program Final Rule Method Update Rule of 2015: This action has been withdrawn from
Ohio EPA Total (Extracellular and Intracellular) Microcystins - ADDA by ELISA Analytical Methodology Ohio EPA DES Version 2.
 Microcystins - ADDA by ELISA Analytical Methodology Ohio EPA DES Version 2.") Ohio EPA Total (Extracellular and Intracellular) Microcystins - ADDA by ELISA Analytical Methodology Ohio EPA DES 701.0 Version 2.3 July 2018 1. SCOPE AND APPLICATION This method is used for the determination
Ohio EPA Total (Extracellular and Intracellular) Microcystins - ADDA by ELISA Analytical Methodology Ohio EPA DES 701.0 Version 2.3 July 2018 1. SCOPE AND APPLICATION This method is used for the determination
Chem 321 Lecture 4 - Experimental Errors and Statistics 9/5/13
 Chem 321 Lecture 4 - Experimental Errors and Statistics 9/5/13 Student Learning Objectives Experimental Errors and Statistics The tolerances noted for volumetric glassware represent the accuracy associated
CS110 Personal Computing 1
 CS110 Personal Computing FORMULAS Understanding formulas The trainings are starting to introduce basic formulas and functions We re also starting to look at the statistical analysis part of the class We
MICROPIPETTE CALIBRATIONS
 Physics 433/833, 214 MICROPIPETTE CALIBRATIONS I. ABSTRACT The micropipette set is a basic tool in a molecular biology-related lab. It is very important to ensure that the micropipettes are properly calibrated,
Basic Statistics. 1. Gross error analyst makes a gross mistake (misread balance or entered wrong value into calculation).
.") Basic Statistics There are three types of error: 1. Gross error analyst makes a gross mistake (misread balance or entered wrong value into calculation). 2. Systematic error - always too high or too low
Basic Statistics There are three types of error: 1. Gross error analyst makes a gross mistake (misread balance or entered wrong value into calculation). 2. Systematic error - always too high or too low
Deep Algebra Projects: Algebra 1 / Algebra 2 Go with the Flow
 Deep Algebra Projects: Algebra 1 / Algebra 2 Go with the Flow Topics Solving systems of linear equations (numerically and algebraically) Dependent and independent systems of equations; free variables Mathematical
Standard Operating Procedure for: Conductivity Using Cole-Parmer Traceable Portable Conductivity Meter. Missouri State University.
 Standard Operating Procedure for: Conductivity Using Cole-Parmer Traceable Portable Conductivity Meter Missouri State University and Ozarks Environmental and Water Resources Institute (OEWRI) Prepared
CS 160: Lecture 16. Quantitative Studies. Outline. Random variables and trials. Random variables. Qualitative vs. Quantitative Studies
 Qualitative vs. Quantitative Studies CS 160: Lecture 16 Professor John Canny Qualitative: What we ve been doing so far: * Contextual Inquiry: trying to understand user s tasks and their conceptual model.
Uncertainties in AH Physics
 Advanced Higher Physics Contents This booklet is one of a number that have been written to support investigative work in Higher and Advanced Higher Physics. It develops the skills associated with handling
Human anti-deoxyribonuclease B, anti-dnase B ELISA Kit
 Human anti-deoxyribonuclease B, anti-dnase B ELISA Kit Catalog No: E0311h 96 Tests Operating instruction www.eiaab.com FOR RESEARCH USE ONLY; NOT FOR THERAPEUTIC OR DIAGNOSTIC APPLICATIONS! PLEASE READ
Regulatory and Alternative Analytical Procedures are defined as follows 2 :
 Title: Alternative Analytical Method Validation in Pharmaceuticals: Replacing a Regulatory Analytical Method in Cleaning Validation Authors: Stephen Lawson, Will McHale and Brian Wallace This re titled
STANDARD OPERATING PROCEDURE (SOP) FOR ESTIMATION OF DIETARY INTAKE OF SODIUM (DIS) IN 24 HOUR URINE USING ELECTROLYTE ANALYZER
 FOR ESTIMATION OF DIETARY INTAKE OF SODIUM (DIS) IN 24 HOUR URINE USING ELECTROLYTE ANALYZER") STANDARD OPERATING PROCEDURE (SOP) FOR ESTIMATION OF DIETARY INTAKE OF SODIUM (DIS) IN 24 HOUR URINE USING ELECTROLYTE ANALYZER Estimation of Dietary Intake of Sodium (DIS) in 24h Urine on electrolyte
STANDARD OPERATING PROCEDURE (SOP) FOR ESTIMATION OF DIETARY INTAKE OF SODIUM (DIS) IN 24 HOUR URINE USING ELECTROLYTE ANALYZER Estimation of Dietary Intake of Sodium (DIS) in 24h Urine on electrolyte
Test Method: CPSC-CH-E
 UNITED STATES CONSUMER PRODUCT SAFETY COMMISSION DIRECTORATE FOR LABORATORY SCIENCES DIVISION OF CHEMISTRY 10901 DARNESTOWN RD GAITHERSBURG, MD 20878 Test Method: CPSC-CH-E1001-08 Standard Operating Procedure
Relationships between variables. Visualizing Bivariate Distributions: Scatter Plots
 SFBS Course Notes Part 7: Correlation Bivariate relationships (p. 1) Linear transformations (p. 3) Pearson r : Measuring a relationship (p. 5) Interpretation of correlations (p. 10) Relationships between
Technical Notes & Troubleshooting in ELISA
 PISHTAZ TEB DIAGNOSTICS Technical Notes & Troubleshooting in ELISA DR. MEHDI BOUTORABI DR. ALI MIRJALILI CONTENTS Kit Selection Introduction to Brochure and related points Test provision : Equipment calibration
Weather Prediction Using Historical Data
 Weather Prediction Using Historical Data COMP 381 Project Report Michael Smith 1. Problem Statement Weather prediction is a useful tool for informing populations of expected weather conditions. Weather
CCME Reference Method for the Canada-Wide Standard for Petroleum Hydrocarbons (PHC) in Soil - Tier 1 Method
 in Soil - Tier 1 Method") Rating Guide Appendix for the CCME Reference Method for the Canada-Wide Standard for Petroleum (PHC) in Soil - Tier 1 Method (Note: Checklist incorporates requirements from Dec 2000 version + Addendum
Rating Guide Appendix for the CCME Reference Method for the Canada-Wide Standard for Petroleum (PHC) in Soil - Tier 1 Method (Note: Checklist incorporates requirements from Dec 2000 version + Addendum
SCIENTIFIC INQUIRY AND CONNECTIONS. Recognize questions and hypotheses that can be investigated according to the criteria and methods of science
 SUBAREA I. COMPETENCY 1.0 SCIENTIFIC INQUIRY AND CONNECTIONS UNDERSTAND THE PRINCIPLES AND PROCESSES OF SCIENTIFIC INQUIRY AND CONDUCTING SCIENTIFIC INVESTIGATIONS SKILL 1.1 Recognize questions and hypotheses
0.27 Sample Preparation
 0.7 Sample Preparation Problems: 3, 11 Dr. Fred Omega Garces Chemistry 51 Miramar College 1 Sample Preparation 5/5/1 Doping Catching the Dopers coming soon this August Sample Preparation 5/5/1 Chemical
Unit 4 Systems of Equations Systems of Two Linear Equations in Two Variables
 Unit 4 Systems of Equations Systems of Two Linear Equations in Two Variables Solve Systems of Linear Equations by Graphing Solve Systems of Linear Equations by the Substitution Method Solve Systems of
Topic 2 Measurement and Calculations in Chemistry
 Topic Measurement and Calculations in Chemistry Nature of Measurement Quantitative observation consisting of two parts. number scale (unit) Examples 0 grams 6.63 10 34 joule seconds The Fundamental SI
CALCULATION OF UNCERTAINTY IN CHEMICAL ANALYSIS. A.Gnanavelu
 CALCULATION OF UNCERTAINTY IN CHEMICAL ANALYSIS A.Gnanavelu UNCERTAINTY (U) Every measurement has error which is unknown and unknowable. This unknown error is called measurement uncertainty. Types of Error
Aflatoxin Analysis: Uncertainty Statistical Process Control Sources of Variability. COMESA Session Five: Technical Courses November 18
 Aflatoxin Analysis: Uncertainty Statistical Process Control Sources of Variability COMESA Session Five: Technical Courses November 18 Uncertainty SOURCES OF VARIABILITY Uncertainty Budget The systematic
Quality Control Procedures for Graphite Furnace AAS using Avanta Software
 Application Note Quality Control Procedures for Graphite Furnace AAS using Avanta Software Introduction With the arrival of quality standards in the analytical laboratory, an ever increasing emphasis is
Zinc Metal Determination Perkin Elmer Atomic Absorption Spectrometer AAnalyst Procedures
 Villanova University Date: Oct 2011 Page 1 of 9 Villanova University Villanova Urban Stormwater Partnership Watersheds Laboratory Standard Operating Procedure VUSP F Zinc Metal Determination Perkin Elmer
Glossary of Common Laboratory Terms
 Accuracy A measure of how close a measured value is to the true value. Assessed by means of percent recovery of spikes and standards. Aerobic Atmospheric or dissolved oxygen is available. Aliquot A measured
Standard Operating Procedure for Performing a QA Review of an Aldehyde Data Batch
 North Carolina Division of Air Quality Quality Assurance Project Plan 2.52 Aldehydes by TO-11a Section 4.1 Raleigh Central Office Responsibilities Aldehyde Data Review Section 2.52.4.1 Page 1 of 7 Standard