MOLECULAR ABSORPTION METHODS
|
|
|
- Meryl McCoy
- 5 years ago
- Views:
Transcription
1 MOLECULAR ABSORPTION METHODS Absorption spectroscopy refers to spectroscopic techniques that measure the absorption of radiation, as a function of wavelength ( absorption spectrum ), due to its interaction with sample molecules in solution. The intensity of the absorption is direct proportional to the sample concentration. Absorption spectroscopy is performed across the electromagnetic spectrum. However molecular absorption spectroscopy in the UV/Vis region is applied for the qualitative and quantitative analysis of organic and inorganic compounds and it will be the subject of this unit.
2 Absorption methods require two power measurements: one before a beam has passed through the medium that contains the analyte (P o ) and the other after the sample (P). Two terms, which are widely used in absorption spectrometry and are related to the ratio of P o and P, are transmittance and absorbance.
3 Beer s Law The relative amount of a certain wavelength of light absorbed (A) that passes through a sample is dependent on: - distance the light must pass through the sample (cell path length - b) - amount of absorbing chemicals in the sample (analyte concentration c) - ability of the sample to absorb light (molar absorptivity - Ɛ) Concentration C P 0 P b
4 Beer s Law The relative amount of light making it through the sample (P/P o ) is known as the transmittance (T) T P P o Percent transmittance % T 100 P P o

 A log P P o log( T)")

5 Beer s Law Absorbance (A) is the relative amount of light absorbed by the sample and is related to transmittance (T) A log P P o log( T) log( %T / 100) T has a range of 0 to 1, %T has a range of 0 to 100% A has a range of 0 to infinity

6 Beer s Law Spectrophotometers measure transmittance but transmittance is not linear when plotted against concentration. Therefore, we convert transmittance to absorbance because the relationship between absorbance and concentration is linear as we will see shortly.
7 Beer s Law Absorbance is directly related to the analyte concentration, cell path length and molar absorptivity. This relationship is known as Beer s Law A = abx A bc where: A = absorbance (no units) Ɛ = molar absorptivity (L/mole-cm) b = cell pathlength (cm) c = concentration of analyte (mol/l) x = Concentration in any unit rather than mol/l. a = absorptivity using x unit.
8 The Molar Absorptivity Ɛ It is clear that Ɛ is an important element in Beer's law expression. It is an indicator of sensitivity. As Ɛ increases, it becomes easier to determine lower concentrations of analytes. The molar absorptivity has large values for π > π* transitions ranging from 1000 to L cm-1 mol-1. For n > π * transitions, Ɛ ranges from L cm-1 mol-1. This means that the most important transition in UV-Vis is the π > π* transition and, therefore, will be subjected to further studies in different solvents as we will see shortly.
9 Calibration To measure the absorbance of a sample, it is necessary to measure P o and P ratio P o is measured with a blank cell A blank cell contains all components in the sample solution except the analyte of interest P is measured by placing the sample in the cell. To accurately measure an unknown concentration, obtain a calibration curve using a range of known concentrations for the analyte. The greater the absorbance of a compound at a given wavelength (high Ɛ), the easier it will be detected at low concentrations.

10 The relationship between the analyte concentration and the absorbance is linear. Standard solutions Blank is solution identical to sample but without analyte. Ɛ = A / C when b = 1

11 Analysis of a mixture containing two compounds M and N
12 The above spectrum of the mixture shows that there is obviously no wavelength at which the absorbance of this mixture is due simply to one of the components; thus an analysis for either M or N by a single measurement is not possible. However, the absorbance of the mixture at the wavelengths ʎ 1 and ʎ 2 may be expressed as follows: At l 1 : At l 2 : A A M bc 2 M M bc M 1 N 2 N bc bc N N
13 The four molar absorptivities Ɛ,, Ɛ 1 M1 Ɛ 2 M N, and Ɛ 1 N can be evaluated from standard solutions containing only M or N. Then, if the absorbance of the mixture are measured at ʎ 1 and ʎ 2, the concentration of the individual components can be calculated by solving the two equations given above simultaneously. The best accuracy in an analysis of this sort is obtained by choosing wavelengths at which the differences in molar absorptivities between the two ions is large.
14 Limitations in Beer s Law Beer's law suggests direct proportionality between Absorbance and concentration and that a straight line relationship should be obtained. However, some of the following factors can lead to different behavior :
15 1. Concentration It is observed that only solutions that are less than 0.01 M can result is successful application of Beer's law. High concentrations of analyte lead to interactions between neighboring molecules resulting in a change in the absorbance characteristics of molecules. i.e. shifts in chemical equilibria as a function of concentration. 2. Monochromatic Light Beer's law is valid only when a monochromatic radiation is used. 3. Stray Radiation Fluorescence or phosphorescence of the sample or scattering of light due to particulates in the sample solution.
16 4. Refractive Index The application of Beer's law requires the measurement of the absorbance of different concentrations. Since Ɛ is dependent on refractive index, it is expected that solutions for which the refractive index changes a lot with concentration will show a deviation from Beer's law. 5. Chemical Reactions or Transformations If an analyte reacts with any species or dissociates forming species of different absorption characteristics, the absorbance may not necessarily be as predicted by Beer's law.
17 Example: A 3.96x10⁻⁴ M solution of compound A exhibited an absorbance of at 238 nm in a cm cuvette. A blank had an absorbance of The absorbance of an unknown solution of compound A was Find the concentration of A in the unknown? Solution : Absorbance due to standard = = Absorbance due to unknown = = Ɛ = A / bc = / ( 1 X 3.96 X 10-4 ) = c = A / Ɛ b = / ( 1X ) = 2.3 X10⁻⁴ M
18 Example : A M solution of X had an absorbance of at 267 nm in a 1.00 cm cuvette, and an absorbance of at 240 nm. A M solution of Y had absorbances of and at 267 and 240 nm, respectively. A mixture of X and Y had absorbances of and at 267 and 240 nm, respectively. Calculate the concentration of X and Y in the mixture?
19 Solution : For a mixture analysis using Beer's Law, the general rule would be: A = Ɛb [X] + Ɛb [Y], at a given wavelength. That is, the absorbance is equal to each individual component. You can find both concentrations if you know the molar absorptivity of all components involved. So let's find the molar absorptivity: Ɛ = A/b[ ], with b = 1.00 cm, so Ɛ = A/[ ] Ɛ at 240 nm: X: Ɛ = / = Y: Ɛ = / = Ɛ at 267 nm: X: Ɛ = / = Y: e = / = 20.63
20 You will now have 2 equations: A = Ɛ [X] + Ɛ [Y] at 240 nm A = Ɛ [X] + Ɛ [Y] at 267 nm Plug in the molar absorptivity and the mixture absorbances the A at their respective wavelengths. This will give you 2 equations with 2 unknowns = 18.76C[X] C[Y] = C[X] C[Y] Solve the linear system of equations and you get: [X] = M and [Y] = M So the mixture contains M of X and M of Y.
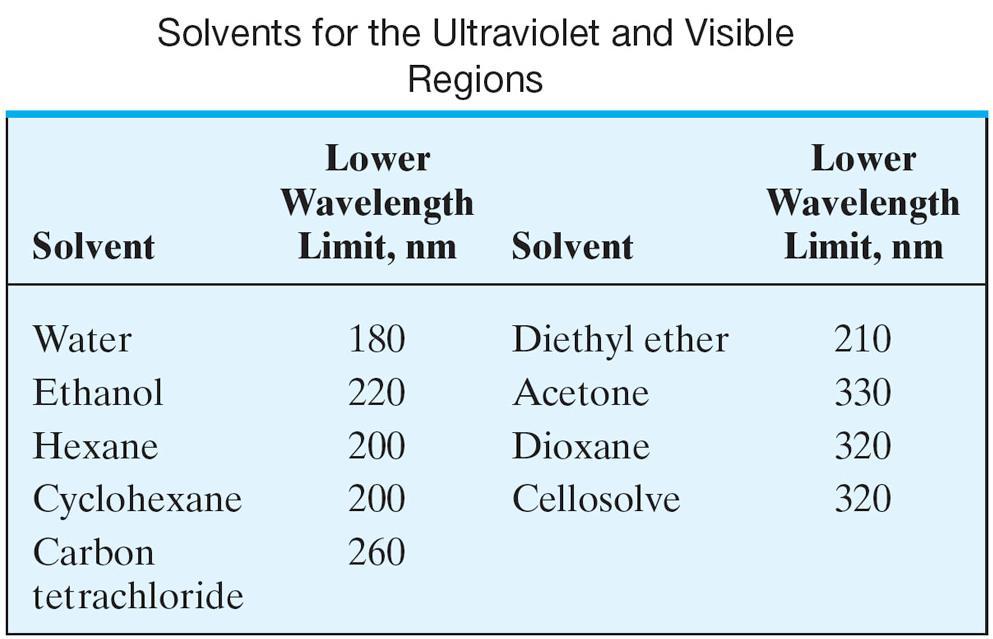
21 SPECTROPHOTOMETER : SEE UNIT 3 1- Light source Tungsten lamp: VIS.(320 nm~2500 nm) Deuterium lamp: UV (200~400 nm) 2- Monochromator consists : - lenses and mirrors: focus the radiation. - entrance and exit slits: restrict unwanted and control the spectral purity of radiation. - dispersing medium: separate the ʎ max from polychromatic radiation of the source. (a) prism and (b) diffraction grating.

22 3- Sample Cell : sample container of fixed length. Usually round or square cell. Made of material that does not absorb light in the wavelength range of interest - Glass visible region - Quartz ultraviolet
23 4- Detector Convert radiant energy (photons) into an electrical current. Ideal detector should has high sensitivity, high signal/noise ratio, constant response for λs, and fast response time. The most commonly used detector is photomultiplier tube which is very sensitive.
24 Types of Spectrophotometers 1- Single-Beam Instrument sample and blank are alternatively measured in same sample 2- chamber. Double-Beam Instrument which has many advantages over single beam where it continuously compares sample and blank Automatically and corrects for changes in electronic signal or light intensity of source. For more details see unit 3.
25 What Happens When a Molecule Absorbs Light? - Combined electronic, vibrational and rotational Transitions. - Absorption of radiation by a molecule will cause electronic, vibrational and rotational transitions. - There are multiple vibrational and rotational energy levels associated with each electronic state. Therefore, transition between electronic states or within one electronic state can occur between different vibrational and rotational states.

26 Energy: Electronic >> Vibrational > Rotational Vibrational and rotational states associated with an electronic state
27 Absorption Spectrum Different chemicals have different energy levels ( electronic, vibrational and rotational levels). Therefore they will have different abilities to absorb light at any given wavelength i.e. different absorption spectrum. plot of absorbance (or Ɛ) vs. wavelength for a compound is its spectrum. For more details see unit 2.
28 chromophores When atoms combined to form a molecule three types of molecular orbitals will be formed, ϭ ( C-C ), π ( C=C or C C ) and n ( N,O,S, X ). Normally electrons are in these orbitals but when the molecule absorb nm radiation, these electrons will move to higher excited molecular orbitals ϭ * or π *. Groups in a molecule which absorb light are known as chromophores e.g C = C, C C, C = O, N = O. See the following Table. Molecules having unsaturated bonds ( double or triple bonds ) or free nonbonding electrons ( n free electrons ) can absorb radiation. Examples include alkenes, alkynes, ketones, aldehydes, phenyl and other aromatic species.

29 We will explain what happens when organic compounds absorb UV or visible light, and why the wavelength of light absorbed varies from compound to compound. When a molecule absorbs EM radiation, four types of electronic transitions may occur :.

30 The important jumps are shown in red, and a less important one in green. The black arrows show jumps which absorb light outside the region of the spectrum that we are working in ( UV Vis ).
31 Chromophore Example Excitation λ max, nm ε Solvent C=C Ethene π > π* hexane C C 1-Hexyne π > π* 180 1oooo hexane C=O N=O C-X X = I or Br C - C n > π * Formaldhyde Nitromethane Methyl bromide Methyl Iodide Saturated compds (Solvents )? n > π* π > π* n > π* π > π* n > σ* n > σ* ϭ > ϭ* hexane hexane ethanol ethanol hexane hexane Shorter λ than uv-vis region < 200 nm π > π * allowed Not allowed by the selection rules but sometimes it happens
32 ϭ > ϭ* An electron in a bonding ϭ orbital of a molecule is excited to the corresponding anti-bonding orbital ϭ* as a result of it s absorption of radiation. To induce ϭ > ϭ* transitions it required a larger energy ( < 190 nm ) than uv or vis. Example : Methane contain only single C-H bonds that undergo only transition, it gives absorption maximum at 125 nm. ϭ > ϭ*
33 n > π* and π > π* Most organic compounds undergo n > π* and π > π* transitions. π > π* transitions are generally intense and more important while n > π* transitions are weak. For example acetone exhibits a high π > π* transition peak at 195 nm and a weak n > π* transition peak at 274 nm. See the following spectrum. The energy required for these transitions can be obtained from sources operating in the UV-Vis range.
34 n > π* and π > π* transitions require unsaturated functional groups ( double bonds, triple bonds and N or O or halides atoms ), most commonly used in uv/vis absorption.
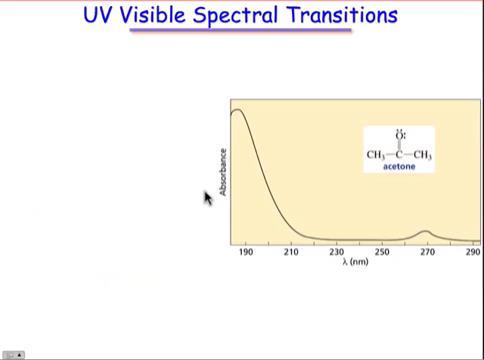
35
36 n > ϭ* transitions In this type saturated compounds containing atoms with unshared electrons pairs ( N,O,S and halogens atoms ) undergo n > ϭ* transitions. Example : Methyl chloride CH 3 Cl. It requires less energy than the ϭ > ϭ* type. Most of the absorption peaks appear below 200 nm which is out side our range ( nm ). The absorption intensity is indication of the probability of the transition i.e. whether the transition is allowed or not by the selection rules.
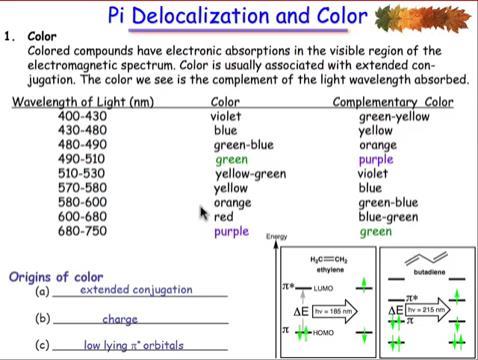
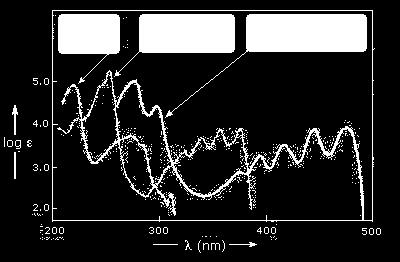
37 The importance of conjugation and delocalization Consider these three molecules: CH 2 = CH 2 ethen λ max = 171 nm CH 2 = CH CH = CH 2 buta 1,3 diene λ max = 258 nm CH = CH CH = CH CH = CH 2 hexa 1,3,5 - triene λ max = 271 nm Ethene contains a simple one isolated carbon-carbon double bond, but the other two have conjugated double bonds. In these cases, there is delocalization ( stability ) of the π bonding orbitals over the whole molecule. Now look at the wavelengths of the light which each of these molecules absorbs..
38 All of the molecules give similar UV-visible absorption spectra the only difference being that the absorptions move to longer and longer wavelengths as the amount of delocalization in the molecule increases. As conjugation is increased in a molecule, more delocalization (stability) of the π electrons results. The effect of this delocalization is to decrease the π* molecular orbital. The result is a decrease in transition energy from π -π*and thus a bathochromic shift. The molar absorptivity will increase in this case and better quantitative analysis will be achieved. See the following figure.
39
 is a π* anti-bonding orbital. Notice that the gap between these has fallen.")
40 The highest occupied molecular orbital is often referred to as the HOMO - in these cases, it is a π bonding orbital. The lowest unoccupied molecular orbital (the LUMO) is a π* anti-bonding orbital. Notice that the gap between these has fallen. It takes less energy to excite an electron in the buta- 1,3-diene case than with ethene. In the hexa-1,3,5-triene case, it is less still. π* π
41 The maximum absorption is moving to longer wavelengths as the amount of delocalization increases. Therefore maximum absorption is moving to shorter frequencies as the amount of delocalization increases. Therefore absorption needs less energy as the amount of delocalization increases. Therefore there must be less energy gap between the bonding and anti-bonding orbitals as the amount of delocalization increases.
42 If you extend this to compounds with really massive delocalization, the wavelength absorbed will eventually be long enough to be in the visible region of the spectrum, and the compound will then be seen as colored. A good example of this is the beta-carotene present in carrots :
43

44 A chromophore producing two peaks A chromophore such as the carbon-oxygen double bond in formaldehyde, for example, obviously has π electrons as a part of the double bond, but also has lone pairs on the oxygen atom. That means that both of the important absorptions from the last energy diagram are possible. You can get an electron excited from a π bonding to a π * anti-bonding orbital, or you can get one excited from an oxygen lone pair (a non-bonding orbital) into a π * antibonding orbital.. formaldehyde e - e- +
45 The non-bonding orbital n has a higher energy than a π bonding orbital. That means, the jump from an oxygen lone pair into a π * anti-bonding orbital needs less energy. That means also it absorbs light of a lower frequency and therefore a longer wavelength. formaldehyde can therefore absorb light of two different wavelengths: the π bonding to π * anti-bonding absorption peaks at 180 nm; the non-bonding n to π * anti-bonding absorption peaks at 290 nm. Both of these absorptions are in the ultra-violet, but most spectrometers won't pick up the one at 180 nm because they work in the range from nm.
46 Auxochrome It is the group which itself does not act as a chromophore but when attached to chromophore it shifts the absorption maximum towards longer wavelength with an increase in intensity of absorption. Example - OH, NH 2, - OR groups.for example when the auxochrome NH 2 is attached to the benzene ring, it s absorption changes from ʎ max = 255 nm to 280 nm. Terminology for Absorption Shifts : Nature of Shift Descriptive Term To Longer Wavelength Bathochromic To Shorter Wavelength Hypsochromic To Greater Absorbance Hyperchromic To Lower Absorbance Hypochromic
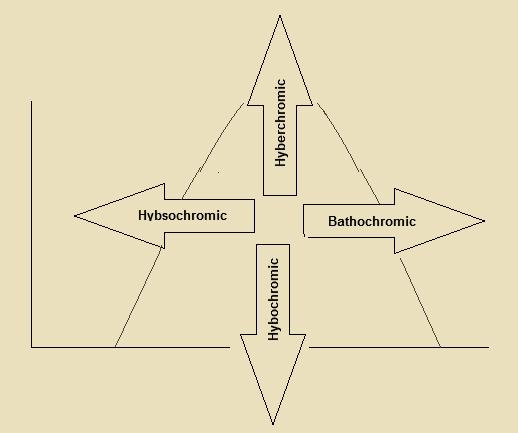
47 A ʎ ʎ A
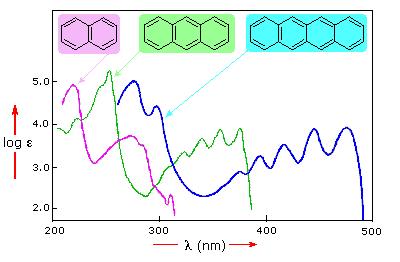
48 Effect of aromaticity Benzene exhibits very strong light absorption near 180 nm (ε > 65,000), weaker absorption at 200 nm (ε = 8,000) and a group of much weaker bands at 254 nm (ε = 240). The added conjugation in naphthalene, anthracene and tetracene causes bathochromic shifts of these absorption bands, as displayed in the figure below. As might be expected from their spectra, naphthalene and anthracene are colorless, tetracene is orange..
49
50 phenolphthalein The delocalization is broken around the carbon, and so it doesn t cover the whole molecule. The delocalization covers absolutely Everything in the ion formed.solution
51 This greater delocalization of red form lowers the energy gap between the highest occupied molecular orbital and the lowest unoccupied pi anti-bonding orbital. It needs less energy to make the jump and so a longer wavelength of light is absorbed. Aromaticity results in extraordinarily high degree of delocalization of electrons and thus stabilization of the π*. If we assume a molar absorptivity of about 10,000 L mol -1 cm -1 for each double bond, we expect the sum of the three double bonds in benzene to be just above 30,000 L mol -1 cm -1 (at 185 nm) but actually the value is about 60,000 L mol -1 cm -1 due to increased delocalization as a result of aromaticity. It is therefore advantageous to use UV-Vis absorption spectroscopy for determination of compounds having aromatic character.

52 Effect of solvent polarity on absorption wavelength Solvent polarity is an important factor in the definition of the energy required to cause a π - π* transition. Figure 3 shows the effect of polar solvents on the energy of this transition π* is more polar than π and is stabilized more than π* in polar solvents

53 The energy required for π > π* transition in polar solvents is thus reduced and the wavelength of incident radiation increases. This is referred to as bathochromic shift or red shift. A n - π* transition is affected in an opposite way since the n electrons are stabilized more than the π* leading to increased energy and shorter wavelength. This is referred to as hypsochromic shift or blue shift.
54
55 Absorption by Inorganic Groups Inorganic groups containing double bonds absorb in the UV-Vis region. The most transitions are a result of n - π* transitions as in nitrate (313 nm), carbonate (217 nm) and nitrite (280 and 360 nm). Absorption Involving d Orbitals Many transition metals have colored solutions. The transition metals have some of their d orbitals empty where a d-d transition can occur. The d-d transitions require excitation energy in the UV-Vis region
56 Charge Transfer Absorption When a ligand permanently donates an electron to a metal ion, a charge transfer is said to take place. The net outcome of the process is an oxidation reduction phenomenon occurring within the complex. An example is the reaction of Fe 3+ with thiocyanate where the product is an excited species with neutral thiocyanate and Fe 2+. In less common situations, the transfer of electrons can take place from the metal ion to the ligand. An example is the Fe 2+ complex with 1,10-phenanthroline where Fe 2+ metal ions donate electrons to 1,10-phenanthroline. The complex will then have Fe 3+ ion. Charge transfer complexes are of special interest, their molar absorptivities are usually high; allowing very sensitive determinations.
57 DESIGN OF SPECTROMETRIC METHODS 1- The analyte absorbs at a unique wavelength (not very common) e.g. MnO The analyte reacts with a reagent to produce an adduct that absorbs at a unique wavelength (a chromophore) e.g. a reaction of a metal with a chelating agent. Example, the determination of iron(ii) with 1,10- phenanthroline (phen ) : Fe phen (phen) 3 Fe(II) orange red complex The absorbance of the complex is direct proportional to the concentration of iron(ii).
58 3- The analyte X ( a catalyst or an inhibitor ) is involved in a reaction that produces a colored compound : A + B X E + D C colored product If E or D is colored, its absorbance is direct proportional to the catalyst ( or the decrease in absorbance is direct proportional to the inhibitor ), otherwise we add a reagent C to produce a colored compound with any of the products E or D.
59 The first step of an analytical procedure in UV-Vis spectroscopy is to find the wavelength that yields maximum absorbance. This is done by scanning through the UV or Vis range, depending on the characteristics of the absorbing species. The spectrum is plotted with absorbance on the Y-axis and the wavelength on the X-axis. Then the
60 Applications Qualitative Analysis The broad band absorption spectra obtained in UV-Vis absorption spectroscopy is usually lacks details that can be used in qualitative analysis. Therefore, this technique is mainly a quantitative technique. Quantitative Analysis The basis for quantitative analysis in the UV-Vis relies on Beer s law. Several characteristics of quantitative measurements using UV-Vis absorption spectroscopy can be rationalized: 1. Applicability to all types of analytes that absorb in the UV-Vis region. 2. Moderate sensitivities in the range from 10-4 to 10-6 M with possibility to extend this range under certain conditions
61 3. The relative standard deviation occurs within 1-3% which reflects good precision. 4. Easy to perform and convenient. 5- Can be used for quantitative analysis in liquid chromatographic separations and in flow injection analysis. 6. Non absorbing species can also be determined if they are derivatized with an absorbing species as the case of metal ions when complexed to ligands.
62 Calibration Curves Usually, a plot of the absorbance of a series of standards is plotted versus the concentration. The absorbance of the unknown is then measured and the prepared calibration plot is used for the determination of the analyte concentration( see the previous curve on slide 10 ). If the absorbance of the analyte was located outside the calibration plot, more standards should be made or the analyte concentration must be adjusted to occur on the calibration plot.
63 It is not allowed to theoretically extrapolate or interpolate a calibration plot. It should also be appreciated that the composition of standard solutions must approximate that of the sample solution. The slope of the linear calibration plot is the molar absorptivity when the path length is 1.00 cm. Larger slopes mean higher sensitivities In cases where the sample composition is not known i.e. standards solutions can not approximate the sample solution, the method of standard addition should be used..
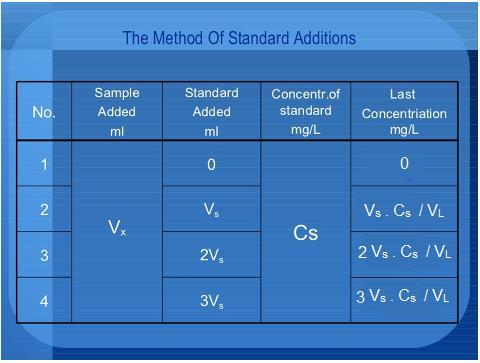
64 Standard Addition method The standard addition technique is used for non-repetitive analyses or to correct for matrix effects that cannot be accommodated in the calibration standards. In this method a known amount of the standard solution of known increasing concentrations of the analyte is added to a number of aliquots of the sample solution. A resulting solution is diluted to the similar last volume and their absorbances are measured. A graph is drawn between the absorbance and the added concentrations of the analyte. It is then extrapolated to the concentration axis to acquire the concentration of sample solution. If the plot is nonlinear then extrapolation is not probable. It is necessary to perform blank correction within such a case. The calibration plot acquired through using standard addition method is display in the following Figure.
65 Standard Addition Method No.1 No.2 No.4 No.3 V L = 100 ml V s 2V 3V s s V x V x V x V X V x ml Unknown sample Solvent V s ml of Cs ppm Standard solution
66
67
68 Determination of a Ligand to Metal ratio UV-Vis spectroscopy is very useful in determining the ratio between a ligand and a metal in a complex. M n+ + m L = (ML m ) n+ Usually, complexation of ligands with metals result in different spectroscopic characteristics for both. The most pronounced situation is the formation of a colored complex. Two widely used methods to fined this ratio : a. The Method of Continuous Variation (Job's Method) In this method, the mole fraction of either the metal or the ligand is plotted against absorbance. This yields a result similar to that shown in the following Figure.
69 If the mole fraction of the metal is 0.5 then it is a 1:1 complex and if it is 0.33 then it is a 1:2 complex, etc.the method of continuous variation is excellent for complexes that are 1:1 but if the ratio is more than 1:2 there will be some considerable uncertainty and the mole ratio method is preferred.
70 b. Mole Ratio method The concentration of the metal ion is usually kept constant and a variable amount of the complexing agent is added. The mole ratio of the metal ion to the ligand is plotted versus absorbance and a result as shown in the following Figure is obtained

71 Derivative UV-Vis Absorption Spectroscopy In derivative spectroscopy, DA/Dʎ is plotted against the wavelength. The derivative spectrum contains sharper peaks where better location of peaks and wavelengths maxima can be achieved. Not only the first derivative of the absorbance spectrum can be obtained but up to the fourth derivative is possible. Derivative spectroscopy is excellent for determination of multi components in a sample, if they can be resolved.
72 Other applications : - Detection of impurities in organic compounds. - Can be used to study the kinetics of reactions. - Molecular weight of compounds can be measured by spectrometry. - It is used as a detector in HPLC, flow injection analysis and other techniques. - Determination of composition of complex, mole ratio method, ometh. - UV/Vis spectrophotometry is probably more widely used in chemc laboratories throughout the world than any other single method. - Moderate to high selectivity. - Good accuracy the relative error encountered in concentration lie in the range from 1% to 3%
73 spectrophotometric Titrations In cases where an analyte reacts with a reagent so that the analyte, the reagent or the product absorbs UV-Vis radiation, the technique can be used for determination of the analyte by a spectrophotometric titration reaction. spectrophotometric titrations are similar to conventional visual titrations but following the course of a spctrophotometric titration occurs with the aid of a UV- Vis detector, rather than the naked eye. A plot of absorbance versus titrant volume is called a spectrophotometric titration curve. The titration curve is supposed to consist of two linear lines intersecting in a point corresponding to the end point of the reaction. The absorbance reading should be corrected for volume where as a titrant is added to the reaction mixture the absorbance will change.

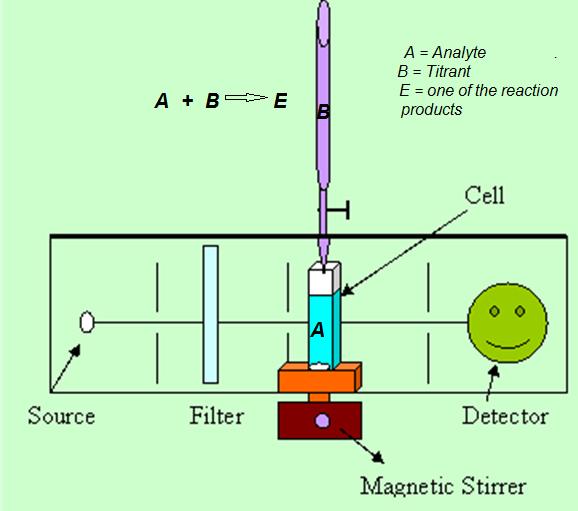
74 Several shapes of photometric titration curves can be identified depending on the reaction. Consider addition of analyte A to a reagent B so that a product E is formed according to the reaction: A + B E
75 It should be pointed out here that the lines shown are what is supposed to be. However, as the equivalence point is approached concentrations become smaller that the reaction is not fast enough and the end point is usually not sharp. This is not a problem as extrapolation of the linear portions will result in a very sharp intersection indicating the end point. A conventional photometer or spectrophotometer can be adapted to performing spectrophotometric titrations where the analyte is placed in the sample cell which contains a small magnet and is located on the top of a magnetic stirrer. The wavelength is selected and the titrant is added, from a dark burette, gradually and the absorbance is recorded
76
77 Advantages and Applications of Photometric Titrations 1. Usually, photometric titrations are more accurate than visual titrations. 2. Photometric titrations are faster than visual titrations as only few points at the beginning and end of the titration is necessary. Extrapolation of the straight lines will intersect at the end point. 3. Titration reactions that are slow at the end point can not be performed by visual titrations but are well suited for spectrophotometric titrations. Only few points at the beginning and end of the titration, well away from the equivalence point where the reaction is slow, are necessary. Extrapolation of the straight lines will intersect at the end point. Therefore, dilute solutions or weak acids and bases can be also titrated spctrophotometrically.
78 LAB WORK SPECTROPHOTOMETRIC DETERMINATION OF IRON USING 1,10- PHENANTHROLINE
79 GOALS AND OBJECTIVES Goals To become familiar with basic methods in UV-Visible molecular absorption spectrophotometry for quantitative chemical analysis Objectives Obtain absorption spectrum of the tris(1,10- phenanthroline)iron(ii) complex and determine the analytical wavelength Determine percent iron in a solid sample
80 The first step of an analytical procedure in UV-Vis spectroscopy is to find the wavelength that yields maximum absorbance. This is done by scanning through the UV or Vis range, depending on the characteristics of the absorbing species. The spectrum is plotted with absorbance on the Y-axis and the wavelength on the X-axis. Then the wavelength that yields maximum absorbance is chosen for further work. This also gives maximum molar absorptivity.
81 TRIS(1,10-PHENANTHOLINE)IRON(II) A = b c l max N N 1,10-Phenanthroline Fe phen (phen) 3 Fe(II) orange-red complex Visible spectrum of (phen) 3 Fe(II)
82 PROCEDURE Obtain absorption spectrum of complex and determine lmax Prepare working stock solutions Standard Fe from pure Fe(NH 4 ) 2 (SO 4 ) 2.6H 2 O (Mohr s salt) Stock unknown solution Weigh 0.2 g solid unknown, dissolve in dilute acid and dilute to 500 ml Prepare standard and unknown solutions. To 100-mL volumetric flasks add 5 ml ph 5 buffer
83 5 ml 10% NH 2 OH.HCl Aliquots of standard Fe or unknown include a blank solution with no Fe 10 ml of 0.02 M 1,10-phenanthroline Dilute to volume and measure absorbance at lmax Construct Beer s Law Plot (A vs c) and calculate %Fe in original solid sample. A c
84 CALCULATIONS You want to report %Fe in your solid sample, so you need to find the mass of Fe in your weighed sample. Here is a general outline of the approach. Preparation of your stock sample solution. You weighed x.xxxx g of your solid unknown. You dissolved it in dilute acid and diluted it to yyy.y ml to prepare your stock sample solution. Your stock sample solution contains all of your solid sample. If you can determine the molar concentration of Fe in this solution, you can calculate the mass of Fe in your sample..
85 Your calculated concentrations are based on the absorbances of your prepared standards and your prepared unknown. Prepared standards. Based on the mass of pure Fe(NH 4 ) 2 (SO 4 ) 2.6H 2 O, and the dilutions you did, you compute the concentrations of Fe (mol/l) in your calibration standards. You measure the absorbance of each standard and construct a calibration curve. Prepared unknown (the one for which you measured the absorbance)
86 From the calibration curve, you determine the concentration of Fe (mol/l) in your prepared unknown. Based on the concentration of Fe in your prepared unknown, and the dilutions(s) of the stock sample solution you performed to prepare that standard, you compute the molar concentration of Fe in your stock sample solution. Now you can calculate the amount of Fe in your unknown sample
87 على الراغبين في االستماع الى محاضرة عن موضوع هذه الوحدة باللغة العربية الضغط على كل من الروابط التالية : Part 10 : UV/Vis molecular absorption spectrometry Part 11 : UV/Vis molecular absorption spectrometry Part 12 : UV/Vis molecular absorption spectrometry Part 13 : UV/Vis molecular absorption spectrometry Part 14 : UV/Vis molecular absorption spectrometry Part 15 : UV/Vis molecular absorption spectrometry Part 16 : UV/Vis molecular absorption spectrometry Part 17 : UV/Vis molecular absorption spectrometry
09/05/40 MOLECULAR ABSORPTION METHODS
 MOLECULAR ABSORPTION METHODS Absorption spectroscopy refers to spectroscopic techniques that measure the absorption of radiation, as a function of wavelength ( absorption spectrum ), due to its interaction
Spectroscopy. Page 1 of 8 L.Pillay (2012)
") Spectroscopy Electromagnetic radiation is widely used in analytical chemistry. The identification and quantification of samples using electromagnetic radiation (light) is called spectroscopy. Light has
Spectroscopy Electromagnetic radiation is widely used in analytical chemistry. The identification and quantification of samples using electromagnetic radiation (light) is called spectroscopy. Light has
Molecular Luminescence Spectroscopy
 Molecular Luminescence Spectroscopy In Molecular Luminescence Spectrometry ( MLS ), molecules of the analyte in solution are excited to give a species whose emission spectrum provides information for qualitative
9/28/10. Visible and Ultraviolet Molecular Spectroscopy - (S-H-C Chapters 13-14) Valence Electronic Structure. n σ* transitions
 Valence Electronic Structure. n σ* transitions") Visible and Ultraviolet Molecular Spectroscopy - (S-H-C Chapters 13-14) Electromagnetic Spectrum - Molecular transitions Widely used in chemistry. Perhaps the most widely used in Biological Chemistry.
Visible and Ultraviolet Molecular Spectroscopy - (S-H-C Chapters 13-14) Electromagnetic Spectrum - Molecular transitions Widely used in chemistry. Perhaps the most widely used in Biological Chemistry.
Advanced Analytical Chemistry
 84.514 Advanced Analytical Chemistry Part III Molecular Spectroscopy (continued) Website http://faculty.uml.edu/david_ryan/84.514 http://www.cem.msu.edu/~reusch/virtualtext/ Spectrpy/UV-Vis/spectrum.htm
1901 Application of Spectrophotometry
 1901 Application of Spectrophotometry Chemical Analysis Problem: 1 Application of Spectroscopy Organic Compounds Organic compounds with single bonds absorb in the UV region because electrons from single
Chapter 13 An Introduction to Ultraviolet/Visible Molecular Absorption Spectrometry
 Chapter 13 An Introduction to Ultraviolet/Visible Molecular Absorption Spectrometry 13A Measurement Of Transmittance and Absorbance Absorption measurements based upon ultraviolet and visible radiation
Chapter 4 Ultraviolet and visible spectroscopy Molecular Spectrophotometry
 Chapter 4 Ultraviolet and visible spectroscopy Molecular Spectrophotometry Properties of light Electromagnetic radiation and electromagnetic spectrum Absorption of light Beer s law Limitation of Beer s
UV / Visible Spectroscopy. Click icon to add picture
 UV / Visible Spectroscopy Click icon to add picture Spectroscopy It is the branch of science that deals with the study of interaction of matter with light. OR It is the branch of science that deals with
Classification of spectroscopic methods
 Introduction Spectroscopy is the study of the interaction between the electromagnetic radiation and the matter. Spectrophotometry is the measurement of these interactions i.e. the measurement of the intensity
Terms used in UV / Visible Spectroscopy
 Terms used in UV / Visible Spectroscopy Chromophore The part of a molecule responsible for imparting color, are called as chromospheres. OR The functional groups containing multiple bonds capable of absorbing
Ultraviolet-Visible Spectroscopy
 Ultraviolet-Visible Spectroscopy Introduction to UV-Visible Absorption spectroscopy from 160 nm to 780 nm Measurement of transmittance Conversion to absorbance * A=-logT=εbc Measurement of transmittance
AN INTRODUCTION TO ATOMIC SPECTROSCOPY
 AN INTRODUCTION TO ATOMIC SPECTROSCOPY Atomic spectroscopy deals with the absorption, emission, or fluorescence by atom or elementary ions. Two regions of the spectrum yield atomic information- the UV-visible
Lecture- 08 Emission and absorption spectra
 Atomic and Molecular Absorption Spectrometry for Pollution Monitoring Dr. J R Mudakavi Department of Chemical Engineering Indian Institute of Science, Bangalore Lecture- 08 Emission and absorption spectra
Ultraviolet-Visible and Infrared Spectrophotometry
 Ultraviolet-Visible and Infrared Spectrophotometry Ahmad Aqel Ifseisi Assistant Professor of Analytical Chemistry College of Science, Department of Chemistry King Saud University P.O. Box 2455 Riyadh 11451
two slits and 5 slits
 Electronic Spectroscopy 2015January19 1 1. UV-vis spectrometer 1.1. Grating spectrometer 1.2. Single slit: 1.2.1. I diffracted intensity at relative to un-diffracted beam 1.2.2. I - intensity of light
4.3A: Electronic transitions
 Ashley Robison My Preferences Site Tools Popular pages MindTouch User Guide FAQ Sign Out If you like us, please share us on social media. The latest UCD Hyperlibrary newsletter is now complete, check it
Ultraviolet-Visible and Infrared Spectrophotometry
 Ultraviolet-Visible and Infrared Spectrophotometry Ahmad Aqel Ifseisi Assistant Professor of Analytical Chemistry College of Science, Department of Chemistry King Saud University P.O. Box 2455 Riyadh 11451
Instrumental Chemical Analysis
 L6 page 1 Instrumental Chemical Analysis Ultraviolet and visible spectroscopy Dr. Ahmad Najjar Philadelphia University Faculty of Pharmacy Department of Pharmaceutical Sciences 2 nd semester, 2016/2017
INTRODUCTION Atomic fluorescence spectroscopy ( AFS ) depends on the measurement of the emission ( fluorescence ) emitted from gasphase analyte atoms
 depends on the measurement of the emission ( fluorescence ) emitted from gasphase analyte atoms") INTRODUCTION Atomic fluorescence spectroscopy ( AFS ) depends on the measurement of the emission ( fluorescence ) emitted from gasphase analyte atoms that have been excited to higher energy levels by absorption
INTRODUCTION Atomic fluorescence spectroscopy ( AFS ) depends on the measurement of the emission ( fluorescence ) emitted from gasphase analyte atoms that have been excited to higher energy levels by absorption
levels. The signal is either absorbance vibrational and rotational energy levels or percent transmittance of the analyte
 1 In this chapter, absorption by molecules, rather than atoms, is considered. Absorption in the ultraviolet and visible regions occurs due to electronic transitions from the ground state to excited state.
Molecular Spectroscopy
 Molecular Spectroscopy Types of transitions: 1) Electronic (UV-Vis-Near IR) 2) Vibrational (IR) 3) Rotational (microwave) Electronic Absorption Spectra π π* Gary L. Miessler and Donald A. Tarr, Inorganic
Reflection = EM strikes a boundary between two media differing in η and bounces back
 Reflection = EM strikes a boundary between two media differing in η and bounces back Incident ray θ 1 θ 2 Reflected ray Medium 1 (air) η = 1.00 Medium 2 (glass) η = 1.50 Specular reflection = situation
Chemistry 141 Laboratory Spectrometric Determination of Iron Concentration Lab Lecture Notes 8/29/2011 Dr. Abrash
 Chemistry 141 Laboratory Spectrometric Determination of Iron Concentration Lab Lecture Notes 8/29/2011 Dr. Abrash What is the purpose of this experiment? We re going to learn a way to quantify the amount
Instrumental Chemical Analysis
 L6 page 1 Instrumental Chemical Analysis Ultraviolet and visible spectroscopy Dr. Ahmad Najjar Philadelphia University Faculty of Pharmacy Department of Pharmaceutical Sciences 2 nd semester, 2016/2017
Electronic Excitation by UV/Vis Spectroscopy :
 SPECTROSCOPY Light interacting with matter as an analytical tool III Pharm.D Department of Pharmaceutical Analysis SRM College Of Pharmacy,Katankulathur Electronic Excitation by UV/Vis Spectroscopy : X-ray:
UV-Vis Spectroscopy. Chem 744 Spring Gregory R. Cook, NDSU Thursday, February 14, 13
 UV-Vis Spectroscopy Chem 744 Spring 2013 UV-Vis Spectroscopy Every organic molecule absorbs UV-visible light Energy of electronic transitions saturated functionality not in region that is easily accessible
Course: M.Sc (Chemistry) Analytical Chemistry Unit: III
 Analytical Chemistry Unit: III") Course: M.Sc (Chemistry) Analytical Chemistry Unit: III Syllabus: Principle of spectrophotometry Types of spectrophotometer Applications - Dissociation constants of an indicator simultaneous spectrophotometric
Course: M.Sc (Chemistry) Analytical Chemistry Unit: III Syllabus: Principle of spectrophotometry Types of spectrophotometer Applications - Dissociation constants of an indicator simultaneous spectrophotometric
Terms used in UV / Visible Spectroscopy
 Terms used in UV / Visible Spectroscopy Chromophore The part of a molecule responsible for imparting color, are called as chromospheres. OR The functional groups containing multiple bonds capable of absorbing
ULTRAVIOLET SPECTROSCOPY or ELECTRONIC SPECTROSCOPY
 ULTRAVILET SPECTRSCPY or ELECTRNIC SPECTRSCPY S. SANKARARAMAN Department of Chemistry Indian Institute of Technology Madras Chennai 600036, INDIA Sanka@iitm.ac.in Absorption of electromagnetic radiation
Chem 321 Lecture 18 - Spectrophotometry 10/31/13
 Student Learning Objectives Chem 321 Lecture 18 - Spectrophotometry 10/31/13 In the lab you will use spectrophotometric techniques to determine the amount of iron, calcium and magnesium in unknowns. Although
Compact Knowledge: Absorbance Spectrophotometry. Flexible. Reliable. Personal.
 L A B O R A T O R Y C O M P E T E N C E Compact Knowledge: Absorbance Spectrophotometry Flexible. Reliable. Personal. The interaction of light with molecules is an essential and well accepted technique
Spectrophotometric Determination of Iron
 Spectrophotometric Determination of Iron INTRODUCTION Many investigations of chemical species involve the interaction between light and matter. One class of these investigations, called absorbance spectrophotometry,
Chapter 13 Conjugated Unsaturated Systems
 Chapter 13 Conjugated Unsaturated Systems Introduction Conjugated unsaturated systems have a p orbital on a carbon adjacent to a double bond The p orbital can come from another double or triple bond The
Chem 310 rd. 3 Homework Set Answers
 -1- Chem 310 rd 3 Homework Set Answers 1. A double line labeled S 0 represents the _ground electronic_ state and the _ground vibrational_ state of a molecule in an excitation state diagram. Light absorption
Analytical Technologies in Biotechnology Prof. Dr. Ashwani K Sharma Department of Biotechnology Indian Institute of Technology, Roorkee
 Analytical Technologies in Biotechnology Prof. Dr. Ashwani K Sharma Department of Biotechnology Indian Institute of Technology, Roorkee Module - 6 Spectroscopic Techniques Lecture - 2 UV-Visible Spectroscopy
Experiment 1 (Part A): Plotting the Absorption Spectrum of Iron (II) Complex with 1,10- Phenanthroline
: Plotting the Absorption Spectrum of Iron (II) Complex with 1,10- Phenanthroline") Experiment (Part A): Plotting the Absorption Spectrum of Iron (II) Complex with,0- Phenanthroline Background The first step of an analytical spectrophotometric procedure for quantitative determination
Experiment (Part A): Plotting the Absorption Spectrum of Iron (II) Complex with,0- Phenanthroline Background The first step of an analytical spectrophotometric procedure for quantitative determination
A very brief history of the study of light
 1. Sir Isaac Newton 1672: A very brief history of the study of light Showed that the component colors of the visible portion of white light can be separated through a prism, which acts to bend the light
Answers to spectroscopy questions. 1. Consider the spectrum below. Questions a f refer to this spectrum.
 Answers to spectroscopy questions. 1. Consider the spectrum below. Questions a f refer to this spectrum. a. Is the spectrum above a band spectrum or a line spectrum? This is a band spectra, there are what
Ultraviolet Spectroscopy. CH- 521 Course on Interpreta2ve Molecular Spectroscopy; Course Instructor: Krishna P. Kaliappan
 Ultraviolet Spectroscopy CH- 521 Course on Interpreta2ve Molecular Spectroscopy; Course Instructor: Krishna P. Kaliappan Ultraviolet Spectroscopy UV light can be absorbed by molecules to excite higher
PART SPECTROPHOTOMETRIC STUDIES
 PART SPECTROPHOTOMETRIC STUDIES CHAPTER General Principles of Spectrophotometry 123 In absorption spectroscopy, absorption measurements based upon ultraviolet light and visible radiation find application
Ultraviolet and Visible Spectroscopy. interaction of materials with light at different electronic levels and the extent, to which such
 Surname 1 Ultraviolet and Visible Spectroscopy Introduction This experiment was carried out to demonstrate the effect of atomic structure on the interaction of materials with light at different electronic
Spectroscopy Primer. for ultraviolet and visible absorbance spectroscopy. by Stephanie Myers Summer 2015
 Spectroscopy Primer for ultraviolet and visible absorbance spectroscopy by Stephanie Myers Summer 2015 Abstract: An overview of uv vis absorbance spectroscopy including Beer s Law, calibration curves,
UNIT TWO BOOKLET 1. Molecular Orbitals and Hybridisation
 DUNCANRIG SECONDARY ADVANCED HIGHER CHEMISTRY UNIT TWO BOOKLET 1 Molecular Orbitals and Hybridisation In the inorganic unit we learned about atomic orbitals and how they could be used to write the electron
MOLEBIO LAB #4: Using a Spectrophotometer
 Introduction: Spectrophotometry MOLEBIO LAB #4: Using a Spectrophotometer Many kinds of molecules interact with or absorb specific types of radiant energy in a predictable fashion. For example, when while
Chem 155 Quiz 3 Review Topics: Quiz 3 outline
 Quiz 3 outline 1. Atomic absorption spectrometry a. Principles of FAAS where selectivity and sensitivity arise b. Spectrometer design c. Atomization processes d. Sensitvitiy and atomization: protecting
CHEM*3440. Photon Energy Units. Spectrum of Electromagnetic Radiation. Chemical Instrumentation. Spectroscopic Experimental Concept.
 Spectrum of Electromagnetic Radiation Electromagnetic radiation is light. Different energy light interacts with different motions in molecules. CHEM*344 Chemical Instrumentation Topic 7 Spectrometry Radiofrequency
Lesmahagow High School CfE Advanced Higher Chemistry. Unit 2 Organic Chemistry and Instrumental Analysis. Molecular Orbitals and Structure
 Lesmahagow High School CfE Advanced Higher Chemistry Unit 2 Organic Chemistry and Instrumental Analysis Molecular Orbitals and Structure 1 Molecular Orbitals Orbitals can be used to explain the bonding
Application of IR Raman Spectroscopy
 Application of IR Raman Spectroscopy 3 IR regions Structure and Functional Group Absorption IR Reflection IR Photoacoustic IR IR Emission Micro 10-1 Mid-IR Mid-IR absorption Samples Placed in cell (salt)
First week Experiment No.1 / /2013. Spectrophotometry. 1. Determination of copper via ammine complex formation using standard series method
 First week Experiment No.1 / /2013 Spectrophotometry 1. Determination of copper via ammine complex formation using standard series method Principal In the standard series method the teat and standard solution
Investigating Transition Metal Complexes
 Exercise 4 Investigating Transition Metal Complexes 4 Introduction Colour is a well known property of the transition metals. The colour produced as parts of the visible spectrum are due to electron transitions
II. Spectrophotometry (Chapters 17, 19, 20)
") II. Spectrophotometry (Chapters 17, 19, 20) FUNDAMENTALS (Chapter 17) Spectrophotometry: any technique that uses light to measure concentrations (here: U and visible - ~190 800 nm) c = 2.99792 x 10 8 m/s
II. Spectrophotometry (Chapters 17, 19, 20) FUNDAMENTALS (Chapter 17) Spectrophotometry: any technique that uses light to measure concentrations (here: U and visible - ~190 800 nm) c = 2.99792 x 10 8 m/s
Chapter 17: Fundamentals of Spectrophotometry
 Chapter 17: Fundamentals of Spectrophotometry Spectroscopy: the science that deals with interactions of matter with electromagnetic radiation or other forms energy acoustic waves, beams of particles such
Basics of UV-Visible Spectroscopy *
 OpenStax-CNX module: m34525 1 Basics of UV-Visible Spectroscopy * Brittany L. Oliva-Chatelain Andrew R. Barron This work is produced by OpenStax-CNX and licensed under the Creative Commons Attribution
UV Visible Spectroscopy
 UV Visible Spectroscopy It involves the measurement of absorption of light in the UV region(10-200(far UV)-200-400nm(near UV) and visible region(400-800nm)by the compound under investigation. It is also
Lab #12: Determination of a Chemical Equilibrium Constant
 Lab #12: Determination of a Chemical Equilibrium Constant Objectives: 1. Determine the equilibrium constant of the formation of the thiocyanatoiron (III) ions. 2. Understand the application of using a
UNIT 2 UV-VISIBLE SPECTROMETRY
 Molecular Spectroscopic Methods-I UNIT 2 UV-VISIBLE SPECTROMETRY Structure 2.1 Introduction Objectives 2.2 Origin and Characteristics of UV-VIS Spectrum Origin of UV-VIS spectrum Characteristics of UV-VIS
Chapter 13. Conjugated Unsaturated Systems. +,., - Allyl. What is a conjugated system? AllylicChlorination (High Temperature)
") What is a conjugated system? Chapter 13 Conjugated Unsaturated Systems Conjugated unsaturated systems have a p orbital on a carbon adjacent to a double bond The p orbital may be empty (a carbocation The
What is a conjugated system? Chapter 13 Conjugated Unsaturated Systems Conjugated unsaturated systems have a p orbital on a carbon adjacent to a double bond The p orbital may be empty (a carbocation The
Ultraviolet Spectroscopy
 This work by IJARBEST is licensed under a Creative Commons Attribution 4.0 International License. Available at https://www.ijarbest.com Ultraviolet Spectroscopy 1 D. Farvez Basha, 2 C. Santhiya, 2 K. Tharani
Chemistry Instrumental Analysis Lecture 11. Chem 4631
 Chemistry 4631 Instrumental Analysis Lecture 11 Molar Absorptivities Range 0 to 10 5 Magnitude of e depends on capture cross section of the species and probability of the energy-absorbing transition. e
A Study of Beer s Law Prelab
 1. What is the purpose of this experiment? A Study of Beer s Law Prelab 2. Using the absorbance versus wavelength curve given in Figure I, determine the approximate value of max of the dye used to construct
Infrared Spectroscopy
 Infrared Spectroscopy IR Spectroscopy Used to identify organic compounds IR spectroscopy provides a 100% identification if the spectrum is matched. If not, IR at least provides information about the types
Reference literature. (See: CHEM 2470 notes, Module 8 Textbook 6th ed., Chapters )
") September 17, 2018 Reference literature (See: CHEM 2470 notes, Module 8 Textbook 6th ed., Chapters 13-14 ) Reference.: https://slideplayer.com/slide/8354408/ Spectroscopy Usual Wavelength Type of Quantum
September 17, 2018 Reference literature (See: CHEM 2470 notes, Module 8 Textbook 6th ed., Chapters 13-14 ) Reference.: https://slideplayer.com/slide/8354408/ Spectroscopy Usual Wavelength Type of Quantum
An Introduction to Ultraviolet-Visible Molecular Spectrometry (Chapter 13)
") An Introduction to Ultraviolet-Visible Molecular Spectrometry (Chapter 13) Beer s Law: A = -log T = -logp 0 / P = e x b x C See Table 13-1 for terms. In measuring absorbance or transmittance, one should
An Introduction to Ultraviolet-Visible Molecular Spectrometry (Chapter 13) Beer s Law: A = -log T = -logp 0 / P = e x b x C See Table 13-1 for terms. In measuring absorbance or transmittance, one should
Ch 14 Conjugated Dienes and UV Spectroscopy
 Ch 14 Conjugated Dienes and UV Spectroscopy Conjugated Systems - Conjugated systems have alternating single and double bonds. For example: C=C C=C C=C and C=C C=O - This is not conjugated because the double
Chapter 17: Fundamentals of Spectrophotometry
 Chapter 17: Fundamentals of Spectrophotometry Spectroscopy: the science that deals with interactions of matter with electromagnetic radiation or other forms energy acoustic waves, beams of particles such
Molecular Spectroscopy. H 2 O e -
 Molecular Spectroscopy ν (cm -1 ) λ (cm) 10 6 10 8 10 10 10 12 10 14 10 16 10 18 10 20 10 22 ν (Hz) NMR ESR microwave IR UV/Vis VUV X-Ray Gamma Ray H 2 e - UV/Vis Spectroscopy absorption technique X hν
Preparation of Standard Curves. Principle
 Preparation of Standard urves Principle Many laboratory tests require the measurement of concentration be evaluated or read in a photometer (colorimeter or spectrophotometer). Since these instruments are
UV-Vis optical fiber assisted spectroscopy in thin films and solutions
 UV-Vis optical fiber assisted spectroscopy in thin films and solutions Description UV-Visible absorption and transmission spectra provide fundamental information for all experiments related to the attenuation
Beer's Law and Data Analysis *
 OpenStax-CNX module: m15131 1 Beer's Law and Data Analysis * Mary McHale This work is produced by OpenStax-CNX and licensed under the Creative Commons Attribution License 2.0 1 Beer's Law and Data Analysis
Because light behaves like a wave, we can describe it in one of two ways by its wavelength or by its frequency.
 Light We can use different terms to describe light: Color Wavelength Frequency Light is composed of electromagnetic waves that travel through some medium. The properties of the medium determine how light
Skill Building Activity 2 Determining the Concentration of a Species using a Vernier Spectrometer
 Skill Building Activity 2 Determining the Concentration of a Species using a Vernier Spectrometer Purpose To use spectroscopy to prepare a Beer s Law plot of known dilutions of copper(ii) sulfate so that
Organic Chemistry: CHEM2322
 Conjugated Systems Organic Chemistry: We met in Chem 2321 unsaturated bonds as either a C=C bond or C C bond. If these unsaturated bonds are well separated then they react independently however if there
Reflection = EM strikes a boundary between two media differing in η and bounces back
 Reflection = EM strikes a boundary between two media differing in η and bounces back Incident ray θ 1 θ 2 Reflected ray Medium 1 (air) η = 1.00 Medium 2 (glass) η = 1.50 Specular reflection = situation
Spectrochemical methods
 Spectrochemical methods G. Galbács The interactions of radiations and matter are the subject of spectroscopy py or spectrochemical methods (also called spectrometry). Spectrochemical methods usually measure
DETERMINATION OF K c FOR AN EQUILIBRIUM SYSTEM
 DETERMINATION OF K c FOR AN EQUILIBRIUM SYSTEM 1 Purpose: To determine the equilibrium constant K c for an equilibrium system using spectrophotometry to measure the concentration of a colored complex ion.
and Ultraviolet Spectroscopy
 Organic Chemistry, 7 th Edition L. G. Wade, Jr. Chapter 15 Conjugated Systems, Orbital Symmetry, and Ultraviolet Spectroscopy 2010, Prentice all Conjugated Systems Conjugated double bonds are separated
Química Orgânica I. Ciências Farmacêuticas Bioquímica Química. Análise estrutural AFB QO I 2007/08 1 AFB QO I 2007/08 2
 Química Orgânica I Ciências Farmacêuticas Bioquímica Química AFB QO I 2007/08 1 Análise estrutural AFB QO I 2007/08 2 1 Adaptado de: Organic Chemistry, 6th Edition; L. G. Wade, Jr. Organic Chemistry, William
Questions on Instrumental Methods of Analysis
 Questions on Instrumental Methods of Analysis 1. Which one of the following techniques can be used for the detection in a liquid chromatograph? a. Ultraviolet absorbance or refractive index measurement.
Spectroscopy may be defined as the study of interaction between electromagnetic radiations and matter.
 Spectroscopy may be defined as the study of interaction between electromagnetic radiations and matter. Spectroscopy has a wide range of applications. It is heavily used in astronomy and remote sensing.
World Journal of Pharmaceutical Research SJIF Impact Factor 8.074
 SJIF Impact Factor 8.074 Volume 7, Issue 11, 1170-1180. Review Article ISSN 2277 7105 DEVELOPMENT AND OPTIMIZATION OF UV-VIS SPECTROSCOPY - A REVIEW Govinda Verma* and Dr. Manish Mishra Shri Guru Ram Rai
INTRODUCTION The fundamental law of spectrophotometry is known as the Beer-Lambert Law or Beer s Law. It may be stated as: log(po/p) = A
 = A") S2. INTRODUCTION TO ULTRA-VIOLET / VISIBLE SPECTROSCOPY AIM 1. To become familiar with the operation of a conventional scanning ultra-violet spectrophotometer 2. To determine suitable cells and solvents
S2. INTRODUCTION TO ULTRA-VIOLET / VISIBLE SPECTROSCOPY AIM 1. To become familiar with the operation of a conventional scanning ultra-violet spectrophotometer 2. To determine suitable cells and solvents
UV-Vis spektrometrie. Brno 2016, Dominik Heger, Ústav chemie a RECETOX, MU
 UV-Vis spektrometrie Brno 2016, Dominik Heger, http://hegerd.sci.muni.cz/ Ústav chemie a RECETOX, MU Sluneční světlo What is UV-VIS spectroscopy measuring? Electronic transitions. l / nm 185-200 Vacuum-UV
Spectroscopy: Introduction. Required reading Chapter 18 (pages ) Chapter 20 (pages )
 Chapter 20 (pages )") Spectroscopy: Introduction Required reading Chapter 18 (pages 378-397) Chapter 20 (pages 424-449) Spectrophotometry is any procedure that uses light to measure chemical concentrations Properties of Light
Spectroscopy: Introduction Required reading Chapter 18 (pages 378-397) Chapter 20 (pages 424-449) Spectrophotometry is any procedure that uses light to measure chemical concentrations Properties of Light
Radiant energy is proportional to its frequency (cycles/s = Hz) as a wave (Amplitude is its height) Different types are classified by frequency or
 as a wave (Amplitude is its height) Different types are classified by frequency or") CHEM 241 UNIT 5: PART B INFRA-RED RED SPECTROSCOPY 1 Spectroscopy of the Electromagnetic Spectrum Radiant energy is proportional to its frequency (cycles/s = Hz) as a wave (Amplitude is its height) Different
CHEM 241 UNIT 5: PART B INFRA-RED RED SPECTROSCOPY 1 Spectroscopy of the Electromagnetic Spectrum Radiant energy is proportional to its frequency (cycles/s = Hz) as a wave (Amplitude is its height) Different
Energy. Position, x 0 L. Spectroscopy and the Particle-in-a-Box. Introduction
 Spectroscopy and the Particle-in-a-Box Introduction The majority of colors that we see result from transitions between electronic states that occur as a result of selective photon absorption. For a molecule
Structure Determination. How to determine what compound that you have? One way to determine compound is to get an elemental analysis
 Structure Determination How to determine what compound that you have? ne way to determine compound is to get an elemental analysis -basically burn the compound to determine %C, %H, %, etc. from these percentages
Conjugated Systems, Orbital Symmetry and UV Spectroscopy
 Conjugated Systems, Orbital Symmetry and UV Spectroscopy Introduction There are several possible arrangements for a molecule which contains two double bonds (diene): Isolated: (two or more single bonds
LAB #1: ABSORPTION SPECTRA OF CONJUGATED DYES
 Chemistry 7 Gustavus Adolphus College LAB #1: ABSORPTIO SPECTRA OF COJUGATED DYES Abstract Ultraviolet-visible spectroscopy is used to explore the electronic structure of several conjugated polyene dyes,
2 SPECTROSCOPIC ANALYSIS
 2 SPECTROSCOPIC ANALYSIS 2.1 Introduction Chemical analysis falls into two basic categories: qualitative what is present quantitative how much is present Spectroscopy is capable of both types of analysis,
Skoog Chapter 6 Introduction to Spectrometric Methods
 Skoog Chapter 6 Introduction to Spectrometric Methods General Properties of Electromagnetic Radiation (EM) Wave Properties of EM Quantum Mechanical Properties of EM Quantitative Aspects of Spectrochemical
William H. Brown & Christopher S. Foote
 Requests for permission to make copies of any part of the work should be mailed to:permissions Department, Harcourt Brace & Company, 6277 Sea Harbor Drive, Orlando, Florida 32887-6777 William H. Brown
Clinical Chemistry (CHE221) Professor Hicks Week 1. Statistics Made Slightly Less Boring and Introduction to Spectrophotometry. Accuracy vs Precision
 Professor Hicks Week 1. Statistics Made Slightly Less Boring and Introduction to Spectrophotometry. Accuracy vs Precision") Clinical Chemistry (CHE221) Professor Hicks Week 1 Statistics Made Slightly Less Boring and Introduction to Spectrophotometry 3 Accuracy vs Precision Precision is the consistency of a measurement made
Clinical Chemistry (CHE221) Professor Hicks Week 1 Statistics Made Slightly Less Boring and Introduction to Spectrophotometry 3 Accuracy vs Precision Precision is the consistency of a measurement made
S2. INTRODUCTION TO ULTRA-VIOLET / VISIBLE SPECTROSCOPY
 S2. INTRODUCTION TO ULTRA-VIOLET / VISIBLE SPECTROSCOPY PURPOSE 1. To become familiar with the operation of a conventional scanning ultra-violet spectrophotometer 2. To determine suitable cells and solvents
Spectroscopy and the Particle in a Box
 Spectroscopy and the Particle in a Box Introduction The majority of colors that we see result from transitions between electronic states that occur as a result of selective photon absorption. For a molecule
R O Y G B V. Spin States. Outer Shell Electrons. Molecular Rotations. Inner Shell Electrons. Molecular Vibrations. Nuclear Transitions
 Spin States Molecular Rotations Molecular Vibrations Outer Shell Electrons Inner Shell Electrons Nuclear Transitions NMR EPR Microwave Absorption Spectroscopy Infrared Absorption Spectroscopy UV-vis Absorption,
Introduction. The analysis of the outcome of a reaction requires that we know the full structure of the products as well as the reactants
 Introduction The analysis of the outcome of a reaction requires that we know the full structure of the products as well as the reactants Spectroscopy and the Electromagnetic Spectrum Unlike mass spectrometry,
Atomic Emission Spectra
 Atomic Emission Spectra Objectives The objectives of this laboratory are as follows: To build and calibrate a simple meter-stick spectroscope that is capable of measuring wavelengths of visible light.
Increasing energy. ( 10 4 cm -1 ) ( 10 2 cm -1 )
 ( 10 2 cm -1 )") The branch of science which deals with the interaction of electromagnetic radiation with matter is called spectroscopy The energy absorbed or emitted in each transition corresponds to a definite frequency
The branch of science which deals with the interaction of electromagnetic radiation with matter is called spectroscopy The energy absorbed or emitted in each transition corresponds to a definite frequency
high energy state for the electron in the atom low energy state for the electron in the atom
 Atomic Spectra Objectives The objectives of this experiment are to: 1) Build and calibrate a simple spectroscope capable of measuring wavelengths of visible light. 2) Measure several wavelengths of light