levels. The signal is either absorbance vibrational and rotational energy levels or percent transmittance of the analyte
|
|
|
- Melvyn Rodgers
- 5 years ago
- Views:
Transcription
1 1 In this chapter, absorption by molecules, rather than atoms, is considered. Absorption in the ultraviolet and visible regions occurs due to electronic transitions from the ground state to excited state. Broad band spectra are obtained since molecules have vibrational and rotational energy levels associated with electronic energy levels. The signal is either absorbance or percent transmittance of the analyte solution where: 2 4 An introduction to Ultraviolet/Visible Absorption Spectroscopy Chapter 13 1 Absorption measurements based upon ultraviolet and visible radiation find widespread application for the quantitative determination of a large variety species. Beer s Law: A = -logt = logp 0 /P = εbc A = absorbance ε = molar absorptivity [M -1 cm -1 ] c = concentration [M] P 0 = incident power P = transmitted power (after passing through sample) 3


2 2 UV-Vis Absorption Spectroscopy Lecture 22 6 Measurement of Transmittance and Absorbance: The power of the beam transmitted by the analyte solution is usually compared with the power of the beam transmitted by an identical cell containing only solvent. An experimental transmittance and absorbance are then obtained with the equations. P 0 and P refers to the power of radiation after it has passed through the solvent and the analyte
3 Real Limitations a. Beer s law is good for dilute analyte solutions only. High concentrations (>0.01M) will cause a negative error since as the distance between molecules become smaller the charge distribution will be affected which alter the molecules ability to absorb a specific wavelength. The same phenomenon is also observed for solutions with high electrolyte concentration, even at low analyte concentration. The molar absorptivity is altered due to electrostatic interactions. 12 Beer s s law and mixtures Each analyte present in the solution absorbs light! The magnitude of the absorption depends on its ε A total = A 1 +A 2 + +A +A n A total = ε 1 bc 1 +ε 2 bc 2 + +ε n bc n If ε 1 = ε 2 = ε n then simultaneous determination is impossible Need to measure A at nλ s (get 2 n ε s) ) to solve for the concentration of species in the mixture 9 Limitations to Beer s Law Real limitations Chemical deviations Instrumental deviations 11
4 4 2. Chemical Deviations This factor is an important one which largely affects linearity in Beer s law. It originates when an analyte dissociates, associates, or reacts in the solvent, or one of matrix constituents. For example, an acid base indicator when dissolved in water will partially dissociate according to its acid dissociation constant: x10-5 = x 2 /(2x10-5 x) Solving the quadratic equation gives: X = 1.12x10⁻⁵ M which means: [In - ] = 1.12x10⁻⁵ M [HIn] = 2x x10-5 = 0.88x10⁻⁵ M Therefore, the absorbance measured will be the sum of that for HIn and In -. If a 1.00 cm cell was used and the ε for both HIn and In - were 7.12x10 3 and 9.61x10 2 Lmol -1 cm -1 at 570 nm, respectively, the absorbance of the solution can be calculated: 16 b. In the derivation of Beer s law we have introduced a constant (ε). However, ε is dependent on the refractive index and the refractive index is a function of concentration. Therefore, ε will be concentration dependent. However, the refractive index changes very slightly for dilute solutions and thus we can practically assume that ε is constant. c. In rare cases, the molar absorptivity changes widely with concentration, even at dilute solutions. Therefore, Beer s law is never a linear relation for such compounds, like methylene blue. 13 HIn H + + In - It can be easily appreciated that the amount of HIn present in solution is less than that originally dissolved where: C HIn = [HIn] + [In - ] Assume an analytical concentration of 2x10⁻⁵ M indicator (k a = 1.42x10⁻⁵ ) was used, we may write: 15
5 5 However, at 430 nm, the molar absorptivities of HIn and In - are 6.30*10 2 and 2.06*10 4, respectively. A = A HIn + A In A = 6.30*10 2 * 1.00* 0.88x *10 4 * 1.00 *1.12x10-5 = Again, if no dissociation takes place we may have: A = A HIn A = 6.30*10 2 * 1.00 * 2x10-5 = If the two results are compared we can calculate the % increase in anticipated signal as: % decrease in signal = {( )/0.013}x100% = V. large 18 Chemical deviations from Beer s law for unbuffered solutions of the indicator Hln. Note that there are positive deviations at 430 nm and negative deviations at 570 nm. At 430 nm, the absorbance is primarily due to the ionized In - form of the indicator and is proportional to the fraction ionized, which varies nonlinearly with the total indicator concentration. At 570 nm, the absorbance is due principally to the undissociated acid Hln, which increases nonlinearly with the total concentration. 20 A = A HIn + A In A = 7.12x10 3 * 1.00* 0.88x x10 2 * 1.00 *1.12x10-5 = However, if no dissociation takes place we may have: A = A HIn A = 7.12x10 3 * 1.00 * 2x10-5 = If the two results are compared we can calculate the % decrease in anticipated signal as: % decrease in signal = {( )/0.142}x100% = 49% 17 Comparison between results obtained at 570 nm and 430 nm show large dependence on the values of the molar absorptivities of HIn and In - at these wavelength. At 570 nm: A = A HIn + A In A = 7.12x10 3 * 1.00* 0.88x x10 2 * 1.00 *1.12x10-5 = And at 430 nm: A = 6.30*10 2 * 1.00* 0.88x *10 4 * 1.00 *1.12x10-5 =

6 6 Calculated Absorbance Data for Various Indicator Concentrations Instrumental Deviations a. Beer s law is good for monochromatic light only since ε is wavelength dependent. It is enough to assume a dichromatic beam passing through a sample to appreciate the need for a monochromatic light. Assume that the radiant power of incident radiation is P o and P o while transmitted power is P and P. The absorbance of solution can be written as: An example of association equilibria Association of chromate in acidic solution to form the dichromate according to the equation below: 2 CrO H + Cr 2 O H 2 O The absorbance of the chromate ions will change according to the mentioned equilibrium and will thus be nonlinearly related to concentration. A = ε CrO4 *b*c CrO4 + ε Cr2O7 *b*c Cr2O7 23
7 A = log (P o + P o )/(P + P ) P = P o 10 -εbc, substituting in the above equation: A = log (P o + P o )/(P o 10 -εbc Po 10 -ε bc ) Assume ε = ε = ε A = log (P o + P o )/(P o + P o ) 10 -εbc A = εbc However, since ε # ε, since ε is wavelength dependent, then A # εbc 25 The effect of polychromatic radiation on Beer s law. In the spectrum at the top, the molar absorptivity of the analyte is nearly constant over band A. Note that in Beer s law plot at the bottom, using band A gives a linear relationship. In the spectrum, band B corresponds to a region where the absorptivity shows substantial changes. In the lower plot, note the dramatic deviation from Beer s law that results. 27
8 8 b. Stray Radiation Stray radiation resulting from scattering or various reflections in the instrument will reach the detector without passing through the sample. The problem can be severe in cases of high absorbance or when the wavelengths of stray radiation is in such a range where the detector is highly sensitive as well as at wavelengths extremes of an instrument. The absorbance recorded can be represented by the relation: A = log (P o + P s )/(P + P s ) Where; P s is the radiant power of stray radiation. 30 Instrumental Noise as a Function in Transmittance The uncertainty in concentration as a function of the uncertainty in transmittance can be statistically represented as: s c 2 = (dc/dt) 2 s T 2 A = -log T = εbc = ln T c = -(1/εb)*0.434 ln T (1) dc/dt = /εbT s c 2 = (-0.434/εbT) 2 s T 2 (2) 32 Therefore, the linearity between absorbance and concentration breaks down if incident radiation was polychromatic. In most cases with UV- Vis spectroscopy, the effect is small especially at the wavelength maximum. The small changes in signal is insignificant since ε differs only slightly


9 9 34 Therefore, an absorbance between may be advantageous in terms of a lower uncertainty in concentration measurements. At higher or lower absorbances, an increase in uncertainty is encountered. It is therefore advised that the test solution be in the concentration range which gives an absorbance value in the range from for best precision. However, it should also be remembered that we ended up with this conclusion provided that s T is constant. Unfortunately, s T is not always constant which complicates the conclusions above. 36 Dividing equation 2 by the square of equation 1 (s c /c) 2 = (-0.434/εbT) 2 s T 2 /{( ln T) 2 /(εb) 2 } s c /c = (s T / T ln T) Therefore, it is clear that the uncertainty in concentration of a sample is nonlinearly related to the magnitude of the transmittance. Substitution for different values of transmittance and assuming s T is constant, we get: 33 35
10 10 Effect of slit width (spectral bandwidth) on peak heights. Here, the sample was s solution of praseodymium chloride. Note that as the spectral bandwidth decreases by decreasing the slit width from 1.0 mm to 0.1 mm, the peak heights increase. 38 UV-Vis Absorption Spectroscopy Lecture EFFECT OF bandwidth Effect of bandwidth on spectral detail for a sample of benzene vapor. Note that as the spectral bandwidth increases, the fine structure in the spectrum is lost. At a bandwidth of 10 nm, only a broad absorption band is observed. 37 Effect of Scattered Radiation at Wavelength Extremes of an Instrument Wavelength extremes of an instrument are dependent on type of source, detector and optical components used in the manufacture of the instrument. Outside the working range of the instrument, it is not possible to use it for accurate determinations. However, the extremes of the instrument are very close to the region of invalid instrumental performance and would thus be not very accurate. An example may be a visible photometer which, in principle, can be used in the range from nm. It may be obvious that glass windows, cells and prism will start to absorb significantly below 380 nm and thus a decrease in the incident radiant power is significant. 39
11 B: UV-VIS spectrophotometer A: VIS spectrophotometer EFFECT OF SCATTERED RADIATION Spectrum of cerium (IV) obtained with a spectrophotometer having glass optics (A) and quartz optics (B). The false peak in A arises from transmission of stray radiation of longer wavelengths. Light source Instrumentation λ - selector Sample container Detector Signal processing Light Sources (commercial instruments) D 2 lamp (UV: nm) W lamp (vis: nm) What defines the instrumental wavelength extremes? Two Factors: 1. Source 2. Detector Measurements at wavelength extremes should be avoided since errors are very possible due to: 1. Source limitations 2. Detector limitations 3. Sample cell limitations 4. Scattered radiation 41 The output from the source at the low wavelength range is minimal. Also, the detector has best sensitivities around 550 nm which means that away up and down this value, the sensitivity significantly decrease. However, scattered radiation, and stray radiation in general, will reach the detector without passing through these surfaces as well as these radiation are constituted from wavelengths for which the detector is highly sensitive. In some cases, stray and scattered radiation reaching the detector can be far more intense than the monochromatic beam from the source. False peaks may appear in such cases and one should be aware of this cause of such peaks. 43

12 12 Deuterium lamp UV region (a) A deuterium lamp of the type used in spectrophotometers and (b) its spectrum. The plot is of irradiance E λ (proportional to radiant power) versus wavelength. Note that the maximum intensity occurs at ~225 m.typically, instruments switch from deuterium to tungsten at ~350 nm. 46 The tungsten lamp is by far the most common source in the visible and near IR region with a continuum output wavelength in the range from nm. The lamp is formed from a tungsten filament heated to about 3000 o C housed in a glass envelope. The output of the lamp approaches a black body radiation where it is observed that the energy of a tungsten lamp varies as the fourth power of the operating voltage Sources Deuterium and hydrogen lamps ( nm) D 2 + E e D 2 * D + D D + hν Visible and near-ir region (a) A tungsten lamp of the type used in spectroscopy and its spectrum (b). Intensity of the tungsten source is usually quite low at wavelengths shorter than about 350 nm. Note that the intensity reaches a maximum in the near-ir region of the spectrum.
13 13 Tungsten lamps ( nm) Why add I 2 in the lamps? W + I 2 WI 2 Low limit: 350 nm 1)Low intensity 2)Glass envelope Tungsten halogen lamps are currently more popular than just tungsten lamps since they have longer lifetime. Tungsten halogen lamps contain small quantities of iodine in a quartz envelope. The quartz envelope is necessary due to the higher temperature of the tungsten halogen lamps (3500 o C). The longer lifetime of tungsten halogen lamps stems from the fact that sublimed tungsten forms volatile WI 2 which redeposits on the filament thus increasing its lifetime. The output of tungsten halogen lamps are more efficient and extend well into the UV Xenon Arc Lamps Passage of current through an atmosphere of high pressured xenon excites xenon and produces a continuum in the range from nm with maximum output at about 500 nm. Although the output of the xenon arc lamp covers the whole UV and visible regions, it is seldom used as a conventional source in the UV-Vis. The radiant power of the lamp is very high as to preclude the use of the lamp in UV-Vis instruments. However, an important application of this source will be discussed in luminescence spectroscopy which will be discussed later. 51

14 14 Instrumental Components Source λ - selector (monochromators) Sample holders Cuvettes (b = 1 cm typically) 1. Glass (Vis) 2. Fused silica (UV+Vis) Detectors Photodiodes PMTs Single beam Place cuvette with blank (i.e., solvent) in instrument and take a reading 100% T Replace cuvette with sample and take reading % T for analyte (from which absorbance is calc d) 56 Sample Containers Sample containers are called cells or cuvettes and are made of either glass or quartz depending on the region of the electromagnetic spectrum. The path length of the cell varies between 0.1 and 10 cm but the most common path length is 1.0 cm. Rectangular cells or cylindrical cells are routinely used. In addition, disposable polypropylene cells are used in the visible region. The quality of the absorbance signal is dependent on the quality of the cells used in terms of matching, cleaning as well as freedom from scratches. 53 Types of Instruments Instrumental designs for UV-visible photometers or spectrophotometers. In (a), a single-beam instrument is shown. Radiation from the filter or monochromator passes through either the reference cell or the sample cell before striking the photodetector. 55


15 15 58 Single-Beam Instruments for the Ultraviolet/Visible Region 60 Most common spectrophotometer: Spectronic On/Off switch and zero transmission adjustment knob 2. Wavelength selector/readout 3. Sample chamber 4. Blank adjustment knob 5. Absorbance/Transmitta nce scale 57 End view of the exit slit of the Spectronic 20 spectrophotometer pictured earlier 59
 Light is split and directed towards both reference")
 Advantages: Compensates for fluctuations in source intensity and drift in detector")

16 Double beam (most commercial instruments) Light is split and directed towards both reference cell (blank) and sample cell Two detectors; electronics measure ratio (i.e., measure/calculate absorbance) Advantages: Compensates for fluctuations in source intensity and drift in detector Better design for continuous recording of spectra General Instrument Designs Double Beam: In - Time Single-Beam Computerized Spectrophotometers 61 General Instrument Designs Double Beam: In - Space Needs two detectors 63 Inside of a singlebeam spectropho tometer connected to a computer.
17 Dual Beam Instruments 65 Merits of Double Beam Instruments 1.Compensate for all but the most short term fluctuation in radiant output of the source 2.Compensate drift in transducer and amplifier 3.Compensate for wide variations in source intensity with wavelength 67
.")


18 18 4. Multichannel Instruments Photodiode array detectors used (multichannel detector, can measure all wavelengths dispersed by grating simultaneously). Advantage: scan spectrum very quickly snapshot < 1 sec. Powerful tool for studies of transient intermediates in moderately fast reactions. Useful for kinetic studies. Useful for qualitative and quantitative determination of the components exiting from a liquid chromatographic column. 70 A multichannel diode-array spectrophotometer UV-Vis Absorption Spectroscopy Lecture 25 Multi-channel Design


.")
19 19 74 Location of Sample cell In all photometers and scanning spectrophotpmeters described above, the cell has been positioned after the monochromators. This is important to decrease the possibility of sample photodecomposition due to prolonged exposure to all frequencies coming from the source. However, the sample is positioned before the monochromator in multichannel instruments like a photodiode array spectrophotometer. This can be done without fear of photodecomposition since the sample exposure time is usually less than 1 s. Therefore, it is now clear that in UV-Vis where photodecomposition of samples can take place, the sample is placed after the monochromators in scanning instruments while positioning of the sample before the monochromators is advised in multichannel instruments Probe Type Instruments These are the same as conventional single beam instruments but the beam from the monochromators is guided through a bifurcated optical fiber to the sample container where absorption takes place. The attenuation in reflected beam at the specified wavelength is thus measured and related to concentration of analyte in the sample. A fiber optic cable can be referred to as a light pipe where light can be transmitted by the fiber without loss in intensity (when light hits the internal surface of the fiber at an angle larger than a critical angle). Therefore, fiber optics can be used to transmit light for very long distances without losses. A group of fibers can be combined together to form a fiber optic cable or bundle. A bifurcated fiber optic cable has three terminals where fibers from two separate cables are combined at one end to form the new configuration. 75


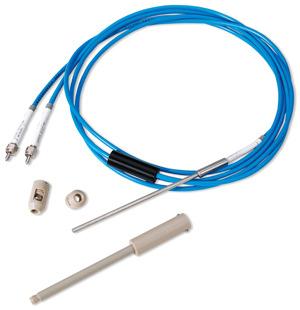
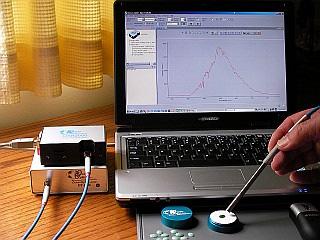
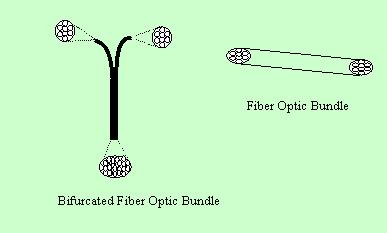
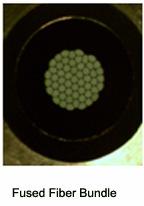
20 Fiber optic probe 77 79


21 21 6. Double Dispersing Instruments The instrument in this case has two gratings where the light beam leaving the first monochromators at a specified wavelength is directed to the second grating. This procedure results in better spectral resolution as well as decreased scattered radiation. However, double dispersing instruments are expensive and seem to offer limited advantages as compared to cost; especially in the UV-Vis region where exact wavelength may not be crucial Optical diagram of the Varian Cary 300 doubledispersing spectrophotom eter. A second monochromator is added immediately after the source.
22 Molar absorptivities ε = 8.7 x P A A: cross section of molecule in cm 2 (~10-15 ) P: Probability of the electronic transition (0-1) P>0.1 P>0.1-1 allowable transitions P<0.01 forbidden transitions Visible Absorption Spectra Applications of UV-Vis Spectroscopy Molecular Absorption Μ Μ + hν Μ (absorption ( 10-8 sec) Μ Μ Μ + heat (relaxation process) M* A+B+C (photochemical decomposition) Μ Μ Μ + hν (emission)


23 23 Molecular orbital is the nonlocalized fields between atoms that are occupied by bonding electrons. (when two atomic orbitals combine, either a low-energy bonding molecular orbital or a high energy antibonding molecular orbital results.) Sigma (σ) orbital The molecular orbital associated with single bonds in organic compounds Pi (π) orbital The molecular orbital associated with parallel overlap of atomic P orbital. overlap of atomic P orbital. n electrons No bonding electrons 90 MO Diagram for Formaldehyde (CH 2 O) H C O H σ = π = 92 n = The absorption of UV-visible radiation generally results from excitation of bonding electrons. can be used for quantitative and qualitative analysis 89 Molecular Transitions for UV-Visible Absorptions What electrons can we use for these transitions? 91
 from the n to π* * energy levels (non-bonding to anti-bonding).")
24 24 Type of Transitions σ σ* High energy required, vacuum UV range CH 4 : λ = 125 nm n σ* Saturated compounds, CH 3 OH H etc (λ ( = nm) n π* * and π π* Mostly used! λ = nm 94 UV-Visible Absorption Chromophores 96 Singlet vs. triplet In these diagrams, one electron has been excited (promoted) from the n to π* * energy levels (non-bonding to anti-bonding). One is a Singlet excited state, the other is a Triplet. 93 Examples of UV-Visible Absorptions LOW! 95

25 25 UV-Visible Absorption Chromophores 98 The effects of substitution Auxochrome function group Auxochrome is a functional group that does not absorb in UV region but has 100 the effect of shifting chromophore peaks to longer wavelength as well As increasing their intensity. Effects of solvents Blue shift (n- π*) (Hypsocromic ( shift) Increasing polarity of solvent Increasing polarity of solvent better solvation of electron pairs (n level has lower E) peak shifts to the blue (more energetic) 30 nm (hydrogen bond energy) Red shift (n- π* and π π*) (Bathochromic ( shift) Increasing polarity of solvent, then increase the attractive polarization forces between solvent and absorber, thus decreases the energy of the unexcited and excited states with the later greater peaks shift to the red 5 nm 97 Typical UV Absorption Spectra Chromophores? 99

26 List of common chromophores and their transitions Now solvents are your container container They need to be transparent and do not erase the fine structure arising from the vibrational effects Polar solvents generally tend to cause this problem 101 Same solvent must be Used when comparing absorption spectra for identification purpose. Summary of transitions for organic molecules σ σ* transition in vacuum UV (single bonds) n σ* saturated compounds with non-bonding electrons λ ~ nm ε ~ ( not strong) n π*, π π* requires unsaturated functional groups (eq. double bonds) most commonly used, energy good range for UV/Vis λ ~ nm n π* : ε ~ π π*: ε ~ ,
27 27 Rule of thumb for conjugation If greater then one single bond apart - ε are relatively additive (hyperchromic shift) - λ constant CH 3 CH 2 CH 2 CH=CH 2 λ max = 184 ε max = ~10,000 CH 2 =CHCH 2 CH 2 CH=CH 2 λ max =185 ε max = ~20,000 If conjugated - shifts to higher λ s (red shift) H 2 C=CHCH=CH 2 λ max =217 ε max = ~21, What about inorganics? Common anions n π* * nitrate (313 nm), carbonate (217 nm) Most transition-metal ions absorb in the UV/Vis Vis region. In the lanthanide and actinide series the absorption process results from electronic transitions of 4f and 5f electrons. For the first and second transition metal series the absorption process results from transitions of 3d and 4d electrons. The bands are often broad. The position of the maxima are strongly influenced by the chemical environment. The metal forms a complex with other stuff, called ligands.. The presence of the ligands splits the d-orbital d energies. 108 Organic Compounds Most organic spectra are complex Electronic and vibration transitions superimposed Absorption bands usually broad Detailed theoretical analysis not possible, but semi-quantitative or qualitative analysis of types of bonds is possible. 105 Effects of solvent & molecular details complicate comparison Spectral nomenclature of shifts 107
28 28 Charge-Transfer Transfer-Absorption A charge-transfer complex consists of an electron-donor group bonded to an electron acceptor. When this product absorbs radiation, an electron from the donor is transferred to an orbital that is largely associated with the acceptor. 1) Large molar absorptivity (ε max >10,000) 2) Many organic and inorganic complexes Transition metal ions
Chapter 13 An Introduction to Ultraviolet/Visible Molecular Absorption Spectrometry
 Chapter 13 An Introduction to Ultraviolet/Visible Molecular Absorption Spectrometry 13A Measurement Of Transmittance and Absorbance Absorption measurements based upon ultraviolet and visible radiation
Spectroscopy. Page 1 of 8 L.Pillay (2012)
") Spectroscopy Electromagnetic radiation is widely used in analytical chemistry. The identification and quantification of samples using electromagnetic radiation (light) is called spectroscopy. Light has
Spectroscopy Electromagnetic radiation is widely used in analytical chemistry. The identification and quantification of samples using electromagnetic radiation (light) is called spectroscopy. Light has
9/28/10. Visible and Ultraviolet Molecular Spectroscopy - (S-H-C Chapters 13-14) Valence Electronic Structure. n σ* transitions
 Valence Electronic Structure. n σ* transitions") Visible and Ultraviolet Molecular Spectroscopy - (S-H-C Chapters 13-14) Electromagnetic Spectrum - Molecular transitions Widely used in chemistry. Perhaps the most widely used in Biological Chemistry.
Visible and Ultraviolet Molecular Spectroscopy - (S-H-C Chapters 13-14) Electromagnetic Spectrum - Molecular transitions Widely used in chemistry. Perhaps the most widely used in Biological Chemistry.
Reference literature. (See: CHEM 2470 notes, Module 8 Textbook 6th ed., Chapters )
") September 17, 2018 Reference literature (See: CHEM 2470 notes, Module 8 Textbook 6th ed., Chapters 13-14 ) Reference.: https://slideplayer.com/slide/8354408/ Spectroscopy Usual Wavelength Type of Quantum
September 17, 2018 Reference literature (See: CHEM 2470 notes, Module 8 Textbook 6th ed., Chapters 13-14 ) Reference.: https://slideplayer.com/slide/8354408/ Spectroscopy Usual Wavelength Type of Quantum
1901 Application of Spectrophotometry
 1901 Application of Spectrophotometry Chemical Analysis Problem: 1 Application of Spectroscopy Organic Compounds Organic compounds with single bonds absorb in the UV region because electrons from single
Ultraviolet-Visible Spectroscopy
 Ultraviolet-Visible Spectroscopy Introduction to UV-Visible Absorption spectroscopy from 160 nm to 780 nm Measurement of transmittance Conversion to absorbance * A=-logT=εbc Measurement of transmittance
An Introduction to Ultraviolet-Visible Molecular Spectrometry (Chapter 13)
") An Introduction to Ultraviolet-Visible Molecular Spectrometry (Chapter 13) Beer s Law: A = -log T = -logp 0 / P = e x b x C See Table 13-1 for terms. In measuring absorbance or transmittance, one should
An Introduction to Ultraviolet-Visible Molecular Spectrometry (Chapter 13) Beer s Law: A = -log T = -logp 0 / P = e x b x C See Table 13-1 for terms. In measuring absorbance or transmittance, one should
Chapter 4 Ultraviolet and visible spectroscopy Molecular Spectrophotometry
 Chapter 4 Ultraviolet and visible spectroscopy Molecular Spectrophotometry Properties of light Electromagnetic radiation and electromagnetic spectrum Absorption of light Beer s law Limitation of Beer s
Ultraviolet-Visible and Infrared Spectrophotometry
 Ultraviolet-Visible and Infrared Spectrophotometry Ahmad Aqel Ifseisi Assistant Professor of Analytical Chemistry College of Science, Department of Chemistry King Saud University P.O. Box 2455 Riyadh 11451
Ultraviolet-Visible and Infrared Spectrophotometry
 Ultraviolet-Visible and Infrared Spectrophotometry Ahmad Aqel Ifseisi Assistant Professor of Analytical Chemistry College of Science, Department of Chemistry King Saud University P.O. Box 2455 Riyadh 11451
2001 Spectrometers. Instrument Machinery. Movies from this presentation can be access at
 2001 Spectrometers Instrument Machinery Movies from this presentation can be access at http://www.shsu.edu/~chm_tgc/sounds/sound.html Chp20: 1 Optical Instruments Instrument Components Components of various
10/2/2008. hc λ. νλ =c. proportional to frequency. Energy is inversely proportional to wavelength And is directly proportional to wavenumber
 CH217 Fundamentals of Analytical Chemistry Module Leader: Dr. Alison Willows Electromagnetic spectrum Properties of electromagnetic radiation Many properties of electromagnetic radiation can be described
R O Y G B V. Spin States. Outer Shell Electrons. Molecular Rotations. Inner Shell Electrons. Molecular Vibrations. Nuclear Transitions
 Spin States Molecular Rotations Molecular Vibrations Outer Shell Electrons Inner Shell Electrons Nuclear Transitions NMR EPR Microwave Absorption Spectroscopy Infrared Absorption Spectroscopy UV-vis Absorption,
Analytical Technologies in Biotechnology Prof. Dr. Ashwani K Sharma Department of Biotechnology Indian Institute of Technology, Roorkee
 Analytical Technologies in Biotechnology Prof. Dr. Ashwani K Sharma Department of Biotechnology Indian Institute of Technology, Roorkee Module - 6 Spectroscopic Techniques Lecture - 2 UV-Visible Spectroscopy
Advanced Analytical Chemistry
 84.514 Advanced Analytical Chemistry Part III Molecular Spectroscopy (continued) Website http://faculty.uml.edu/david_ryan/84.514 http://www.cem.msu.edu/~reusch/virtualtext/ Spectrpy/UV-Vis/spectrum.htm
25 Instruments for Optical Spectrometry
 25 Instruments for Optical Spectrometry 25A INSTRUMENT COMPONENTS (1) source of radiant energy (2) wavelength selector (3) sample container (4) detector (5) signal processor and readout (a) (b) (c) Fig.
Electronic Excitation by UV/Vis Spectroscopy :
 SPECTROSCOPY Light interacting with matter as an analytical tool III Pharm.D Department of Pharmaceutical Analysis SRM College Of Pharmacy,Katankulathur Electronic Excitation by UV/Vis Spectroscopy : X-ray:
Because light behaves like a wave, we can describe it in one of two ways by its wavelength or by its frequency.
 Light We can use different terms to describe light: Color Wavelength Frequency Light is composed of electromagnetic waves that travel through some medium. The properties of the medium determine how light
Spectroscopy: Introduction. Required reading Chapter 18 (pages ) Chapter 20 (pages )
 Chapter 20 (pages )") Spectroscopy: Introduction Required reading Chapter 18 (pages 378-397) Chapter 20 (pages 424-449) Spectrophotometry is any procedure that uses light to measure chemical concentrations Properties of Light
Spectroscopy: Introduction Required reading Chapter 18 (pages 378-397) Chapter 20 (pages 424-449) Spectrophotometry is any procedure that uses light to measure chemical concentrations Properties of Light
Chem 310 rd. 3 Homework Set Answers
 -1- Chem 310 rd 3 Homework Set Answers 1. A double line labeled S 0 represents the _ground electronic_ state and the _ground vibrational_ state of a molecule in an excitation state diagram. Light absorption
09/05/40 MOLECULAR ABSORPTION METHODS
 MOLECULAR ABSORPTION METHODS Absorption spectroscopy refers to spectroscopic techniques that measure the absorption of radiation, as a function of wavelength ( absorption spectrum ), due to its interaction
CHEM*3440. Photon Energy Units. Spectrum of Electromagnetic Radiation. Chemical Instrumentation. Spectroscopic Experimental Concept.
 Spectrum of Electromagnetic Radiation Electromagnetic radiation is light. Different energy light interacts with different motions in molecules. CHEM*344 Chemical Instrumentation Topic 7 Spectrometry Radiofrequency
Compact Knowledge: Absorbance Spectrophotometry. Flexible. Reliable. Personal.
 L A B O R A T O R Y C O M P E T E N C E Compact Knowledge: Absorbance Spectrophotometry Flexible. Reliable. Personal. The interaction of light with molecules is an essential and well accepted technique
World Journal of Pharmaceutical Research SJIF Impact Factor 8.074
 SJIF Impact Factor 8.074 Volume 7, Issue 11, 1170-1180. Review Article ISSN 2277 7105 DEVELOPMENT AND OPTIMIZATION OF UV-VIS SPECTROSCOPY - A REVIEW Govinda Verma* and Dr. Manish Mishra Shri Guru Ram Rai
UNIT 2 UV-VISIBLE SPECTROMETRY
 Molecular Spectroscopic Methods-I UNIT 2 UV-VISIBLE SPECTROMETRY Structure 2.1 Introduction Objectives 2.2 Origin and Characteristics of UV-VIS Spectrum Origin of UV-VIS spectrum Characteristics of UV-VIS
24 Introduction to Spectrochemical Methods
 24 Introduction to Spectrochemical Methods Spectroscopic method: based on measurement of the electromagnetic radiation produced or absorbed by analytes. electromagnetic radiation: include γ-ray, X-ray,
Course Details. Analytical Techniques Based on Optical Spectroscopy. Course Details. Textbook. SCCH 211: Analytical Chemistry I
 SCCH 211: Analytical Chemistry I Analytical Techniques Based on Optical Spectroscopy Course Details September 22 October 10 September 22 November 7 November 17 December 1 Topic Period Introduction to Spectrometric
two slits and 5 slits
 Electronic Spectroscopy 2015January19 1 1. UV-vis spectrometer 1.1. Grating spectrometer 1.2. Single slit: 1.2.1. I diffracted intensity at relative to un-diffracted beam 1.2.2. I - intensity of light
Chemistry Instrumental Analysis Lecture 11. Chem 4631
 Chemistry 4631 Instrumental Analysis Lecture 11 Molar Absorptivities Range 0 to 10 5 Magnitude of e depends on capture cross section of the species and probability of the energy-absorbing transition. e
Instrumental Analysis: Spectrophotometric Methods
 Instrumental Analysis: Spectrophotometric Methods 2007 By the end of this part of the course, you should be able to: Understand interaction between light and matter (absorbance, excitation, emission, luminescence,fluorescence,
A very brief history of the study of light
 1. Sir Isaac Newton 1672: A very brief history of the study of light Showed that the component colors of the visible portion of white light can be separated through a prism, which acts to bend the light
Reflection = EM strikes a boundary between two media differing in η and bounces back
 Reflection = EM strikes a boundary between two media differing in η and bounces back Incident ray θ 1 θ 2 Reflected ray Medium 1 (air) η = 1.00 Medium 2 (glass) η = 1.50 Specular reflection = situation
Molecular Spectroscopy
 Molecular Spectroscopy Types of transitions: 1) Electronic (UV-Vis-Near IR) 2) Vibrational (IR) 3) Rotational (microwave) Electronic Absorption Spectra π π* Gary L. Miessler and Donald A. Tarr, Inorganic
Chapter 15 Molecular Luminescence Spectrometry
 Chapter 15 Molecular Luminescence Spectrometry Two types of Luminescence methods are: 1) Photoluminescence, Light is directed onto a sample, where it is absorbed and imparts excess energy into the material
Chapter 17: Fundamentals of Spectrophotometry
 Chapter 17: Fundamentals of Spectrophotometry Spectroscopy: the science that deals with interactions of matter with electromagnetic radiation or other forms energy acoustic waves, beams of particles such
Chapter 17: Fundamentals of Spectrophotometry
 Chapter 17: Fundamentals of Spectrophotometry Spectroscopy: the science that deals with interactions of matter with electromagnetic radiation or other forms energy acoustic waves, beams of particles such
Reflection = EM strikes a boundary between two media differing in η and bounces back
 Reflection = EM strikes a boundary between two media differing in η and bounces back Incident ray θ 1 θ 2 Reflected ray Medium 1 (air) η = 1.00 Medium 2 (glass) η = 1.50 Specular reflection = situation
Infra Red Spectroscopy
 CH 2252 Instrumental Methods of Analysis Unit I Infra Red Spectroscopy M. Subramanian Assistant Professor Department of Chemical Engineering Sri Sivasubramaniya Nadar College of Engineering Kalavakkam
MOLECULAR AND ATOMIC SPECTROSCOPY
 MOLECULAR AND ATOMIC SPECTROSCOPY 1. General Background on Molecular Spectroscopy 3 1.1. Introduction 3 1.2. Beer s Law 5 1.3. Instrumental Setup of a Spectrophotometer 12 1.3.1. Radiation Sources 13 1.3.2.
Introduction to Spectroscopic methods
 Introduction to Spectroscopic methods Spectroscopy: Study of interaction between light* and matter. Spectrometry: Implies a quantitative measurement of intensity. * More generally speaking electromagnetic
Analytical Spectroscopy Review
 Analytical Spectroscopy Review λ = wavelength ν = frequency V = velocity = ν x λ = 2.998 x 10 8 m/sec = c (in a vacuum) ν is determined by source and does not change as wave propogates, but V can change
Skoog Chapter 7 Components of Optical Instruments
 Skoog Chapter 7 Components of Optical Instruments General Design of Optical Instruments Sources of Radiation Wavelength Selectors (Filters, Monochromators, Interferometers) Sample Containers Radiation
Instrumental Chemical Analysis
 L6 page 1 Instrumental Chemical Analysis Ultraviolet and visible spectroscopy Dr. Ahmad Najjar Philadelphia University Faculty of Pharmacy Department of Pharmaceutical Sciences 2 nd semester, 2016/2017
Instrumental Chemical Analysis
 L6 page 1 Instrumental Chemical Analysis Ultraviolet and visible spectroscopy Dr. Ahmad Najjar Philadelphia University Faculty of Pharmacy Department of Pharmaceutical Sciences 2 nd semester, 2016/2017
Outline of Recombinant DNA technology. Application of UV spectroscopy in recombinant DNA technology
 NIKHIL.K.POTDUKHE Outline of UV spectrophotometer Outline of Recombinant DNA technology Application of UV spectroscopy in recombinant DNA technology References Lambert law: When a beam of light is allowed
GENERAL PHARMACOPOEIA MONOGRAPH
 MINISTRY OF HEALTH OF THE RUSSIAN FEDERATION GENERAL PHARMACOPOEIA MONOGRAPH Spectrophotometry in the ultraviolet GPM.1.2.1.1.0003.15 and visible spectral regions Replaces the SPRF X GPM, SPRF XI GPM,
Basics of UV-Visible Spectroscopy *
 OpenStax-CNX module: m34525 1 Basics of UV-Visible Spectroscopy * Brittany L. Oliva-Chatelain Andrew R. Barron This work is produced by OpenStax-CNX and licensed under the Creative Commons Attribution
Lecture 3: Light absorbance
 Lecture 3: Light absorbance Perturbation Response 1 Light in Chemistry Light Response 0-3 Absorbance spectrum of benzene 2 Absorption Visible Light in Chemistry S 2 S 1 Fluorescence http://www.microscopyu.com
Molecular Luminescence Spectroscopy
 Molecular Luminescence Spectroscopy In Molecular Luminescence Spectrometry ( MLS ), molecules of the analyte in solution are excited to give a species whose emission spectrum provides information for qualitative
Skoog Chapter 6 Introduction to Spectrometric Methods
 Skoog Chapter 6 Introduction to Spectrometric Methods General Properties of Electromagnetic Radiation (EM) Wave Properties of EM Quantum Mechanical Properties of EM Quantitative Aspects of Spectrochemical
Spectrophotometry. Introduction
 Spectrophotometry Spectrophotometry is a method to measure how much a chemical substance absorbs light by measuring the intensity of light as a beam of light passes through sample solution. The basic principle
3 - Atomic Absorption Spectroscopy
 3 - Atomic Absorption Spectroscopy Introduction Atomic-absorption (AA) spectroscopy uses the absorption of light to measure the concentration of gas-phase atoms. Since samples are usually liquids or solids,
II. Spectrophotometry (Chapters 17, 19, 20)
") II. Spectrophotometry (Chapters 17, 19, 20) FUNDAMENTALS (Chapter 17) Spectrophotometry: any technique that uses light to measure concentrations (here: U and visible - ~190 800 nm) c = 2.99792 x 10 8 m/s
II. Spectrophotometry (Chapters 17, 19, 20) FUNDAMENTALS (Chapter 17) Spectrophotometry: any technique that uses light to measure concentrations (here: U and visible - ~190 800 nm) c = 2.99792 x 10 8 m/s
INTERNATIONAL JOURNAL OF INSTITUTIONAL PHARMACY AND LIFE SCIENCES
 International Journal of Institutional Pharmacy and Life Sciences 5(5): September-October 2015 INTERNATIONAL JOURNAL OF INSTITUTIONAL PHARMACY AND LIFE SCIENCES Pharmaceutical Sciences Review Article!!!
Overview of Spectroscopy
 Overview of Spectroscopy A. Definition: Interaction of EM Radiation with Matter We see objects because they remit some part of the light falling on them from a source. We function as reflection/ transmission
UV / Visible Spectroscopy. Click icon to add picture
 UV / Visible Spectroscopy Click icon to add picture Spectroscopy It is the branch of science that deals with the study of interaction of matter with light. OR It is the branch of science that deals with
1 WHAT IS SPECTROSCOPY?
 1 WHAT IS SPECTROSCOPY? 1.1 The Nature Of Electromagnetic Radiation Anyone who has been sunburnt will know that light packs a punch: in scientific terms, it contains considerable amounts of energy. All
Complete the following. Clearly mark your answers. YOU MUST SHOW YOUR WORK TO RECEIVE CREDIT.
 CHEM 322 Name Exam 3 Spring 2013 Complete the following. Clearly mark your answers. YOU MUST SHOW YOUR WORK TO RECEIVE CREDIT. Warm-up (3 points each). 1. In Raman Spectroscopy, molecules are promoted
Spectrophotometry. Dr. Shareef SHAIK ASST. PROFESSOR Pharmacology
 Spectrophotometry Dr. Shareef SHAIK ASST. PROFESSOR Pharmacology Content Introduction Beer-Lambert law Instrument Applications Introduction 3 Body fluids such as blood, csf and urine contain organic and
Chapter 18. Fundamentals of Spectrophotometry. Properties of Light
 Chapter 18 Fundamentals of Spectrophotometry Properties of Light Electromagnetic Radiation energy radiated in the form of a WAVE caused by an electric field interacting with a magnetic field result of
Chemistry 311: Instrumentation Analysis Topic 2: Atomic Spectroscopy. Chemistry 311: Instrumentation Analysis Topic 2: Atomic Spectroscopy
 Topic 1: Atomic Spectroscopy Text: Chapter 12,13 & 14 Rouessac (~2 weeks) 1.0 Review basic concepts in Spectroscopy 2.0 Atomic Absorption and Graphite Furnace Instruments 3.0 Inductively Coupled Plasmas
Spectrochemical methods
 Spectrochemical methods G. Galbács The interactions of radiations and matter are the subject of spectroscopy py or spectrochemical methods (also called spectrometry). Spectrochemical methods usually measure
Ch 313 FINAL EXAM OUTLINE Spring 2010
 Ch 313 FINAL EXAM OUTLINE Spring 2010 NOTE: Use this outline at your own risk sometimes a topic is omitted that you are still responsible for. It is meant to be a study aid and is not meant to be a replacement
Application of IR Raman Spectroscopy
 Application of IR Raman Spectroscopy 3 IR regions Structure and Functional Group Absorption IR Reflection IR Photoacoustic IR IR Emission Micro 10-1 Mid-IR Mid-IR absorption Samples Placed in cell (salt)
COLORIMETER AND LAMBERT S-BEER S LAW. Shingala vaishali Sandha prafulla Tiwari Kuldeep
 COLORIMETER AND LAMBERT S-BEER S LAW Shingala vaishali Sandha prafulla Tiwari Kuldeep TOPIC What is colorimeter? Use of colorimeter. Component & It s function. Function of colorimeter. The principle of
Chemistry 311: Instrumentation Analysis Topic 2: Atomic Spectroscopy. Chemistry 311: Instrumentation Analysis Topic 2: Atomic Spectroscopy
 Topic 2b: X-ray Fluorescence Spectrometry Text: Chapter 12 Rouessac (1 week) 4.0 X-ray Fluorescence Download, read and understand EPA method 6010C ICP-OES Winter 2009 Page 1 Atomic X-ray Spectrometry Fundamental
Ultraviolet/ Visible Absorption Spectroscopy
 CHEM*3440 Ultraviolet/ Visible Absorption Spectroscopy Widely used in Chemistry. Perhaps the most widely used in Biological Chemistry. Easy to do. Very easy to do wrong. Understand your experiment. CHEM
MOLECULAR ABSORPTION METHODS
 MOLECULAR ABSORPTION METHODS Absorption spectroscopy refers to spectroscopic techniques that measure the absorption of radiation, as a function of wavelength ( absorption spectrum ), due to its interaction
Paper: 12, Organic Spectroscopy Module: 5, Applications of UV spectroscopy
 Subject Chemistry Paper No and Title Module No and Title Module Tag Paper 12: Organic Spectroscopy Applications of UV-visible Spectroscopy CHE_P12_M5 TABLE OF CONTENTS 1. Learning Outcomes 2. Introduction
Absorption photometry
 The light Absorption photometry Szilvia Barkó University of Pécs, Faculty of Medicines, Dept. Biophysics February 2011 Transversal wave E Electromagnetic wave electric gradient vector wavelength The dual
Course: M.Sc (Chemistry) Analytical Chemistry Unit: III
 Analytical Chemistry Unit: III") Course: M.Sc (Chemistry) Analytical Chemistry Unit: III Syllabus: Principle of spectrophotometry Types of spectrophotometer Applications - Dissociation constants of an indicator simultaneous spectrophotometric
Course: M.Sc (Chemistry) Analytical Chemistry Unit: III Syllabus: Principle of spectrophotometry Types of spectrophotometer Applications - Dissociation constants of an indicator simultaneous spectrophotometric
Chemistry Instrumental Analysis Lecture 18. Chem 4631
 Chemistry 4631 Instrumental Analysis Lecture 18 Instrumentation Radiation sources Hollow cathode lamp Most common source Consist of W anode and a cathode sealed in a glass tube filled with Ne or Ar. Hollow
UV-Vis Spectroscopy. Chem 744 Spring Gregory R. Cook, NDSU Thursday, February 14, 13
 UV-Vis Spectroscopy Chem 744 Spring 2013 UV-Vis Spectroscopy Every organic molecule absorbs UV-visible light Energy of electronic transitions saturated functionality not in region that is easily accessible
Singlet. Fluorescence Spectroscopy * LUMO
 Fluorescence Spectroscopy Light can be absorbed and re-emitted by matter luminescence (photo-luminescence). There are two types of luminescence, in this discussion: fluorescence and phosphorescence. A
EXPERIMENT #3 A Beer's Law Study
 OBJECTVES: EXPERMENT #3 A Beer's Law Study To operate a Spectronic 20 To convert from percent transmission to absorbance units To plot absorbance versus wavelength and find max To plot absorbance versus
Reference. What is spectroscopy? What is Light? / EMR 11/15/2015. Principles of Spectroscopy. Processes in Spectroscopy
 Chapter 2 Principles of Spectroscopy EST 3203 Instrumental Analysis Rezaul Karim Environmental Science and Technology Jessore Science and Technology University Principles of Spectroscopy Electromagnetic
UV-Vis spektrometrie. Brno 2016, Dominik Heger, Ústav chemie a RECETOX, MU
 UV-Vis spektrometrie Brno 2016, Dominik Heger, http://hegerd.sci.muni.cz/ Ústav chemie a RECETOX, MU Sluneční světlo What is UV-VIS spectroscopy measuring? Electronic transitions. l / nm 185-200 Vacuum-UV
Model Answer (Paper code: AR-7112) M. Sc. (Physics) IV Semester Paper I: Laser Physics and Spectroscopy
 M. Sc. (Physics) IV Semester Paper I: Laser Physics and Spectroscopy") Model Answer (Paper code: AR-7112) M. Sc. (Physics) IV Semester Paper I: Laser Physics and Spectroscopy Section I Q1. Answer (i) (b) (ii) (d) (iii) (c) (iv) (c) (v) (a) (vi) (b) (vii) (b) (viii) (a) (ix)
Model Answer (Paper code: AR-7112) M. Sc. (Physics) IV Semester Paper I: Laser Physics and Spectroscopy Section I Q1. Answer (i) (b) (ii) (d) (iii) (c) (iv) (c) (v) (a) (vi) (b) (vii) (b) (viii) (a) (ix)
JABLONSKI DIAGRAM 2/15/16
 INDICATE THE EXCITED AND GROUND SINGLET AND TRIPLET STATES. INDICATE THE FOLLOWING TRANSITIONS: ABSORPTION, FLUORESCENCE, PHOSPHORESCENCE, NONRADIATIVE DECAY, INTERNAL CONVERSION AND INTERSYSTEM CROSSING.
Chem 321 Lecture 18 - Spectrophotometry 10/31/13
 Student Learning Objectives Chem 321 Lecture 18 - Spectrophotometry 10/31/13 In the lab you will use spectrophotometric techniques to determine the amount of iron, calcium and magnesium in unknowns. Although
Beer's Law and Data Analysis *
 OpenStax-CNX module: m15131 1 Beer's Law and Data Analysis * Mary McHale This work is produced by OpenStax-CNX and licensed under the Creative Commons Attribution License 2.0 1 Beer's Law and Data Analysis
Chemistry Instrumental Analysis Lecture 3. Chem 4631
 Chemistry 4631 Instrumental Analysis Lecture 3 Quantum Transitions The energy of a photon can also be transferred to an elementary particle by adsorption if the energy of the photon exactly matches the
February 8, 2018 Chemistry 328N
 Lecture 7 UV-Vis spectroscopy February 8, 2018 First Midterm Exam When: Wednesday, 2/14 When: 7-9 PM (please do not be late) Where: WEL 2.122 This room!!! What: Covers material through today s lecture
SPECTROPHOTOMETERS. Visible and UV-Visible
 Visible and UV-Visible The Manifacturer ONDA Spectrophotometers are manifactured by a company with over than ten years of experience in development of UV/Vis instruments, Single beam and Double beam, with
Design and Development of a Smartphone Based Visible Spectrophotometer for Analytical Applications
 Design and Development of a Smartphone Based Visible Spectrophotometer for Analytical Applications Bedanta Kr. Deka, D. Thakuria, H. Bora and S. Banerjee # Department of Physicis, B. Borooah College, Ulubari,
JABLONSKI DIAGRAM INTERACTIONS BETWEEN LIGHT AND MATTER LIGHT AS A WAVE LIGHT AS A PARTICLE 2/1/16. Photoelectric effect Absorp<on Emission ScaDering
 INTERACTIONS BETWEEN LIGHT AND MATTER LIGHT AS A WAVE Diffrac
Spectroscopy Problem Set February 22, 2018
 Spectroscopy Problem Set February, 018 4 3 5 1 6 7 8 1. In the diagram above which of the following represent vibrational relaxations? 1. Which of the following represent an absorbance? 3. Which of following
Lecture- 08 Emission and absorption spectra
 Atomic and Molecular Absorption Spectrometry for Pollution Monitoring Dr. J R Mudakavi Department of Chemical Engineering Indian Institute of Science, Bangalore Lecture- 08 Emission and absorption spectra
Analytical Chemistry II
 Analytical Chemistry II L4: Signal processing (selected slides) Computers in analytical chemistry Data acquisition Printing final results Data processing Data storage Graphical display https://www.creativecontrast.com/formal-revolution-of-computer.html
UV-Vis optical fiber assisted spectroscopy in thin films and solutions
 UV-Vis optical fiber assisted spectroscopy in thin films and solutions Description UV-Visible absorption and transmission spectra provide fundamental information for all experiments related to the attenuation
Content Writer : Dr.Vidya Kothekar, AIIMS New Delhi
 Course : PG Pathshala-Biophysics Paper 10 : TECHNIQUES USED IN MOLECULAR BIOPHYSICS II (Based on Spectroscopy) Module 06 : UV-Visible Spectroscopy: Beer-Lambert Law, instrumentation Content Writer : Dr.Vidya
Chemistry 304B, Spring 1999 Lecture 5 1. UV Spectroscopy:
 Chemistry 304B, Spring 1999 Lecture 5 1 Ultraviolet spectroscopy; UV Spectroscopy: Infrared spectroscopy; Nuclear magnetic resonance spectroscopy General basis of spectroscopy: Shine light at a collection
Laser Dissociation of Protonated PAHs
 100 Chapter 5 Laser Dissociation of Protonated PAHs 5.1 Experiments The photodissociation experiments were performed with protonated PAHs using different laser sources. The calculations from Chapter 3
What is spectroscopy?
 Absorption Spectrum What is spectroscopy? Studying the properties of matter through its interaction with different frequency components of the electromagnetic spectrum. With light, you aren t looking directly
Chemistry 524--Final Exam--Keiderling May 4, :30 -?? pm SES
 Chemistry 524--Final Exam--Keiderling May 4, 2011 3:30 -?? pm -- 4286 SES Please answer all questions in the answer book provided. Calculators, rulers, pens and pencils are permitted. No open books or
FLAME PHOTOMETRY AIM INTRODUCTION
 FLAME PHOTOMETRY AIM INTRODUCTION Atomic spectroscopy is based on the absorption, emission or fluorescence process of light by atoms or elementary ions. Information for atomic scale is obtained in two
Questions on Instrumental Methods of Analysis
 Questions on Instrumental Methods of Analysis 1. Which one of the following techniques can be used for the detection in a liquid chromatograph? a. Ultraviolet absorbance or refractive index measurement.
Emission spectrum of H
 Atomic Spectroscopy Atomic spectroscopy measures the spectra of elements in their atomic/ionized states. Atomic spectrometry, exploits quantized electronic transitions characteristic of each individual
UV-VIS Spectroscopy and Fluorescence Spectroscopy (Part 2 of 2)
") C101-E150 Vol. 18 UV-VIS Spectroscopy and Fluorescence Spectroscopy (Part 2 of 2) ------- 02 Applications: Introduction of Examples of Chemiluminescence and Electroluminescence Analyses Using a Spectrofluorophotometer
C101-E150 Vol. 18 UV-VIS Spectroscopy and Fluorescence Spectroscopy (Part 2 of 2) ------- 02 Applications: Introduction of Examples of Chemiluminescence and Electroluminescence Analyses Using a Spectrofluorophotometer
C101-E111. Talk Letter. Vol.2 February 2009
 C101-E111 UV Talk Letter Vol.2 February 2009 UV Talk Letter UV Talk Letter The Structure of a Spectrophotometer Vol.2 February 2009 1.The Measurement Principle Used by a Spectrophotometer The basic measurement