The Source Finder (SoFi)
|
|
|
- Elaine Carter
- 6 years ago
- Views:
Transcription


1 Wir schaffen Wissen heute für morgen Paul Scherrer Institute F. Canonaco, C. Bozzetti, K. Dällenbach, Y. Sosedova, J. G. Slowik, I. ElHaddad, M. Crippa, U. Baltensperger,A. S. H. Prévôt and many more The Source Finder (SoFi)
 bilinear PMF model rows of matrix F represent factor profiles columns of matrix G represent factor time series")
 assess amount of rotational ambiguity X model = G F = G T T 1 F = G F Paatero et al.")
2 page 2 Source apportionment technique - PMF advantages values in G & F are non-negative factors represent sources (POA) / aging (SOA) bilinear PMF model rows of matrix F represent factor profiles columns of matrix G represent factor time series minimizing Q disadvantages constant factor profiles (mass spectra) over PMF run assess number of factors assess statistical error (e.g. resampling strategy) assess amount of rotational ambiguity X model = G F = G T T 1 F = G F Paatero et al / 2002 / 2008


3 page 3 SoFi The interface in Igor Wavemetrics Pro Canonaco et al., 2013 SoFi 6.1 current version
4 General aspects Standard SoFi 6 stable SoFi version, no changes in architecture planned compatibility is guaranteed from 6.0 on freeware!current SoFi version is not compatible with Igor 7! It will be made compatible next year panel-oriented / user-friendly interface fast (exploits multiprocessors for PMF calc. and during the data treatment in Igor) storage of PMF runs in HDF files avoids memory problems in Igor and allows to perform and treat many PMF runs (thousands to millions) rotational and statistical uncertainty can be quantified (e.g. a value approach / fpeak combined with the resampling strategy «bootstrap») page 4
5 page 5 Combined variations in a values and day-wise bootstrap to estimate uncertainty number of repeats still in progress, at least 500 Canonaco et al., in prep., soon in AMTD
6 General aspects Add-ons to SoFi 6 license-based system PMF runs (!huge amount!) can be sorted based on user-defined list of criteria (see later) rolling mechanism, important for e.g. ambient long-term SA (see later) Commercial aspects spin-off will be opened up in coming months (currently F. Canonaco and C. Bozzetti) maintenance of the SoFi package and license system for the add-ons immediate troubleshooting service guaranteed by spin-off SA service offered offering online (i.e. while ACSM is measuring) SA service on Q-ACSM and ToF-ACSM in near future Eventually: offering off-line AMS analyses of filters including SA. page 6
7 Add-on to SoFi 6 Criteria-based approach various criteria, including their thresholds and weights can be easily defined in SoFi criterion, e.g. correlation coefficient, explained variation, peak in the diurnal cycle, distance between two factor profile variables, regression model., etc. thresholds backed up with e.g. literature data, based on significance test, etc. weights currently only for grafical purposes (different criteria distr. overlap) Example: Zurich ACSM data 2011/2012 page 7
8 Add-on to SoFi 6 Example: three criteria from the Zurich ACSM data 2011/2012 overlap between criteria distr. formes the total distr. (these PMF runs are further analyzed in SoFi) threshold determines which PMF runs are considered SoFi result analysis package weight guarantees that the criteria distr. fall ~in the same x-range page 8
 Example: Zurich ACSM data 2011/2012 Selection of PMF results on the active criterion (HOA) shows the Rpearson values on two passive criteria")
9 Add-on to SoFi 6 Criteria-based approach criteria can be either active (score relevant for the ranking of the PMF runs criteria discused before) or passive (score not relevant for the ranking of the PMF runs) Example: Zurich ACSM data 2011/2012 Selection of PMF results on the active criterion (HOA) shows the Rpearson values on two passive criteria page 9

10 Add-on to SoFi 6 Rolling mechanism PMF window can be automatically shifed over the PMF input matrix after every shift the PMF runs are reinitialized (seed, a value, fpeak, bootstrap, etc.) length of window and shift are user-defined parameters Example: Zurich ACSM data 2011/2012 X input page 10
 many small improvements in the graphs / bugs fixed problems during the iteration, occuring in some HR-AMS/elemental datasets solved calc.")
 relevant for HR-AMS x-axis labelling for all variable plots can be enabled, especially important for elemental/compounds data/hr-ams rapid inspection of")
11 Update to standard SoFi 6 SoFi 6.2 (November) many small improvements in the graphs / bugs fixed problems during the iteration, occuring in some HR-AMS/elemental datasets solved calc. of average PMF result is optional (saves time/memory in Igor) customized colors for factors customized selection of OM:OC calc. (Canagaratna or Aiken) relevant for HR-AMS x-axis labelling for all variable plots can be enabled, especially important for elemental/compounds data/hr-ams rapid inspection of raw / daily averaged factor time series PMF runs can be merged automatically in SoFi (manual «rolling PMF») separate PMF runs -important: rapid inspection of averaged factor profiles / t-dependent factor profiles page 11
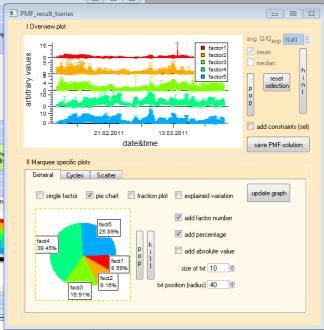
 feature of selecting certain time ranges, hours and /or days available in all time plots, including correlation table/graph, pie")
12 Update to standard SoFi 6 SoFi 6.2 (November) feature of selecting certain time ranges, hours and /or days available in all time plots, including correlation table/graph, pie charts (here only shown for a scatter plot) Selecting only: -weekdays -rush hours -period May/June 2011 page 12

 Thank you all")
13 page 13 Acknowledgments ACSM project supported by the Swiss Federal Office for the Environment (FOEN) Thank you all for the attention
ME-2 analysis of aerosol mass spectra using a new interface in IGOR Pro
 Wir schaffen Wissen heute für morgen Paul Scherrer Institut F. Canonaco, J. G. Slowik, U. Baltensperger, A. S. H. Prévôt ME-2 analysis of aerosol mass spectra using a new interface in IGOR Pro 28-March-2013
Identification and quantification of organic aerosol from cooking and other sources in Barcelona using aerosol mass spectrometer data
 1 2 3 4 5 6 7 8 9 10 11 12 13 14 15 16 17 18 19 20 21 22 23 24 25 26 27 28 29 Supplementary information for manuscript Identification and quantification of organic aerosol from cooking and other sources
Spent fuel inventory calculations in the SPIRE project: Current limits and expected improvements
 WIR SCHAFFEN WISSEN HEUTE FÜR MORGEN D. Rochman and M. Seidl, for the SPIRE project Spent fuel inventory calculations in the SPIRE project: Current limits and expected improvements Implementing Geological
Orbital Insight Energy: Oil Storage v5.1 Methodologies & Data Documentation
 Orbital Insight Energy: Oil Storage v5.1 Methodologies & Data Documentation Overview and Summary Orbital Insight Global Oil Storage leverages commercial satellite imagery, proprietary computer vision algorithms,
Virtual Beach Building a GBM Model
 Virtual Beach 3.0.6 Building a GBM Model Building, Evaluating and Validating Anytime Nowcast Models In this module you will learn how to: A. Build and evaluate an anytime GBM model B. Optimize a GBM model
R. Fröhlich et al. Correspondence to: A. Prévôt
 Supplement of Atmos. Chem. Phys. Discuss.,, 1, http://www.atmos-chem-phys-discuss.net//// doi:19/acpd----supplement Author(s). CC Attribution. License. Supplement of Fourteen months of on-line measurements
REGIONAL TRAINING COURSE ON METHODS AND TOOLS TO IDENTIFY SOURCES OF AIR POLLUTION
 REGIONAL TRAINING COURSE ON METHODS AND TOOLS TO IDENTIFY SOURCES OF AIR POLLUTION IAEA RER 1013: Supporting Air Quality Management Source apportionment by Positive Matrix Factorization Marta Almeida Email:
Source apportionment of submicron organic aerosols at an urban site by linear unmixing of aerosol mass spectra
 Source apportionment of submicron organic aerosols at an urban site by linear unmixing of aerosol mass spectra V. A. Lanz 1, M. R. Alfarra, U. Baltensperger, B. Buchmann 1, C. Hueglin 1, and A. S. H. Prévôt
Gridded Ambient Air Pollutant Concentrations for Southern California, User Notes authored by Beau MacDonald, 11/28/2017
 Gridded Ambient Air Pollutant Concentrations for Southern California, 1995-2014 User Notes authored by Beau, 11/28/2017 METADATA: Each raster file contains data for one pollutant (NO2, O3, PM2.5, and PM10)
Orange Visualization Tool (OVT) Manual
 Manual") Orange Visualization Tool (OVT) Manual This manual describes the features of the tool and how to use it. 1. Contents of the OVT Once the OVT is open (the first time it may take some seconds), it should
Orange Visualization Tool (OVT) Manual This manual describes the features of the tool and how to use it. 1. Contents of the OVT Once the OVT is open (the first time it may take some seconds), it should
Evaluating Physical, Chemical, and Biological Impacts from the Savannah Harbor Expansion Project Cooperative Agreement Number W912HZ
 Evaluating Physical, Chemical, and Biological Impacts from the Savannah Harbor Expansion Project Cooperative Agreement Number W912HZ-13-2-0013 Annual Report FY 2018 Submitted by Sergio Bernardes and Marguerite
Correlations in nuclear data from integral constraints
 WIR SCHAFFEN WISSEN HEUTE FÜR MORGEN D. Rochman 1, E. Bauge 2 and A.J. Koning 3 1 PSI, 2 CEA DAM DIF, France, 3 IAEA Correlations in nuclear data from integral constraints JEFDOC-1897 JEFF meeting, 20
Primary and secondary organic aerosol origin by combined gas-particle phase source apportionment
 Supplementary information for manuscript Primary and secondary organic aerosol origin by combined gas-particle phase source apportionment Crippa Monica 1, Canonaco Francesco 1, Slowik Jay G. 1, El Haddad
SeqAn and OpenMS Integration Workshop. Temesgen Dadi, Julianus Pfeuffer, Alexander Fillbrunn The Center for Integrative Bioinformatics (CIBI)
") SeqAn and OpenMS Integration Workshop Temesgen Dadi, Julianus Pfeuffer, Alexander Fillbrunn The Center for Integrative Bioinformatics (CIBI) Mass-spectrometry data analysis in KNIME Julianus Pfeuffer,
SeqAn and OpenMS Integration Workshop Temesgen Dadi, Julianus Pfeuffer, Alexander Fillbrunn The Center for Integrative Bioinformatics (CIBI) Mass-spectrometry data analysis in KNIME Julianus Pfeuffer,
Agilent MassHunter Profinder: Solving the Challenge of Isotopologue Extraction for Qualitative Flux Analysis
 Agilent MassHunter Profinder: Solving the Challenge of Isotopologue Extraction for Qualitative Flux Analysis Technical Overview Introduction Metabolomics studies measure the relative abundance of metabolites
Among various open-source GIS programs, QGIS can be the best suitable option which can be used across partners for reasons outlined below.
 Comparison of Geographic Information Systems (GIS) software As of January 2018, WHO has reached an agreement with ESRI (an international supplier of GIS software) for an unlimited use of ArcGIS Desktop
Agilent MassHunter Quantitative Data Analysis
 Agilent MassHunter Quantitative Data Analysis Presenters: Howard Sanford Stephen Harnos MassHunter Quantitation: Batch Table, Compound Information Setup, Calibration Curve and Globals Settings 1 MassHunter
An area chart emphasizes the trend of each value over time. An area chart also shows the relationship of parts to a whole.
 Excel 2003 Creating a Chart Introduction Page 1 By the end of this lesson, learners should be able to: Identify the parts of a chart Identify different types of charts Create an Embedded Chart Create a
Quick Reference Manual. Ver. 1.3
 Quick Reference Manual Ver. 1.3 1 EXASITE Voyage EXSITE Voyage is a web-based communication tool designed to support the following users; Ship operators who utilize Optimum Ship Routing (OSR) service in
HOW TO ANALYZE SYNCHROTRON DATA
 HOW TO ANALYZE SYNCHROTRON DATA 1 SYNCHROTRON APPLICATIONS - WHAT Diffraction data are collected on diffractometer lines at the world s synchrotron sources. Most synchrotrons have one or more user facilities
PeptideProphet: Validation of Peptide Assignments to MS/MS Spectra
 PeptideProphet: Validation of Peptide Assignments to MS/MS Spectra Andrew Keller Day 2 October 17, 2006 Andrew Keller Rosetta Bioinformatics, Seattle Outline Need to validate peptide assignments to MS/MS
PREDICTING OVERHEATING RISK IN HOMES
 PREDICTING OVERHEATING RISK IN HOMES Susie Diamond Inkling Anastasia Mylona CIBSE Simulation for Health and Wellbeing 27th June 2016 - CIBSE About Inkling Building Physics Consultancy Susie Diamond Claire
Monte Carlo Nuclear Data Assimilation via integral information
 Long-term international collaboration to improve nuclear data evaluation and evaluated data files meeting, 18-21 December 2017, IAEA, Vienna, Austria D. Rochman 1, E. Bauge 2, A.J. Koning 3 and J.Ch. Sublet
RiDMC: an R package for the numerical analysis of dynamical systems
 RiDMC: an R package for the numerical analysis of dynamical systems Antonio, Fabio Di Narzo 1 Marji Lines 2 1 Università degli studi di Bologna 2 Università degli studi di Udine UseR! 2008, Dortmund 12-08-2008
MassHunter TOF/QTOF Users Meeting
 MassHunter TOF/QTOF Users Meeting 1 Qualitative Analysis Workflows Workflows in Qualitative Analysis allow the user to only see and work with the areas and dialog boxes they need for their specific tasks
Skin Damage Visualizer TiVi60 User Manual
 Skin Damage Visualizer TiVi60 User Manual PIONEERS IN TISSUE VIABILITY IMAGING User Manual 3.2 Version 3.2 October 2013 Dear Valued Customer! TiVi60 Skin Damage Visualizer Welcome to the WheelsBridge Skin
M E R C E R W I N WA L K T H R O U G H
 H E A L T H W E A L T H C A R E E R WA L K T H R O U G H C L I E N T S O L U T I O N S T E A M T A B L E O F C O N T E N T 1. Login to the Tool 2 2. Published reports... 7 3. Select Results Criteria...
Quality Measures Green Light Report Online Management Tool. Self Guided Tutorial
 Quality Measures Green Light Report Online Management Tool Self Guided Tutorial 1 Tutorial Contents Overview Access the QM Green Light Report Review the QM Green Light Report Tips for Success Contact PointRight
AUTOMATIC AND INTERACTIVE ANALYSIS SOFTWARE FOR BETA- GAMMA COINCIDENCE SYSTEMS USED IN CTBT MONITORING
 ABSTRACT AUTOMATIC AND INTERACTIVE ANALYSIS SOFTWARE FOR BETA- GAMMA COINCIDENCE SYSTEMS USED IN CTBT MONITORING J. Rynes, K.M.F. Biegalski, P. Donohoe, and S. Biegalski Veridian Pacific-Sierra Research
Supplement of Constraining uncertainties in particle-wall deposition correction during SOA formation in chamber experiments
 Supplement of Atmos. Chem. Phys., 17, 2297 2310, 2017 http://www.atmos-chem-phys.net/17/2297/2017/ doi:10.5194/acp-17-2297-2017-supplement Author(s) 2017. CC Attribution 3.0 License. Supplement of Constraining
Bentley Map V8i (SELECTseries 3)
") Bentley Map V8i (SELECTseries 3) A quick overview Why Bentley Map Viewing and editing of geospatial data from file based GIS formats, spatial databases and raster Assembling geospatial/non-geospatial data
Bentley Map V8i (SELECTseries 3) A quick overview Why Bentley Map Viewing and editing of geospatial data from file based GIS formats, spatial databases and raster Assembling geospatial/non-geospatial data
Eurostat Business Cycle Clock (BCC): A user's guide
: A user's guide") EUROPEAN COMMISSION EUROSTAT Directorate C: National Accounts, Prices and Key Indicators Unit C-1: National accounts methodology. Indicators ESTAT.C.1 - National accounts methodology/indicators Eurostat
EUROPEAN COMMISSION EUROSTAT Directorate C: National Accounts, Prices and Key Indicators Unit C-1: National accounts methodology. Indicators ESTAT.C.1 - National accounts methodology/indicators Eurostat
ArcGIS GeoAnalytics Server: An Introduction. Sarah Ambrose and Ravi Narayanan
 ArcGIS GeoAnalytics Server: An Introduction Sarah Ambrose and Ravi Narayanan Overview Introduction Demos Analysis Concepts using GeoAnalytics Server GeoAnalytics Data Sources GeoAnalytics Server Administration
All Ions MS/MS: Targeted Screening and Quantitation Using Agilent TOF and Q-TOF LC/MS Systems
 All Ions MS/MS: Targeted Screening and Quantitation Using Agilent TOF and Q-TOF LC/MS Systems Technical Overview Introduction All Ions MS/MS is a technique that is available for Agilent high resolution
Contents. ID Quantique SA Tel: Chemin de la Marbrerie 3 Fax : Carouge
 Contents Introduction... 3 Quantis TRNG... 3 Quantifying Randomness... 4 Randomness Extractor... 4 Randomness Extraction in the Quantis Software Package... 5 Conclusion... 7 References... 7 ID Quantique
Sherlock Tutorial Plated Through Hole (PTH) Fatigue Analysis
 Fatigue Analysis") Sherlock Tutorial Plated Through Hole (PTH) Fatigue Analysis Background Plated Through Holes (PTHs), also known as plated through vias (PTVs), are holes drilled through multilayer printed circuit boards
Sherlock Tutorial Plated Through Hole (PTH) Fatigue Analysis Background Plated Through Holes (PTHs), also known as plated through vias (PTVs), are holes drilled through multilayer printed circuit boards
Photometry of Supernovae with Makali i
 Photometry of Supernovae with Makali i How to perform photometry specifically on supernovae targets using the free image processing software, Makali i This worksheet describes how to use photometry to
profileanalysis Innovation with Integrity Quickly pinpointing and identifying potential biomarkers in Proteomics and Metabolomics research
 profileanalysis Quickly pinpointing and identifying potential biomarkers in Proteomics and Metabolomics research Innovation with Integrity Omics Research Biomarker Discovery Made Easy by ProfileAnalysis
Computer simulation of radioactive decay
 Computer simulation of radioactive decay y now you should have worked your way through the introduction to Maple, as well as the introduction to data analysis using Excel Now we will explore radioactive
TENDL 2017: better cross sections, better covariances
 WIR SCHAFFEN WISSEN HEUTE FÜR MORGEN D. Rochman TENDL 2017: better cross sections, better covariances Workshop on TALYS/TENDL Developments, 13 15 November 2017, Prague, Czech Republic Summary Short history,
Comparison of the NCEP and DTC Verification Software Packages
 Comparison of the NCEP and DTC Verification Software Packages Point of Contact: Michelle Harrold September 2011 1. Introduction The National Centers for Environmental Prediction (NCEP) and the Developmental
ncounter PlexSet Data Analysis Guidelines
 ncounter PlexSet Data Analysis Guidelines NanoString Technologies, Inc. 530 airview Ave North Seattle, Washington 98109 USA Telephone: 206.378.6266 888.358.6266 E-mail: info@nanostring.com Molecules That
GIS-BASED DISASTER WARNING SYSTEM OF LOW TEMPERATURE AND SPARE SUNLIGHT IN GREENHOUSE
 GIS-BASED DISASTER WARNING SYSTEM OF LOW TEMPERATURE AND SPARE SUNLIGHT IN GREENHOUSE 1,2,* 1,2 Ruijiang Wei, Chunqiang Li, Xin Wang 1, 2 1 Hebei Provincial Institute of Meteorology, Shijiazhuang, Hebei
Online Passive-Aggressive Algorithms. Tirgul 11
 Online Passive-Aggressive Algorithms Tirgul 11 Multi-Label Classification 2 Multilabel Problem: Example Mapping Apps to smart folders: Assign an installed app to one or more folders Candy Crush Saga 3
Last updated: Copyright
 Last updated: 2012-08-20 Copyright 2004-2012 plabel (v2.4) User s Manual by Bioinformatics Group, Institute of Computing Technology, Chinese Academy of Sciences Tel: 86-10-62601016 Email: zhangkun01@ict.ac.cn,
DP Project Development Pvt. Ltd.
 Dear Sir/Madam, Greetings!!! Thanks for contacting DP Project Development for your training requirement. DP Project Development is leading professional training provider in GIS technologies and GIS application
Harvard Life Science Outreach December 7, 2017 Measuring ecosystem carbon fluxes using eddy covariance data ACTIVITIES I. NAME THAT ECOSYSTEM!
 Harvard Life Science Outreach December 7, 2017 Measuring ecosystem carbon fluxes using eddy covariance data ACTIVITIES I. NAME THAT ECOSYSTEM! Objective: Distinguish ecosystems (tropical forest vs. temperate
not for commercial-scale installations. Thus, there is a need to study the effects of snow on
 1. Problem Statement There is a great deal of uncertainty regarding the effects of snow depth on energy production from large-scale photovoltaic (PV) solar installations. The solar energy industry claims
Operational Perspectives on Hydrologic Model Data Assimilation
 Operational Perspectives on Hydrologic Model Data Assimilation Rob Hartman Hydrologist in Charge NOAA / National Weather Service California-Nevada River Forecast Center Sacramento, CA USA Outline Operational
Symbology Modification for Climate Studies. Rich Baldwin (NCDC/NOAA) Glen Reid (IMSG)
 Glen Reid (IMSG)") Symbology Modification for Climate Studies Rich Baldwin (NCDC/NOAA) Glen Reid (IMSG) June 3, 2005 Abstract The National Climatic Data Center archives worldwide weather data from the present date back to
Symbology Modification for Climate Studies Rich Baldwin (NCDC/NOAA) Glen Reid (IMSG) June 3, 2005 Abstract The National Climatic Data Center archives worldwide weather data from the present date back to
Visualization of Origin- Destination Commuter Flow Using CTPP Data and ArcGIS
 Visualization of Origin- Destination Commuter Flow Using CTPP Data and ArcGIS Research & Analysis Department Southern California Association of Governments 2015 ESRI User Conference l July 23, 2015 l San
Measuring Colocalization within Fluorescence Microscopy Images
 from photonics.com: 03/01/2007 http://www.photonics.com/article.aspx?aid=39341 Measuring Colocalization within Fluorescence Microscopy Images Two-color fluorescence-based methods are uncovering molecular
NMR Predictor. Introduction
 NMR Predictor This manual gives a walk-through on how to use the NMR Predictor: Introduction NMR Predictor QuickHelp NMR Predictor Overview Chemical features GUI features Usage Menu system File menu Edit
Element x in D is called the input or the independent variable of the function.
 P a g e 1 Chapter 1. Functions and Mathematical Models Definition: Function A function f defined on a collection D of numbers is a rule that assigns to each number x in D a specific number f(x) or y. We
Introduction to ArcMap
 Introduction to ArcMap ArcMap ArcMap is a Map-centric GUI tool used to perform map-based tasks Mapping Create maps by working geographically and interactively Display and present Export or print Publish
Step-by-Step Procedure for Creating Customized BEx Maps
 Step-by-Step Procedure for Creating Customized BEx Maps Applies to: SAP BI or product release (release 701, level 0004, SAP EHP 1 for SAP NetWeaver 7.0). For more information, visit the Business Intelligence
4-7 Inverse Linear Functions
 Find the inverse of each relation. 1. {(4, 15), ( 8, 18), ( 2, 16.5), (3, 15.25)} {( 15, 4), ( 18, 8), ( 16.5, 2), ( 15.25, 3)} 2. {(11.8, 3), (3.7, 0), (1, 1), ( 12.5, 6)} Graph the inverse of each relation.
The Scope and Growth of Spatial Analysis in the Social Sciences
 context. 2 We applied these search terms to six online bibliographic indexes of social science Completed as part of the CSISS literature search initiative on November 18, 2003 The Scope and Growth of Spatial
Fleet Asset Management
 Fleet Asset Management Maximum Profit by Minimum Planning April, 2017 1 PERFORMERS Performance is all that matters and that is what Fleet Asset Management is all about Brad Pitt Einstein Old Russian lady
Mapcube and Mapview. Two Web-based Spatial Data Visualization and Mining Systems. C.T. Lu, Y. Kou, H. Wang Dept. of Computer Science Virginia Tech
 Mapcube and Mapview Two Web-based Spatial Data Visualization and Mining Systems C.T. Lu, Y. Kou, H. Wang Dept. of Computer Science Virginia Tech S. Shekhar, P. Zhang, R. Liu Dept. of Computer Science University
Cosmic Ray Detector Software
 Cosmic Ray Detector Software Studying cosmic rays has never been easier Matthew Jones Purdue University 2012 QuarkNet Summer Workshop 1 Brief History First cosmic ray detector built at Purdue in about
CS 664 Segmentation (2) Daniel Huttenlocher
 Daniel Huttenlocher") CS 664 Segmentation (2) Daniel Huttenlocher Recap Last time covered perceptual organization more broadly, focused in on pixel-wise segmentation Covered local graph-based methods such as MST and Felzenszwalb-Huttenlocher
CS 664 Segmentation (2) Daniel Huttenlocher Recap Last time covered perceptual organization more broadly, focused in on pixel-wise segmentation Covered local graph-based methods such as MST and Felzenszwalb-Huttenlocher
new interface and features
 Web version of SciFinder : new interface and features Bhawat Ruangying, CAS representative Updated at 22 Dec 2009 www.cas.org SciFinder web interface Technical aspects of SciFinder Web SciFinder URL :
Introduction to IsoMAP Isoscapes Modeling, Analysis, and Prediction
 Introduction to IsoMAP Isoscapes Modeling, Analysis, and Prediction What is IsoMAP To the user, and online workspace for: Accessing, manipulating, and analyzing, and modeling environmental isotope data
INTRODUCTION TO ARCGIS Version 10.*
 Week 3 INTRODUCTION TO ARCGIS Version 10.* topics of the week Overview of ArcGIS Using ArcCatalog Overview of ArcGIS Desktop ArcGIS Overview Scalable desktop applications ArcView ArcEditor ArcInfo ArcGIS
Nomination Form. Clearinghouse. New York State Office for Technology. Address: State Capitol-ESP, PO Box
 NASIRE 2001 RECOGNITION AWARDS Recognizing Outstanding Achievement in the Field of Innovative Use of Technology Nomination Form Title of Nomination: Manager/Job Title: Agency: NYS Geographic Information
DRUG DISCOVERY TODAY ELN ELN. Chemistry. Biology. Known ligands. DBs. Generate chemistry ideas. Check chemical feasibility In-house.
 DRUG DISCOVERY TODAY Known ligands Chemistry ELN DBs Knowledge survey Therapeutic target Generate chemistry ideas Check chemical feasibility In-house Analyze SAR Synthesize or buy Report Test Journals
AUTOMATED METERED WATER CONSUMPTION ANALYSIS
 AUTOMATED METERED WATER CONSUMPTION ANALYSIS Shane Zhong 1, Nick Turich 1, Patrick Hayde 1 1. Treatment and Network Planning, SA Water, Adelaide, SA, Australia ABSTRACT Water utilities collect and store
Enabling Success in Enterprise Asset Management: Case Study for Developing and Integrating GIS with CMMS for a Large WWTP
 Enabling Success in Enterprise Asset Management: Case Study for Developing and Integrating GIS with CMMS for a Large WWTP Allison Blake, P.E. 1*, Matthew Jalbert, P.E. 2, Julia J. Hunt, P.E. 2, Mazen Kawasmi,
Virtual Beach Making Nowcast Predictions
 Virtual Beach 3.0.6 Making Nowcast Predictions In this module you will learn how to: A. Create a real-time connection to Web data services through EnDDaT B. Download real-time data to make a Nowcast prediction
HOW TO USE MIKANA. 1. Decompress the zip file MATLAB.zip. This will create the directory MIKANA.
 HOW TO USE MIKANA MIKANA (Method to Infer Kinetics And Network Architecture) is a novel computational method to infer reaction mechanisms and estimate the kinetic parameters of biochemical pathways from
Determination of Density 1
 Introduction Determination of Density 1 Authors: B. D. Lamp, D. L. McCurdy, V. M. Pultz and J. M. McCormick* Last Update: February 1, 2013 Not so long ago a statistical data analysis of any data set larger
Exploring Human Mobility with Multi-Source Data at Extremely Large Metropolitan Scales. ACM MobiCom 2014, Maui, HI
 Exploring Human Mobility with Multi-Source Data at Extremely Large Metropolitan Scales Desheng Zhang & Tian He University of Minnesota, USA Jun Huang, Ye Li, Fan Zhang, Chengzhong Xu Shenzhen Institute
Week 8 Cookbook: Review and Reflection
 : Review and Reflection Week 8 Overview 8.1) Review and Reflection 8.2) Making Intelligent Maps: The map sheet as a blank canvas 8.3) Making Intelligent Maps: Base layers and analysis layers 8.4) ArcGIS
Imago: open-source toolkit for 2D chemical structure image recognition
 Imago: open-source toolkit for 2D chemical structure image recognition Viktor Smolov *, Fedor Zentsev and Mikhail Rybalkin GGA Software Services LLC Abstract Different chemical databases contain molecule
Release Notes Digimat 6.0.1
 Release Notes Digimat 6.0.1 May 2015 p. 2 p. 3 p.4 p. 6 p. 7 p. 9 - p.10 1 P a g e C o p y r i g h t M S C S o f t w a r e B e l g i u m, 2015 New Capabilities Failure indicators o Temperature dependent
Models, Data, Learning Problems
 Universität Potsdam Institut für Informatik Lehrstuhl Maschinelles Lernen Models, Data, Learning Problems Tobias Scheffer Overview Types of learning problems: Supervised Learning (Classification, Regression,
Autodock tutorial VINA with UCSF Chimera
 Autodock tutorial VINA with UCSF Chimera José R. Valverde CNB/CSIC jrvalverde@cnb.csic.es José R. Valverde, 2014 CC-BY-NC-SA Loading the receptor Open UCSF Chimera and then load the protein: File Open
Tutorial 1: Setting up your Skyline document
 Tutorial 1: Setting up your Skyline document Caution! For using Skyline the number formats of your computer have to be set to English (United States). Open the Control Panel Clock, Language, and Region
Scalable and Power-Efficient Data Mining Kernels
 Scalable and Power-Efficient Data Mining Kernels Alok Choudhary, John G. Searle Professor Dept. of Electrical Engineering and Computer Science and Professor, Kellogg School of Management Director of the
CS570 Introduction to Data Mining
 CS570 Introduction to Data Mining Department of Mathematics and Computer Science Li Xiong Data Exploration and Data Preprocessing Data and Attributes Data exploration Data pre-processing Data cleaning
ionos The most advanced stable isotope software ever created
 ionos The most advanced stable isotope software ever created ionos Fast and robust data processing of the most complex samples ionos is the most advanced software ever created for the stable isotope community.
Appendix F: Projecting Future Sea Level Rise with the SLRRP Model
 Appendix F: Projecting Future Sea Level Rise with the SLRRP Model The Sea Level Rise Rectification Program (SLRRP) is a software package designed with a user-friendly interface to generate a suite of future
Demand Forecasting. for. Microsoft Dynamics 365 for Operations. User Guide. Release 7.1. April 2018
 Demand Forecasting for Microsoft Dynamics 365 for Operations User Guide Release 7.1 April 2018 2018 Farsight Solutions Limited All Rights Reserved. Portions copyright Business Forecast Systems, Inc. This
Compounding insights Thermo Scientific Compound Discoverer Software
 Compounding insights Thermo Scientific Compound Discoverer Software Integrated, complete, toolset solves small-molecule analysis challenges Thermo Scientific Orbitrap mass spectrometers produce information-rich
MassHunter Software Overview
 MassHunter Software Overview 1 Qualitative Analysis Workflows Workflows in Qualitative Analysis allow the user to only see and work with the areas and dialog boxes they need for their specific tasks A
G-APD + plastic scintillator: fast timing in high magnetic fields
 NDIP 2011 Wir schaffen Wissen heute für morgen Paul Scherrer Institut Alexey Stoykov, Robert Scheuermann, Kamil Sedlak G-APD + plastic scintillator: fast timing in high magnetic fields Outline Scintillation
System Performance Ratings of High Speed Nano Devices Using Fuzzy Logic
 www.ijcsi.org 302 ormance Ratings of High Speed Nano Devices Using Fuzzy Logic Ak.Ashakumar Singh Y.Surjit Singh K.Surchandra Singh Department of Computer Science Dept. of Computer Science Dept. of Computer
Fog Monitor 100 (FM 100) Extinction Module. Operator Manual
 Extinction Module. Operator Manual") Particle Analysis and Display System (PADS): Fog Monitor 100 (FM 100) Extinction Module Operator Manual DOC-0217 Rev A-1 PADS 2.7.3, FM 100 Extinction Module 2.7.0 5710 Flatiron Parkway, Unit B Boulder,
Particle Analysis and Display System (PADS): Fog Monitor 100 (FM 100) Extinction Module Operator Manual DOC-0217 Rev A-1 PADS 2.7.3, FM 100 Extinction Module 2.7.0 5710 Flatiron Parkway, Unit B Boulder,
Technical Procedure for Glass Refractive Index Measurement System 3 (GRIM 3)
") Technical Procedure for Glass Refractive Index Measurement System 3 (GRIM 3) 1.0 Purpose - This technical procedure shall be followed for the operation of the GRIM 3. 2.0 Scope - This procedure applies
Technical Procedure for Glass Refractive Index Measurement System 3 (GRIM 3) 1.0 Purpose - This technical procedure shall be followed for the operation of the GRIM 3. 2.0 Scope - This procedure applies
1. Prepare the MALDI sample plate by spotting an angiotensin standard and the test sample(s).
.") Analysis of a Peptide Sequence from a Proteolytic Digest by MALDI-TOF Post-Source Decay (PSD) and Collision-Induced Dissociation (CID) Standard Operating Procedure Purpose: The following procedure may
Analysis of a Peptide Sequence from a Proteolytic Digest by MALDI-TOF Post-Source Decay (PSD) and Collision-Induced Dissociation (CID) Standard Operating Procedure Purpose: The following procedure may
GIS-T 2010 Building a Successful Geospatial Data Sharing Framework: A Ohio DOT Success Story
 GIS-T 2010 Building a Successful Geospatial Data Sharing Framework: A Ohio DOT Success Story ODOT District 2 GIS John Puente District 1 GIS Coordinator\ Planning Administrator 2 Interoperability 3 District
MUDMAP TM. Software Description
 ASA Applied Science Associates, Inc. 70 Dean Knauss Drive Narragansett, RI 02882-1143 U.S.A. Tel: 401-789-6224 Fax: 401-789-1932 asa@asascience.com www.asascience.com MUDMAP TM Software Description MUDMAP
Ionization Efficiency Calibration Tutorial for the ToF-AMS
 Ionization Efficiency Calibration Tutorial for the ToF-AMS AMS Users Meeting September 17, 2006 Edward Dunlea, University of Colorado Thanks to: Roya, Ann, Pete, Ken, Ingrid, Dara, Qi, Shane, John, Jose,
DIAGNOSTICS NO TOUCH FOREHEAD THERMOMETER
 DIAGNOSTICS NO TOUCH FOREHEAD THERMOMETER nu-beca NO TOUCH THERMOMETER : Thank you for purchasing the nu-beca No Touch Forehead Thermometer. Please read this instruction manual first so you can use this
PeptideProphet: Validation of Peptide Assignments to MS/MS Spectra. Andrew Keller
 PeptideProphet: Validation of Peptide Assignments to MS/MS Spectra Andrew Keller Outline Need to validate peptide assignments to MS/MS spectra Statistical approach to validation Running PeptideProphet
FireFamilyPlus Version 5.0
 FireFamilyPlus Version 5.0 Working with the new 2016 NFDRS model Objectives During this presentation, we will discuss Changes to FireFamilyPlus Data requirements for NFDRS2016 Quality control for data
Road weather forecast for different customer systems in Switzerland
 Proceedings of the 10th SIRWEC Conference. 22-24 March 2000. Davos. Switzerland 10 Road weather forecast for different customer systems in Switzerland Foreword André-Charles Letestu and Urs Keller Swiss
Labor für Endlagersicherheit
 WIR SCHAFFEN WISSEN HEUTE FÜR MORGEN Sergey V. Churakov :: Laboratory for Waste Management :: Paul Scherrer Institut Labor für Endlagersicherheit NES Kompetenzen und Highlights, Oktober 18, 2016, PSI Outline
CREATING CUSTOMIZED DATE RANGE COLLECTIONS IN PRESENTATION STUDIO
 CREATING CUSTOMIZED DATE RANGE COLLECTIONS IN PRESENTATION STUDIO Date range collections are pre-defined reporting periods for performance data. You have two options: Dynamic date ranges automatically