Evaluation of lower/middle tropospheric ozone from air quality models using TES and ozonesondes
|
|
|
- Ralf Daniels
- 5 years ago
- Views:
Transcription
1 Evaluation of lower/middle tropospheric ozone from air quality models using TES and ozonesondes Greg Osterman, Jessica Neu, Annmarie Eldering, Jeff McQueen, Youhua Tang, Rob Pinder Air Quality Applied Sciences Team 3 rd Meeting June 13, , California Institute of Technology, Government Sponsorship Acknowledged
2 Investigators Annmarie Eldering (PI, JPL), Jessica Neu (JPL) Greg Osterman (JPL) Jeff McQueen, Youhua Tang (NOAA/NWS) Rob Pinder (EPA) 2

3 Project Objectives Evaluation of ozone, carbon monoxide and other key fields from the EPA CMAQ and NOAA National Air Quality Forecast Capability (NAQFC) in the middle/lower troposphere using satellite data Characterize nighttime ozone aloft using satellite data and ozonesondes Evaluate the ability of the air quality models to capture nighttime ozone aloft and possible relationship to air quality events Case Studies: Analyze a set of air quality events and determine if there is a relationship to nighttime ozone aloft 3
4 Data and Models Models: NAQFC Forecast EPA CMAQ Time Periods July/August 2006, 2008, 2009 Evaluation Data Sets: Satellite data from TES (O3, CO, TATM, H2O), and OMI (O3, NO2) Ozonesondes Surface monitors 4


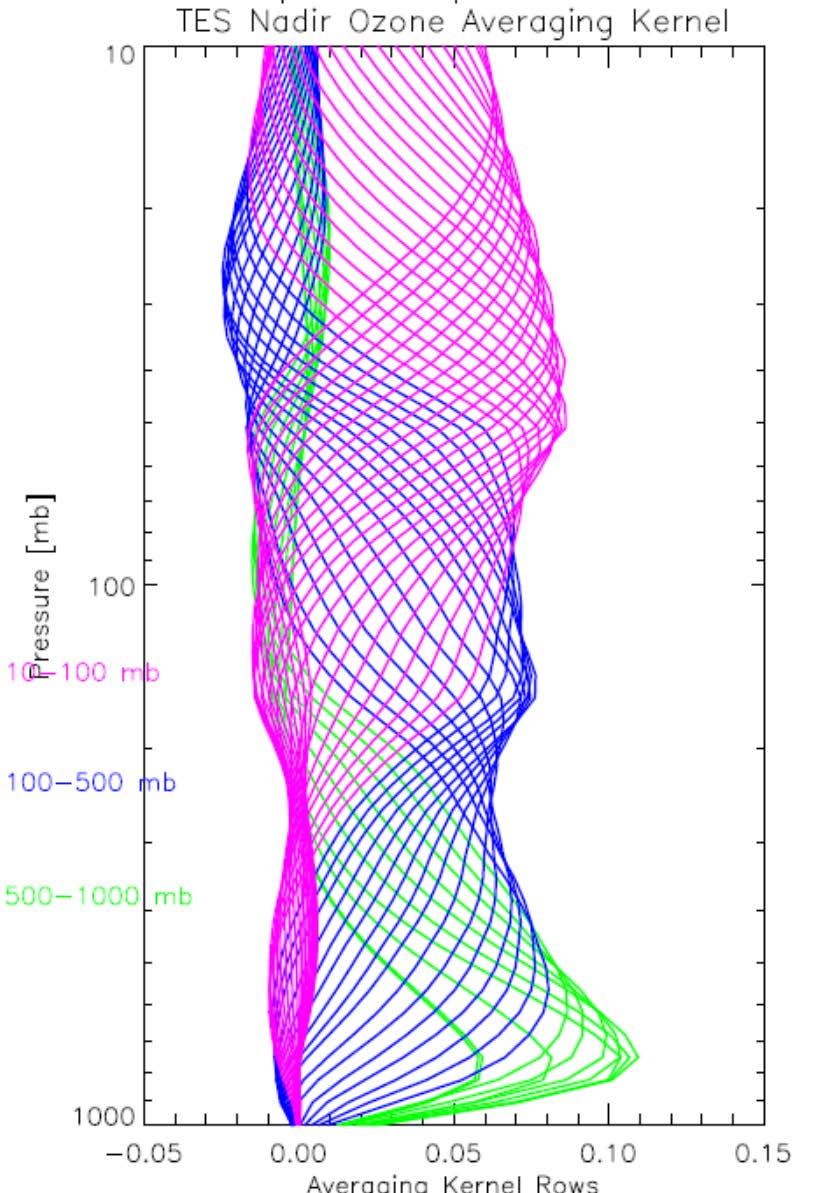
5 TES on EOS-Aura Launched TES Measures in Nadir Mode (~01:30 AM/PM Local Time): Ozone Carbon Monoxide Water Vapor and HDO Ammonia Methane and Carbon Dioxide Surface Temperature (Sea Surface Temperature) 5


6 TES Nadir Coverage TES Footprint 5 x 8 km Global Survey footprints 180 km apart Step & Stare footprints 45 km apart Special observation Transect footprints 12 km apart Special observation 6
7 TES Observations Aug 28-29,
8 Profile Comparison: Daytime on Aug 29, 2006 Huntsville, AL 8


9 TES vs EPA CMAQ O3 Aug 28-29,

10 TES Observations Aug 16-17,

11 TES O3 Observations Aug 16-17,
12 EPA CMAQ Curtains Aug 16-17,
13 CMAQ, TES Difference: Aug 16-17,
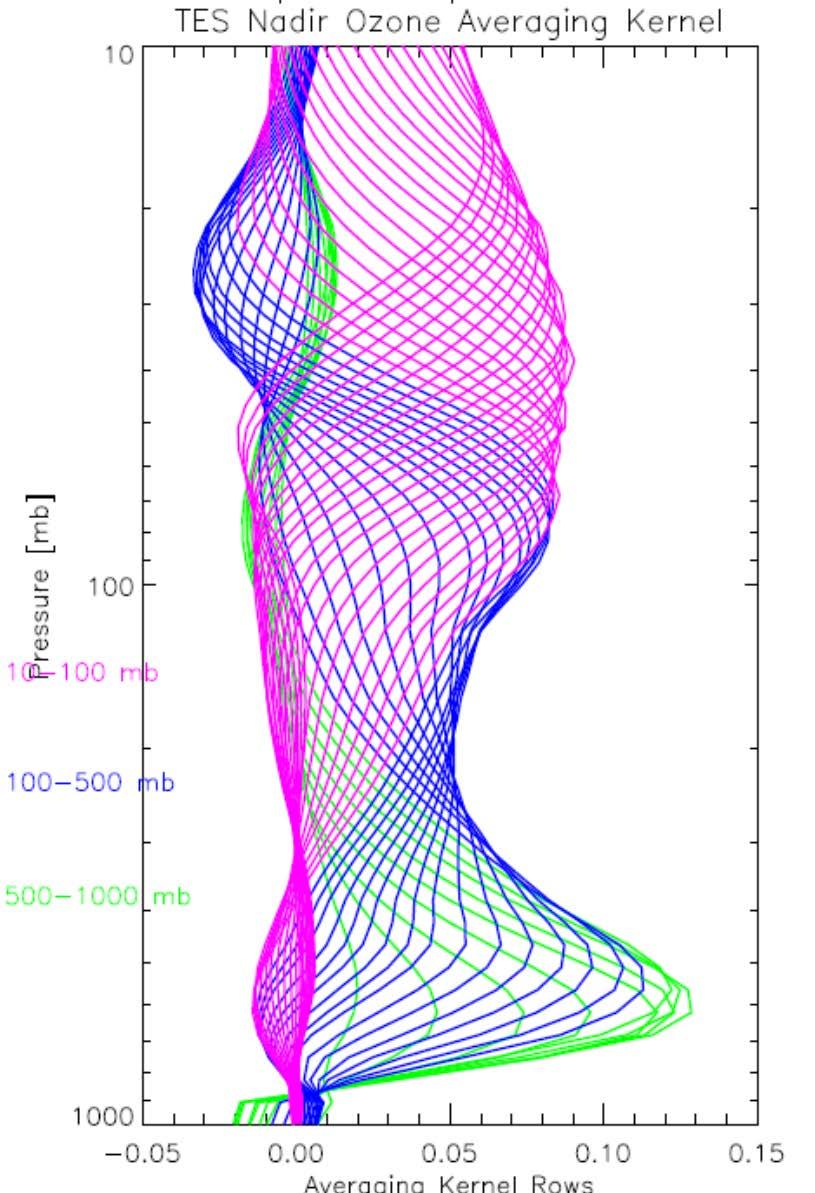
14 PDFs TES, CMAQ matches are nearest in time, latitude and longitude Model interpolated to TES pressure grid and observation operator (averaging kernel) is applied Only TES data that passes the master quality flag is used Pressure < 160 hpa Diagonal of averaging kernel >
15 TES, NOAA/NWS AQ Forecast Comparisons Forecast model using forecast meteorology Older, static boundary conditions Will repeat using more recent dates 15

16 TES, EPA CMAQ Comparisons 16
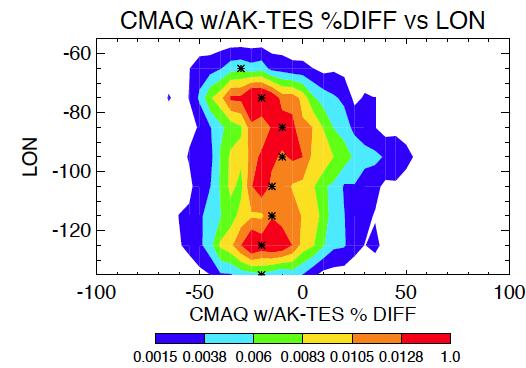
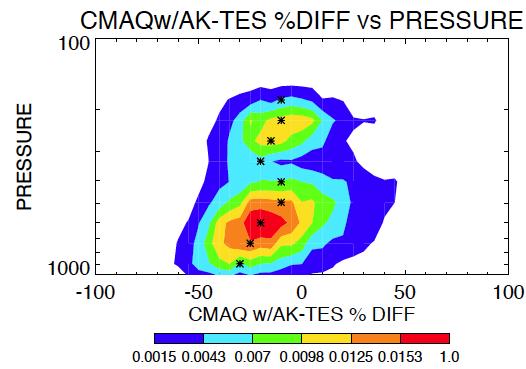
17 CMAQ-TES Difference Aug 2006 Model is low compared to TES Most TES obs between hpa 17
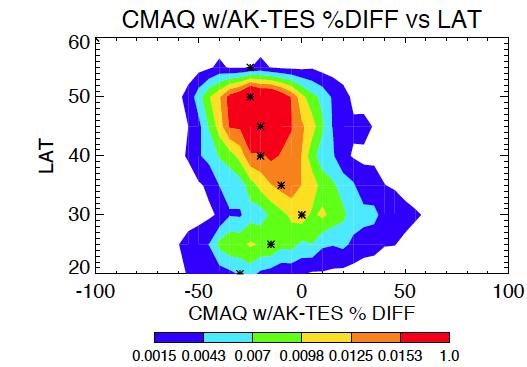
18 CMAQ-TES Difference vs Latitude 18

19 Different Latitudes - Agreement is better between N - Sensitivity at lower pressure levels between 30-40N 19
20 Clean vs Polluted Cases - Agreement better in polluted cases 20

21 Polluted vs Pressure 21

22 Nighttime - Most observations in the middle troposphere - Still see bias between model and TES, but lower at peak TES sensitivity 22
23 Status & Next Steps Status: Initial set of CMAQ, TES and sonde comparisons have been completed Developed method of visualizing the comparisons Completed preliminary evaluation of aggregated model results using TES for August 2006 Next Steps: Continue comparison of August 2006 model results to ozonesondes Incorporate surface monitor data into comparisons Repeat analysis for other seasons, years Focus on nighttime ozone comparisons and identify case study opportunities 23
24 Extra

25 TES O3 Observations Aug 28-29,
26 EPA CMAQ Curtains Aug 28-29,
27 CMAQ, TES Difference: Aug 28-29,
28 28
29 TES
30 TES on EOS-Aura Launched
31 Air Quality Model Evaluation using TES
")
32 Elevated CO and O3 over SE Texas observed from TES on Aug 23, 2006 TES O3 TES CO TES resolves peaks in middle and lower tropospheric O3 and CO over East Texas Used to identify high ozone in middle troposphere Assimilated (along with OMI and MLS data) into RAQMS 32

33 AIRS & TES CO August 23,
34 Aug 23,
35 Aug 23,
36 TES Step & Stare
37 TES Step & Stare Surface Ozone near Longview - Aug 23, Ozone (ppb) Surface Monitor CMAQ Latitude 37
38 TES Step & Stare Ozone Profile near Longview, TX - Aug 23, Pressure (hpa) CMAQ CMAQ (TES AK) TES Ozone (ppm) 38


39 TES Step & Stare
40 TES Step & Stare Surface Ozone near Beaumont- Aug 23, Ozone (ppb) Surface Monitor CMAQ Latitude 40
41 TES Step & Stare Ozone Profile near Beaumont, TX - Aug 23, Pressure (hpa) CMAQ CMAQ (TES AK) TES Ozone (ppm) 41
42 TES Step & Stare Ozone over the Gulf of Mexico, TX - Aug 23, Pressure (hpa) CMAQ CMAQ (TES AK) TES Ozone (ppm) 42
43 Ozone at Max TES Sensitivity - Aug 23, Ozone (ppb) TES CMAQ Latitude Pressure of Max TES Sensitivity - Aug 23, 2006 Pressure (hpa) TES CMAQ Latitude 43
44 TES Observations of Nighttime Ozone
45 Measurement Sensitivity Day Night 45

46 TES Observations of Nighttime Ozone June 2009 Transect Special Observations 46
47 TES Observations of Nighttime Ozone 47
48 Wrap Up Just getting started Model outputs received July and August 2006 from EPA and NOAA/NWS Beginning day time comparisons with TES and ozonesondes Systematic comparisons to models (daytime and nighttime) Select nighttime case studies First phase of INTEX-B (Feb-Mar 2006) SHARP campaign (Spring 2009) Global Surveys Use of TES+ OMI retrievals? Acknowledgements Aura 2010 Project Investigators Dejian Fu and Entire TES team Thank you! 48
49 Extra


50 TES Observations of Nighttime Ozone O3 in the Houston area on the morning of 50 June 7 was in the range of
51 Model Evaluation using TES Tropospheric O3 Looked at mean of TES profiles for July in three areas: Northern CA/NV and Southern Oregon Southern CA Desert Pacific off CA Coast 51
52 Model Evaluation using TES Tropospheric O3 Must take into account vertical sensitivity of TES measurements when comparing profiles to the model 52
53 Evaluation: Ocean TES Step & Stare observation July 18, 2006 TES data used with models can provide information on transport of data across the Pacific 53
54 Ocean 54

 Good comparison in the upper")
55 Ocean TES shows lower tropospheric ozone than the model in the lower troposphere (5-15 ppb) Good comparison in the upper troposphere 55
56 Evaluation: Northern California TES shows reasonable comparison with model throughout the troposphere Surface monitor data higher than CMAQ for month at Lassen and Yreka 56
57 Evaluation: Southern California Desert TES shows higher tropospheric ozone than the model in the lower troposphere (15-20 ppb) Good comparison in the upper troposphere Surface monitor data higher than CMAQ for month at Death Valley, Palm Springs and Joshua Tree 57
58 Evaluation of CAMx Ozone in Free Troposphere Preliminary Result CAMx model higher than TES in lower troposphere 58

59 New: TES + OMI 59
60 Measurement Sensitivity 60
Assimilation of Chemical Data from NASA s EOS Instruments: Experiences from the GMAO Thoughts for planning
 Assimilation of Chemical Data from NASA s EOS Instruments: Experiences from the GMAO Thoughts for planning Steven Pawson, Ivanka Stajner, Andrew Tangborn, Krzysztof Wargan of NASA s Global Modeling and
Ammonia from space: how good are current measurements and what could future instruments tell us
 Ammonia from space: how good are current measurements and what could future instruments tell us Karen Cady-Pereira 1, Mark Shephard 2, Daven Henze 3, Juliet Zhu 3, Jonathan Wrotny 1, Jesse Bash 5, Armin
Global and Regional Modeling
 Global and Regional Modeling Pius Lee NOAA Air Resources Lab (ARL) with contributions from: NOAA ARL: Daniel Tong, Li Pan, Youhua Tang, Barry Baker NOAA National Centers for Environmental Prediction: Jeff
Comparison of Aura TES Satellite Greenhouse Gas Measurements with HIPPO profiles
 ComparisonofAuraTESSatelliteGreenhouse GasMeasurementswithHIPPOprofiles John Worden 1, Susan Kulawik 1, Kevin Wecht 2, Vivienne Payne 3, Kevin Bowman 1, and the TES team (1) Jet Propulsion Laboratory /
Validation of Tropospheric Emission Spectrometer ozone profiles with aircraft observations during the Intercontinental Chemical Transport Experiment B
 Click Here for Full Article JOURNAL OF GEOPHYSICAL RESEARCH, VOL. 113,, doi:10.1029/2007jd008815, 2008 Validation of Tropospheric Emission Spectrometer ozone profiles with aircraft observations during
Supplemental Materials
 Supplemental Materials Figure S-1. Locations of the ozonesonde stations used in the TOST product for the period 2008-2012. Figure S-2. Map of the seven regions: Eastern USA, Eastern China, Atlantic, Indonesia,
NOAA-EPA s s U.S. National Air Quality Forecast Capability
 NOAA-EPA s s U.S. National Air Quality Forecast Capability May 10, 2006 Paula M. Davidson 1, Nelson Seaman 1, Jeff McQueen 1, Rohit Mathur 1,2, Chet Wayland 2 1 National Oceanic and Atmospheric Administration
Transport of Asian ozone pollution into surface air over the western U.S. in spring. Meiyun Lin
 HTAP, NASA JPL, 2/2/2012 Transport of Asian ozone pollution into surface air over the western U.S. in spring Meiyun Lin Lin, M., A. M. Fiore, L. W. Horowitz, O. R. Cooper, V. Naik, J. S. Holloway, B. J.
Global Change and Air Pollution (EPA-STAR GCAP) Daniel J. Jacob
 Daniel J. Jacob") Global Change and Air Pollution (EPA-STAR GCAP) and some more recent work on climate-aq interactions Daniel J. Jacob (djacob@fas.harvard.edu) with Eric M. Leibensperger, Shiliang Wu, Amos Tai, and Loretta
Global Change and Air Pollution (EPA-STAR GCAP) and some more recent work on climate-aq interactions Daniel J. Jacob (djacob@fas.harvard.edu) with Eric M. Leibensperger, Shiliang Wu, Amos Tai, and Loretta
Challenges in the Use of Satellite Measurements for Studies of Tropospheric Ozone
 Challenges in the Use of Satellite Measurements for Studies of Tropospheric Ozone Jack Fishman, John K. Creilson, Amy E. Wozniak, R. Bradley Pierce and Doreen O. Neil Atmospheric Sciences Research NASA
Monitoring of atmospheric composition using the thermal infrared IASI/MetOp sounder
 Monitoring of atmospheric composition using the thermal infrared IASI/MetOp sounder Cathy Clerbaux, Solène Turquety, Juliette Hadji-Lazaro, Maya George, Anne Boynard Matthieu Pommier Service d'aéronomie
MOPITT (Measurements of Pollution in the Troposphere) Version 6 Product User's Guide
 Version 6 Product User's Guide") MOPITT (Measurements of Pollution in the Troposphere) Version 6 Product User's Guide Merritt N. Deeter* MOPITT Algorithm Development Team Atmospheric Chemistry Division National Center for Atmospheric
MOPITT (Measurements of Pollution in the Troposphere) Version 6 Product User's Guide Merritt N. Deeter* MOPITT Algorithm Development Team Atmospheric Chemistry Division National Center for Atmospheric
Long range dust transport and its impact on US air quality
 Long range dust transport and its impact on US air quality Sarah Lu 1, Youhua Tang 1, Ho Chun Huang 1, Jeff McQueen 1, Arlindo da Silva 2, Mian Chin 2, Marina Tsidulko 1, Jianping Huang 1 1 : NOAA NCEP
Science Results Based on Aura OMI-MLS Measurements of Tropospheric Ozone and Other Trace Gases
 Science Results Based on Aura OMI-MLS Measurements of Tropospheric Ozone and Other Trace Gases J. R. Ziemke Main Contributors: P. K. Bhartia, S. Chandra, B. N. Duncan, L. Froidevaux, J. Joiner, J. Kar,
Data Assimilation Working Group
 Data Assimilation Working Group Dylan Jones (U. Toronto) Kevin Bowman (JPL) Daven Henze (CU Boulder) IGC7 4 May 2015 1 Chemical Data Assimilation Methodology State optimization: x is the model state (e.g.,
Table S.1 Periods of clean background measurements used in this study
 Supplementary information 1. Clean MBL data The aim of this study is to investigate the PSS of NOx and O 3 in clean background conditions of the southern Atlantic Ocean. Therefore only daytime data where
List of Exposure and Dose Metrics
 List of Exposure and Dose Metrics First approved by the TOAR Steering Committee on July 31, 2015, and revised on June 27, 2016 to add two additional metrics. Following is the list of exposure and dose
Relationships between the North Atlantic Oscillation and isentropic water vapor transport into the lower stratosphere
 1/18 Relationships between the North Atlantic Oscillation and isentropic water vapor transport into the lower stratosphere Jonathon Wright and Seok-Woo Son Department of Applied Physics & Applied Mathematics
Using Global and Regional Models to Represent Background Ozone Entering Texas
 Using Global and Regional Models to Represent Background Ozone Entering Texas AQRP Project 12-011 Chris Emery, Ed Tai, Greg Yarwood ENVIRON International Corporation Meiyun Lin Princeton University/NOAA
Current and Future Impacts of Wildfires on PM 2.5, Health, and Policy in the Rocky Mountains
 Current and Future Impacts of Wildfires on PM 2.5, Health, and Policy in the Rocky Mountains Yang Liu, Ph.D. STAR Grants Kick-off Meeting Research Triangle Park, NC April 5, 2017 Motivation The Rocky Mountains
Potential sources of a priori ozone profiles for TEMPO
 Potential sources of a priori ozone profiles for TEMPO Matthew S. Johnson NASA Ames Research Center http://tempo.si.edu/overview.html Harvard-Smithsonian Center for Astrophysics TEMPO Science Team Meeting
The potential impact of ozone sensitive data from MTG-IRS
 The potential impact of ozone sensitive data from MTG-IRS R. Dragani, C. Lupu, C. Peubey, and T. McNally ECMWF rossana.dragani@ecmwf.int ECMWF May 24, 2017 The MTG IRS Long-Wave InfraRed band O 3 Can the
Developments in CALIOP Aerosol Products. Dave Winker
 Developments in CALIOP Aerosol Products Dave Winker NASA Langley Research Center Hampton, VA Winker - 1 Outline Level 3 aerosol product (beta-version) Version 4 Level 1 product A few CALIOP assimilation
VALIDATION OF ENVISAT PRODUCTS USING POAM III O 3, NO 2, H 2 O AND O 2 PROFILES
 VALIDATION OF ENVISAT PRODUCTS USING POAM III O 3, NO 2, H 2 O AND O 2 PROFILES A. Bazureau, F. Goutail Service d Aéronomie / CNRS, BP 3, Réduit de Verrières, 91371 Verrières-le-Buisson, France Email :
Recent spectroscopy updates to the line-by-line radiative transfer model LBLRTM evaluated using IASI case studies
 Recent spectroscopy updates to the line-by-line radiative transfer model LBLRTM evaluated using IASI case studies M.J. Alvarado 1, V.H. Payne 2, E.J. Mlawer 1, J.-L. Moncet 1, M.W. Shephard 3, K.E. Cady-Pereira
Update on Validation of OCO-2 Observations of Column- Averaged Mole Fractions of Carbon Dioxide (XCO2)
") Update on Validation of OCO-2 Observations of Column- Averaged Mole Fractions of Carbon Dioxide (XCO2) D. Wunch 1, P. Wennberg 2, G. Osterman 3, C. Viatte 2, C. O Dell 4, C. Roehl 2, B. Fisher 3, B. Naylor
Update on Validation of OCO-2 Observations of Column- Averaged Mole Fractions of Carbon Dioxide (XCO2) D. Wunch 1, P. Wennberg 2, G. Osterman 3, C. Viatte 2, C. O Dell 4, C. Roehl 2, B. Fisher 3, B. Naylor
USE OF SURFACE MESONET DATA IN THE NCEP REGIONAL GSI SYSTEM
 6A.7 USE OF SURFACE MESONET DATA IN THE NCEP REGIONAL GSI SYSTEM Seung-Jae Lee *, David F. Parrish, Wan-Shu Wu, Manuel Pondeca, Dennis Keyser, and Geoffery J. DiMego NCEP/Environmental Meteorological Center,
The CEOS Atmospheric Composition Constellation (ACC) An Example of an Integrated Earth Observing System for GEOSS
 An Example of an Integrated Earth Observing System for GEOSS") The CEOS Atmospheric Composition Constellation (ACC) An Example of an Integrated Earth Observing System for GEOSS Presentation Authors: E. Hilsenrath NASA, C. Zehner ESA, J. Langen ESA, J. Fishman NASA
The CEOS Atmospheric Composition Constellation (ACC) An Example of an Integrated Earth Observing System for GEOSS Presentation Authors: E. Hilsenrath NASA, C. Zehner ESA, J. Langen ESA, J. Fishman NASA
The correlation coefficient R between OMI/MLS tropospheric O 3and WOUDC ozonesonde tropospheric O 3 is 0.92, RMS is 6.0ppbv from April to October.
 Responses to the Interactive comment from Referee #1 on Summer ozone variation in North China based on satellite and site observations by Lihua Zhou et al. Anonymous Referee #1 To reviewer: Thank you very
The Transition of Atmospheric Infrared Sounder Total Ozone Products to Operations
 The Transition of Atmospheric Infrared Sounder Total Ozone Products to Operations Emily Berndt 1, Bradley Zavodsky 2, Gary Jedlovec 2 1 NASA Postdoctoral Program Marshall Space Flight Center, Huntsville,
Plans for GEMS GRG months Martin Schultz and the GRG team
 Plans for GEMS GRG months 18-30 Martin Schultz and the GRG team Sub project structure WP1: Assimilation of gas-phase chemical species in the stratosphere and troposphere leader: H. Eskes WP2: Implementation
Meteorology B Wright State Invite Team Name Team # Student Members: &
 1 Meteorology B Team Name Team # Student Members: & Raw Score: / 126 Rank: Part I. Multiple Choice. Answer the following questions by selecting the best answer. 2 points each. 1. All of the following are
Current Status of the Stratospheric Ozone Layer From: UNEP Environmental Effects of Ozone Depletion and Its Interaction with Climate Change
 Goals Produce a data product that allows users to acquire time series of the distribution of UV-B radiation across the continental USA, based upon measurements from the UVMRP. Provide data in a format
Recent Ozone Modeling Results
 Recent Ozone Modeling Results Presentation by: Dan Goldberg, Ph.D. Candidate Co-authors: Tim Canty, Tim Vinciguerra, Ross Salawitch & Russ Dickerson Presented at the MARAMA Science Meeting Wednesday July
Improvement of Meteorological Inputs for Air Quality Study
 July 21, 2008 NCAR GEO Turbulance Improvement of Meteorological Inputs for Air Quality Study Fong (Fantine) Ngan Daewon W. Byun DaeGyun Lee, Soontae Kim, XiangShang Li and Peter Percell Institute for Multidimensional
Evalua&on of the Simulated Planetary Boundary Layer in Eastern Texas
 Evalua&on of the Simulated Planetary Boundary Layer in Eastern Texas Jenna Kolling Jonathan Pleim (USEPA), William Vizuete (UNC), Harvey Jeffries (UNC) October 12, 2010 Research Objec&ves Evaluate two
7.5 THERMALLY-DRIVEN WIND SYSTEMS AND HIGH-ALTITUDE OZONE CONCENTRATIONS IN YOSEMITE NATIONAL PARK
 21-25 June 24, Bartlett NH 7.5 THERMALLY-DRIVEN WIND SYSTEMS AND HIGH-ALTITUDE OZONE CONCENTRATIONS IN YOSEMITE NATIONAL PARK Craig B. Clements 1, Sharon Zhong 1, and Joel D. Burley 2 1 Institute for Multidimensional
Satellite remote sensing of trace gases - Nadir sounding geometry. Cathy Clerbaux, DR CNRS, LATMOS/IPSL
 Satellite remote sensing of trace gases - Nadir sounding geometry Cathy Clerbaux, DR CNRS, LATMOS/IPSL Cathy.clerbaux@latmos.ipsl.fr Sounding the bottom of the atmosphere Endeavour STS-130 Atmospheric
Preliminary Experiences with the Multi Model Air Quality Forecasting System for New York State
 Preliminary Experiences with the Multi Model Air Quality Forecasting System for New York State Prakash Doraiswamy 1, Christian Hogrefe 1,2, Winston Hao 2, Brian Colle 3, Mark Beauharnois 1, Ken Demerjian
AIRS and IASI Precipitable Water Vapor (PWV) Absolute Accuracy at Tropical, Mid-Latitude, and Arctic Ground-Truth Sites
 Absolute Accuracy at Tropical, Mid-Latitude, and Arctic Ground-Truth Sites") AIRS and IASI Precipitable Water Vapor (PWV) Absolute Accuracy at Tropical, Mid-Latitude, and Arctic Ground-Truth Sites Robert Knuteson, Sarah Bedka, Jacola Roman, Dave Tobin, Dave Turner, Hank Revercomb
AIRS and IASI Precipitable Water Vapor (PWV) Absolute Accuracy at Tropical, Mid-Latitude, and Arctic Ground-Truth Sites Robert Knuteson, Sarah Bedka, Jacola Roman, Dave Tobin, Dave Turner, Hank Revercomb
 Contributors: Arlene Fiore 1, Lee Murray 1, Luke Valin 1, Olivia Clifton 1, Jean Guo 1 Author: Melissa Seto 1 Analysis of Wisconsin 2007 High-Ozone event Section 1A: Can satellite NO 2 columns inform us
GEMS. Nimbus 4, Nimbus7, NOAA-9, NOAA11, NOAA16, NOAA17
 GEMS (Geostationary Environment Monitoring Spectrometer) SBUV,BUV TOMS (50x50km 2 ) Nimbus7, METEOR-3, ADEOS, Earth-probe GOME1/2 (40x40km 2 ) ERS-2 SCIAMACHY (30x60km 2 ) OMI (13x24km2) OMPS (50x50km
Meteorology. Circle the letter that corresponds to the correct answer
 Chapter 3 Worksheet 1 Meteorology Name: Circle the letter that corresponds to the correct answer 1) If the maximum temperature for a particular day is 26 C and the minimum temperature is 14 C, the daily
Weather and Climate Summary and Forecast Winter
 Weather and Climate Summary and Forecast Winter 2016-17 Gregory V. Jones Southern Oregon University December 5, 2016 Well after an October that felt more like November, we just finished a November that
March was 3rd warmest month in satellite record
 April 4, 2016 Vol. 25, No. 12 For Additional Information: Dr. John Christy, (256) 961-7763 john.christy@nsstc.uah.edu Dr. Roy Spencer, (256) 961-7960 roy.spencer@nsstc.uah.edu Global Temperature Report:
A Canadian OSSE Data Assimilation facility for Atmospheric Composition satellite missions (CODAAC)
") A Canadian OSSE Data Assimilation facility for Atmospheric Composition satellite missions (CODAAC) 14th Meeting of the CEOS Atmospheric Composition Virtual Constellation (AC-VC-14) NOAA Center for Weather
A Canadian OSSE Data Assimilation facility for Atmospheric Composition satellite missions (CODAAC) 14th Meeting of the CEOS Atmospheric Composition Virtual Constellation (AC-VC-14) NOAA Center for Weather
Spring to summer northward migration of high O 3 over the western North Atlantic
 Click Here for Full Article GEOPHYSICAL RESEARCH LETTERS, VOL. 35,, doi:10.1029/2007gl032276, 2008 Spring to summer northward migration of high O 3 over the western North Atlantic Yunsoo Choi, 1,2 Yuhang
Monitoring CO 2 Sources and Sinks from Space with the Orbiting Carbon Observatory (OCO)
") NACP Remote Sensing Breakout Monitoring CO 2 Sources and Sinks from Space with the Orbiting Carbon Observatory (OCO) http://oco.jpl.nasa.gov David Crisp, OCO PI (JPL/Caltech) January 2007 1 of 14, Crisp,
NACP Remote Sensing Breakout Monitoring CO 2 Sources and Sinks from Space with the Orbiting Carbon Observatory (OCO) http://oco.jpl.nasa.gov David Crisp, OCO PI (JPL/Caltech) January 2007 1 of 14, Crisp,
MOZAIC-IAGOS : Its role in the satellite validation and in assessing the ozone trends.
 MOZAIC-IAGOS : Its role in the satellite validation and in assessing the ozone trends. MOZAIC Aug. 1994 Jun. 2009 http://mozaic.aero.obs-mip.fr 32 000 flights 230 000 Hours http://www.iagos.org V. Thouret,
Intercomparison Methods for Satellite Measurements of Atmospheric Composition: Application to Tropospheric Ozone from TES and OMI
 Intercomparison Methods for Satellite Measurements of Atmospheric Composition: Application to Tropospheric Ozone from TES and OMI The Harvard community has made this article openly available. Please share
Weather and Climate Summary and Forecast Winter
 Weather and Climate Summary and Forecast Winter 2016-17 Gregory V. Jones Southern Oregon University February 7, 2017 What a difference from last year at this time. Temperatures in January and February
GEOPHYSICAL RESEARCH LETTERS, VOL. 33, L22806, doi: /2006gl027000, 2006
 GEOPHYSICAL RESEARCH LETTERS, VOL. 33, L22806, doi:10.1029/2006gl027000, 2006 Nadir measurements of carbon monoxide distributions by the Tropospheric Emission Spectrometer instrument onboard the Aura Spacecraft:
Using visible spectra to improve sensitivity to near-surface ozone of UV-retrieved profiles from MetOp GOME-2
 Using visible spectra to improve sensitivity to near-surface ozone of UV-retrieved profiles from MetOp GOME-2 Richard Siddans, Georgina Miles, Brian Kerridge STFC Rutherford Appleton Laboratory (RAL),
Ongoing EPA efforts to evaluate modeled NO y budgets. Heather Simon, Barron Henderson, Deborah Luecken, Kristen Foley
 Ongoing EPA efforts to evaluate modeled NO y budgets Heather Simon, Barron Henderson, Deborah Luecken, Kristen Foley Literature consistent regarding reported high bias Mobile NO x over (2x) Mobile NO x
FLUXNET and Remote Sensing Workshop: Towards Upscaling Flux Information from Towers to the Globe
 FLUXNET and Remote Sensing Workshop: Towards Upscaling Flux Information from Towers to the Globe Space-Based Measurements of CO 2 from the Japanese Greenhouse Gases Observing Satellite (GOSAT) and the
Composition of the Atmosphere from Mid-Earth Orbit (CAMEO): Observations for air quality studies
: Observations for air quality studies") Community Workshop on Air Quality Remote Sensing from Space, NCAR, Boulder, 21-23 Feb 2006 Composition of the Atmosphere from Mid-Earth Orbit (CAMEO): Observations for air quality studies A future atmospheric
Community Workshop on Air Quality Remote Sensing from Space, NCAR, Boulder, 21-23 Feb 2006 Composition of the Atmosphere from Mid-Earth Orbit (CAMEO): Observations for air quality studies A future atmospheric
Scientific Insight from CAMx & OSAT Modeling. Presented by: Dan Goldberg Thursday April 23 rd, 2015 Spring OTC Meeting
 Scientific Insight from CAMx & OSAT Modeling Presented by: Dan Goldberg Thursday April 23 rd, 2015 Spring OTC Meeting Description of model used: CAMx v6.10 (12 km OTC model domain) EPA-approved regulatory
The Orbiting Carbon Observatory (OCO)
") GEMS 2006 Assembly The Orbiting Carbon Observatory (OCO) http://oco.jpl.nasa.gov David Crisp, OCO PI (JPL/Caltech) February 2006 1 of 13, OCO Dec 2005 Page 1 The Orbiting Carbon Observatory (OCO) OCO will
GEMS 2006 Assembly The Orbiting Carbon Observatory (OCO) http://oco.jpl.nasa.gov David Crisp, OCO PI (JPL/Caltech) February 2006 1 of 13, OCO Dec 2005 Page 1 The Orbiting Carbon Observatory (OCO) OCO will
MOPITT (Measurements of Pollution in the Troposphere) Version 6 Product User's Guide
 Version 6 Product User's Guide") MOPITT (Measurements of Pollution in the Troposphere) Version 6 Product User's Guide Merritt N. Deeter* MOPITT Algorithm Development Team Atmospheric Chemistry Division National Center for Atmospheric
MOPITT (Measurements of Pollution in the Troposphere) Version 6 Product User's Guide Merritt N. Deeter* MOPITT Algorithm Development Team Atmospheric Chemistry Division National Center for Atmospheric
Long-term time-series of height-resolved ozone for nadir-uv spectrometers: CCI and beyond
 Long-term time-series of height-resolved ozone for nadir-uv spectrometers: CCI and beyond Richard Siddans, Georgina Miles, Barry Latter, Brian Kerridge RAL Earth Observation & Atmospheric Science Division,
COMBINED OZONE RETRIEVAL USING THE MICHELSON INTERFEROMETER FOR PASSIVE ATMOSPHERIC SOUNDING (MIPAS) AND THE TROPOSPHERIC EMISSION SPECTROMETER (TES)
 AND THE TROPOSPHERIC EMISSION SPECTROMETER (TES)") COMBINED OZONE RETRIEVAL USING THE MICHELSON INTERFEROMETER FOR PASSIVE ATMOSPHERIC SOUNDING (MIPAS) AND THE TROPOSPHERIC EMISSION SPECTROMETER (TES) Claire Waymark, Anu Dudhia, John Barnett, Fred Taylor,
COMBINED OZONE RETRIEVAL USING THE MICHELSON INTERFEROMETER FOR PASSIVE ATMOSPHERIC SOUNDING (MIPAS) AND THE TROPOSPHERIC EMISSION SPECTROMETER (TES) Claire Waymark, Anu Dudhia, John Barnett, Fred Taylor,
Status and Plans of using the scatterometer winds in JMA's Data Assimilation and Forecast System
 Status and Plans of using the scatterometer winds in 's Data Assimilation and Forecast System Masaya Takahashi¹ and Yoshihiko Tahara² 1- Numerical Prediction Division, Japan Meteorological Agency () 2-
Recent Ozone Modeling Results
 Recent Ozone Modeling Results Presentation by: Dan Goldberg, Ph.D. Candidate Co-authors: Tim Canty, Tim Vinciguerra, Ross Salawitch & Russ Dickerson Presented at the MARAMA Science Meeting Wednesday July
Recent Data Assimilation Activities at Environment Canada
 Recent Data Assimilation Activities at Environment Canada Major upgrade to global and regional deterministic prediction systems (now in parallel run) Sea ice data assimilation Mark Buehner Data Assimilation
Characterization of Tropospheric Emission Spectrometer (TES) CO 2 for carbon cycle science
 CO 2 for carbon cycle science") doi:10.5194/acp-10-5601-2010 Author(s) 2010. CC Attribution 3.0 License. Atmospheric Chemistry and Physics Characterization of Tropospheric Emission Spectrometer (TES) CO 2 for carbon cycle science S.
doi:10.5194/acp-10-5601-2010 Author(s) 2010. CC Attribution 3.0 License. Atmospheric Chemistry and Physics Characterization of Tropospheric Emission Spectrometer (TES) CO 2 for carbon cycle science S.
Development of IDL-based geospatial data processing framework for meteorology and air quality modeling
 Development of IDL-based geospatial data processing framework for meteorology and air quality modeling Hyun Cheol Kim 1,2,3, Fong Ngan 1,2,4, Pius Lee 2,3, and Daniel Tong 1,2,5 1 Cooperative Institute
Observed Vertical Distribution of Tropospheric Ozone. During the Asian Summertime Monsoon
 1 2 3 Observed Vertical Distribution of Tropospheric Ozone During the Asian Summertime Monsoon 4 5 6 7 John Worden 1, Dylan B. A. Jones 2, Jane Liu 2, Kevin Bowman 1, Reinhard Beer 1, Jonathan Jiang 1,
Aura Microwave Limb Sounder (MLS) ozone profile data record characteristics, quality and applications
 ozone profile data record characteristics, quality and applications") Aura Microwave Limb Sounder (MLS) ozone profile data record characteristics, quality and applications A presentation for the 2016 meeting of the Committee on Earth Observation Satellites (COES) Atmospheric
Aura Microwave Limb Sounder (MLS) ozone profile data record characteristics, quality and applications A presentation for the 2016 meeting of the Committee on Earth Observation Satellites (COES) Atmospheric
Spectrometer (TES) during the MILAGRO/INTEX-B aircraft campaigns over the Mexico City
 during the MILAGRO/INTEX-B aircraft campaigns over the Mexico City") 1 2 3 4 Characterizing Mega-city Pollution with TES O 3 and CO Measurements Changsub Shim 1, Qinbin Li 1, Ming Luo 1, Susan Kulawik 1, Helen Worden 1, John Worden 1, Annmarie Eldering 1, Melody Avery 2,
1 2 3 4 Characterizing Mega-city Pollution with TES O 3 and CO Measurements Changsub Shim 1, Qinbin Li 1, Ming Luo 1, Susan Kulawik 1, Helen Worden 1, John Worden 1, Annmarie Eldering 1, Melody Avery 2,
Long-lead prediction of the 2015 fire and haze episode in Indonesia
 Long-lead prediction of the 2015 fire and haze episode in Indonesia Robert Field 1,2 Dilshad Shawki 3, Michael Tippett 2, Bambang Hero Saharjo 4, Israr Albar 5, Dwi Atmoko 6, Apostolos Voulgarakis 1 1.
Report of Forecasting/Modeling Working Group for MILAGRO and INTEX
 Report of Forecasting/Modeling Working Group for MILAGRO and INTEX Jerome Fast Pacific Northwest National Laboratory Ernesto Caetano Universidad Nacional AutÓnoma de México Modeling Investigators Ernesto
JOURNAL OF GEOPHYSICAL RESEARCH, VOL. 115, D01301, doi: /2009jd011973, 2010
 Click Here for Full Article JOURNAL OF GEOPHYSICAL RESEARCH, VOL. 115,, doi:10.1029/2009jd011973, 2010 An observational and modeling strategy to investigate the impact of remote sources on local air quality:
Atmospheric circulation analysis for seasonal forecasting
 Training Seminar on Application of Seasonal Forecast GPV Data to Seasonal Forecast Products 18 21 January 2011 Tokyo, Japan Atmospheric circulation analysis for seasonal forecasting Shotaro Tanaka Climate
Aquarius Data Release V2.0 Validation Analysis Gary Lagerloef, Aquarius Principal Investigator H. Kao, ESR And Aquarius Cal/Val Team
 Aquarius Data Release V2.0 Validation Analysis Gary Lagerloef, Aquarius Principal Investigator H. Kao, ESR And Aquarius Cal/Val Team Analysis period: Sep 2011-Dec 2012 SMOS-Aquarius Workshop 15-17 April
Spaceborne Hyperspectral Infrared Observations of the Cloudy Boundary Layer
 Spaceborne Hyperspectral Infrared Observations of the Cloudy Boundary Layer Eric J. Fetzer With contributions by Alex Guillaume, Tom Pagano, John Worden and Qing Yue Jet Propulsion Laboratory, JPL KISS
IMPACT STUDIES OF HIGHER RESOLUTION COMS AMV IN THE KMA NWP SYSTEM
 Proceedings for the 13 th International Winds Workshop 27 June - 1 July 2016, Monterey, California, USA IMPACT STUDIES OF HIGHER RESOLUTION COMS AMV IN THE KMA NWP SYSTEM Jung-Rim Lee, Hyun-Cheol Shin,
On the prognostic treatment of stratospheric ozone in the Environment Canada global NWP system
 On the prognostic treatment of stratospheric ozone in the Environment Canada global NWP system Jean de Grandpré, Y. J. Rochon, C.A. McLinden, S. Chabrillat and Richard Ménard Outline Ozone assimilation
P2.9 Use of the NOAA ARL HYSPLIT Trajectory Model For the Short Range Prediction of Stratus and Fog
 Ellrod, G. P., 2013: Use of the NOAA ARL HYSPLIT Trajectory Model for the Short Range Prediction of Stratus and Fog. Extended Abstract, 38 th National Weather Association Annual Meeting, Charleston, SC,
Validation report of the MACC 43- year multi- sensor reanalysis of ozone columns, version 2 Period
 MACC- III Deliverable D38.3 Validation report of the MACC 43- year multi- sensor reanalysis of ozone columns, version 2 Period 1970-2012 Date: March 2015 Lead Beneficiary: KNMI (#21) Nature: R Dissemination
Measuring Carbon Dioxide from the A-Train: The OCO-2 Mission
 Measuring Carbon Dioxide from the A-Train: The OCO-2 Mission David Crisp, OCO-2 Science Team Leader for the OCO-2 Science Team Jet Propulsion Laboratory, California Institute of Technology March 2013 Copyright
Energy Systems, Structures and Processes Essential Standard: Analyze patterns of global climate change over time Learning Objective: Differentiate
 Energy Systems, Structures and Processes Essential Standard: Analyze patterns of global climate change over time Learning Objective: Differentiate between weather and climate Global Climate Focus Question
ONE-YEAR EXPERIMENT IN NUMERICAL PREDICTION OF MONTHLY MEAN TEMPERATURE IN THE ATMOSPHERE-OCEAN-CONTINENT SYSTEM
 71 4 MONTHLY WEATHER REVIEW Vol. 96, No. 10 ONE-YEAR EXPERIMENT IN NUMERICAL PREDICTION OF MONTHLY MEAN TEMPERATURE IN THE ATMOSPHERE-OCEAN-CONTINENT SYSTEM JULIAN ADEM and WARREN J. JACOB Extended Forecast
Comparison of Tropospheric Emission Spectrometer nadir water vapor retrievals with in situ measurements
 Click Here for Full Article JOURNAL OF GEOPHYSICAL RESEARCH, VOL. 113,, doi:10.1029/2007jd008822, 2008 Comparison of Tropospheric Emission Spectrometer nadir water vapor retrievals with in situ measurements
Can the assimilation of atmospheric constituents improve the weather forecast?
 Can the assimilation of atmospheric constituents improve the weather forecast? S. Massart Acknowledgement: M. Hamrud Seventh International WMO Symposium on Data Assimilation -5 September 207 Very simple
NOAA In Situ Satellite Blended Analysis of Surface Salinity: Preliminary Results for
 NOAA In Situ Satellite Blended Analysis of Surface Salinity: Preliminary Results for 2010-2012 P.Xie 1), T. Boyer 2), E. Bayler 3), Y. Xue 1), D. Byrne 2), J.Reagan 2), R. Locarnini 2), F. Sun 1), R.Joyce
Monthly Long Range Weather Commentary Issued: APRIL 18, 2017 Steven A. Root, CCM, Chief Analytics Officer, Sr. VP,
 Monthly Long Range Weather Commentary Issued: APRIL 18, 2017 Steven A. Root, CCM, Chief Analytics Officer, Sr. VP, sroot@weatherbank.com MARCH 2017 Climate Highlights The Month in Review The average contiguous
Chart Discussion: Fri-24-Aug-2018 (Harvey Stern) Last Week s Rainfall
 Last Week s Rainfall") Last Week s Rainfall 1 Last Week s Surface Charts 2 Last month s Max Temp Forecasts: ACCESS Model Da te Model MxD1 MxD2 MxD3 MxD4 MxD5 MxD6 MxD7 MxD8 MxD9 MxD10 0 1- Aug- 18 ACC 15.4 15.2 15.4 15.5 15.6
Last Week s Rainfall 1 Last Week s Surface Charts 2 Last month s Max Temp Forecasts: ACCESS Model Da te Model MxD1 MxD2 MxD3 MxD4 MxD5 MxD6 MxD7 MxD8 MxD9 MxD10 0 1- Aug- 18 ACC 15.4 15.2 15.4 15.5 15.6
The MODIS Cloud Data Record
 The MODIS Cloud Data Record Brent C. Maddux 1,2 Steve Platnick 3, Steven A. Ackerman 1 Paul Menzel 1, Kathy Strabala 1, Richard Frey 1, 1 Cooperative Institute for Meteorological Satellite Studies, 2 Department
AREP GAW. AQ Forecasting
 AQ Forecasting What Are We Forecasting Averaging Time (3 of 3) PM10 Daily Maximum Values, 2001 Santiago, Chile (MACAM stations) 300 Level 2 Pre-Emergency Level 1 Alert 200 Air Quality Standard 150 100
GRG WP1 progress report. Henk Eskes, Royal Netherlands Meteorological Institute (KNMI)
") GRG WP1 progress report Henk Eskes, Royal Netherlands Meteorological Institute (KNMI) WP_GRG1 summary Task 1.1: Extension of EMCWF assimilation system to include new tracers (NOx, SO2, CO, and HCHO) Task
GRG WP1 progress report Henk Eskes, Royal Netherlands Meteorological Institute (KNMI) WP_GRG1 summary Task 1.1: Extension of EMCWF assimilation system to include new tracers (NOx, SO2, CO, and HCHO) Task
Atmospheric Measurements from Space
 Atmospheric Measurements from Space MPI Mainz Germany Thomas Wagner Satellite Group MPI Mainz Part 1: Basics Break Part 2: Applications Part 1: Basics of satellite remote sensing Why atmospheric satellite
JOURNAL OF GEOPHYSICAL RESEARCH, VOL. 113, D22301, doi: /2008jd009883, 2008
 Click Here for Full Article JOURNAL OF GEOPHYSICAL RESEARCH, VOL. 113,, doi:10.109/008jd009883, 008 Validation of Aura Microwave Limb Sounder OH measurements with Fourier Transform Ultra-Violet Spectrometer
Assimilation of Himawari-8 Atmospheric Motion Vectors into the Numerical Weather Prediction Systems of Japan Meteorological Agency
 Assimilation of Himawari-8 Atmospheric Motion Vectors into the Numerical Weather Prediction Systems of Japan Meteorological Agency Koji Yamashita Japan Meteorological Agency kobo.yamashita@met.kishou.go.jp,
Responsibilities of Harvard Atmospheric Chemistry Modeling Group
 Responsibilities of Harvard Atmospheric Chemistry Modeling Group Loretta Mickley, Lu Shen, Daniel Jacob, and Rachel Silvern 2.1 Objective 1: Compile comprehensive air pollution, weather, emissions, and
Weather and Climate Summary and Forecast Summer 2017
 Weather and Climate Summary and Forecast Summer 2017 Gregory V. Jones Southern Oregon University August 4, 2017 July largely held true to forecast, although it ended with the start of one of the most extreme
PRELIMINARY EXPERIENCES WITH THE MULTI-MODEL AIR QUALITY FORECASTING SYSTEM FOR NEW YORK STATE
 PRELIMINARY EXPERIENCES WITH THE MULTI-MODEL AIR QUALITY FORECASTING SYSTEM FOR NEW YORK STATE Prakash Doraiswamy 1,,*, Christian Hogrefe 1,2, Winston Hao 2, Brian Colle 3, Mark Beauharnois 1, Ken Demerjian
Methane Sensing Flight of Scanning HIS over Hutchinson, KS, 31 March 2001
 Methane Sensing Flight of Scanning HIS over Hutchinson, KS, 31 March 2001 Hank Revercomb, Chris Moeller, Bob Knuteson, Dave Tobin, Ben Howell University of Wisconsin, Space Science and Engineering Center
Climate Prediction Center National Centers for Environmental Prediction
 NOAA s Climate Prediction Center Monthly and Seasonal Forecast Operations Wassila M. Thiaw Climate Prediction Center National Centers for Environmental Prediction Acknowlegement: Mathew Rosencrans, Arun
New Radiosonde Temperature Bias Adjustments for Potential NWP Applications Based on GPS RO Data
 Eighth FORMOSAT-3/COSMIC Data Users Workshop 30 September 2 October 2014 Boulder, Colorado, USA New Radiosonde Temperature Bias Adjustments for Potential NWP Applications Based on GPS RO Data Bomin Sun
Major results of IASI in Atmospheric chemistry. Thierry PHULPIN, CNES DCT/SI/IM Cathy Clerbaux (LATMOS), Pierre Coheur (ULB), Dave Edwards (NCAR)
, Pierre Coheur (ULB), Dave Edwards (NCAR)") Major results of IASI in Atmospheric chemistry Thierry PHULPIN, CNES DCT/SI/IM Cathy Clerbaux (LATMOS), Pierre Coheur (ULB), Dave Edwards (NCAR) ITSC 17, Monterey, 13-20 April 2010 Outline Context Why
Major results of IASI in Atmospheric chemistry Thierry PHULPIN, CNES DCT/SI/IM Cathy Clerbaux (LATMOS), Pierre Coheur (ULB), Dave Edwards (NCAR) ITSC 17, Monterey, 13-20 April 2010 Outline Context Why