The Use of Random Geographic Cluster Sampling to Survey Pastoralists. Kristen Himelein, World Bank Addis Ababa, Ethiopia January 23, 2013
|
|
|
- Gwendoline Powers
- 5 years ago
- Views:
Transcription

1 The Use of Random Geographic Cluster Sampling to Survey Pastoralists Kristen Himelein, World Bank Addis Ababa, Ethiopia January 23, 2013
2 Paper This presentation is based on the paper by Kristen Himelein (World Bank), Stephanie Eckman (Institute for Employment Research Germany), and Siobhan Murray (World Bank). Submitted to Journal of Official Statistics and available for comment upon request. 2
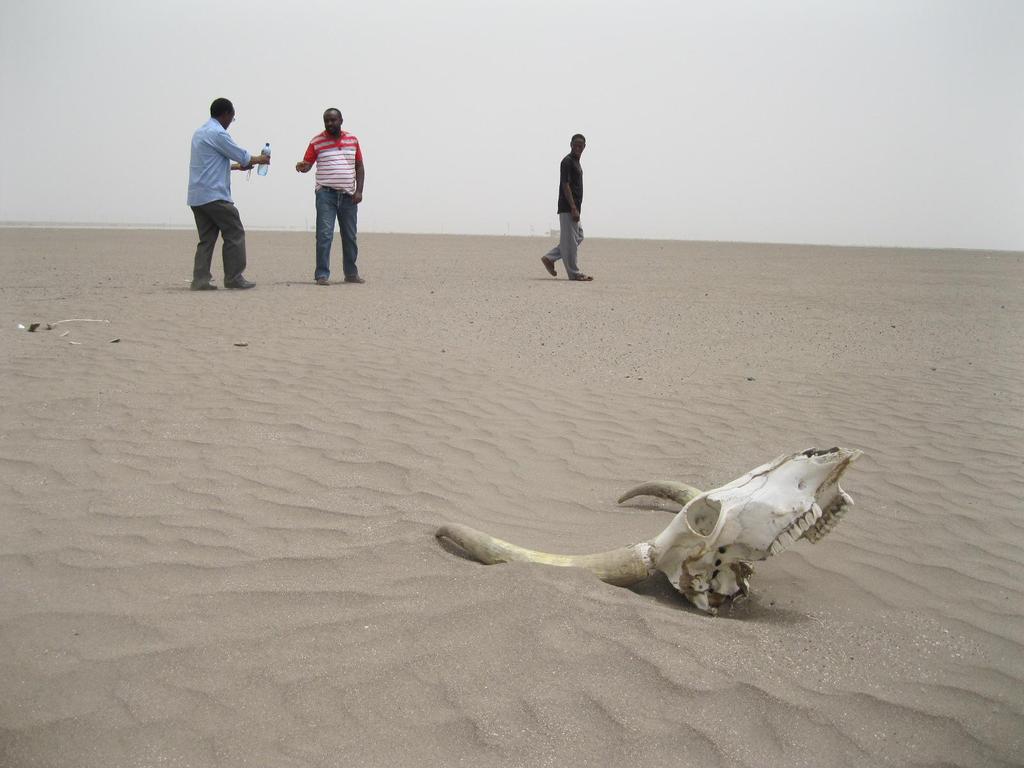
3 Note on language Throughout the presentation and the paper the word nomad is used to denote a person that does not have a fixed dwelling. It is not a pejorative term in English (though it can be translated as such into Amharic). It is used to differentiate for pastoralist which denotes someone owning / raising livestock, regardless of dwelling status. 3
4 Background In many parts of the world, livestock play integral role in livelihoods of vulnerable populations Act as main source of food and transportation Store of wealth Coping mechanism in response to shocks But populations most reliant are also most difficult to accurately measure due to their pastoralist / semi-pastoralist lifestyle Traditional census-based sampling frames may not be sufficient 4


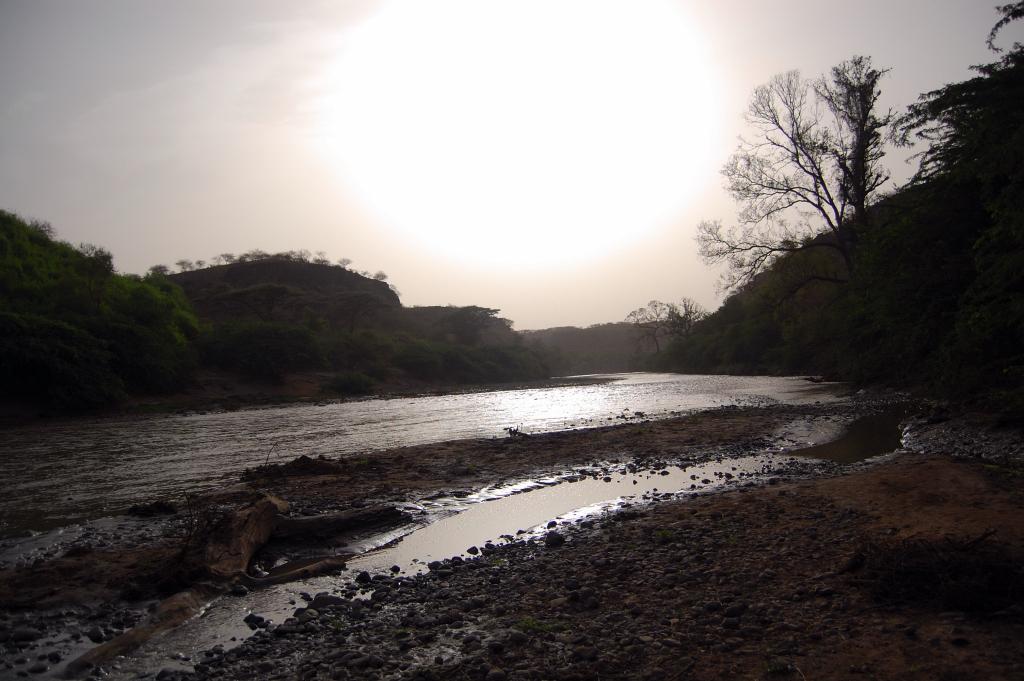
5 Location: Afar, Ethiopia Afar region (NE Ethiopia) highly pastoralist More than 40 percent of respondents reported owning 10 or more cattle in last AgSS High density of camels, goats Bounded by national borders to the north and east, and by mountains to the west (and on all sides by ethnic differences) 5
6 Research Objectives Can we collect better data than standard census frame, using an alternative sampling frame and data collection field plan? Are we able to capture populations missed by a dwelling based sampling frame? How do our figures compare with other sources of information? 6
7 Location: Afar, Ethiopia Livestock movements vary by season, with different responses to changing conditions. As reflected in the map, general pattern of movement is toward river or water source (or Amhara border) during the dry season, out to pasture after rains start. Survey was intended to take advantage of congregation of herds around water sources during dry season. Map reproduced from Ahmed Endris thesis,
8 Random Geographic Cluster Sampling [RGCS] 1 st stage: select random geographic points 2 nd stage: survey all eligible respondents within given radius RGCS or similar designs used: Agricultural statistics agencies (such as USDA) Livestock studies in developing world (Soumarea et al, 2007; von Hagen, 2002) Surveys of forests (Winrock International) 8
 Circle radius varies by strata.")
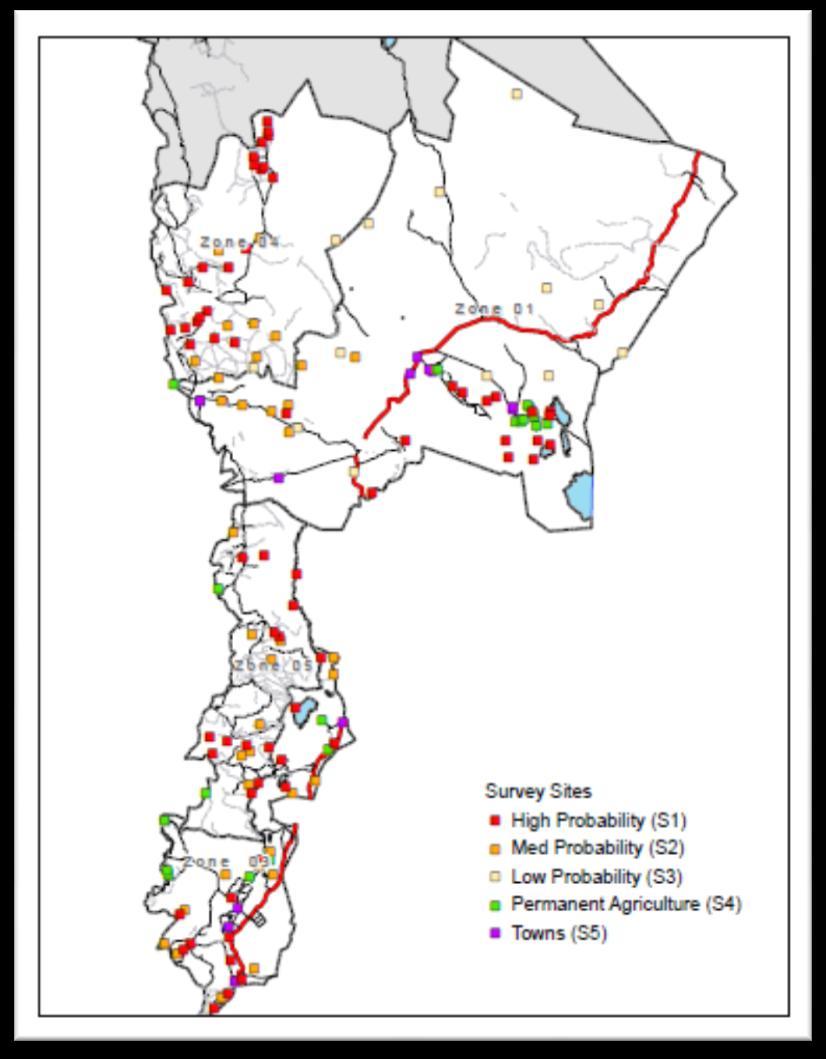
9 Stratification (1) Strata Inputs: distance to water, vegetation index, land cover (towns and settled agriculture) Circle radius varies by strata. 9
 : within 2 km of major river or swamps Stratum 4 (medium likelihood) : within 10 km of major river or swamps Stratum 5 (low likelihood) : all other")
10 Stratification (2) Stratum 1 (high likelihood) : towns Stratum 2 (almost no possibility) : settled agricultural areas / commercial farms Stratum 3 (high likelihood) : within 2 km of major river or swamps Stratum 4 (medium likelihood) : within 10 km of major river or swamps Stratum 5 (low likelihood) : all other land 10
 11")
11 Stratum 1 Likely (1 km radius) 11
12 12

13 Stratum 3 Unlikely (5 km radius) 13
14 14
")
15 Stratum 5 Towns (0.5 km radius) 15
16 Field Work Interviewers drove as close as possible Covered remainder on foot with GPS device Selected points pre-loaded Alarm indicated when interviewer inside radius Interview all eligible respondents within radius Only HHs with livestock eligible Livestock questions related to cattle, camels, goats Ownership, vaccination, theft, death, etc. 16
17 Implementation Challenges Early start to rainy season Field workers unaccustomed to technique Unexpected challenges Ethnic conflict / kidnapping Volcanoes River crossings Trouble with vehicles 17
18 Results of Data Collection (1) 125 circles canvassed 39% contained at least 1 HH with livestock 793 households with livestock interviewed Total livestock found per circle represented on map 18
19 Results of Data Collection (2) Stratum Description Selected Points Visited Circles Households in Circles Circles without Livestock 1 High likelihood: towns Almost no possibility: settled agricultural areas / commercial farms 3 High likelihood: within 2 km of major river or swamps Medium likelihood: within 10 km of major river or swamps Low likelihood: all land not in another stratum Total
20 Results of Data Collection (3) Of 793 households, 25 reported having no members permanent dwelling. An additional 4 households have at least one member without a permanent dwelling. This givens a weighted estimate of approximately 5000 pastoralists individuals without a permanent dwelling. 20
21 Weight Development In its simplest form, the probability of selection for an RGCS would be the area selected (and visited) in a given stratum divided by the total area in the stratum. Pr( selection ) 2 cr totalarea where c is the number of points visited and r is the radius. 21
22 Weight Development In reality, however, many points are close enough to stratum boundaries to have been selected in multiple strata. The weights must account for the overlap as well. Stratum A r A Stratum B r B Household i Household j 22
23 Weight Development The weight formula becomes (formally): though generally a point is only selectable from one or two strata and therefore the other terms will drop out. For example, a point in stratum 1 that is selectable from both stratum 1 and 5 has a probability of selection equal to: 23
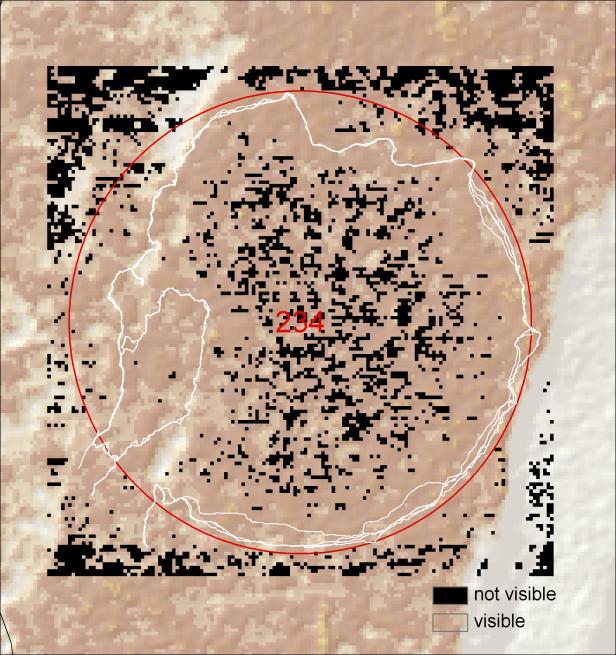
24 Coverage (1) Even those sites which have been selected may not have been fully covered. Interviewers must walk the circles to try to find all the eligible respondents. In every circle, there may be areas which the team was not able to observe. On the supervisor questionnaire, supervisors are asked to report what percentage they observed. 24
25 Coverage (2) In addition, Viewshed analysis can be used by overlaying all the tracks from the GPS device into a map. A computer program can then estimate how much of the circle a team was able to actually observe given the paths that they walked. 25

26 The white lines indicate the tracks walked by the teams. The light gray and brown are areas observable by the team. The black indicates areas not observable. Coverage (3) 26
 27")

27 Coverage (4) 27
28 Coverage (5) Comparison between supervisor reported and Viewshed predicted area covered. Correlation
29 Coverage (6) The weights may need to be adjusted depending on the Viewshed analysis. If the areas visited were exactly like the other areas within the circle, livestock would have been missed because the circles were not completely covered. The weights would need to be adjusted. If the areas were not visited because they were flooded or because the vegetation was too thick for either humans or livestock to pass, the uncovered areas would have zero livestock. The weights would not need to be adjusted. 29
30 Comparison of Means (1) RGCS (unadjusted weights) Cattle 10.5 (1.6) Camels 8.0 (1.5) Goats 20.2 (3.1) Mean (SE) RGCS (adjusted weights) 10.9 (1.8) 7.7 (1.4) 19.7 (3.0) ERSS 15.1 (3.2) 6.1 (1.9) 20.7 (2.7) 30
31 Comparison of Means (2) There are no statistically significant differences between the means between either RGCS (adjusted or unadjusted) and the ERSS means. The standard errors, and therefore the confidence intervals, are smaller with the RGCS because of the larger sample size. 31
32 Comparisons of Totals (1) RGCS (unadjusted weights) Cattle 156,779 (36,544) Camels 92,094 (27,413) Goats 568,608 (153,805) Total (SE) RGCS (adjusted weights) 189,495 (51,068) 139,532 (37,005) 816,871 (221,527) ERSS 1,025,298 (365,859) 214,270 (101,703) 2,143,533 (571,410) 32
33 Comparison of Totals (2) There are huge discrepancies between the total estimates of livestock between the RGCS estimates and the ERSS estimate. Two hypotheses are to the gap: Low effort among interviewer team led to missed circles and livestock within observed circles. Problems in the calculations of the ERSS weights substantially overestimate the totals. 33
34 Low Effort (1) significant findings not significant Selected site visited (logit model) Kilometers to main road - *** Kilometers to nearest locality, kilometers to river, relief Circle radius - * roughness, historical mean EVI value Number of households interviewed - conditional on visiting (OLS model) Kilometers to main road, kilometers to river, total rainfall in Kilometers to nearest locality - ** week prior to survey, current mean EVI value, historical mean EVI value, percentage of circle covered by teams Circle radius + ** Relief Roughness + * Percent of circle observed (OLS model) Circle radius - *** Kilometers to main road, kilometers to nearest locality, total rainfall in week prior to survey, relief roughness, current mean EVI value note: *** p<0.01, ** p<0.05, * p<0.1 34
35 Low Effort (2) In addition, substantial team fixed effects and oversight effect 35
36 Low Effort (3) The findings generally seem to support the low effort hypothesis at least for some teams. Difficult circles such as those farther from the main road or of larger size are less likely to be covered. Strong evidence of team effects Strong effect of oversight by survey coordinator. 36
37 ERSS weights(1) The second possible hypothesis for the difference between the RGCS and ERSS totals is a miscalculation in the ERSS weights. In the ERSS, the rural sample was selected from holders listing, and small towns from the household listing regardless of holder status. The rural sample picks 10 of the 12 from list of holders and 2 randomly from non-holders in rural areas (if available). Otherwise, all12 are chosen from holders. 37
38 ERSS weights(2) Under this design, in clusters where there are both holders and non-holders, the probabilities of selection for the two groups would be different, and we would see variation in the weight within clusters. In the Afar ERSS data, there is no variation within clusters even though not all respondents are livestock holders. 38
39 ERSS weights(2) This indicates the weights are almost certainly miscalculated and contributing to an upward bias to the total numbers seen in the comparison table. 39
40 Remaining questions Which set of totals (ERSS, RGCS adjusted, RGCS unadjusted) are most reasonable given auxiliary data? Are there other hypotheses that could explain the discrepancy? Can this methodology be adapted / differently implemented in Ethiopia (or other places) in the future? 40

41 Thank you. Contact: Kristen Himelein - khimelein@worldbank.org 41
42 Stratification 42
43 Table 1: Stratification of Afar Region Stratu m Description Radiu s (km) Points Selecte d Total area (km 2 ) Percent of total landscape 1 High likelihood: towns <1% 2 Almost no possibility: settled % agricultural areas / commercial farms 3 High likelihood: within 2 km of major river or swamps ,538 6% 4 Medium likelihood: within 10 km of major river or swamps 5 Low likelihood: all land not in another stratum ,921 12% ,152 80% Total ,574 a 100% 43
LUCAS: A possible scheme for a master sampling frame. J. Gallego, MARS AGRI4CAST
 LUCAS: A possible scheme for a master sampling frame. J. Gallego, MARS AGRI4CAST Area frames of square segments Square segments on a classified image 2/16 Sampling farms through points farm a farm b farm
Uganda - National Panel Survey
 Microdata Library Uganda - National Panel Survey 2013-2014 Uganda Bureau of Statistics - Government of Uganda Report generated on: June 7, 2017 Visit our data catalog at: http://microdata.worldbank.org
COMBINING ENUMERATION AREA MAPS AND SATELITE IMAGES (LAND COVER) FOR THE DEVELOPMENT OF AREA FRAME (MULTIPLE FRAMES) IN AN AFRICAN COUNTRY:
 FOR THE DEVELOPMENT OF AREA FRAME (MULTIPLE FRAMES) IN AN AFRICAN COUNTRY:") COMBINING ENUMERATION AREA MAPS AND SATELITE IMAGES (LAND COVER) FOR THE DEVELOPMENT OF AREA FRAME (MULTIPLE FRAMES) IN AN AFRICAN COUNTRY: PRELIMINARY LESSONS FROM THE EXPERIENCE OF ETHIOPIA BY ABERASH
COMBINING ENUMERATION AREA MAPS AND SATELITE IMAGES (LAND COVER) FOR THE DEVELOPMENT OF AREA FRAME (MULTIPLE FRAMES) IN AN AFRICAN COUNTRY: PRELIMINARY LESSONS FROM THE EXPERIENCE OF ETHIOPIA BY ABERASH
East Africa The 2015 Season (Long Rains)
") East Africa The 2015 Season (Long Rains) EAST AFRICA SEASONAL ANALYSIS - 2015 HIGHLIGHTS The Long Rains season in the Horn of Africa has come to an end in May. With no further rainfall until the Short
East Africa The 2015 Season (Long Rains) EAST AFRICA SEASONAL ANALYSIS - 2015 HIGHLIGHTS The Long Rains season in the Horn of Africa has come to an end in May. With no further rainfall until the Short
Sampling: What you don t know can hurt you. Juan Muñoz
 Sampling: What you don t know can hurt you Juan Muñoz Outline of presentation Basic concepts Scientific Sampling Simple Random Sampling Sampling Errors and Confidence Intervals Sampling error and sample
1. Introduction. 1.1 Background to the Case Study. 1.2 General Objectives of the Case Study
 1. Introduction 1.1 Background to the Case Study This report presents a case study on bicycles, women and rural transport in Uganda. It is the result of field work carried out in the Mbale and Tororo districts
East Africa The 2015 Season (Long Rains)
") East Africa The 2015 Season (Long Rains) EAST AFRICA SEASONAL ANALYSIS - 2015 HIGHLIGHTS During March 2015, the early stages of the long rains ( Gu ) season, pronounced rainfall deficits were the norm
East Africa The 2015 Season (Long Rains) EAST AFRICA SEASONAL ANALYSIS - 2015 HIGHLIGHTS During March 2015, the early stages of the long rains ( Gu ) season, pronounced rainfall deficits were the norm
CENSUS MAPPING WITH GIS IN NAMIBIA. BY Mrs. Ottilie Mwazi Central Bureau of Statistics Tel: October 2007
 CENSUS MAPPING WITH GIS IN NAMIBIA BY Mrs. Ottilie Mwazi Central Bureau of Statistics E-mail: omwazi@npc.gov.na Tel: + 264 61 283 4060 October 2007 Content of Presentation HISTORICAL BACKGROUND OF CENSUS
Key elements An open-ended questionnaire can be used (see Quinn 2001).
.") Tool Name: Risk Indexing What is it? Risk indexing is a systematic approach to identify, classify, and order sources of risk and to examine differences in risk perception. What can it be used assessing
Tool Name: Risk Indexing What is it? Risk indexing is a systematic approach to identify, classify, and order sources of risk and to examine differences in risk perception. What can it be used assessing
Session 2.1: Terminology, Concepts and Definitions
 Second Regional Training Course on Sampling Methods for Producing Core Data Items for Agricultural and Rural Statistics Module 2: Review of Basics of Sampling Methods Session 2.1: Terminology, Concepts
El Nino 2015 in South Sudan: Impacts and Perspectives. Raul Cumba
 El Nino 2015 in South Sudan: Impacts and Perspectives Raul Cumba El Nino 2015-2016 The El Nino Event of 2015-2016 The 2015/16 El Nino Event Officially declared in March 2015 Now approaching peak intensity
VALIDATING A SURVEY ESTIMATE - A COMPARISON OF THE GUYANA RURAL FARM HOUSEHOLD SURVEY AND INDEPENDENT RICE DATA
 VALIDATING A SURVEY ESTIMATE - A COMPARISON OF THE GUYANA RURAL FARM HOUSEHOLD SURVEY AND INDEPENDENT RICE DATA David J. Megill, U.S. Bureau of the Census I. Background While attempting to validate survey
Formalizing the Concepts: Simple Random Sampling. Juan Muñoz Kristen Himelein March 2012
 Formalizing the Concepts: Simple Random Sampling Juan Muñoz Kristen Himelein March 2012 Purpose of sampling To study a portion of the population through observations at the level of the units selected,
Formalizing the Concepts: Simple Random Sampling. Juan Muñoz Kristen Himelein March 2013
 Formalizing the Concepts: Simple Random Sampling Juan Muñoz Kristen Himelein March 2013 Purpose of sampling To study a portion of the population through observations at the level of the units selected,
CHAPTER VIII FARM IMPLEMENTS, DRAUGHT ANIMALS AND STORAGE FACILITIES
 CHAPTER VIII FARM IMPLEMENTS, DRAUGHT ANIMALS AND STORAGE FACILITIES 1. INTRODUCTION Agriculture is the single largest sector in the Ethiopian economy. The position of the agricultural sector for the past
Analytical Report. Drought in the Horn of Africa February Executive summary. Geographical context. Likelihood of drought impact (LDI)
") Executive summary The current drought in the Horn of Africa is affecting especially Somalia, among other countries, in particular the central and southern regions, where most population is located. Overall,
Executive summary The current drought in the Horn of Africa is affecting especially Somalia, among other countries, in particular the central and southern regions, where most population is located. Overall,
Indicator: Proportion of the rural population who live within 2 km of an all-season road
 Goal: 9 Build resilient infrastructure, promote inclusive and sustainable industrialization and foster innovation Target: 9.1 Develop quality, reliable, sustainable and resilient infrastructure, including
Preparing the GEOGRAPHY for the 2011 Population Census of South Africa
 Preparing the GEOGRAPHY for the 2011 Population Census of South Africa Sharthi Laldaparsad Statistics South Africa; E-mail: sharthil@statssa.gov.za Abstract: Statistics South Africa (Stats SA) s Geography
Part 7: Glossary Overview
 Part 7: Glossary Overview In this Part This Part covers the following topic Topic See Page 7-1-1 Introduction This section provides an alphabetical list of all the terms used in a STEPS surveillance with
Factors Affecting Human Settlement
 Factors Affecting Human Settlement Physical Factors One of the most basic factors affecting settlement patterns is the physical geography of the land. Climate is key, because if a place is too dry, too
El Nino: Outlook VAM-WFP HQ September 2018
 El Nino: Outlook 2018 VAM-WFP HQ September 2018 El Nino Outlook September 2018 2015-16 El Nino Peak Possible evolution of an El Nino indicator (Pacific sea surface temperature anomaly) generated by a diverse
Understanding and Measuring Urban Expansion
 VOLUME 1: AREAS AND DENSITIES 21 CHAPTER 3 Understanding and Measuring Urban Expansion THE CLASSIFICATION OF SATELLITE IMAGERY The maps of the urban extent of cities in the global sample were created using
MN 400: Research Methods. CHAPTER 7 Sample Design
 MN 400: Research Methods CHAPTER 7 Sample Design 1 Some fundamental terminology Population the entire group of objects about which information is wanted Unit, object any individual member of the population
What is sampling? shortcut whole population small part Why sample? not enough; time, energy, money, labour/man power, equipment, access measure
 What is sampling? A shortcut method for investigating a whole population Data is gathered on a small part of the whole parent population or sampling frame, and used to inform what the whole picture is
JOINT BRIEFING TO THE MEMBERS. El Niño 2018/19 Likelihood and potential impact
 JOINT BRIEFING TO THE MEMBERS El Niño 2018/19 Likelihood and potential impact CURRENT EL NIÑO OUTLOOK (SEPTEMBER 2018) CPC/IRI ENSO Forecast from September. Red bars denote probability of an El Nino developing
SEASONAL AGRICULTURE SURVEY (SAS) The Overview of the Multiple Frame Sample Survey in Rwanda
 The Overview of the Multiple Frame Sample Survey in Rwanda") SEASONAL AGRICULTURE SURVEY (SAS) The Overview of the Multiple Frame Sample Survey in Rwanda Sébastien MANZI Director of Economic Statistics December 16, 2013 National Institute of Statistics of Rwanda
SEASONAL AGRICULTURE SURVEY (SAS) The Overview of the Multiple Frame Sample Survey in Rwanda Sébastien MANZI Director of Economic Statistics December 16, 2013 National Institute of Statistics of Rwanda
GROWING APART: THE CHANGING FIRM-SIZE WAGE PREMIUM AND ITS INEQUALITY CONSEQUENCES ONLINE APPENDIX
 GROWING APART: THE CHANGING FIRM-SIZE WAGE PREMIUM AND ITS INEQUALITY CONSEQUENCES ONLINE APPENDIX The following document is the online appendix for the paper, Growing Apart: The Changing Firm-Size Wage
DROUGHT ASSESSMENT USING SATELLITE DERIVED METEOROLOGICAL PARAMETERS AND NDVI IN POTOHAR REGION
 DROUGHT ASSESSMENT USING SATELLITE DERIVED METEOROLOGICAL PARAMETERS AND NDVI IN POTOHAR REGION Researcher: Saad-ul-Haque Supervisor: Dr. Badar Ghauri Department of RS & GISc Institute of Space Technology
ADVANCED PLACEMENT HUMAN GEOGRAPHY
 ADVANCED PLACEMENT HUMAN GEOGRAPHY Unit One Geography: Its Nature and Perspectives Session 3 INTERPRETATION OF PLACES AND PATTERNS PLACE: THE GEOGRAPHIC TERM Place is deceptively complex. Place describes
Sampling in Space and Time. Natural experiment? Analytical Surveys
 Sampling in Space and Time Overview of Sampling Approaches Sampling versus Experimental Design Experiments deliberately perturb a portion of population to determine effect objective is to compare the mean
Environmental Changes, Migration, and Remittances Affect Pastoralist Communities in Montane Central Asia
 Environmental Changes, Migration, and Remittances Affect Pastoralist Communities in Montane Central Asia Geoffrey M. Henebry * Hannah Visiting Professor Center for Global Change & Earth Observations &
name and locate the world s seven continents and five oceans
 Subject: Geography Activities National Curriculum Objectives One Progression of Skills Name the 7 continents and 5 oceans 3D Jigsaw task to locate continents and seas name and locate the world s seven
THE ESTABLISHMENT SURVEY TECHNICAL REPORT
 THE ESTABLISHMENT SURVEY TECHNICAL REPORT March 2017 1 1. Introduction The collection of data for the Establishment Survey commenced on 1 July 2016. The aim is for media owners, marketers, and advertisers
City of Hermosa Beach Beach Access and Parking Study. Submitted by. 600 Wilshire Blvd., Suite 1050 Los Angeles, CA
 City of Hermosa Beach Beach Access and Parking Study Submitted by 600 Wilshire Blvd., Suite 1050 Los Angeles, CA 90017 213.261.3050 January 2015 TABLE OF CONTENTS Introduction to the Beach Access and Parking
East Africa: The 2016 Season
 HIGHLIGHTS The first growing season of 2016 (March-May, Long Rains in Kenya, Belg in Ethiopia) brought good rainfall across Ethiopia, Eritrea and Somaliland. This was a welcome reprieve for many regions
The Setaman of Papua New Guinea
 Profile Year: 2009 People and Language Detail Profile Language Name: Setaman ISO Language Code: stm Primary Religion: Christianity Disciples (Matt 28:19): 95% Churches: 3 _ Scripture Status (Matt 28:20):
Environmental Analysis, Chapter 4 Consequences, and Mitigation
 Environmental Analysis, Chapter 4 4.17 Environmental Justice This section summarizes the potential impacts described in Chapter 3, Transportation Impacts and Mitigation, and other sections of Chapter 4,
CURRENT AND FUTURE ACTIVITIES TO IMPROVE STRATIFICATION FOR SEASONAL AGRICULTURE SURVEYS IN RWANDA
 CURRENT AND FUTURE ACTIVITIES TO IMPROVE STRATIFICATION FOR SEASONAL AGRICULTURE SURVEYS IN RWANDA Roselyne Ishimwe 1 *, Sebastian Manzi 1 National Institute of Statistics of Rwanda (NISR) *Email: Corresponding
Apéndice 1: Figuras y Tablas del Marco Teórico
 Apéndice 1: Figuras y Tablas del Marco Teórico FIGURA A.1.1 Manufacture poles and manufacture regions Poles: Share of employment in manufacture at least 12% and population of 250,000 or more. Regions:
Second-Stage Sampling for Conflict Areas
 Policy Research Working Paper 7617 WPS7617 Second-Stage Sampling for Conflict Areas Methods and Implications Kristen Himelein Stephanie Eckman Siobhan Murray Johannes Bauer Public Disclosure Authorized
INDIANA ACADEMIC STANDARDS FOR SOCIAL STUDIES, WORLD GEOGRAPHY. PAGE(S) WHERE TAUGHT (If submission is not a book, cite appropriate location(s))
 WHERE TAUGHT (If submission is not a book, cite appropriate location(s))") Prentice Hall: The Cultural Landscape, An Introduction to Human Geography 2002 Indiana Academic Standards for Social Studies, World Geography (Grades 9-12) STANDARD 1: THE WORLD IN SPATIAL TERMS Students
Prentice Hall: The Cultural Landscape, An Introduction to Human Geography 2002 Indiana Academic Standards for Social Studies, World Geography (Grades 9-12) STANDARD 1: THE WORLD IN SPATIAL TERMS Students
Conducting Fieldwork and Survey Design
 Conducting Fieldwork and Survey Design (Prepared for Young South Asian Scholars Participating in SARNET Training Programme at IHD) Dr. G. C. Manna Structure of Presentation Advantages of Sample Surveys
Notes On: Do Television and Radio Destroy Social Capital? Evidence from Indonesian Village (Olken 2009)
") Notes On: Do Television and Radio Destroy Social Capital? Evidence from Indonesian Village (Olken 2009) Increasing interest in phenomenon social capital variety of social interactions, networks, and groups
Notes On: Do Television and Radio Destroy Social Capital? Evidence from Indonesian Village (Olken 2009) Increasing interest in phenomenon social capital variety of social interactions, networks, and groups
Regression analysis an example in quantitative methods
 Example 1 (referred to in module 4) Regression analysis an example in quantitative methods John Rowlands International Livestock Research Institute, P.O. Box 30709, Nairobi, Kenya Background Eighty seven
About places and/or important events Landmarks Maps How the land is, hills or flat or mountain range Connected to maps World Different countries
 What do you think you know about geography? About places and/or important events Landmarks Maps How the land is, hills or flat or mountain range Connected to maps World Different countries What do you
Early Warning > Early Action: The Next Frontier. Dr. Arame Tall Climate Services- Global Coordinator, Champion
 Early Warning > Early Action: The Next Frontier Dr. Arame Tall Climate Services- Global Coordinator, Champion a.tall@cgiar.org 2 3/21/11 The Challenge: Bridging The Gap Seasonal Precipitation Forecast
Use maps, atlases, globes and computer mapping to locate countries and describe features studied
 Roseberry Primary School Curriculum planning Lead Question: What s so amazing about America? National Curriculum driver: Geography Rationale statement: In this study about the amazing Americas, children
COMMUNITY SERVICE AREA
 INSTITUTE FOR TRIBAL ENVIRONMENTAL PROFESSIONALS Tribal Waste and Response Assistance Program (TWRAP) Developing and Implementing a Tribal Integrated Solid Waste Management Plan April 12-14, 2016 Palm
Typical information required from the data collection can be grouped into four categories, enumerated as below.
 Chapter 6 Data Collection 6.1 Overview The four-stage modeling, an important tool for forecasting future demand and performance of a transportation system, was developed for evaluating large-scale infrastructure
SOUTH COAST COASTAL RECREATION METHODS
 SOUTH COAST COASTAL RECREATION METHODS A customized, web-based survey instrument, which utilizes Point 97 s Viewpoint survey and mapping technology, was used to collect spatially explicit data on coastal
Geographic information strategy
 Department for Environment, Food and Rural Affairs Geographic information strategy Methodology JULY 2011 2 Geographic information strategy Methodology This document provides a detailed description of the
DISPLACEMENT TRACKING MATRIX (DTM) AFAR, ETHIOPIA ROUND 12: JULY/AUGUST 2018 Summary of key findings DATE OF PUBLICATION:
 AFAR, ETHIOPIA ROUND 12: JULY/AUGUST 2018 Summary of key findings DATE OF PUBLICATION:") DISPLACEMENT TRACKING MATRIX (DTM) AFAR, ETHIOPIA ROUND 12: JULY/AUGUST 2018 Summary of key findings DATE OF PUBLICATION: DISPLACEMENT TRACKING MATRIX (DTM) AFAR, ETHIOPIA ROUND 12: JULY/AUGUST 2018 Dalul
DISPLACEMENT TRACKING MATRIX (DTM) AFAR, ETHIOPIA ROUND 12: JULY/AUGUST 2018 Summary of key findings DATE OF PUBLICATION: DISPLACEMENT TRACKING MATRIX (DTM) AFAR, ETHIOPIA ROUND 12: JULY/AUGUST 2018 Dalul
Georgia Kayser, PhD. Module 4 Approaches to Sampling. Hello and Welcome to Monitoring Evaluation and Learning: Approaches to Sampling.
 Slide 1 Module 4 Approaches to Sampling Georgia Kayser, PhD Hello and Welcome to Monitoring Evaluation and Learning: Approaches to Sampling Slide 2 Objectives To understand the reasons for sampling populations
UNIVERSITY OF CAMBRIDGE INTERNATIONAL EXAMINATIONS International General Certificate of Secondary Education GEOGRAPHY 0460/01
 UNIVERSITY OF CAMBRIDGE INTERNATIONAL EXAMINATIONS International General Certificate of Secondary Education GEOGRAPHY 0460/01 Paper 1 Additional Materials: Answer Booklet/Paper; Ruler May/June 2005 1 hour
FCE 3900 EDUCATIONAL RESEARCH LECTURE 8 P O P U L A T I O N A N D S A M P L I N G T E C H N I Q U E
 FCE 3900 EDUCATIONAL RESEARCH LECTURE 8 P O P U L A T I O N A N D S A M P L I N G T E C H N I Q U E OBJECTIVE COURSE Understand the concept of population and sampling in the research. Identify the type
ENVIRONMENT AND CLIMATE ANALYSIS IN LAKES, NORTHERN BAHR EL GHAZAL AND WARRAP STATES SOUTH SUDAN
 ENVIRONMENT AND CLIMATE ANALYSIS IN LAKES, NORTHERN BAHR EL GHAZAL AND WARRAP STATES SOUTH SUDAN Preliminary Analysis Report As part of the Building Resilience and Adaptation to Climate Extremes and Disasters
The map document opens, and you see a physical map of the world with the Saudi Arabian Peninsula outlined in red.
 Module 5, Lesson 2 A line in the sand The ever-changing map of the world reflects the forces of conflict and cooperation among nations and peoples of the world. In this activity, you will explore one of
UNIT4. Ancient China. Geography and the Early Settlement of China. Three Chinese Philosophies The First Emperor of China
 UNIT4 Ancient China Lesson 19 Lesson 20 Lesson 21 Lesson 22 Lesson 23 Lesson 24 Geography and the Early Settlement of China The Shang Dynasty Three Chinese Philosophies The First Emperor of China The Han
Building the next generation of global citizens! Curriculum. International Sports Exchange
 Building the next generation of global citizens! Curriculum International Sports Exchange CURRICULUM Unit TItle: SOUTHERN AFRICA Unit Length: Weeks Guiding Questions: Can students locate the region of
CHAPTER 3: DATA ACQUISITION AND ANALYSIS. The research methodology is an important aspect of research to make a study results
 CHAPTER 3: DATA ACQUISITION AND ANALYSIS 3.1 Introduction The research methodology is an important aspect of research to make a study results are good and reliable. Research methodology also provides guidance
East Africa: The 2017 Season. Somalia again on the brink of drought
 East Africa: The 2017 Season Somalia again on the brink of drought Bulletin 2017 4, Eastern Africa November 2017 Contents Highlights HIGHLIGHTS...2 MAY TO JUNE 2017...3 JULY TO SEPTEMBER 2017....4 SHORT
El Nino 2015: The Story So Far and What To Expect Next
 El Nino 2015: The Story So Far and What To Expect Next The El Nino Event of 2015-2016 The 2015/16 El Nino Event Officially declared in March 2015 Now approaching peak intensity Expected to last through
El Nino 2015: The Story So Far and What To Expect Next
 El Nino 2015: The Story So Far and What To Expect Next The El Nino Event of 2015-2016 The 2015/16 El Nino Event Officially declared in March 2015 Now approaching peak intensity Expected to last through
Introducing GIS analysis
 1 Introducing GIS analysis GIS analysis lets you see patterns and relationships in your geographic data. The results of your analysis will give you insight into a place, help you focus your actions, or
NAME: DATE: Leaving Certificate GEOGRAPHY: Maps and aerial photographs. Maps and Aerial Photographs
 NAME: DATE: Leaving Certificate Geography Maps and Aerial Photographs Please see Teachers Notes for explanations, additional activities, and tips and suggestions. Learning Support Vocabulary, key terms
Use of GIS in road sector analysis
 Use of GIS in road sector analysis Uwe Deichmann, DECRG March 30, 2007 Transport Forum and Learning Week 2007 Transport Measurement Matters Indicators of Performance and Impact Geographic information Using
El Nino: Implications and Scenarios for 2015
 El Nino: Implications and Scenarios for 2015 El Nino: Regional Highlights for 2015-2016 Red=Negative; Orange=Watch; Green=Positive The current El Nino will last through 2015 and extend into early 2016.
Technical Memorandum #2 Future Conditions
 Technical Memorandum #2 Future Conditions To: Dan Farnsworth Transportation Planner Fargo-Moorhead Metro Council of Governments From: Rick Gunderson, PE Josh Hinds PE, PTOE Houston Engineering, Inc. Subject:
Chapter 1 Data Collection
 Chapter 1 Data Collection 1. Climate of Brunei Darussalam and Temburong District Situated at around four degrees north of the Equator, Brunei Darussalam enjoys an equatorial climate with an abundance of
Data Collection. Lecture Notes in Transportation Systems Engineering. Prof. Tom V. Mathew. 1 Overview 1
 Data Collection Lecture Notes in Transportation Systems Engineering Prof. Tom V. Mathew Contents 1 Overview 1 2 Survey design 2 2.1 Information needed................................. 2 2.2 Study area.....................................
Participants. Participatory Mapping. Village : Date : Page : / No. Name Job Gender. Entered by. Interviewer. Author. Checked by
 Participatory Mapping Author Interviewer Entered by Checked by Original or Copy O C File name Checked by Has been written on back? Y N Has been copied? Village Participants No. Name Job Gender 1 2 3 4
World Geography. WG.1.1 Explain Earth s grid system and be able to locate places using degrees of latitude and longitude.
 Standard 1: The World in Spatial Terms Students will use maps, globes, atlases, and grid-referenced technologies, such as remote sensing, Geographic Information Systems (GIS), and Global Positioning Systems
APPENDIX A SAMPLE DESIGN
 APPENDIX A SAMPLE DESIGN APPENDIX A SAMPLE DESIGN Thanh U A.1 Introduction The Kazakstan Demographic and Health Survey (KDHS) employed a nationally representative probability sample of women age 15-49.
Livingston American School 4 th Quarter Curriculum Map
 Livingston American School 4 th Quarter Curriculum Map Week 1 Week 2 Week 3 Week 4 Concept / Topic To Teach: 1) India 1) Population Explosion 1) Territorial dispute 1) East Asia 2) Pakistan and Bangladesh
Patterns and Root Causes of Land Cover/Use Change in Uganda: An Account of the Past 100 Years. Part 2: Appendices
 Patterns and Root Causes of Land Cover/Use Change in Uganda: An Account of the Past 100 Years Part 2: Appendices The Land Use Change, Impacts and Dynamics Project Working Paper umber: 14 By Samuel Mugisha
Frontier and Remote (FAR) Area Codes: A Preliminary View of Upcoming Changes John Cromartie Economic Research Service, USDA
 Area Codes: A Preliminary View of Upcoming Changes John Cromartie Economic Research Service, USDA") National Center for Frontier Communities webinar, January 27, 2015 Frontier and Remote (FAR) Area Codes: A Preliminary View of Upcoming Changes John Cromartie Economic Research Service, USDA The views
National Center for Frontier Communities webinar, January 27, 2015 Frontier and Remote (FAR) Area Codes: A Preliminary View of Upcoming Changes John Cromartie Economic Research Service, USDA The views
Data Collection: What Is Sampling?
 Project Planner Data Collection: What Is Sampling? Title: Data Collection: What Is Sampling? Originally Published: 2017 Publishing Company: SAGE Publications, Inc. City: London, United Kingdom ISBN: 9781526408563
LC OL - Statistics. Types of Data
 LC OL - Statistics Types of Data Question 1 Characterise each of the following variables as numerical or categorical. In each case, list any three possible values for the variable. (i) Eye colours in a
Cambridge International Examinations Cambridge International General Certificate of Secondary Education
 Cambridge International Examinations Cambridge International General Certificate of Secondary Education *3136645309* GEOGRAPHY 0460/23 Paper 2 October/November 2014 Candidates answer on the Question Paper.
Innovation in the Measurement of Place: Systematic Social Observation in a Rural Setting
 Innovation in the Measurement of Place: Systematic Social Observation in a Rural Setting Barbara Entwisle Heather Edelblute Brian Frizzelle Phil McDaniel September 21, 2009 Background Hundreds of studies
Use of auxiliary information in the sampling strategy of a European area frame agro-environmental survey
 Use of auxiliary information in the sampling strategy of a European area frame agro-environmental survey Laura Martino 1, Alessandra Palmieri 1 & Javier Gallego 2 (1) European Commission: DG-ESTAT (2)
Presented to Sub-regional workshop on integration of administrative data, big data and geospatial information for the compilation of SDG indicators
 Presented to Sub-regional workshop on integration of administrative data, big data and geospatial information for the compilation of SDG indicators 23-25 April,2018 Addis Ababa, Ethiopia By: Deogratius
forest tropical jungle swamp marsh prairie savanna pampas Different Ecosystems (rainforest)
") Different Ecosystems forest A region of land that is covered with many trees and shrubs. tropical jungle (rainforest) swamp A region with dense trees and a variety of plant life. It has a tropical climate.
Different Ecosystems forest A region of land that is covered with many trees and shrubs. tropical jungle (rainforest) swamp A region with dense trees and a variety of plant life. It has a tropical climate.
Chesapeake Bay Remote Sensing Pilot Executive Briefing
 Chesapeake Bay Remote Sensing Pilot Executive Briefing Introduction In his Executive Order 13506 in May 2009, President Obama stated The Chesapeake Bay is a national treasure constituting the largest estuary
Module 4 Approaches to Sampling. Georgia Kayser, PhD The Water Institute
 Module 4 Approaches to Sampling Georgia Kayser, PhD 2014 The Water Institute Objectives To understand the reasons for sampling populations To understand the basic questions and issues in selecting a sample.
This Week s Topics. GIS and Forest Engineering Applications. FE 257. GIS and Forest Engineering Applications. Instructor Information.
 FE 257. GIS and Forest Engineering Applications Introduction Instructor Information Associate Professor in FERM Department Instructor for FE 257, FE 480, FE 432/532 PhD from Forest Resources with minor
Geography Skills Progression. Eden Park Primary School Academy
 Geography Skills Progression Eden Park Primary School Academy In order to ensure broad and balanced coverage, we follow these principles: Within each phase, geography is a driver for at least 3 Learning
Globally Estimating the Population Characteristics of Small Geographic Areas. Tom Fitzwater
 Globally Estimating the Population Characteristics of Small Geographic Areas Tom Fitzwater U.S. Census Bureau Population Division What we know 2 Where do people live? Difficult to measure and quantify.
GIS as a Management Tool in Nepal Earthquake Response
 GIS as a Management Tool in Nepal Earthquake Response Presenter: Charlie Charping GIS Manager Samaritan s Purse A CASE STUDY & LESSONS LEARNED Presentation Agenda Samaritan s Purse Background The Case
Mathematics (Project Maths Phase 1)
") L.20 NAME SCHOOL TEACHER Pre-Leaving Certificate Examination, 2012 Mathematics (Project Maths Phase 1) Paper 2 Higher Level Time: 2 hours, 30 minutes 300 marks For examiner Question Mark 1 2 3 Centre stamp
L.20 NAME SCHOOL TEACHER Pre-Leaving Certificate Examination, 2012 Mathematics (Project Maths Phase 1) Paper 2 Higher Level Time: 2 hours, 30 minutes 300 marks For examiner Question Mark 1 2 3 Centre stamp
Public Disclosure Copy. Implementation Status & Results Report Tanzania: Resilient Natural Resource Management for Tourism and Growth (P150523)
") Public Disclosure Authorized AFRICA Tanzania Environment & Natural Resources Global Practice IBRD/IDA Investment Project Financing FY 2018 Seq No: 1 ARCHIVED on 05-Dec-2017 ISR30455 Implementing Agencies:
Public Disclosure Authorized AFRICA Tanzania Environment & Natural Resources Global Practice IBRD/IDA Investment Project Financing FY 2018 Seq No: 1 ARCHIVED on 05-Dec-2017 ISR30455 Implementing Agencies:
Observational Data Standard - List of Entities and Attributes
 OBSERVATION An observation characterizes the occurrence, or documents the lack of occurrence, of an organism or set of organisms through a data collection event at a location. Individual observations are
How to Develop Master Sampling Frames using Dot Sampling Method and Google Earth
 How to Develop Master Sampling Frames using Dot Sampling Method and Google Earth Issei Jinguji. Agricultural statistics. JICA expert. Project for Capacity Development for the ASDP Monitoring and Evaluation
The World Bank Mongolia Livestock and Agricultural Marketing Project (P125964)
") Public Disclosure Authorized EAST ASIA AND PACIFIC Mongolia Agriculture Global Practice Recipient Executed Activities Specific Investment Loan FY 2013 Seq No: 4 ARCHIVED on 11-Oct-2015 ISR21035 Implementing
Public Disclosure Authorized EAST ASIA AND PACIFIC Mongolia Agriculture Global Practice Recipient Executed Activities Specific Investment Loan FY 2013 Seq No: 4 ARCHIVED on 11-Oct-2015 ISR21035 Implementing
MARS AREA SCHOOL DISTRICT CURRICULUM GRADE: Grade 4
 MARS AREA SCHOOL DISTRICT CURRICULUM GRADE: Grade 4 Course Title: Social Studies Brief Description Overview: Students will explore the history, geography, government, and economy of the United States with
GEOGRAPHY PAPER 312/ 1 K.C.S.E 1997 SECTION A Answer all the questions in this section.
 GEOGRAPHY PAPER 312/ 1 K.C.S.E 1997 SECTION A Answer all the questions in this section. 1. The diagram below shows the structure of the earth. Name the parts marked p, q and R Name the minerals that make
A-level MATHEMATICS. Paper 3. Exam Date Morning Time allowed: 2 hours SPECIMEN MATERIAL
 SPECIMEN MATERIAL Please write clearly, in block capitals. Centre number Candidate number Surname Forename(s) Candidate signature A-level MATHEMATICS Paper 3 Exam Date Morning Time allowed: 2 hours Materials
Drought Bulletin for the Greater Horn of Africa: Situation in June 2011
 Drought Bulletin for the Greater Horn of Africa: Situation in June 2011 Preliminary Analysis of data from the African Drought Observatory (ADO) SUMMARY The analyses of different meteorological and remote
Neighborhood social characteristics and chronic disease outcomes: does the geographic scale of neighborhood matter? Malia Jones
 Neighborhood social characteristics and chronic disease outcomes: does the geographic scale of neighborhood matter? Malia Jones Prepared for consideration for PAA 2013 Short Abstract Empirical research
Sampling and Estimation in Agricultural Surveys
 GS Training and Outreach Workshop on Agricultural Surveys Training Seminar: Sampling and Estimation in Cristiano Ferraz 24 October 2016 Download a free copy of the Handbook at: http://gsars.org/wp-content/uploads/2016/02/msf-010216-web.pdf