Annual Tropical 2013 Cyclone Report 2013
|
|
|
- Norman Nichols
- 5 years ago
- Views:
Transcription


1 U.S. Naval Maritime Forecast Center/ Joint Typhoon Warning Center Annual Tropical Pearl Harbor, Cyclone Hawaii Report Annual Tropical 2013 Cyclone Report 2013 ASHLEY D. EVANS Captain, United States Navy Commanding Officer ROBERT J. FALVEY Director, Joint Typhoon Warning Center
2 Cover: NPP VIIRS Infrared image of Super Typhoon 31W (Haiyan). 06 November 2013 as its eye passed just north of Palau with wind speeds of 150 kts. Imagery courtesy of Jeff Hawkins- NRL. Pg. 2
3 Executive Summary The Annual Tropical Cyclone Report (ATCR) is prepared by the staff of the Joint Typhoon Warning Center (JTWC), a jointly manned United States Air Force/Navy organization formally under the operational command of the Commanding Officer, Joint Typhoon Warning Center. The original JTWC was established on 1 May 1959 by the Commander-in- Chief, US Pacific Command (USCINCPAC) to provide a single tropical cyclone warning center for the western North Pacific region. USCINCPAC delegated the tropical cyclone forecast and warning mission to Commander, Pacific Fleet. A subsequent USCINCPAC directive further tasked Commander, Pacific Air Force to provide for tropical cyclone (TC) reconnaissance support to the JTWC. Currently, JTWC operations are guided by USPACOM Instruction and Pacific Air Forces Instruction This edition of the ATCR documents the TC season and details operationally or meteorologically significant cyclones noted within the JTWC Area of Responsibility. Details are provided to describe either significant challenges and/or shortfalls in the TC warning system and to serve as a focal point for future research and development efforts. Also included are tropical cyclone reconnaissance statistics and a summary of tropical cyclone research or technique development that members of JTWC were involved. For the first time since 2004, above average tropical cyclone activity was observed in the western North Pacific Ocean, with only 33 TCs observed compared to the long term average of 31. There were five cyclones that reached super typhoon intensity, with Super Typhoon 31W (Haiyan) being one of the strongest cyclones on record for the western North Pacific basin. Major DoD installations experienced minimal impacts, with only one typhoon (23W) and one depression (13W) passing just north of Okinawa. Guam experienced a direct hit by Tropical Storm 25W (Wipha) while it was a tropical depression. Department of Defense bases in South Korea were not impacted and mainland Japan was impacted by two tropical storms, 15W and 16W. The Southern Hemisphere activity remained below the long term average of 28, with 16 cyclones in the south Indian Ocean / western Australia region and 8 in the south Pacific / eastern Australia region. The Northern Indian Ocean experienced slightly above normal activity with 6 cyclones, with one in the Arabian Sea and five in the Bay of Bengal. The most significant cyclone in the north Indian Ocean was Tropical Cyclone 20B (Phalin), which reached a peak intensity of 140 knots. Weather satellite data remained the mainstay of the TC reconnaissance mission to support the JTWC. Satellite analysts exploited a wide variety of conventional and microwave satellite data to produce over 9,280 position and intensity estimates (fixes), primarily using the USAF Mark IVB and the USN FMQ-17 satellite direct readout systems. Geo-located microwave satellite imagery overlays available via the Automated Tropical Cyclone Forecast (ATCF) system from Fleet Numerical Meteorology and Oceanography Center and the Naval Research Lab Monterey were also used by JTWC to make TC fixes thus providing additional data for TC location and intensity. JTWC also continues to utilize radar derived TC position information from numerous U.S. owned/operated weather radars as well as from international sources. However, budget challenges have delayed the replacement of the WSR-88D Doppler Weather Radar at Kadena AB. JTWC continued to collaborate with TC forecast support and research organizations such as the Fleet Numerical Meteorology and Oceanography Center (FNMOC), Naval Research Laboratory, Monterey (NRLMRY), Naval Post Graduate School, the Office of Naval Research, Air Force Weather Agency (AFWA), and NOAA Line Offices for continued development of TC reconnaissance tools, numerical models and forecast aids. Pg. 3
4 The Techniques Development (TECHDEV) remained the voice of JTWC to the research and development community. They worked with researchers from the University of Hawaii, University of Arizona, Naval Post Graduate School and other agencies on a variety of promising projects. In collaboration with other Typhoon Duty Officers, TECHDEV developed a cyclone phase checklist to help forecasters assess whether a cyclone is tropical, subtropical or extratropical. This process and checklist was presented at the 2013 AMS Conference on Hurricanes and Tropical Meteorology in San Diego, CA. Behind all these efforts are the dedicated team of men and women, military and civilian at JTWC. Special thanks to the entire JTWC N6 Department for their outstanding IT support and the administrative and budget staff who worked tirelessly to ensure JTWC had the necessary resources to get the mission done in extremely volatile financial times. A Special thanks also to: FNMOC for their operational data and modeling support; ONR for continuing to provide funding to basic and applied research in tropical cyclones in a very challenging fiscal environment, NRLMRY for its dedicated TC research, including providing real-time access to cutting edge satellite imagery on their Tropical Cyclone Page and improvements to the COAMPS-TC model; the National Oceanic and Atmospheric Administration National Environmental Satellite, Data, and Information Service for satellite reconnaissance support; Dr. John Knaff, Mr. Jeff Hawkins, Dr. Mark DeMaria, Mr. Chris Velden and Mr. Derrick Herndon for their continuing efforts to exploit remote sensing technologies in new and innovative ways; Mr. Charles R. Buck Sampson, Ms. Ann Schrader, and Mr. Mike Frost for their outstanding support and continued development of the ATCF system. Pg. 4
5 JTWC Personnel 2013 Staff Mr. Robert Falvey, Director LT Chad Geis, Operations Officer Mr. Edward Fukada, Technical Advisor Mr. Matt Kucas Mr. Brian Strahl Mr. James Darlow Typhoon Duty Officers (TDO) Maj Jay Neese LT Thomas Mills LT Joshua Carter LT Chad Geis LT Thai Phung Mr. Matt Kucas Mr. Stephen Barlow Mr. Brian Strahl Mr. Richard Ballucanag Mr. Aaron Lana Satellite Operations Maj Jay Neese, OIC Satellite Operations Capt Brenda Arincorayan, OIC Satellite Operations TSgt Jeffrey Quast, Analyst/NCOIC SrA Brittany Bermea, Analyst SrA Andrew Casper, Analyst SrA Karen Long, Analyst SrA Cody Newcomer, Analyst SrA Kolby Rapp, Analyst SrA Terrance Schalin, Analyst Mr. James Darlow, Analyst Mr. Dana Uehara, Analyst Geophysical Technician (GT) AG1 Jamaine Parks MC2 Vaughan Dill AG2 James Spruill AG2 Candice Sullivan AG2 Nicholas Vojak AG3 Heather Johnston AG3 Jack Tracey AG3 Christian Wilcox AGAA Bristol Rigby AGAA Jake Wilson Pg. 5
6 Table of Contents EXECUTIVE SUMMARY... 3 CHAPTER 1 WESTERN NORTH PACIFIC OCEAN TROPICAL CYCLONES... 8 Section 1 Informational Tables... 8 Section 2 Cyclone Summaries W Tropical Storm Sonamu W Tropical Depression Shanshan W Tropical Storm Yagi W Tropical Storm Leepi W Tropical Storm Bebinca W Typhoon Rumbia W Typhoon Soulik W Tropical Storm Cimaron W Tropical Storm Jebi W Tropical Storm Mangkhut W Super Typhoon Utor W Typhoon Trami W Tropical Depression W Tropical Storm Kong-Rey W Tropical Storm Toraji W Tropical Storm Man-Yi W Super Typhoon Usagi W Tropical Depression W Typhoon Pabuk W Typhoon Wutip W Tropical Storm Sepat W Typhoon Fitow W Typhoon Danas W Typhoon Nari W Typhoon Wipha W Super Typhoon Francisco W Tropical Depression W Super Typhoon Lekima W Typhoon Krosa W Tropical Storm W Super Typhoon Haiyan W Tropical Depression Podul W Tropical Depression C Hurricane Pewa C Tropical Depression Section 3 Detailed Cyclone Reviews CHAPTER 2 NORTH INDIAN OCEAN TROPICAL CYCLONES Section 1 Informational Tables Section 2 Cyclone Summaries B Tropical Cyclone Mahasen B Tropical Cyclone Phailin A Tropical Cyclone B Tropical Cyclone Helen B Tropical Cyclone Lehar B Tropical Cyclone Madi CHAPTER 3 SOUTH PACIFIC AND SOUTH INDIAN OCEAN TROPICAL CYCLONES Section 1 Informational Tables Section 2 Cyclone Summaries Pg. 6
7 01S Tropical Cyclone Anais S Tropical Cyclone Boldwin S Tropical Cyclone Claudia P Tropical Cyclone Evan P Tropical Cyclone Freda S Tropical Cyclone Mitchell S Tropical Cyclone Dumile S Tropical Cyclone Narelle S Tropical Cyclone Emang P Tropical Cyclone Garry P Tropical Cyclone Oswald S Tropical Cyclone Peta S Tropical Cyclone Felleng P Tropical Cyclone Haley S Tropical Cyclone Gino S Tropical Cyclone Haruna S Tropical Cyclone Rusty S Tropical Cyclone P Tropical Cyclone Sandra P Tropical Cyclone Tim S Tropical Cyclone Imelda S Tropical Cyclone Victoria P Tropical Cyclone Zane S Tropical Cyclone Jamala CHAPTER 4 TROPICAL CYCLONE FIX DATA Section 1 Background Section 2 Fix summary by basin CHAPTER 5 TECHNIQUES DEVELOPMENT SUMMARY Section 1: Overview Section 2: 2013 Scientific development projects Section Operational Development Projects Section 4 Future work CHAPTER 6 SUMMARY OF FORECAST VERIFICATION Pg. 7
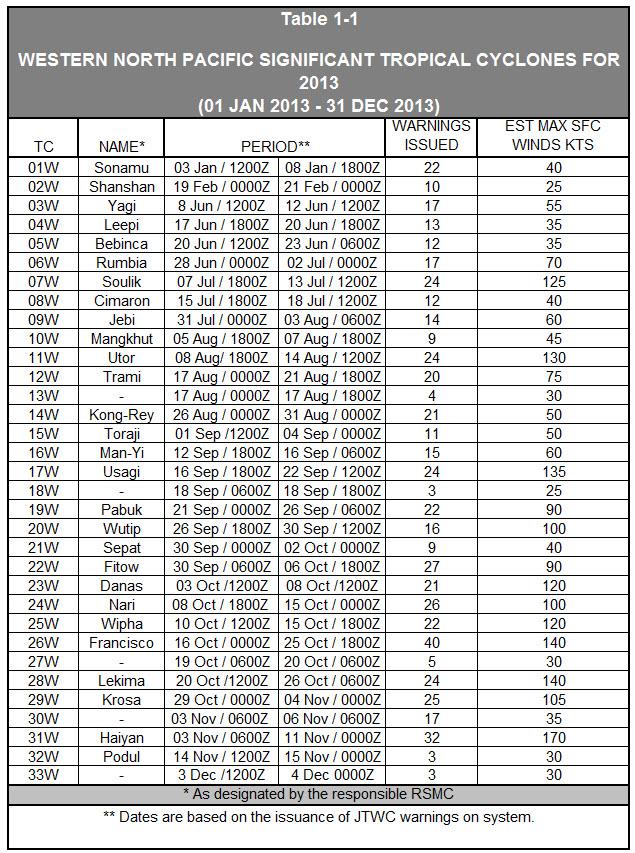
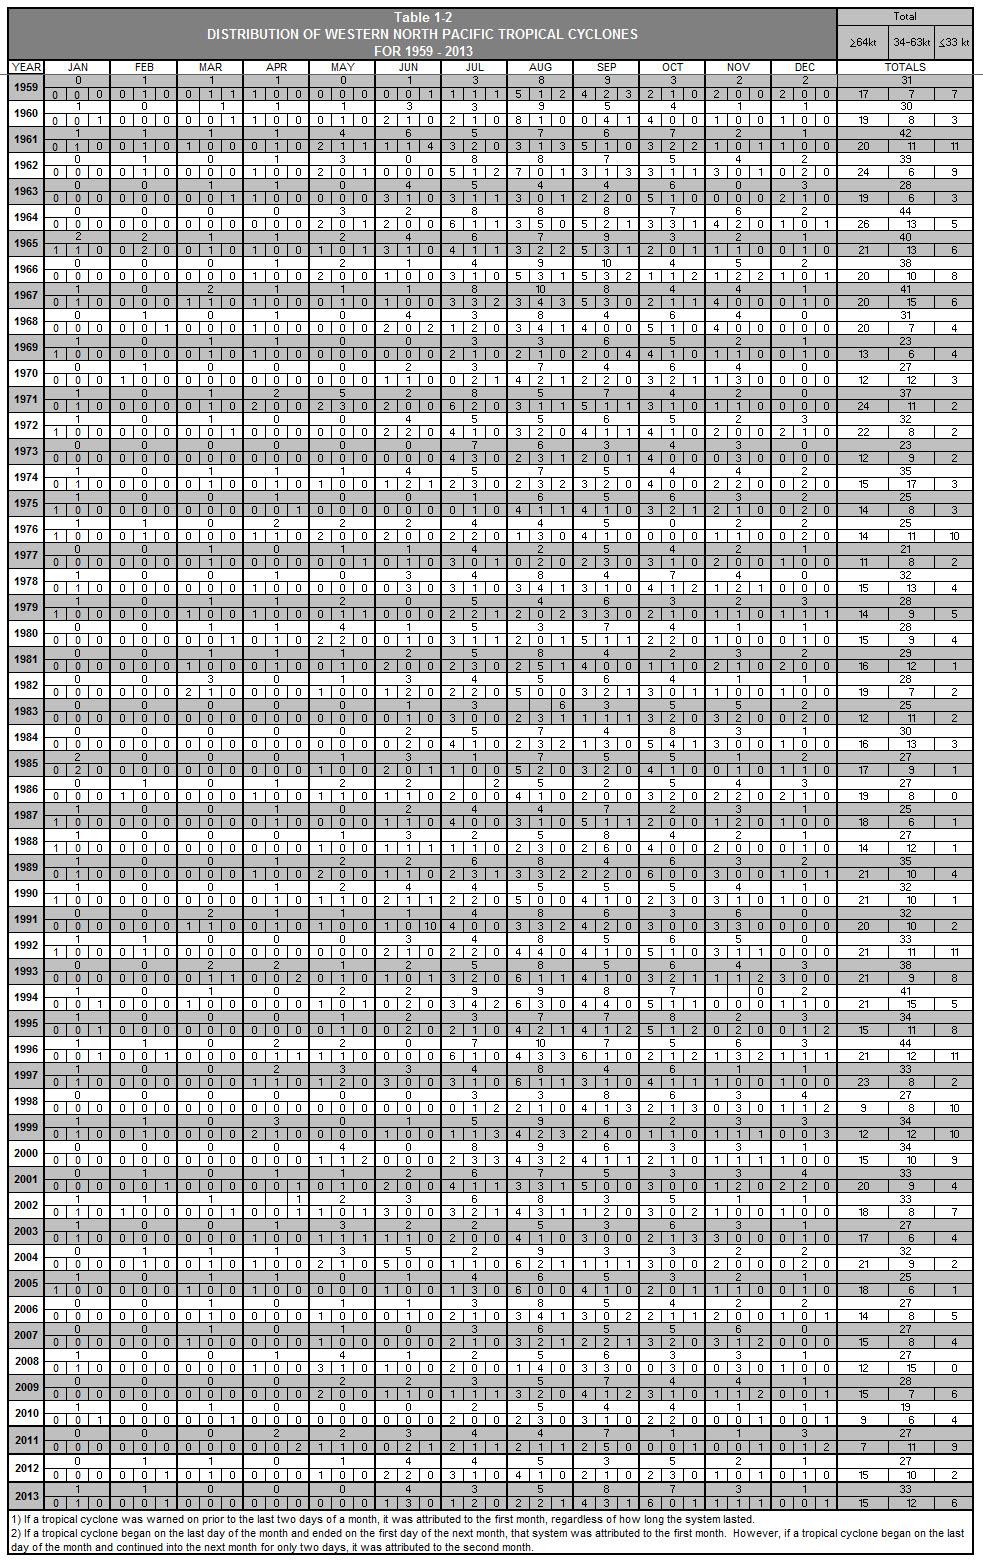
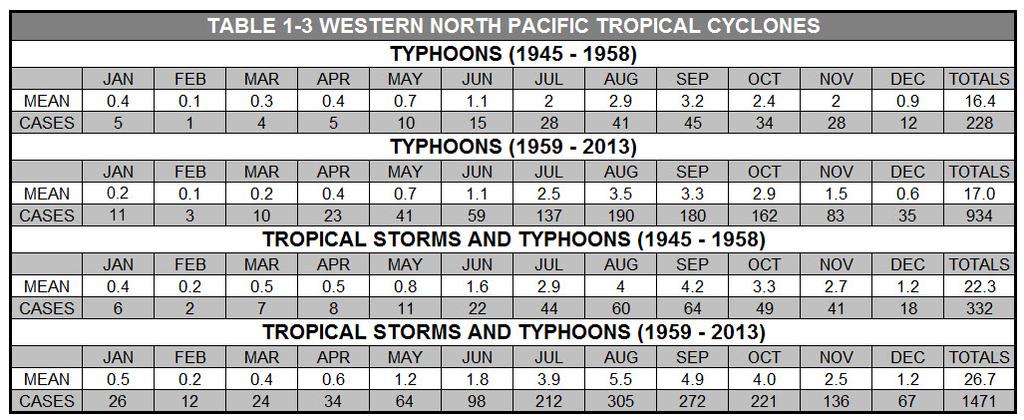
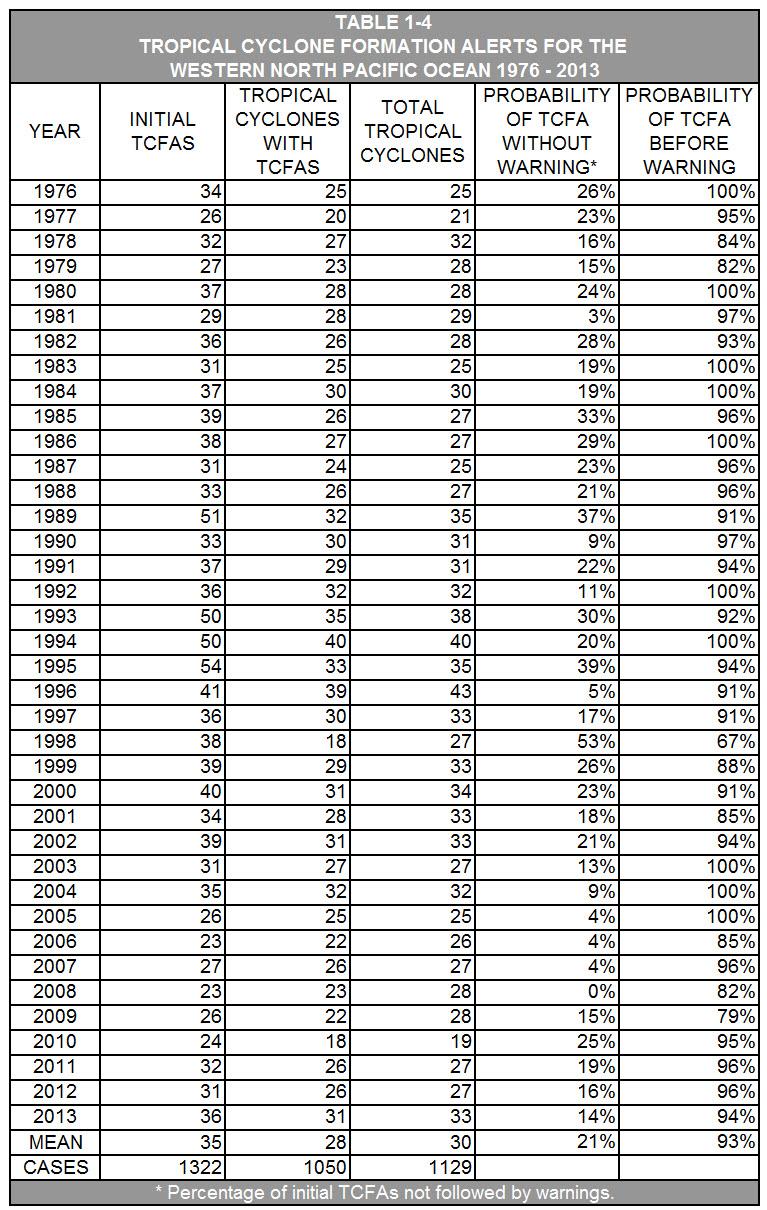
8 Chapter 1 Western North Pacific Ocean Tropical Cyclones Section 1 Informational Tables Table 1-1 is a summary of TC activity in the western North Pacific Ocean during the 2013 season. JTWC issued warnings on 33 cyclones. Table 1-2 shows the monthly distribution of TC activity summarized for and Table 1-3 shows the monthly average occurrence of TC s separated into: (1) typhoons and (2) tropical storms and typhoons. Table 1-4 summarizes Tropical Cyclone Formation Alerts issued. The annual number of TC s of tropical storm strength or higher appears in Figure 1-1, while the number of TC s of super typhoon intensity appears in Figure 1-2. Figure 1-3 illustrates a monthly average number of cyclones based on intensity categories. Figures 1-4 and 1-5 depict the 2013 western North Pacific Ocean TC tracks and intensities. Pg. 8
9 Pg. 9
10 Pg. 10
11 Pg. 11
12 Pg. 12
13 Figure 1-1. Annual number of western North Pacific TCs greater than 34 knots intensity. Figure 1-2. Annual number of western North Pacific TCs greater than 129 knots intensity. Pg. 13
14 Figure 1-3. Average number of western North Pacific TCs (all intensities) by month Pg. 14
 Tokyo.")
15 Figure 1-4. Western North Pacific Tropical Cyclones 01W 33W. Section 2 Cyclone Summaries This section presents a synopsis of each cyclone that occurred during 2013 in the western North Pacific Ocean. Each cyclone is presented, with the number and basin identifier used by JTWC, along with the name assigned by Regional Specialized Meteorological Center (RSMC) Tokyo. Dates are also listed when JTWC first designated various stages of pre-warning development: LOW, MEDIUM, and HIGH (concurrent with TCFA). These classifications are defined as follows: Low formation potential describes an area that is being monitored for development, but is unlikely to develop within the next 24 hours. Medium formation potential describes an area that is being monitored for development and has an elevated potential to develop, but development will likely occur beyond 24 hours. High formation potential describes an area that is being monitored for development and is either expected to develop within 24 hours or development has already started, but warning criteria have not yet been met. All areas designated as High are accompanied by a Tropical Cyclone Formation Alert (TCFA). Initial and final JTWC warning dates are also presented with the number of warnings issued by JTWC. Landfall over major landmasses with approximate locations is presented as well. The JTWC post-event reanalysis best track is also provided for each cyclone. Data included on the best track are position and intensity noted with cyclone symbols and color coded track. Best track position labels include the date-time, track speed in knots, and maximum wind speed in knots. A graph of best track intensity and fix intensity versus time is presented. The fix plots on this graph are color coded by fixing agency. In addition, if this document is viewed as a pdf, each map has been hyperlinked to the appropriate keyhole markup language (kmz) file that will allow the reader to access and view the Pg. 15
16 best-track data interactively on their computer using Google Earth software. Simply hold the control button and click the map image. The link will open, allowing the reader to download and open the file. Users may also retrieve kmz files for the entire season from: Pg. 16

17 01W Tropical Storm Sonamu ISSUED LOW: N/A ISSUED MED: 02 Jan / 1300Z FIRST TCFA: 02 Jan / 2130Z FIRST WARNING: 03 Jan / 1200Z LAST WARNING: 08 Jan / 1800Z MAX INTENSITY: 40 WARNINGS: 22 Pg. 17

18 02W Tropical Depression Shanshan ISSUED LOW: 17 Feb / 0600Z ISSUED MED: 18 Feb / 0600Z FIRST TCFA: 18 Feb / 1700Z FIRST WARNING: 19 Feb / 0000Z LAST WARNING: 21 Feb / 0000Z MAX INTENSITY: 25 WARNINGS: 10 Pg. 18

19 03W Tropical Storm Yagi ISSUED LOW: 06 Jun / 1500Z ISSUED MED: 06 Jun / 2330Z FIRST TCFA: 07 Jun / 2230Z FIRST WARNING: 08 Jun / 1200Z LAST WARNING: 12 Jun / 1200Z MAX INTENSITY: 55 WARNINGS: 17 Pg. 19

20 04W Tropical Storm Leepi ISSUED LOW: 15 Jun / 2000Z ISSUED MED: 16 Jun / 1830Z FIRST TCFA: 16 Jun / 2200Z FIRST WARNING: 17 Jun / 1800Z LAST WARNING: 20 Jun / 1800Z MAX INTENSITY: 35 WARNINGS: 13 Pg. 20

21 05W Tropical Storm Bebinca ISSUED LOW: 18 Jun / 2200Z ISSUED MED: 19 Jun / 1700Z FIRST TCFA: 20 Jun / 0430Z FIRST WARNING: 20 Jun / 1200Z LAST WARNING: 23 Jun / 0600Z MAX INTENSITY: 35 WARNINGS: 12 Pg. 21

22 06W Typhoon Rumbia ISSUED LOW: 27 Jun / 0230Z ISSUED MED: 27Jun / 1400Z FIRST TCFA: 27 Jun /1930Z FIRST WARNING: 28 Jun / 0000Z LAST WARNING: 02 Jul / 0000Z MAX INTENSITY: 70 WARNINGS: 17 Pg. 22

23 07W Typhoon Soulik ISSUED LOW: 06 Jul / 0600Z ISSUED MED: 07 Jul / 0600Z FIRST TCFA: 07 Jul / 1430Z FIRST WARNING: 07 Jul / 2100Z LAST WARNING: 13 Jul / 1200Z MAX INTENSITY: 125 WARNINGS: 24 Pg. 23

24 08W Tropical Storm Cimaron ISSUED LOW: 13 Jul / 0000Z ISSUED MED: 14 Jul / 2200Z FIRST TCFA: 15 Jul / 0600Z FIRST WARNING: 15 Jul / 1800Z LAST WARNING: 18 Jul / 1200Z MAX INTENSITY: 40 WARNINGS: 12 Pg. 24

25 09W Tropical Storm Jebi ISSUED LOW: 26 Jul / 0230Z ISSUED MED: 26 Jul / 0600Z FIRST TCFA: 30 Jul / 1900Z FIRST WARNING: 31 Jul / 0000Z LAST WARNING: 03 Aug / 0600Z MAX INTENSITY: 60 WARNINGS: 14 Pg. 25

26 10W Tropical Storm Mangkhut ISSUED LOW: 02 Aug / 0600Z ISSUED MED: 04 Aug / 0600Z FIRST TCFA: 05 Aug / 0900Z FIRST WARNING: 05 Aug / 1800Z LAST WARNING: 07 Aug / 1800Z MAX INTENSITY: 45 WARNINGS: 9 Pg. 26

27 11W Super Typhoon Utor ISSUED LOW: 08 Aug/ 0600Z ISSUED MED: 08 Aug/ 1200Z FIRST TCFA: 08 Aug / 1630Z FIRST WARNING: 08 Aug/ 1800Z LAST WARNING: 14 Aug / 1200Z MAX INTENSITY: 130 WARNINGS: 24 Pg. 27

28 12W Typhoon Trami ISSUED LOW: 16 Aug / 0200Z ISSUED MED: 16 Aug / 1330Z FIRST TCFA: 16 Aug / 2000Z FIRST WARNING: 17 Aug / 0000Z LAST WARNING: 21 Aug / 1800Z MAX INTENSITY: 75 WARNINGS: 20 Pg. 28

29 13W Tropical Depression ISSUED LOW: 16 Aug / 0200Z ISSUED MED: 16 Aug / 1330Z FIRST TCFA: 16 Aug / 2030Z FIRST WARNING: 17 Aug / 0000Z LAST WARNING: 17 Aug / 1800Z MAX INTENSITY: 30 WARNINGS: 4 Pg. 29

30 14W Tropical Storm Kong-Rey ISSUED LOW: 23 Aug / 0600Z ISSUED MED: 24 Aug / 1500Z FIRST TCFA: 25 Aug / 0130Z FIRST WARNING: 26 Aug / 0000Z LAST WARNING: 31 Aug / 0000Z MAX INTENSITY: 50 WARNINGS: 21 Pg. 30

31 15W Tropical Storm Toraji ISSUED LOW: 31 Aug / 2100Z ISSUED MED: 01 Sep / 0600Z FIRST TCFA: 01 Sep / 0930Z FIRST WARNING: 01 Sep /1200Z LAST WARNING: 04 Sep / 0000Z MAX INTENSITY: 50 WARNINGS: 11 Pg. 31

32 16W Tropical Storm Man-Yi ISSUED LOW: N/A ISSUED MED: 11 Sep / 0130Z FIRST TCFA: 11 Sep / 1400Z FIRST WARNING: 12 Sep / 1800Z LAST WARNING: 16 Sep / 0600Z MAX INTENSITY: 60 WARNINGS: 15 Pg. 32

33 17W Super Typhoon Usagi ISSUED LOW: 15 Sep / 2230Z ISSUED MED: N/A FIRST TCFA: 16 Sep / 0430Z FIRST WARNING: 16 Sep / 1800Z LAST WARNING: 22 Sep / 1200Z MAX INTENSITY: 135 WARNINGS: 24 Pg. 33

34 18W Tropical Depression ISSUED LOW: N/A ISSUED MED: 16 Sep/0600z FIRST TCFA: 17 Sep / 2030Z FIRST WARNING: 18 Sep / 0600Z LAST WARNING: 18 Sep / 1800Z MAX INTENSITY: 25 WARNINGS: 3 Pg. 34

35 19W Typhoon Pabuk ISSUED LOW: 18 Sep / 1000Z ISSUED MED: 18 Sep / 2130Z FIRST TCFA: 19 Sep / 1700Z FIRST WARNING: 21 Sep / 0000Z LAST WARNING: 26 Sep / 0600Z MAX INTENSITY: 90 WARNINGS: 22 Pg. 35

36 20W Typhoon Wutip ISSUED LOW: 25 Sep / 0600Z ISSUED MED: 25 Sep / 2100Z FIRST TCFA: 26 Sep / 0800Z FIRST WARNING: 26 Sep / 1800Z LAST WARNING: 30 Sep / 1200Z MAX INTENSITY: 100 WARNINGS: 16 Pg. 36

37 21W Tropical Storm Sepat ISSUED LOW: 28 Sep / 0600Z ISSUED MED: N/A FIRST TCFA: 29 Sep / 1730Z FIRST WARNING: 30 Sep / 0000Z LAST WARNING: 02 Oct / 0000Z MAX INTENSITY: 40 WARNINGS: 9 Pg. 37

38 22W Typhoon Fitow ISSUED LOW: 26 Sep / 2200Z ISSUED MED: 27 Sep / 0600Z FIRST TCFA: 28 Sep / 2330Z FIRST WARNING: 30 Sep / 0600Z LAST WARNING: 06 Oct / 1800Z MAX INTENSITY: 90 WARNINGS: 27 Pg. 38

39 23W Typhoon Danas ISSUED LOW: 01 Oct/0600Z ISSUED MED: 02 Oct/0600z FIRST TCFA: 02 Oct / 2330Z FIRST WARNING: 03 Oct /1200Z LAST WARNING: 08 Oct /1200Z MAX INTENSITY: 120 WARNINGS: 21 Pg. 39

40 24W Typhoon Nari ISSUED LOW: 08 Oct / 0000Z ISSUED MED: 08 Oct / 0600Z FIRST TCFA: 08 Oct / 0800Z FIRST WARNING: 08 Oct / 1800Z LAST WARNING: 15 Oct / 0000Z MAX INTENSITY: 100 WARNINGS: 26 Pg. 40

41 25W Typhoon Wipha ISSUED LOW: 08 Oct / 0000Z ISSUED MED: 08 Oct / 2300Z FIRST TCFA: 09 Oct / 1000Z FIRST WARNING: 10 Oct / 1200Z LAST WARNING: 15 Oct / 1800Z MAX INTENSITY: 120 WARNINGS: 22 Pg. 41


42 26W Super Typhoon Francisco ISSUED LOW: N/A ISSUED MED: 15 Oct / 0300Z FIRST TCFA: 15 Oct / 2100Z FIRST WARNING: 16 Oct / 0000Z LAST WARNING: 25 Oct / 1800Z MAX INTENSITY: 140 WARNINGS: 40 Pg. 42

43 27W Tropical Depression ISSUED LOW: N/A ISSUED MED: 18 Oct / 1900Z FIRST TCFA: N/A FIRST WARNING: 19 Oct / 0600Z LAST WARNING: 20 Oct / 0600Z MAX INTENSITY: 30 WARNINGS: 5 Pg. 43

44 28W Super Typhoon Lekima ISSUED LOW: 18 Oct/2100Z ISSUED MED: N/A FIRST TCFA: 19 Oct / 2200Z FIRST WARNING: 20 Oct /1200Z LAST WARNING: 26 Oct / 0600Z MAX INTENSITY: 140 WARNINGS: 24 Pg. 44

45 29W Typhoon Krosa ISSUED LOW: 27 Oct / 1100Z ISSUED MED: 27 Oct / 1830Z FIRST TCFA: 28 Oct / 1100Z FIRST WARNING: 29 Oct / 0000Z LAST WARNING: 04 Nov / 0000Z MAX INTENSITY: 105 WARNINGS: 25 Pg. 45


46 30W Tropical Storm ISSUED LOW: 01 Nov / 0100Z ISSUED MED: 03 Nov / 0230Z FIRST TCFA: 03 Nov / 0530Z FIRST WARNING: 03 Nov / 0600Z LAST WARNING: 16 Nov / 0600Z MAX INTENSITY: 35 WARNINGS: 17 Pg. 46

47 31W Super Typhoon Haiyan ISSUED LOW: 02 Nov / 0600Z ISSUED MED: 03 Nov / 0230Z FIRST TCFA: 03 Nov / 0530Z FIRST WARNING: 03 Nov / 0600Z LAST WARNING: 11 Nov / 0000Z MAX INTENSITY: 170 WARNINGS: 32 Pg. 47

48 32W Tropical Depression Podul ISSUED LOW: 09 Nov / 0600Z ISSUED MED: 10 Nov / 0130Z FIRST TCFA: 14 Nov / 1200Z FIRST WARNING: 14 Nov / 1200Z LAST WARNING: 15 Nov / 0000Z MAX INTENSITY: 30 WARNINGS: 3 Pg. 48

49 33W Tropical Depression ISSUED LOW: N/A ISSUED MED: 03 Dec / 0000Z FIRST TCFA: N/A FIRST WARNING: 03 Dec / 1200Z LAST WARNING: 04 Dec / 0000Z MAX INTENSITY: 30 WARNINGS: 3 Pg. 49


50 01C Hurricane Pewa ISSUED LOW: N/A ISSUED MED: N/A FIRST TCFA: 15 Aug /2300Z FIRST WARNING: 16 Aug /1200Z LAST WARNING: 22 Aug / 0000Z MAX INTENSITY: 65 WARNINGS: 23 Pg. 50


51 03C Tropical Depression ISSUED LOW: N/A ISSUED MED: N/A FIRST TCFA: N/A FIRST WARNING: 19 Aug / 1800Z LAST WARNING: 20 Aug / 1800Z MAX INTENSITY: 30 WARNINGS: 5 Pg. 51
52 Section 3 Detailed Cyclone Reviews This section highlights operationally or meteorologically significant cyclones noted within the JTWC AOR. Details are provided to describe operational impacts from tropical cyclones as well as significant challenges and/or shortfalls in the TC warning system. These details are provided to serve as input for future research and development efforts. Typhoon 22W (FITOW) I. Overview Typhoon (TY) 22W (FITOW) formed in the east Philippine Sea in late September The cyclone steadily intensified while tracking poleward toward the East China Sea under the steering influence of a subtropical ridge to the east. TY 22W presented major track forecasting challenges early in its lifecycle. A large degree of track forecast uncertainty arose as dynamic models struggled to accurately represent the passage of a fast-moving, deep mid-latitude shortwave trough to the northwest of the cyclone. Evolution of the mid-latitude flow pattern induced initial weakening of the subtropical steering ridge and a consequent poleward flow pattern between 09/30/06Z and 10/04/00Z. Later, as the aforementioned deep mid-latitude shortwave trough translated quickly northeastward, allowing a building subtropical ridge over the East China Sea and Japan to steer TY 22W west-northwestward. TY 22W highlighted the following forecasting challenges: Properly attributing a large spread in model track forecasts to a track bifurcation scenario rather than simply to high uncertainty within a single forecast track scenario Accurately quantifying the probability that a tropical cyclone will follow a particular track in a bifurcation scenario Selecting the correct track forecast direction/speed in a bifurcation scenario Optimally communicating track forecast uncertainty to customers in bifurcation scenarios The following sections of this case study address the preceding points by highlighting consensus track model forecast performance, available probabilistic guidance including single model ensemble forecasts, and methods applied to identify and communicate track forecast uncertainty for TY 22W. A discussion of procedures that may have improved forecasts and communication of forecast uncertainty in this case, applicable to analogous future cases, follows this analysis. II. Consensus forecast model performance The 2013 JTWC track consensus consisted of global and mesoscale deterministic forecast models and single-model ensemble mean track and intensity forecasts. Consensus model guidance early in the cyclone s lifecycle failed to converge on either a continuous poleward track toward the base of the passing mid-latitude trough or on the west-northwestward track that was eventually observed. Consequently, this large spread in model solutions and abrupt shifts in individual model Pg. 52
, a simple arithmetic average of member model track forecasts, split the two primary model clusters at several forecast times.")
.")
53 guidance from run to run indicated a possible track forecast bifurcation. The JTWC multi-model consensus (CONW), a simple arithmetic average of member model track forecasts, split the two primary model clusters at several forecast times. As a result, CONW track forecasts were unrepresentative of the likely track of TY 22W. Several of the early JTWC forecasts favored the incorrect poleward track grouping. Since CONW split the two track guidance clusters and JTWC chose the poleward cluster, CONW average forecast track errors were lower relative to JTWC (Table 1). The UKMET (EGRI) and NAVGEM (NVGI) models, for which a greater proportion of forecasts correctly predicted a west-northwestward track forecast scenario, had the lowest average extended forecast track errors (FTE) for TY 22W. Figure 1-5: All JTWC track forecasts for TY 22W. Figure 1-6: All CONW track forecasts for TY 22W. Initial JTWC forecast tracks for TY 22W favored a slow poleward track followed by a subtle turn northwestward, but shifted to a faster poleward track into the Yellow Sea at 10/01/06Z (Figure 1-5). After 10/01/18Z, the JTWC forecast track gradually walked westward, lagging coincident westward shifts in CONW (Figure 1-6), toward central eastern China JTWC (96) 185 (142) 392 (234) CONW (90) 121 (137) 260 (214) AVNI (99) 367 (137) 670 (235) EGRI (126) 171 (212) 233 (327) ECMI (117) 286 (187) 567 (290) GFNI (179) 227 (232) 294 (256) NVGI (118) 143 (176) 213 (214) HWFI (103) 194 (149) 350 (208) CTCI (192) 414 (295) 804 (522) JGSI N/A N/A # CASES (76) 4 (48) 4 (29) Table 1-5: Average FTE (nautical miles) for JTWC subjective track forecasts, the 2013 track consensus (CONW), and deterministic models included in CONW (homogeneous comparison) for TY 22W and all 2013 NWPAC cases for forecast taus 72 to 120 in parentheses. Somewhat surprisingly, although GFS maintained the best average FTE of any individual CONW deterministic model over the 2013 NWPAC season, as shown in red in Table 1-5, GFS (AVNI) performed relatively poorly for TY 22W, with the largest Tau 72, Tau 96 and Tau 120 FTE of the deterministic subset, 173 nm, 367 nm and 670 nm, respectively. In contrast and highlighted in green, Pg. 53


54 NAVGEM (NVGI) performed quite well in the extended Taus (119 nm, 143 nm, and 213 nm at Taus 72, 96, and 120, respectively). Figures 1-7 and 1-8 highlight the major differences between track forecasts from the two models during the 10/1/12Z to 10/02/18Z period, just as DoD assets in Okinawa were determining appropriate resource protection actions in preparation for potential impacts from the cyclone. A head-to-head comparison of GFS and NAVGEM forecasts for TY 22W, including an overview of synoptic features related to the noted differences, is provided in the following section of this report = 10/1/12Z 2 = 10/1/18Z 3 = 10/2/00Z 4 = 10/2/06Z 5 = 10/2/12Z 6 = 10/2/18Z 2 1 = 10/1/12Z 2 = 10/1/18Z 3 = 10/2/00Z 4 = 10/2/06Z 5 = 10/2/12Z 6 = 10/2/18Z Figure 1-7: Uninterpolated GFS (AVNO) track forecasts for TY 22W (6-hourly from 10/1/12Z to 10/2/18Z). Figure 1-8: Uninterpolated NAVGEM (NVGM) track forecasts for TY 22W (6-hourly from 10/1/12Z to 10/2/18Z). Inspection of CONW ensemble model mean forecast statistics reveals similar relationships to those noted for the deterministic model subset. The Japanese Typhoon Ensemble Prediction System (TEPS) ensemble mean tracker (JENI), highlighted in green in Table 1-6, provided accurate guidance and verified well (particularly at tau 120) against JTWC and CONW for this system, even though JTWC and CONW outperformed JENI for the 2013 season. In contrast, the GEFS ensemble mean forecast tracker (AEMI), highlighted in red, performed quite poorly compared to JTWC official forecasts and CONW tracks for TY 22W despite competitive performance for the season as a whole. Strong performance of the Japanese ensemble and poor performance of the GFS Ensemble Forecast System (GEFS) ensemble mean (AEMI) are consistent with the relative performance of their parent deterministic models (JGSM and GFS, respectively) in this case. Thus, a mean of singlemodel ensemble solutions did not offer a better alternative to the deterministic forecasts for this case. However, probabilistic guidance derived from individual ensemble members signaled the potential for track bifurcation and associated probabilities for each track scenario. A discussion of probabilistic guidance for TY 22W is provided in Section IV of this report JTWC (99) 190 (142) 398 (218) CONW (96) 145 (138) 356 (219) JENI (167) 129 (214) 104 (236) AEMI (114) 305 (160) 705 (233) #CASES (189) 7 (114) 3 (61) Table 1-6: Average FTE (nautical miles) for JTWC subjective track forecasts, the 2013 track consensus (CONW), and single-model ensemble means included in CONW (homogeneous comparison) for TY 22W and all 2013 NWPAC cases for forecast taus 72 to 120 in parentheses. III. Deterministic forecast guidance: Diagnosis of GFS and NAVGEM steering patterns Pg. 54
55 It is often difficult to identify the root causes of poor model track forecast performance, but it is nonetheless an imperative effort for cases like TY 22W. TY 07W (2008) formed in the same area as TY 22W (2013) and exhibited similar large model forecast errors. As noted by the JTWC Director, Robert Falvey, in his 2009 Tropical Cyclone Conference 2008 Year in Review presentation, 10% of the JTWC 120 hour track error was due to 07W (Falvey 2009). Both systems occurred in a region of US military interests and resulted in significant asset protection efforts that cost DoD multi-millions of dollars as well as the tremendous costs to civilians. These systems have a major impact on operations, and comprise a significant percentage of seasonal forecast track error. Here, we attempt to highlight key differences in the forecast fields between two deterministic models associated with very different forecast tracks and associated forecast track performance for TY 22W. Further numerical investigation is required to verify and explain the trends diagnosed here. An in-depth review of NAVGEM and GFS model fields for the 10/01/12Z to 10/02/18Z period identified major differences in the 500 mb height fields over Eastern China and the East China Sea associated with very different GFS and NAVGEM track forecasts introduced in the previous section of this report. A detailed explanation of the 10/01/12Z model run highlights these differences, and is generally representative of the trend noted in the following model runs through 10/02/18Z. The 10/01/12Z model run, at forecast tau 48, GFS depicts both a deeper, sharper trough (outlined by the 5820m height line in Figures 1-9 and 1-10) over the East China Sea and a wider closed height line around TY 22W than NAVGEM. GFS also predicts an area of cold air advection (CAA) associated with the approaching mid-latitude shortwave trough, while NAVGEM depicts only weak or neutral temperature advection to support the shortwave trough. The deepening trough evident in the GFS model forecasts develops as a strong mid-latitude low that propagates northeastward as a midlatitude ridge builds into Eastern Asia. Given that these factors would otherwise favor eastward translation of the shortwave trough and ridge building to the north of TY 22W, it appears that the noted height falls in GFS-modeled trough may be related to the relatively large forecasted size of the TY 22W, as approximated by the 5880m height line at 500 mb. Figure 1-9: GFS 500mb prognosis from the 10/01/12Z forecast (Tau 48). Figure 1-10: NAVGEM 500mb prognosis from the 10/01/12Z forecast (Tau 48). This apparent interaction between a deeper modeled trough and larger tropical cyclone circulation in the GFS model resulted in the 10/01/12Z forecast prediction of a merging of TY 22W with the shortwave trough s 5820m height field by forecast Tau 72, and a subsequent poleward track (Figure 1-11). In contrast, NAVGEM maintains separation between the shortwave trough and the typhoon circulation, as indicated by the closed, symmetric 5820m height contour around 22W in Figure NAVGEM appears to build the ridge into western Japan, evident as a westward extension of the 5820m height contour associated with the subtropical ridge to the east and an area Pg. 55
.")
56 of warm air advection (WAA) present north of the system. Interestingly, GFS also forecasts WAA and a building ridge over western Japan. However, GFS forecasts an area of CAA to the northwest, which would support simultaneous deepening of the shortwave trough. Figure 1-11: GFS 500mb prognosis from the 10/01/12Z forecast (Tau 72). Figure 1-12: NAVGEM 500mb prognosis from the 10/01/12Z forecast (Tau 72). By forecast Tau 96, both models build the subtropical ridge to the north and east of TY 22W, but the western edge of the ridge extends farther westward across Japan in the NAVGEM forecasts and the tropical cyclone remains embedded within the 5820m height line in the GFS forecast (Figures 1-13 and 1-14). Consequently, TY 22W is predicted to continue poleward in the GFS forecast, while turning northwestward in the NAVGEM forecast. Figure 1-13: GFS 500mb prognosis from the 10/01/12Z forecast (Tau 96). Figure 1-14: NAVGEM 500mb prognosis from the 10/01/12Z forecast (Tau 96). At Tau 120, GFS continues to shift the steering ridge and tropical cyclone poleward, with a very slight north-northwestward track deflection. Major differences in the 500mb height field are noticeable to the northwest of TY 22W. Pg. 56
57 Figure 1-15: GFS 500mb prognosis from the 10/01/12Z forecast (Tau 120). Figure 1-16: NAVGEM 500mb prognosis from the 10/01/12Z forecast (Tau 120). Post analysis reveals several features in the GFS model forecast that hint at potential errors in the predicted poleward track scenario: Deepening of a subtropical shortwave trough while a strong mid-latitude ridge builds to the north is unlikely, especially if it occurs in relatively close proximity to a tropical cyclone, since this deepening may be driven in part by excessive interaction between the shortwave trough and the cyclone. Excessive mid-latitude cyclogenesis appears to be more pronounced in the GFS model and may be, in this case, related to the large cyclone size depicted in the model fields. Identifying these potential model errors in real-time is particularly difficult. In this case, it would have been nearly impossible to rule out the poleward track scenario even if these error mechanisms had been identified. Probabilistic guidance identified a poleward track scenario as significantly more likely than a west-northwestward track, as discussed in the following section. IV. Probabilistic track forecast guidance Probabilistic forecast track guidance indicated a track forecast bifurcation early in TY 22W s life cycle. This guidance generally favored a poleward track with a significant (~30%) probability of an alternative, westward to west-northwestward track. Experimental strike probability graphics based on consensus model guidance illustrate this trend (Figure 1-17). Forecast graphics for 10/01/12Z and 10/01/18Z show two distinct track possibilities (poleward and west-northwestward) with the consensus track average (CONW) splitting the two track scenarios along a track not physically represented by any deterministic model solutions. At 10/02/00Z, the distinction between track scenarios is less obvious, but by the following forecast time (10/02/06Z), the guidance has effectively shifted to favor a west-northwestward track. Pg. 57
, 10/02/00Z (middle left), 10/02/06Z (middle right), 10/02/12Z (bottom left), and 10/02/18Z")


, showed discrete cluster mean forecast tracks associated with the potential poleward and")
58 Pg. 58 Figure 1-17: Experimental consensus model-based strike probability graphic for the 10/01/12Z (top left), 10/01/18Z (top right), 10/02/00Z (middle left), 10/02/06Z (middle right), 10/02/12Z (bottom left), and 10/02/18Z (bottom right) (cumulative probabilities to tau 120). Probabilistic track forecast guidance derived from single-model ensembles provided a consistent representation of the bifurcation scenario for TY 22W. For example, ECMWF ensemble track cluster products, developed at the Naval Postgraduate School (Dr. Russ Elsberry, Dr. Hsiao- Chung Tsai and Ms. Mary Jordan), showed discrete cluster mean forecast tracks associated with the potential poleward and west-northwestward track scenarios. These products group each track forecast from the ECMWF s 51-member ensemble (available through the TIGGE data outlet) into 1 of 6 discrete track clusters derived from ECMWF ensemble five-day forecast tracks from the August
59 2008 to September 2012 period. Each cluster represents a distinct environmental steering scenario and is assigned a probability that the cyclone will follow the path represented by each cluster during the forecast period, based on the percentage of ensemble members (X out of 51 total members) that fall within each cluster (Tsai and Elsberry 2013, Hsiao-Chung Tsai personal communication). Track clusters indicated a potential track bifurcation on 10/1/12Z (Figure 1-18). 19.6% of ensemble track forecasts fell within a west-northwestward track cluster (Cluster 1) at 10/1/12Z, increasing to 29.4% of ensemble members by 10/2/00Z (Figure 1-19). Although poleward track scenario membership was significantly higher than west-northwestward cluster membership at 78.4% to 62.7%, the decreasing number of members in the poleward group suggested an increasingly likely west-northwestward alternate track scenario. By 10/2/12Z (Figure 1-20), track membership for either a west-northwestward or westward track (Cluster 3) increased to a cumulative 37.2% (Figure 1-21). Figure 1-22 summarizes the changes in the poleward and westward cluster membership over this period, highlighting a steady decrease in members favoring the poleward scenario and coincident increase in members favoring a westward scenario during this period. These signals, in conjunction with consensus model guidance, suggested a shift from the poleward to westnorthwestward track scenario, and may have supported more optimal adjustment to the JTWC forecast track and improved communication of forecast uncertainty to customers. This topic is discussed further in the following section. Figure 1-18: ECMWF TC ensemble track clusters from the 10/01/12Z forecast Figure 1-19: ECMWF TC ensemble track clusters for the 10/02/00Z forecast Pg. 59
60 Figure 1-20: ECMWF TC ensemble track clusters for the 10/02/12Z forecast. Figure 1-21: ECMWF TC ensemble track clusters for the 10/03/00Z forecast. Pg. 60
61 Figure 1-22: ECMWF ensemble track forecast cluster analysis probabilities (cluster membership) for the poleward track scenario (cluster 6) toward the Korean peninsula and westward track scenario toward Taiwan (clusters 3 and 1 combined). The data indicate a steady decrease in the probability of the poleward track scenario and coincident increase in the probability of the westward track scenario between 10/01/12Z and 10/05/00Z (image provided by Dr. Hsiao-Chung Tsai). Finally, strike probabilities derived from multiple single-model track forecasts further supported the track bifurcation scenario and subsequent shift of the highest probability scenario to the westnorthwestward trajectory. Figure 1-22 shows the evolution of 168 hour strike probabilities for TY 22W derived from NCEP, Canadian, US Navy, ECMWF, and UKMET single model ensemble track forecasts (courtesy NCEP Environmental Modeling Center). These products show potential tropical cyclone trajectories based on a set of 133 member forecasts (Figure 1-23). Pg. 61
. V.")
.")
62 Figure 1-23: Multiple model ensemble TC strike probability graphics (133 total members) for 10/01/12Z (top left), 10/02/00Z (top right), 10/02/12Z (bottom left), and 10/03/00Z (bottom right) (courtesy NCEP EMC). V. Forecast presentation and discussions JTWC regularly presents forecast track uncertainty to customers via three tropical products in the center s cyclone warning suite: warning graphics, wind probability graphics, and forecast discussions (prognostic reasoning messages for western North Pacific cyclones). Forecast uncertainty presented in both the warning and wind probability products is derived from historical, subjective track forecast errors, with no additional adjustment based on either subjective or objective forecast uncertainty for the current tropical cyclone (JTWC 2014, DeMaria et al 2009). Qualitative, storm-specific track uncertainty is presented in text-based forecast discussions. Within these discussions, forecasters subjectively classify track forecast confidence as either high or low depending on analysis of the synoptic steering environment, predicted storm intensity change, and spread in objective forecast guidance. Track forecast bifurcations, characterized as two potential forecast tracks driven by distinctly different synoptic steering mechanisms, are also presented in these forecast discussions. When a bifurcation scenario is identified, the forecaster typically favors the higher probability grouping for the official forecast track, and presents the second track grouping as an alternate forecast scenario. For TY 22W, forecasters correctly identified and appropriately described the track forecast bifurcation at 10/01/12Z, stating in the associated forecast discussion: Pg. 62
63 MODEL GUIDANCE, INCLUDING ENSEMBLES AND THE MULTI-MODEL CONSENSUS ARE IN POOR AGREEMENT, AS A BIFURCATION HAS DEVELOPED PAST TAU 72. THE WESTERN GROUPING, WHICH INCLUDES NAVGEM, EGRR, JGSM AND GFDN, SHOWS A STRONG STR BUILDING IN, WHICH WOULD TURN THE SYSTEM TOWARDS TAIWAN. THE EASTERN AND MORE POLEWARD GROUP, WHICH INCLUDES ECMWF, GFS, HWRF, AND COAMPS-TC, SHOWS A MORE INTENSE SYSTEM AND A WEAKER STR, WHICH WILL ALLOW FOR A MORE POLEWARD TRACK TOWARDS SOUTHERN JAPAN. THE JTWC FORECAST TRACK IS CLOSE TO MULTI-MODEL CONSENSUS IN THE EARLY TAUS AND FAVORS THE EASTERN GROUPING IN THE EXTENDED TAUS AS THIS GUIDANCE HAS PROVED MORE CONSISTENT. Subsequent discussions correctly diagnosed the track bifurcation until the forecast guidance came into better agreement on a west-northwestward track. Note, however, that no quantitative estimates of track probabilities were provided in any of the forecast discussions. The official track forecast favored the poleward track scenario through 10/02/06Z, finally shifting to the west-northwestward trajectory at subsequent synoptic times. Unfortunately, the JTWC forecast track gradually walked westward, lagging westward shifts in the consensus track, CONW, during this transition period. The slow change in the agency forecast track contributed to larger forecast track errors at extended taus (Table 1-5). In hindsight, a more abrupt shift to the westnorthwestward track scenario would have reduced forecast track errors, but a reliable and repeatable process to determine how and when to dramatically shift between track forecast scenarios was not available at the time. To address this challenge, the following section proposes a pathway to improve applications of probabilistic track forecast data during the warning process and enhance communication of uncertainty to customers in analogous future cases. VI. Probabilistic forecasting: An updated paradigm Optimized procedures to apply probabilistic forecast track data would facilitate quantitative identification of bifurcation scenarios, abrupt adjustment of the forecast track from one likely scenario to another as probabilistic guidance evolves, and accurate presentation of forecast uncertainty to customers throughout a cyclone s lifecycle. Forecasters correctly diagnosed track forecast bifurcation early in the lifecycle of TY 22W and selected the more probable forecast scenario based on deterministic and probabilistic single-model ensemble guidance. However, the quantitative probability of each forecast scenario was neither closely tracked nor described by the forecast team on warning discussion products. New products, such as deterministic model-based strike probabilities and ECMWF ensemble track clusters presented in section IV, make it possible to quantify and track probabilities associated with each of two divergent track scenarios. Further in-house studies will explore the viability of a track forecast probability tracking system that will identify track probability trends and break points that reliably support abrupt forecast track shifts, and explore methods to better present quantitative track probabilities to customers. As mentioned in section V of this report, the area of uncertainty presented on the JTWC warning graphic is based on historical, subjective track forecast errors. More specifically, the area of uncertainty at each forecast tau is equal to the five year running mean JTWC forecast track error plus the forecasted 34-knot wind radius at each forecast tau. Therefore, the area of uncertainty essentially represents the over-water geographic area that may experience 34-knot winds based on the current track and wind field forecast and historic forecast track errors (JTWC 2014). Storm-specific data, such as ensemble-derived strike probability data, are not included in the calculation. Thus, for cases such as TY 22W, the area of uncertainty can be quite unrepresentative of true forecast track uncertainty based on the synoptic environment and available objective guidance (Figure 1-24). Pg. 63

64 Figure 1-24: Left: JTWC warning graphic for TY 22W, 10/01/12Z. Hashing represents 34-kt wind forecast uncertainty area. Right: Experimental consensus model strike probability graphic for TY 22W, 10/01/12Z, with approximate area of uncertainty from warning graphic highlighted in red. The operational area of uncertainty on the warning forecast graphic excludes a significant portion of the westnorthwestward track scenario highlighted in the strike probability graphic. Regional forecast centers, such as the Japanese Meteorological Agency, base graphical track forecast uncertainty on the spread in numerical model forecast track guidance (Kishimoto 2012). A similar approach using consensus model-based guidance (Goerss 2007; Hansen et al 2011) or single-model ensemble forecast probabilities may have provided a better representation of the area of uncertainty for TY 22W. An ideal method would present the area of uncertainty for TY 22W and analogous cases as bimodal. For TY 22W, such a bimodal distribution would present poleward and west-northwestward track uncertainty lobes. More work is needed to determine how to best represent this information for JTWC forecasts, whether through adjustment of the existing operational area of uncertainty or through development of a separate product that highlights objective, modelbased probabilities. Additionally, education and training of the vast JTWC customer base would be necessary to ensure probabilistic uncertainty products are fully understood and correctly applied by military decision makers. VII. References DeMaria, M., J. A. Knaff, R. Knabb, C. Lauer, C. R. Sampson, R. T. DeMaria, 2009: A new method for estimating tropical cyclone wind speed probabilities. Wea. Forecasting, 24, Falvey, R.J., 2009: Joint Typhoon Warning Center 2008: Year in review. Presentation, US Pacific Command Tropical Cyclone Conference, Pearl Harbor, HI. Goerss, J. S., 2007: Prediction of consensus tropical cyclone track forecast error. Mon. Wea. Rev., 135, Hansen, J. A., J. S. Goerss, and C. Sampson, 2011: GPCE-AX: An anisotropic extension to the Goerss Predicted Consensus Error in tropical cyclone track forecasts. Wea. Forecasting, 26, JTWC, cited 2014: Frequently Asked Questions. [Available online at: Pg. 64
65 Kishimoto, K., 2012: JMA s Five-day tropical cyclone track forecast. Tech. Rep., [Available online at: Tsai, H.-C. and R. Elsberry, 2013: Detection of tropical cyclone track changes from the ECMWF ensemble prediction system. Geophys. Res. Lett., 40, , doi: /grl Pg. 65
 31W (Haiyan) was initially analyzed as a tropical disturbance developing within the monsoon trough, just south of Pohnpei, on 02 November 2013.")
66 Super Typhoon 31W (HAIYAN) I. Overview Super Typhoon (STY) 31W (Haiyan) was initially analyzed as a tropical disturbance developing within the monsoon trough, just south of Pohnpei, on 02 November The disturbance consolidated into a single low-level circulation center (LLCC) within 24 hours while tracking westward to the south of Chuuk Atoll. JTWC issued its first warning when the cyclone s maximum sustained wind speed reached 25 knots at 0600Z on 03 November Over the subsequent 48 hour period, STY 31W intensified at an above average rate as it passed well south of Guam, attaining tropical storm intensity (35 knots) around 0000Z on 04 November and typhoon intensity (70 knots) by 0000Z on 05 November. A period of explosive deepening followed, when the intensity increased from 70 knots to 130 knots in 24 hours (0000Z on 05 November to 0000Z on 06 November). Figure 1-25: Best track positions and intensities for STY 31W (Haiyan). The date-time, speed of movement, and intensity are labeled for key locations and times discussed in this report. STY 31W intensified to 135 knots approximately 115 nautical miles south of the island of Yap and to 150 knots as it passed over Kyangel Island, Republic of Palau approximately 12 hours later. The cyclone entered the Philippine Islands near Guian, Eastern Samar before passing over Leyte Island near the municipality of Tolosa at around 0000Z on 08 November Maximum sustained wind speed at landfall was estimated from satellite at 165 knots. The cyclone then moved quickly through the Philippine Islands before reemerging in the South China Sea as a 120 knot cyclone. At 0000Z on 09 November 2013, STY 31W turned poleward and weakened, moving through the Gulf of Tonkin. Just after 1800Z on 10 November 2013, STY 31W made landfall in northeastern Vietnam at typhoon strength (70 knots), and continued to move inland into southern China where it rapidly dissipated due to the frictional effects of land and increasing vertical wind shear (VWS). II. Steering and Intensity Mechanisms A deep-layered and persistent STR centered near Guam and extending west into the South China Sea was the primary steering mechanism for this cyclone. The persistence of this synoptic Pg. 66
: All model consensus (CONW) forecasts for STY 31W. Figure 1-27 (right): All JTWC track forecasts for STY 31W.")

67 feature resulted in the dynamic model track guidance and the JTWC forecasts being in close agreement throughout the life of STY 31W, as indicated in Figures 1-26 and Figure 1-26 (left): All model consensus (CONW) forecasts for STY 31W. Figure 1-27 (right): All JTWC track forecasts for STY 31W. Environmental conditions favored development of a very intense cyclone from the beginning of Haiyan s lifecycle. Warm sea surface temperatures (SSTs) were observed along the entire forecast track. As indicated in Figure 1-28, SSTs exceeded 29 o C along the track from the cyclone s position southeast of Guam to the east coast of the Philippines. Figure 1-28: NOAA/AOML SST map 05 November 2013 overlaid with the STY 31W track. Along-track ocean heat content (OHC) was also very high, indicating that warm water extended fairly deep into the upper-ocean along the cyclone s path. High along-track OHC and STY 31W s relatively rapid translational speed may have allowed the cyclone to avoid the negative intensity influence associated with cool water upwelling. Figure 1-29, below, shows along-track OHC values. Pg. 67
 indicated low vertical wind shear (VWS) and")

68 Figure 1-29: NOAA/AOML OHC map from 05 November 2013 overlaid with the STY 31W track. Satellite-derived upper-level wind field products from the University of Wisconsin Cooperative Institute for Meteorological Satellite Studies (CIMMS) indicated low vertical wind shear (VWS) and strong upper-level diffluence along the track. The CIMMS deep layer shear analysis product from 06 November 2013 at 1200Z (Figure 1-30) indicates 5 to 10 knots of VWS in the vicinity of the storm. Figure 1-30: CIMMS deep layer shear analysis from 06 November 2013 at 1200Z overlaid with the STY 31W track. Upper-level radial outflow developed directly over the LLCC and persisted as the cyclone intensified into a tropical storm by 04 November at 1200Z and rapidly intensified into a typhoon by 05 November at 0000Z (Figure 1-31). Strong radial outflow, low VWS, and warm ocean waters provided favorable conditions for the initial rapid intensification to typhoon strength, and subsequent explosive deepening from minimal typhoon intensity (70 knots) to super typhoon intensity (130 kts) during the following 24 hours. Pg. 68
69 Figure 1-31: CIMMS mid-upper level wind analysis from 06 November 2013 at 1200Z overlaid with the STY 31W track. Following the rapid jump to super typhoon intensity, a more gradual intensification trend was observed. Intensity increased to 150 knots as the system made landfall on Kyangel Island around 1800Z on 06 November Media reports indicated severe flooding on the island and wind speeds nearly matching the best track estimate of 150 knots. [1] After passing over Kyangel Island, STY 31W experienced a final period of intensification, likely due to enhanced outflow from a milibar jet maximum located across the Luzon Strait, to the northwest of the cyclone, as indicated in Figure 1-32A. At 0832Z on 07 November 2013, satellite analysts at JTWC assessed the Dvorak intensity at T8.0, the highest T-number allowed in the Dvorak technique. By 1200Z, all meteorological satellite fixing agencies (JMA, NESDIS, and JTWC) indicated a subjective Dvorak technique analysis of T8.0, prompting JTWC to set the cyclone intensity at 165 knots. Six hours later, the intensity was adjusted upward to 170 knots as STY 31W approached the Philippine archipelago. The current intensity (CI) would remain T8.0 for the next 18 hours, indicating the extreme nature of the cyclone. Two-kilometer resolution infrared (IR) satellite imagery, with BD curve enhancement (Figure 1-32B), shows the structure of STY 31W at the peak Dvorak final T-number with a sharply defined and symmetrical eye, cold-dark grey banding within a well-defined and circular ring of deep convection, and extensive banding feature to the northwest. Pg. 69
: The 2 km storm relative IR imagery with BD enhancement curve from MTSAT-1R at 1430Z on 07 November 2013.")


. Imagery provided by NRL, Monterey.")

70 mb jet maximum Figure 1-32A (left): milibar jet maximum highlighted on CIMMS wind plot from 07 November 2013 at 1800Z with STY 31W track. Figure 1-32B (right): The 2 km storm relative IR imagery with BD enhancement curve from MTSAT-1R at 1430Z on 07 November Microwave satellite imagery highlighted the convective structure of STY 31W as it approached the east coast of the Philippines. Figure 1-33A through-1-33c, below, shows a sequence of 91GHz SSMIS images indicating improving central convective structure as the system moved ashore. Important distinguishing features evident in these images include the dissipation of a very large feeder band in the northwest quadrant, increasing size of the central convective ring surrounding the eyewall, and the contracting, symmetric embedded eye. Figure 1-33: Storm-centered, 91GHz SSMIS microwave imagery of STY 31W prior to landfall from11/07/ Z (Figure 1-33A - left), 11/07/ Z (Figure 1-33B center), and 11/07/ Z (Figure 1-33C right). Imagery provided by NRL, Monterey. STY 31W devastated the Visayan Islands of the Central Philippines, bringing strong winds and storm surge as it made landfall at approximately 07 November at 2230Z on Leyte Island. The Philippine National Disaster Risk Reduction and Management Council [2] reported fatalities of over 6000 people, with greater than 28,000 people injured and over 1700 people missing. Figure 1-34A shows a geostationary infrared image of the eyewall as it moved ashore near the municipality of Tolosa. The cyclone slowly weakened as it tracked across the Philippine Archipelago and moved into the South China Sea (Figure 1-34B) as a 125 knot cyclone, just below super typhoon intensity. Pg. 70

 as it crossed over the Philippine Islands.")

, 09/1219Z (Figure 1-35B center), and 10/1038Z (Figure 1-35C right).")

71 Figure 1-34A (top-left): Storm-relative 1 km geostationary IR imagery from MTSAT-1R at 2230Z on 07 November Figure 1-34B (top-right): Best track (position, time, speed-of movement and intensities) data for STY 31W (Haiyan) as it crossed over the Philippine Islands. Decreasing SSTs and increasing VWS continued the weakening trend as STY 31W turned northwestward towards northern Vietnam. Figure 1-35 shows degradation of the cyclone s eye during this period. Figure 1-35: Storm-centered, 91GHz SSMIS microwave imagery of STY 31W in the South China Sea 08/2158Z (Figure 1-35A - left), 09/1219Z (Figure 1-35B center), and 10/1038Z (Figure 1-35C right). Imagery provided by NRL. STY 31W moved poleward through the Gulf of Tonkin before making landfall in northeastern Vietnam near the Chinese border. The cyclone moved ashore around 2100Z on 10 November 2013 at typhoon intensity and weakened significantly as it curved northeastward into southern China, then dissipated a day later (11 November 2013 at 12Z) as detailed in Figure Pg. 71

72 Figure 1-36: Best track positions and associated intensities for STY 31W (Haiyan) as the cyclone weakened while moving across the South China Sea and dissipated over southern China. Dynamical and statistical-dynamical intensity model guidance indicated significant intensification early in the life of STY 31W, although the predicted intensity change was slower and to a much lower peak intensity than was subsequently observed. Figure 1-37, shows the best track intensities and intensity forecast guidance from dynamical and statistical-dynamical models from the first warning time until 0600Z on 07 November 2013, as STY 31W approached the east coast of the Philippine Islands. A detailed analysis of the synoptic environment led JTWC forecasters to predict intensities above the numerical and statistical dynamical guidance for the most of the Philippine Sea intensification period. However, these JTWC forecasts did not adequately represent the observed explosive rapid intensification. The noted low VWS, extensive upper-level outflow, and high SSTs appear to have been the primary mechanisms for the intensification of STY 31W as it moved through the Philippine Sea. It is thought, however (from post analysis), that the high along-track OHC and noted upper tropospheric jet max near the Luzon Strait provided additional enhancements that allowed this cyclone to reach its maximum intensity. A relatively new intensity forecast guidance, SHIPS-RI [3], did predict high rapid intensification probabilities, well above the basin long-term averages for STY 31W (Figure 1-38) throughout the STY 31W intensification phase. Process improvements to optimally incorporate new skilled intensity forecast guidance (e.g. SHIPS-RI) into the subjective forecast process are being explored at JTWC to improve forecast skill of extreme intensification events as observed in STY 31W. Pg. 72
. Figure 1-38: SHIPS-RI Index rapid intensification probability values for STY 31W.")
73 Figure 1-37: JTWC best track intensity with the interpolated dynamical intensity forecasts and statistical-dynamical intensity forecasts for STY 31W from initial warning to 07/0600Z (best track intensities in black). Figure 1-38: SHIPS-RI Index rapid intensification probability values for STY 31W. JTWC track forecast errors for STY 31W outperformed the JTWC 5-year average errors at all forecast times, including percent improvements for the 96 and 120 hour forecasts. JTWC track forecasts outperformed numerical model consensus guidance by 7-10 percent at all forecast times. Although JTWC intensity forecast errors slightly exceeded the JTWC 5-year average through 72 Pg. 73
74 hours, extended intensity forecasts outperformed forecast averages, including a 37 percent improvement at 120 hours. JTWC intensity forecasts were more accurate than numerical and statistical forecast guidance out to 96 hours, beating guidance by 22 to 34 percent. A final noteworthy characteristic of STY Haiyan was the cyclone s translational speed. The JTWC best track indicates relatively fast forward motion ranging from 15 to 23 knots. Along with the size and intensity of the storm, these rapid track speeds may have contributed to the very unique and devastating storm surge observed as came ashore in the Philippine Islands. Instead of witnessing a gradual rise in sea level and coincident flooding that is often associated with storm surge events, a devastating tsunami-like wave was observed at Tacloban, Leyte. Tsunami-like waves driven by atmospheric phenomena, as observed in this case, are referred to as meteotsunamis [4]. These tsunami-like waves are thought to be induced by traveling air pressure disturbances such as gravity waves, pressure jumps, frontal passages, squalls, or tropical cyclones. III. References "Palau assesses damage after Super Typhoon Haiyan". ABC News. November 7, "SitRep No. 104 Effects of Typhoon "Yolanda" (Haiyan)" (PDF). National Disaster Risk Reduction and Management Council. January 29, Kaplan, J., M. DeMaria, and J.A. Knaff, 2010: A revised tropical cyclone rapid intensification index for the Atlantic and eastern North Pacific basins. Wea. Forecasting, 25, Monserrat, S., I. Vilibíc, and A.B. Rabinovich, Meteotsunamis: atmospherically induced destructive ocean waves in the tsunami frequency band. Natural Hazards and Earth System Sciences, 6, Pg. 74

75 Chapter 2 North Indian Ocean Tropical Cyclones This chapter contains information on north Indian Ocean TC activity during 2013 and the monthly distribution of TC activity summarized for North Indian Ocean tropical cyclone best tracks appear following Table 2-2. Section 1 Informational Tables Table 2-1 is a summary of TC activity in the north Indian Ocean during the 2013 season. Six cyclones occurred in 2013, with four systems reaching an intensity greater than 64 knots. Table 2-2 shows the monthly distribution of Tropical Cyclone activity for Pg. 75

76 Pg. 76

77 Figure 2-1. North Indian Ocean Tropical Cyclones. Section 2 Cyclone Summaries Each cyclone is presented, with the number and basin identifier assigned by JTWC, along with the RSMC assigned cyclone name. Dates are also listed when JTWC first designated Low and Medium 1 stages of development: The first Tropical Cyclone Formation Alert (TCFA) and the initial and final warning dates are also presented with the number of warnings issued by JTWC. Landfall over major landmasses with approximate locations is presented as well. The JTWC post-event reanalysis best track is also provided for each cyclone. Data included on the best track are position and intensity noted with cyclone symbols and color coded track. Best track position labels include the date-time, track speed in knots, and maximum wind speed in knots. A graph of best track intensity versus time is presented. Fix plots on this graph are color coded by fixing agency. In addition, if this document is viewed as a pdf, each map has been hyperlinked to the appropriate keyhole markup language (kmz) file that will allow the reader to access and view the best-track data interactively on their computer using Google Earth software. Simply hold the control button and click the map image; the link will open allowing the reader to download and open the file. Users may also retrieve kmz files for the entire season from: Pg. 77

78 01B Tropical Cyclone Mahasen ISSUED LOW: 07 May / 1800Z ISSUED MED: 08 May / 0230Z FIRST TCFA: 10 May / 0200Z FIRST WARNING: 10 May / 0600Z LAST WARNING: 16 May / 0600Z MAX INTENSITY: 45 WARNINGS: 25 Pg. 78

79 02B Tropical Cyclone Phailin ISSUED LOW: 05 Oct / 1300Z ISSUED MED: 07 Oct / 1800Z FIRST TCFA: 08 Oct / 1000Z FIRST WARNING: 09 Oct / 0000Z LAST WARNING: 12 Oct / 1800Z MAX INTENSITY: 140 WARNINGS: 16 Pg. 78

80 03A Tropical Cyclone ISSUED LOW: 06 Nov / 1000Z ISSUED MED: 08 Nov / 0600Z FIRST TCFA: 08 Nov / 1200Z FIRST WARNING: 08 Nov / 1800Z LAST WARNING: 11 Nov / 0000Z MAX INTENSITY: 45 WARNINGS: 10 Pg. 79

81 04B Tropical Cyclone Helen ISSUED LOW: 18 Nov / 0630Z ISSUED MED: 18 Nov / 1800Z FIRST TCFA: 19 Nov / 0200Z FIRST WARNING: 19 Nov / 1200Z LAST WARNING: 22 Nov / 0600Z MAX INTENSITY: 70 WARNINGS: 12 Pg. 80

82 05B Tropical Cyclone Lehar ISSUED LOW: N/A ISSUED MED: 21 Nov / 1330Z FIRST TCFA: 22 Nov / 0930Z FIRST WARNING: 23 Nov / 0600Z LAST WARNING: 28 Nov / 0600Z MAX INTENSITY: 75 WARNINGS: 21 Pg. 81

83 06B Tropical Cyclone Madi ISSUED LOW: 01 Dec / 1800Z ISSUED MED: 04 Dec / 0830Z FIRST TCFA: 05 Dec / 1500 FIRST WARNING: 06 Dec / 0000Z LAST WARNING: 12 Dec / 0000Z MAX INTENSITY: 85 WARNINGS: 25 Pg. 82
 and the monthly distribution of TC activity summarized for 1975-2013.")
84 Chapter 3 South Pacific and South Indian Ocean Tropical Cyclones This chapter contains information on South Pacific and South Indian Ocean TC activity that occurred during the 2013 tropical cyclone season (1 July June 2013) and the monthly distribution of TC activity summarized for Section 1 Informational Tables Table 3-1 is a summary of TC activity in the Southern Hemisphere during the 2013 season. Pg. 83

85 Table 3-2 provides the monthly distribution of Tropical Cyclone activity summarized for Pg. 84


86 Figure 3-1. Southern Indian Ocean Tropical Cyclones. Figure 3-2. Southeast Pacific Ocean Tropical Cyclones. Pg. 85
87 Section 2 Cyclone Summaries Each cyclone is presented, with the number and basin identifier assigned by JTWC, along with the RSMC assigned cyclone name. Dates are also listed when JTWC first designated various stages of development. The first Tropical Cyclone Formation Alert (TCFA) and the initial and final warning dates are also presented with the number of warnings issued by JTWC. Landfall over major landmasses with approximate locations is presented as well. Data included on the best track are position and intensity noted with cyclone symbols and color coded track. Best track position labels include the date-time, track speed in knots, and maximum wind speed in knots. A graph of best track intensity versus time is presented. Fix plots on this graph are color coded by fixing agency. In addition, if this document is viewed as a pdf, each map has been hyperlinked to the appropriate keyhole markup language (kmz) file that will allow the reader to access and view the best-track data interactively on their computer using Google Earth software. Simply hold the control button and click the map image; the link will open allowing the reader to download and open the file. Users may also retrieve kmz files for the entire season from: Pg. 86

88 01S Tropical Cyclone Anais ISSUED LOW: 11 Oct 1800Z ISSUED MED: 11 Oct 2300Z FIRST TCFA: 12 Oct / 0500Z FIRST WARNING: 12 Oct / 1200Z LAST WARNING: 17 Oct / 1200Z MAX INTENSITY: 115 WARNINGS: 11 Pg. 87

89 02S Tropical Cyclone Boldwin ISSUED LOW: N/A ISSUED MED: 23 Nov 1000Z FIRST TCFA: 24 Nov 0230Z FIRST WARNING: 24 Nov 0600Z LAST WARNING: 25 Nov / 1800Z MAX INTENSITY: 55 WARNINGS: 4 Pg. 88

90 03S Tropical Cyclone Claudia ISSUED LOW: 04 Dec / 0000Z ISSUED MED: 05 Dec / 0600Z FIRST TCFA: 06 Dec / 0230Z FIRST WARNING: 06 Dec / 1200Z LAST WARNING: 13 Dec / 0000Z MAX INTENSITY: 115 WARNINGS: 14 Pg. 89

91 04P Tropical Cyclone Evan ISSUED LOW: 10 Dec / 1000Z ISSUED MED: N/A FIRST TCFA: 11 Dec / 0500Z FIRST WARNING: 11 Dec / 1800Z LAST WARNING: 19 Dec / 1800Z MAX INTENSITY: 125 WARNINGS: 22 Pg. 90

92 05P Tropical Cyclone Freda ISSUED LOW: 26 Dec 1200Z ISSUED MED: 27 Dec 0600Z FIRST TCFA: 27 Dec / 1430Z FIRST WARNING: 28 Dec / 1200Z LAST WARNING: 02 Jan 0000Z MAX INTENSITY: 110 WARNINGS: 10 Pg. 91

93 06S Tropical Cyclone Mitchell ISSUED LOW: 27 Dec / 1330Z ISSUED MED: 28 Dec / 0130Z FIRST TCFA: 28 Dec / 0930Z FIRST WARNING: 28 Dec / 1800Z LAST WARNING: 30 Dec / 0600Z MAX INTENSITY: 45 WARNINGS: 7 Pg. 92

94 07S Tropical Cyclone Dumile ISSUED LOW: 28 Dec /.1030Z ISSUED MED: 28 Dec / 1800Z FIRST TCFA: 30 Dec / 0000Z FIRST WARNING: 31 Dec / 1800Z LAST WARNING: 05 Jan / 0600Z MAX INTENSITY: 75 WARNINGS: 10 Pg. 93

95 08S Tropical Cyclone Narelle ISSUED LOW: N/A ISSUED MED: 05 Jan / 2200Z FIRST TCFA: 07 Jan / 1100Z FIRST WARNING: 07 Jan / 1800Z LAST WARNING: 14 Jan / 1800Z MAX INTENSITY: 120 WARNINGS: 26 Pg. 94

96 09S Tropical Cyclone Emang ISSUED LOW: 28 Dec / 1030Z ISSUED MED: 31 Dec 0300Z FIRST TCFA: 1 Jan / 2330Z FIRST WARNING: 12 Jan 1800Z LAST WARNING: 17 Jan 0600Z MAX INTENSITY: 35 WARNINGS: 10 Pg. 95

97 10P Tropical Cyclone Garry ISSUED LOW: 18 Jan / 0600Z ISSUED MED: 18 Jan /1430Z FIRST TCFA: 19 Jan / 2000Z FIRST WARNING: 20 Jan / 1200Z LAST WARNING: 27 Jan / 0600Z MAX INTENSITY: 85 WARNINGS: 16 Pg. 96

98 11P Tropical Cyclone Oswald ISSUED LOW: 17 Jan / 0200Z ISSUED MED: 20 Jan / 1400Z FIRST TCFA: 21 Jan / 0430Z FIRST WARNING: 21 Jan / 0600Z LAST WARNING: 21 Jan / 1800Z MAX INTENSITY: 45 WARNINGS: 2 Pg. 97

99 12S Tropical Cyclone Peta ISSUED LOW: N/A ISSUED MED: 21 Jan / 1030Z FIRST TCFA: 21 Jan / 2200Z FIRST WARNING: 22 Jan / 1800Z LAST WARNING: 23 Jan / 1200Z MAX INTENSITY: 35 WARNINGS: 4 Pg. 98

100 13S Tropical Cyclone Felleng ISSUED LOW: 25 Jan / 1800Z ISSUED MED: 26 Jan / 0300Z FIRST TCFA: 26 Jan / 0930Z FIRST WARNING: 26 Jan / 1500Z LAST WARNING: 3 Feb / 1800Z MAX INTENSITY: 115 WARNINGS: 18 Pg. 99

101 14P Tropical Cyclone Haley ISSUED LOW: N/A ISSUED MED: 09 Feb / 0600Z FIRST TCFA: 09 Feb / 1000Z FIRST WARNING: 10 Feb / 0000Z LAST WARNING: 11 Feb / 0000Z MAX INTENSITY: 45 WARNINGS: 3 Pg. 100

102 15S Tropical Cyclone Gino ISSUED LOW: 08 Feb / 1500Z ISSUED MED: 09 Feb / 1800Z FIRST TCFA: 10 Feb / 0000Z FIRST WARNING: 11 Feb 0000Z LAST WARNING: 15 Feb 1200Z MAX INTENSITY: 90 WARNINGS: 10 Pg. 101

103 16S Tropical Cyclone Haruna ISSUED LOW: 15 Feb / 0930Z ISSUED MED: 16 Feb / 2300Z FIRST TCFA: 18 Feb / 0130Z FIRST WARNING: 19 Feb / 0000Z LAST WARNING: 25 Feb / 0000Z MAX INTENSITY: 105 WARNINGS: 13 Pg. 102

104 17S Tropical Cyclone Rusty ISSUED LOW: N/A ISSUED MED: 22 Feb / 1800Z FIRST TCFA: 23 Feb / 0300Z FIRST WARNING: 24 Feb / 0000Z LAST WARNING: 27 Feb / 1200Z MAX INTENSITY: 100 WARNINGS: 14 Pg. 103

105 18S Tropical Cyclone ISSUED LOW: N/A ISSUED MED: 22 Feb / 1800Z FIRST TCFA: 24 Feb / 0200Z FIRST WARNING: 24 Feb / 1200Z LAST WARNING: 27 Feb / 0000Z MAX INTENSITY: 40 WARNINGS: 6 Pg. 104

106 19P Tropical Cyclone Sandra ISSUED LOW: N/A ISSUED MED: 05 Mar / 0600Z FIRST TCFA: 06 Mar / 0300Z FIRST WARNING: 07 Mar / 1200Z LAST WARNING: 14 Mar / 0000Z MAX INTENSITY: 110 WARNINGS: 14 Pg. 105

107 20P Tropical Cyclone Tim ISSUED LOW: 10 Mar / 2300Z ISSUED MED: 11 Mar / 1900Z FIRST TCFA: 12 Mar / 2100Z FIRST WARNING: 13 Mar / 1800Z LAST WARNING: 17 Mar / 1800Z MAX INTENSITY: 50 WARNINGS: 9 Pg. 106


108 21S Tropical Cyclone Imelda ISSUED LOW: 03 Apr / 1300Z ISSUED MED: 04 Apr / 1300Z FIRST TCFA: 05 Apr / 1200Z FIRST WARNING: 06 Apr / 0600Z LAST WARNING: 16 Apr / 0600Z MAX INTENSITY: 85 WARNINGS: 21 Pg. 107

109 22S Tropical Cyclone Victoria ISSUED LOW: 07 Apr / 0200Z ISSUED MED: 08 Apr / 1400Z FIRST TCFA: 08 Apr / 2230Z FIRST WARNING: 09 Apr / 0000Z LAST WARNING: 12 Apr / 0000Z MAX INTENSITY: 75 WARNINGS: 7 Pg. 108

110 23P Tropical Cyclone Zane ISSUED LOW: 25 Apr / 0600Z ISSUED MED: 25 Apr / 1000Z FIRST TCFA: 28 Apr / 2230Z FIRST WARNING: 30 Apr / 0000Z LAST WARNING: 01 May / 2100Z MAX INTENSITY: 65 WARNINGS: 5 Pg. 109

111 24S Tropical Cyclone Jamala ISSUED LOW: 04 May / 0200Z ISSUED MED: 06 May / 1230Z FIRST TCFA: 08 May / 0200Z FIRST WARNING: 08 May / 1200Z LAST WARNING: 11 May / 1800Z MAX INTENSITY: 45 WARNINGS: 8 Pg. 110
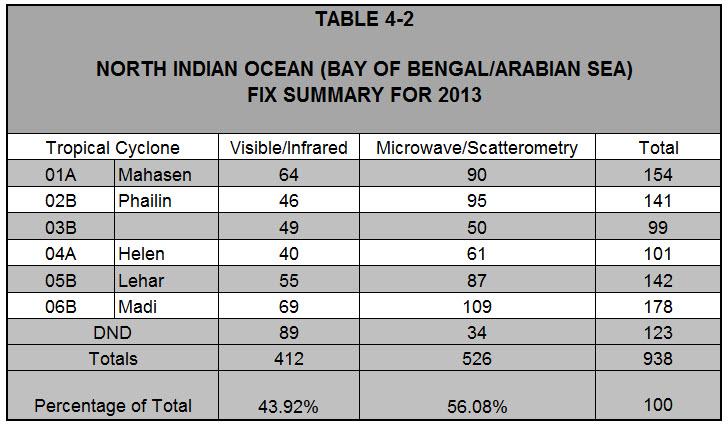
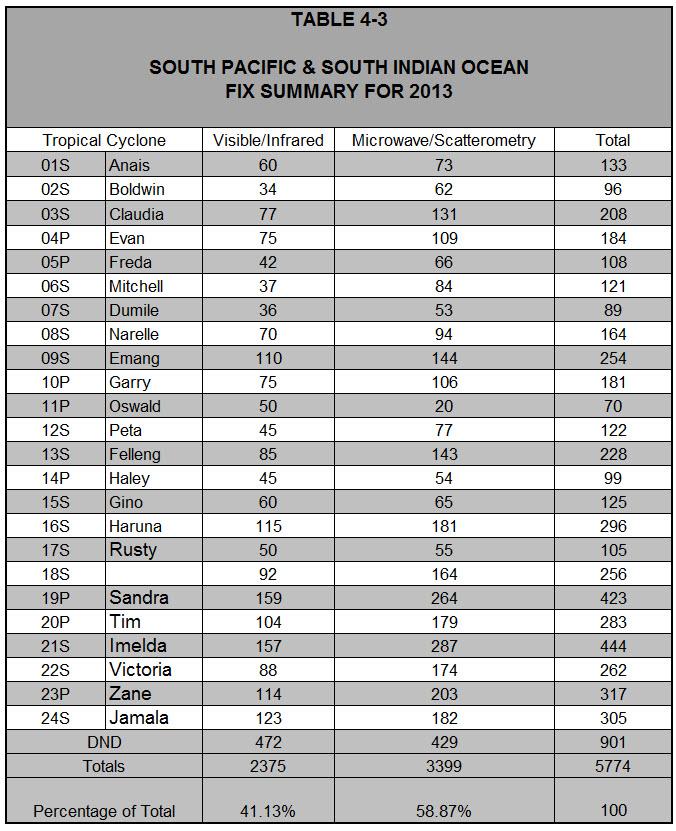
112 Chapter 4 Tropical Cyclone Fix Data Section 1 Background Weather satellite data continued to be the mainstay for the TC reconnaissance mission at JTWC. JTWC satellite analysts produced 11,405 position and intensity estimates. A total of 6,913 of those 11,405 fixes were made using microwave imagery, amounting to over 60 percent of the total number of fixes. The USAF primary weather satellite direct readout system, Mark IVB, and the USN FMQ-17 continued to be invaluable tools in the TC reconnaissance mission. Section 2 tables depict fixes produced by JTWC satellite analysts, stratified by basin and storm number. Following the final numbered storm for each section, is a value representing the number of fixes for invests considered as Did Not Develop (DND) areas. DNDs are areas that were fixed on but did not reach warning criteria. The total count of DND fixes was 1,216 for all basins, which accounts for approximately 10% of all fixes in Pg. 111

113 Section 2 Fix summary by basin Pg. 112
114 Pg. 113
115 Pg. 114
116 Section 3: 2013 Automated Fix Assessment In an effort to assess the utility of automated satellite position and intensity fixes, the JTWC Techniques Development team and Satellite Operations Flight analyzed data from for the western Pacific Ocean and Indian Ocean basins. Subjective Dvorak fix data from PGTW and KNES along with objective Dvorak fix data from Advanced Dvorak Technique (ADT), CIRA AMSU, CIMMS AMSU, and SATCON were compared to JTWC official best track data. Our assessment is that automated fixes have continued to improve over the past three years, and each fix method can be used to aid the JTWC analysis and forecast process. However, due to various errors and biases of each product based on intensity and basin, the application of objective fix data varies for different TC scenarios. Therefore, a process is underway to develop rules of thumb for determining where and when analysts and forecasters can effectively use each objective method. Pg. 115
117 Chapter 5 Techniques Development Summary Section 1: Overview The JTWC Technical Development (Tech Dev) team helps improve TC analyses and forecasts through scientific study, techniques development, information technology exploitation, data evaluation, process improvement and research to operations efforts featured many fruitful, collaborative efforts between the Tech Dev team and supporting researchers, including several recently completed projects: - Mr. Owen Shieh (JTWC US Pacific Command Student Volunteer Intern), Mr. Matt Kucas (Techniques Development Team Chief), Dr. Bin Wang (University of Hawaii) and Dr. Mike Fiorino (Earth Systems Research Laboratory) coauthored and published a case study of the rapid intensification of Typhoon Vicente in the South China Sea. This study showcased the interaction between Typhoon Vicente and an adjacent upper-level low, which coincided with a poleward track stair-step and explosive deepening (Shieh et al. 2013). The findings of this study set the stage for Mr. Shieh s prospective dissertation research, which will quantify relationships between TC intensity and tropical upper-level flow patterns in order to improve real-time prediction of TC intensity change. - Tech Dev coordinated with Air Force Institute of Technology graduate student, 2d Lt Coy Fischer. 2d Lt Fischer successfully completed a Master s thesis entitled Sensitivity of 96 and 120-hour numerical model tropical cyclone position forecasts to initial position errors. 2d Lt Fischer s work related TC position and intensity analysis errors to forecast position errors through tau 120. The findings of this analysis establish a numerical framework to optimize tropical cyclone bogus input and diagnose potential model track forecast errors in an operational setting (Fischer 2014). - Tech Dev facilitated a study correlating tropical cyclone formation probabilities to Dvorak fix analyses conducted by Florida State University graduate student Mr. Josh Cossuth (PhDc) (Poster presentation, 31 st AMS Conference on Hurricanes and Tropical Meteorology). Tech Dev will apply probabilistic relationships established in this study to improve Low/Medium/High invest classification procedures. Additional, ongoing collaborative projects are detailed in the scientific and operational development sections (2 and 3). Section 4 previews future development work. Section 2: 2013 Scientific development projects Operational review of Genesis Potential Index In 2013, Tech Dev began running the 2012 version of the Genesis Potential Index (GPI) model developed by the research team at NRL (Dr. Melinda Peng) and UH (Drs. Tim Li, Bing Fu, and Duane Stevens) in the JTWC development environment in order to continue evaluation for use in operations. The GPI model applies a numerical algorithm to quantify tropical cyclogenesis potential for designated invest areas based on three parameters: 850 mb maximum relative vorticity from the NAVGEM global forecast model, 750 du/dy from the NAVGEM model, and TRMM 3B42RT 3-hourly Pg. 116
 values exceeding a threshold value indicate that TC formation from a designated disturbance is likely to occur within a 24 to 48 hour forecast period, while values below")

118 average rainfall data (Huffman et al. 2007). Genesis potential index (GPI) values exceeding a threshold value indicate that TC formation from a designated disturbance is likely to occur within a 24 to 48 hour forecast period, while values below the threshold indicate that development is unlikely. Six-hourly, near real-time GPI output from the 2012 model, and a time series plot illustrating the evolution of these data, were made available to JTWC forecasters in mixed text and graphical format for designated invests during the 2013 calendar year (Figure 5-1). These data were generated for invests in the western North Pacific, South Pacific, and Indian Oceans. Figure 5-1: GPI model graphics provided to JTWC forecasters for evaluation in near real-time. The graphics provide geographical, numerical, and temporal values of the three parameters included in the 2012 GPI model algorithm. The GPI research team ran an experimental version of the GPI model for designated invest areas from June through September This experimental algorithm applies 800 mb maximum relative vorticity from the NAVGEM global forecast model, mb layer-averaged du/dy from the NAVGEM model, and TMI sea surface temperature (Wentz et al. 2000). Tech Dev evaluated output from both the 2012 GPI model and the experimental version. Near real-time and after-the-fact evaluation again confirmed that GPI trends provide actionable signals of either imminent TC formation or dissipation of non-developing disturbances. Our post-facto analysis indicated a high probability of detecting TC formation (above 90%) in both versions of the GPI model. However, false alarm rates were slightly smaller for the 2012 version. Further improvements to the model routine are anticipated as fruitful collaboration between with the GPI research team and JTWC Tech Dev continues. GPI data from the 2012 GPI model are under consideration for inclusion in JTWC s Low/Medium/High (LMH) TC formation potential classification worksheet (Kucas and Darlow 2012). Additionally, GPI predictions will be incorporated into JTWCs weekly (Wednesday) Global Tropics Hazards Outlook / two-week TC formation overview, which is conducted during the morning forecast discussion (METCON). ECMWF ensemble track clusters Naval Postgraduate School researchers Dr. Russ Elsberry, Dr. Hsiao-Chung Tsai and Ms. Mary Jordan have developed a technique to group similar forecast tracks for western North Pacific (WestPac) tropical cyclones into a set of track clusters. Through statistical analysis of historical WestPac tropical cyclone track forecasts from the 51-member ECMWF ensemble (available through the THORPEX Interactive Grand Global Ensemble, TIGGE), the researchers identified six common Pg. 117

119 tropical cyclone track clusters, illustrated in Figure 5-2. Each cluster is associated with a distinct environmental steering scenario. Figure 5-2: Common historical track clusters for western North Pacific tropical cyclones. Each colored line represents a historical tropical cyclone best track. Colors correspond to six different track clusters, or groups of historical tracks with statistically similar direction and speed. Numbered black lines with open circles indicate the weighted-mean vector motion track for the historical data contained within each cluster (Tsai and Elsberry 2013; image courtesy Dr. Hsiao-Chung Tsai). The NPS research team performs a near real-time cluster analysis of WestPac tropical cyclone track and intensity forecasts from the twice-daily ECMWF ensemble, and provides resultant forecast products to JTWC Tech Dev for evaluation. To generate these products, each of the 51 tropical cyclone track forecasts derived from the ECMWF TIGGE ensemble is assigned to one of the six track clusters shown in Figure 5-3. Weighted-mean vector motion mean (WMVM) track and intensity forecasts are calculated from the data contained within each cluster. These WMVM tracks, and the percentage of ensemble members that fall within each cluster, are presented for each of the top three clusters. Statistical analysis indicates that WMVM tracks derived from clusters that contain 70% or more of the available ensemble track forecast solutions outperform (on average) the WMVM track derived from all available ensemble forecasts. Additionally, the presence of a relatively large percentage of ensemble forecasts within separate track clusters is a potentially useful indicator of alternate track scenarios (Tsai and Elsberry 2013). Tech Dev is collaborating with the NPS research team to determine optimal application of these forecast products to predict tropical track and intensity and alternate forecast scenarios. Additional discussion of these products is provided in the TY 22W case study included in this ATCR. Pg. 118
120 Figure 5-3: ECMWF ensemble track cluster forecasts for TY 22W, 2013 (Fitow) (image courtesy NPS). The top three forecast clusters represented by the ensemble run fall within pre-determined (refer to Figure 5-2) cluster 2 (62.7% of ensemble track forecasts), cluster 1 (29.4% of ensemble track forecasts), and cluster 3 (3.9% of ensemble track forecasts). Ensemble member forecasts that fall within each cluster are shown in light gray (track top, intensity bottom) and the mean track / intensity of forecasts falling within each cluster are shown in color. Situation-Dependent Intensity Prediction (SDIP) Dr. Russ Elsberry and Dr. Hsiao-Chung Tsai (NPS) have developed a method to calculate intensity forecast skill and spread guidance for designated TC tracks based on situation-dependent analogs in the multi-decadal, historical best track dataset. Track and intensity analogs are selected by comparing the time of year, track speed and direction, and initial intensity of the designated TC track with storms in the historical record (Elsberry and Tsai 2014). An experimental method to derive intensity guidance for western North Pacific and southern hemisphere cyclones based on JTWC forecast analogs followed from the initial SDIP study. This Weighted Analog Intensity (WANI) forecast technique (weighted to favor historical tracks that most closely match the current JTWC forecast) is under evaluation for potential operational application at JTWC. An example WANI intensity forecast for TY03W is presented in Figure 5-4. WANI forecasts are also included in experimental intensity forecast range products introduced in the future work section of this report. Pg. 119
121 Figure 5-4: Example WANI intensity guidance graphic for TY 03W (03/02/06Z forecast). Top left: JTWC forecast track (red) and analogous tracks from the historical best track dataset (other colors). Top right: WANI intensity forecast (red), JTWC intensity forecast (black), and analog case intensities. Bottom: WANI (solid red), JTWC (black), and closest matching analog intensity (blue) forecasts with WANI intensity spread based on available analogs (bounded by red dotted lines). Deviation Angle Variance (DAV) technique Evaluation of the DAV technique developed at the University of Arizona (Piñeros et al. 2010; Piñeros et al. 2010) continued in Tech Dev implemented a beta version of the DAV routine for real-time analysis of invest areas with support from the DAV research team, particularly Dr. Oscar Rodriguez. Efforts to improve the technique, such as implementing a DAV area tracker developed at U of A, will continue through Section Operational Development Projects Multi-model track and intensity consensus updates In late June 2013, JTWC modified the official tropical cyclone track consensus (CONW) based on recommendations from NRL-Monterey s (NRL-MRY) annual review of CONW performance. COAMPS-TC run with GFS lateral boundary conditions (CTCX), HWRF, the GFS Ensemble Forecast System (GEFS) ensemble mean (AEMN), and the Japan TC-EPS ensemble mean (JENS) vortex trackers were added to CONW, and the Weber Barotropic Model (WBAR) was removed, producing a Pg. 120
122 CONW with up to ten members. In addition to the four aforementioned models, the full CONW suite includes vortex tracker data from NAVGEM (NVGM), GFDN, GFS (AVNO), ECMWF (ECMF), UKMET model (EGRR), and Japanese Global Spectral Model (JGSM). Numerous model upgrades, including replacement of NOGAPS with the Navy Global Environmental Model (NAVGEM) in March 2013, positively impacted individual consensus member forecasts. A few additional highlights of CONW mesoscale forecast model developments follow: HWRF: NOAA/NWS s Environmental Modeling Center (EMC) provided Hurricane WRF model forecasts for western North Pacific Ocean (WESTPAC) and North Indian Ocean (IO) tropical cyclones throughout 2013, under the auspices of the Hurricane Forecast Improvement Program (HFIP). In early 2014, EMC extended operational HWRF forecasts to Southern Hemisphere (SH) tropical cyclones, providing global coverage. Although HWRF forecasts for JTWC basins rely on HFIP computing resources, the model s reliability, accurate forecast performance and timely delivery of associated vortex track data led JTWC to add HWRF to CONW in Additionally, the 2013 post-season intensity consensus review conducted by NRL-MRY determined that HWRF would also add skill and reduce bias in the intensity consensus, S5YY. As a result, HWRF intensities will be added to S5YY in The HWRF configuration for WESTPAC, IO and SH does not include ocean coupling, but the model is otherwise the same as that used operationally in the Atlantic Basin, with a storm-following inner grid at 3 km horizontal resolution (Tallapragada et al. 2014b). COAMPS-TC: In 2013, FNMOC transitioned the COAMPS-TC model (COTC), initialized with NAVGEM boundary conditions, into operations. NRL Monterey continued to distribute forecast data from the developmental COAMPS-TC model (CTCX), initialized with lateral boundary conditions from GFS. The current configuration of both versions of the COAMPS-TC model features a storm-following inner nest with 5 km horizontal resolution (Doyle et al. 2012). Given the larger sample size available for review, the developmental CTCX vortex tracker was selected for addition to CONW and S5YY in However, both versions of the model were routinely evaluated in daily forecast operations. The 2013 post-season analysis by NRL- Monterey concluded that both versions of the model would have a nearly equivalent impact on the consensus (Buck Sampson, personal communication). Therefore, the 2014 CONW and S5YY will switch to the 24x-7 operational COTC in place of CTCX.. GFDN: The operational GFDN model was upgraded in 2013 to match the 2012 version of the GFDL model. FNMOC runs GFDN for all JTWC basins with NAVGEM initial and boundary conditions, while NCEP runs GFDL for National Hurricane Center forecast basins using the GFS for initial boundary conditions. Both GFDL and GFDN feature a storm-following inner nest at approximately 9 km horizontal resolution. GFDN remains the only three dimensionally ocean-coupled model available to JTWC. A significant resolution and physics upgrade is planned for GFDL in June 2014, and this upgrade will likely be transitioned to the GFDN model by FNMOC later in the year. Retrospective testing for three Atlantic tropical cyclone seasons, encompassing nearly 1,000 cases, revealed an almost 15% improvement in 5-day forecast intensity skill in the prospective upgrade versus the current version of the GFDL model (Bender et al. 2014). JTWC s operational intensity consensus is a blend of statistical and dynamical model intensities computed within ATCF output (Schubert et al. 2012). The 2013 western North Pacific intensity consensus, S5YY, included the Statistical Hurricane Intensity Prediction System (SHIPS) (DeMaria et al. 2005) and the Logistic Growth Equation Model (LGEM) (DeMaria 2008) components, as well as interpolated intensity forecasts from GFDN, COAMPS-TC, and the Coupled Hurricane Intensity Pg. 121
123 Prediction System (CHIPS) (Emanuel et al. 2004). NRL Monterey s annual review of consensus performance indicated that adding SHIPS and LGEM in S5YY resulted in the largest improvement in day-2 and -3 intensity forecast skill in more than a decade (Buck Sampson, personal communication). The operational intensity consensus for Indian Ocean and southern hemisphere cyclones, S5XX, includes STIPS statistical-dynamical model components plus interpolated intensity forecasts from GFDN, COAMPS-TC, and the CHIPS model. JTWC expects S5YY will be available for all basins in 2014 as the SHIPS and LGEM code becomes globally unified (Schumacher et al. 2013). Although JTWC forecast model statistics indicate that, on average, statistical-dynamical intensity prediction methods traditionally provide the most skillful guidance available, HWRF performance in 2013 and retrospective testing of 2014 COAMPS-TC and GFDL models suggest promising improvements to intensity forecast guidance from mesoscale models (Bender et al. 2014; Doyle et. al. 2014; Tallapragada et al. 2014a). JTWC s current version of the SHIPS model uses dynamical input from the NAVGEM and GFS global models. The globalization of SHIPS will allow the model to run with additional global and mesoscale models inputs in 2014 and beyond (K. Musgrave, personal communication), providing future opportunities to improve the intensity consensus. Several other models are under consideration for operational application and potential inclusion in the track and/or intensity forecast consensuses, including: ACCESS-TC: TC forecasts from The Australian Community Climate and Earth-System Simulator (ACCESS-TC) model are provided by the Australian Bureau of Meteorology (ABoM) for systems near Australia and in the WESTPAC. ACCESS-TC is a non-hydrostatic tropical cyclone model nested within the ACCESS-G domain of the Australian Bureau of Meteorology s operational modeling system. ACCESS-TC runs twice daily, at 00Z and 12Z. The model incorporates TC bogus data provided by ABoM forecasters for cyclones near Australia, but runs unbogussed in other basins. Horizontal grid resolution is approximately 12 km. Vortex trackers include both track and intensity forecast data (ABOM 2010). AFWA MEPS: In coordination with Tech Dev, the Air Force Weather Agency implemented an operational tropical cyclone vortex tracker for the Mesoscale Ensemble Prediction System (MEPS) (Hacker et al. 2011). These data include twice-daily tropical cyclone track and intensity forecasts from the 20 km ensemble, and from the 4 km ensemble upon request, for all disturbances and cyclones tracked by JTWC from initial best track time to final warning. This provision of forecast data for up to ten 20 km MEPS ensemble members more than doubled the amount of consistently available track and intensity guidance for pre-formation disturbances. MEPS ensemble forecasts may be included in experimental probabilistic track forecast guidance (see section 4 of this report). In addition, the ensemble mean vortex tracker is under consideration for incorporation into the JTWC multi-model consensus, the center's primary tool for tropical cyclone forecasting, as well as a mesoscale model consensus for intensity forecasting. Preliminary results indicate promising track forecast performance. Efforts to verify MEPS ensemble forecasts and incorporate additional MEPS forecast capabilities into JTWC s Decision Support mission are ongoing. Arpege: Arpege is Météo-France's global modeling system. Tropical cyclone track forecast data from the Arpege model were graciously provided to JTWC through an FTP site hosted by Météo -France as well as via for all cyclones in the La Réunion forecast area-ofresponsibility. Performance during the 2012 and 2013 seasons was promising, and evaluation will continue throughout Pg. 122
124 FIM9: Developed and run by the NOAA Earth Systems Research Laboratory (ESRL), the Flow-following Finite-volume Icosahedral Global Model (FIM), features advanced numerical prediction schemes, an icosahedral horizontal grid, and 64 hybrid theta-sigma vertical levels (Michael Fiorino, personal communication). ESRL provided JTWC vortex tracker data from the FIM9 model (15 km horizontal resolution) for invests and tropical cyclones beginning in Evaluation of FIM9 tropical cyclone forecasts will continue throughout SHIPS-RI Index: NRL and JTWC implemented an experimental version of the SHIPS Rapid Intensification Index (SHIPS-RII) for WESTPAC TCs in This index provides probabilities of 25, 30, 35 or 40 knot intensification during a 24 hour forecast period for active tropical cyclones (Kaplan et al. 2010). The index is generated in ATCF and available for forecaster interrogation during every forecast cycle. TWRF: TWRF is an adaption of the WRF-ARW model tuned specifically for TC rainfall over Taiwan by the Taiwan Central Weather Bureau (CWB). This model has fixed nests of 5 and 15 km horizontal resolution centered over Taiwan and a larger 45 km nest covering the WESTPAC (Hsiao, L.-F. et al. 2012). Although primarily designed to improve TC-related precipitation forecasting, the CWB has provided tropical cyclone vortex trackers from the TWRF 45 km forecast domain to JTWC for evaluation. GIS products and tools JTWC developed and began distributing real-time, KMZ-based Tropical Cyclone Formation Alert (TCFA) and warning products in These products may be downloaded from JTWC s public website and other outlets. Each graphic enables users to display and interrogate forecast data in geospatial display platforms alongside existing datasets. In addition to developing KMZ-based end products, JTWC advanced operational application of geospatial data for analysis and forecasting. The fast ops-tempo at JTWC affords forecasters limited time to access and evaluate the large amount of available tropical cyclone analysis and forecast data. Forecasters have traditionally interrogated static web-based products with no inherent capability for overlay alongside JTWC satellite fixes and best tracks. This year, JTWC forecasters were provided the capability to leverage Google Earth (GE) capabilities to display, overlay, interrogate, and animate data by incorporating real-time satellite fixes, best tracks, forecast aids, and warning products from ATCF with NRL satellite imagery, model output, streamline analyses, scatterometry data, buoy data, observations, radar imagery, CIMSS analyses, SST, and a growing list of additional products. Automated scripts collate and refresh these data every ten minutes, ensuring forecasters can access the most up-to-date information. KML-formatted data, such as files produced by NRL TC Web, NDBC, and CIMSS, can be seamlessly integrated into the JTWC Google Earth toolkit. Use of GE at JTWC will enable forecasters to take full advantage of KML-based analysis and forecast products introduced by these and other agencies in the years ahead. Pg. 123


125 Figure 5-5: JTWC KML toolkit image of TC position fixes, best track, and forecast aids from ATCF overlaid with sample NRL TC Web, CIMSS and NDBC products. JTWC is also producing a KML-based interface to interrogate historical best track data archives. A climatology of over 1,100 individual search criteria displayable in Google Earth has been generated for the WESTPAC, providing easy access to storm information in a customizable graphical format. Similar climatology tools for the Indian Ocean and Southern Hemisphere are under development. Figure 5-6: Example KML-based climatological data display developed at JTWC. Pg. 124
126 Cyclone phase classification and subtropical cyclone analysis (Adapted excerpt from Kucas et al. 2014) Subtropical cyclones present unique challenges to JTWC (Barlow and Payne 2012; Kucas 2010). Analysis and forecasting procedures for subtropical and tropical cyclones can differ significantly. Because US Government partners rely upon JTWC analyses and forecasts to tailor meteorological products for impacted customers, accurately distinguishing subtropical cyclones from tropical and extratropical cyclones is essential. Of course, cyclones located in the subtropics often exhibit welldocumented physical characteristics common to both extratropical and tropical cyclones (OFCM 2013). A universal, subjective analysis method to differentiate these cyclones in ambiguous, realworld situations has not been established by the research community. To address this shortcoming, JTWC developed a cyclone phase classification method that synthesizes available remote sensing datasets and numerical model analysis fields to systematically guide the forecaster through the classification process. This adaptable method reduces the inconsistency that results from a purely subjective approach and provides customers a clear representation of how these classifications are determined. Based on a thorough review of the literature and forecaster experience, the authors generated a list of 13 observable criteria related to cyclone phase for which associated, near real-time data are routinely available: Moisture signature (total precipitable water) Symmetry of the low level circulation center (LLCC) Radius of maximum winds Symmetry of the 850 mb vorticity signature 850 mb maximum vorticity Deep convection structure Size of convective envelope Vertical wind shear Sea surface temperature Baroclinicity Core temperature anomaly LLCC position relative to the 500 mb subtropical ridge axis LLCC position relative to upper low These criteria are included in an initial version of the cyclone phase classification worksheet. Forecasters access the cyclone phase classification worksheet through a PHP-based web-interface hosted on a JTWC computer server. To complete the worksheet, the forecaster enters data into a series of input boxes and drop down menus. After completing the worksheet, the forecaster receives a summary of data entered and is prompted for his or her subjective assessment of the cyclone s phase (tropical, subtropical, or extratropical) along with any relevant notes or comments before he/she clicks the command button Assess Cyclone Phase. The calculated assessment is withheld at this point to facilitate the collection of unbiased, subjective assessments. These assessments will be considered during future adjustments to the worksheet criteria, value bins, and formulas. The final screen provides a summary of the assessment and notes entered by the forecaster along with the final score and assessment according to the worksheet parameters and formulas (Figure 5-7). Pg. 125

127 Figure 5-7: Example final assessment and summary of data provided by the phase classification worksheet. More details are available from Kucas et al. (2014). Tropical cyclone data plots Tech Dev automated the production and dissemination of multiple tropical cyclone decision support data products to the Center s Naval Oceanography Portal and Collaboration websites using original MATLAB and Unix-based scripts (Fig 5-8). This automated process replaces timeconsuming manual product generation procedures, provides flexible data display options and enables efficient and effective presentation of supplemental analysis and forecast data. Pg. 126

128 Figure 5-8: Example intensity forecast graphic for 31W (Haiyan) auto-generated by MATLAB software routines composed by the JTWC Tech Dev team. Electronic streamline analysis The Tech Dev team recommended procurement of digital drawing tablets, composed procedures, and conducted extensive training to facilitate application of this new equipment to analyze streamline charts. These new tools and procedures replaced a resource-intensive process involving printing, hand analysis and scanning of large paper charts. The use of digital technology has cut the time required to hand-draw streamlines by an average of 30 minutes, improved the look and feel of the streamline products, and enabled generation of streamline analysis layers available for overlay in geospatial data display systems such as Google Earth. Figure 5-9 shows an example streamline chart prepared using the new digital analysis method and tools. Pg. 127

129 Figure 5-9: JTWC gradient-level streamline analysis for 0000Z on 20 December 2013 (analyzed by JTWC Geophysical Technician Jack Tracey). Global Tropics Hazards Outlook Tech Dev, in collaboration with NOAA organizations, the Naval Postgraduate School, the University of Albany, the Australia Bureau of Meteorology, and the Taiwan Central Weather Bureau, once again provide input to the week one and two tropical cyclone forecasts produced by NOAA/NWS s Climate Prediction Center s (CPC) weekly Global Tropics Hazards (GTH) Assessment. This assessment, published weekly by Wednesday at 0000Z, is available directly from CPC s GTH website ( and is also accessible from a hyperlink provided on JTWC s public webpage. Section 4 Future work Probabilistic TC track and intensity forecasting techniques Tech Dev is exploring methods to derive practical, probabilistic forecast guidance from newlyavailable intensity forecast products, such as GPCE (Goerss and Sampson 2014) and WANI (Elsberry and Tsai 2014) intensity forecast spreads, and deterministic model track forecasts. Experimental products, including overlapping intensity forecast ranges and tropical cyclone strike probabilities from consensus model track forecasts are currently under evaluation for application as in-house forecasting aids (Figures 5-10 and 5-11). Future work will verify the accuracy of these products and optimize both presentation and interpretability. New methods to interpret and communicate probabilistic forecast data will be explored in depth. See the TY 22W (Fitow) case study included in this ATCR for a summary of current probabilistic track forecasting difficulties, customer communication issues, and plans for future development efforts. Pg. 128

, based on the 0600Z forecast on March 1, 2014.")
130 Figure 5-10: Experimental tropical cyclone track forecast probability product for TS 03W (2014). Shading represents the percent probability that the center of TS 03W, 2014 will fall within 60 nautical miles of shaded locations within 120 hours based on available consensus member track data from the 0600Z forecast on March 1, Figure 5-11: Experimental tropical cyclone intensity forecast range product for TS 03W (2014), based on the 0600Z forecast on March 1, Green shading represents forecast intensity values falling within the WANI, GPCE, and Mean forecast ranges. Areas where these forecast ranges overlap are shaded darker green. Pg. 129
131 Two-week subjective tropical cyclone formation outlooks Tech Dev conducted an in-house effort to subjectively forecast tropical cyclone formation across the JTWC AOR within a two-week prediction window. Pre-invest forecasts, highlighting locations for potential TC formation with associated development timelines and subjectively-derived formation probabilities, were prepared twice per week from June 2013 to present. The current forecast process leverages available numerical model forecast guidance and intra-seasonal climate data from the NOAA/NWS s Climate Prediction Center and other sources, as well as newly-available experimental guidance such as ECMWF 15 and 32-day outlooks provided by NPS (Elsberry et al. 2011) and the NPS long-lead tropical cyclone formation model (Meyer and Murphree 2012). An evaluation of forecast performance and refinement of the prediction technique will be conducted in Preliminary plans to expand this effort include tracking objective and subjective formation probabilities associated with designated pre-invest areas and gathering associated pre-formation track and intensity forecast data. The goal of this effort is to provide forecasters a continuum of preformation forecasts to facilitate issuance of timely and accurate Low/Medium/High invest classifications and initial warnings on newly-developed tropical cyclones. GIS products Following the successful implementation of GIS-enabled TCFA and warning products in 2013, JTWC is developing an experimental, KML-based Significant Tropical Weather Bulletin integrating real-time graphic representations and text-based discussions for all current classified invest areas, TCFAs, and warnings throughout the JTWC AOR in a single Google Earth layer. When opened, the product will automatically update all relevant position, intensity, and status information for all classified areas, providing customers with up-to-date information in one central location. Automated track and intensity analysis Tech Dev will develop automated tropical cyclone track and intensity analysis guidance to expand upon the Automated Tropical Cyclone Forecasting (ATCF) system s objective best track (OBT) routine, developed at the Naval Research Laboratory by Mr. Buck Sampson and Ms. Ann Schrader. This effort will involve a detailed statistical analysis of tropical cyclone position and intensity fix data to build upon the existing OBT technique. References Australian Bureau of Meteorology, 2010: NMOC Operations Bulletin No. 83: Operational Implementation of the ACCESS Numerical Weather Prediction Systems. [Available online at Barlow, S.J., and K. Payne, 2012: Analysis of tropical, extra-tropical, and subtropical cyclones. Unpublished manuscript, 40 pp. Bender, M. A., T. Marchok, M. J. Morin, I. Ginis, B. Thomas, R. Yablonsky, and R. E. Tuleya: Upgrades to the Operational GFDL Model Planned for st Conference on Hurricanes and Tropical Meteorology, 31 March - 4 April 2014, San Diego, CA. Pg. 130
132 DeMaria, M., 2008: A simplified dynamical system for tropical cyclone intensity prediction. Mon. Wea. Rev., 137, DeMaria, M., M. Mainelli, L. K. Shay, J. A. Knaff and J. Kaplan, 2005: Further improvements to the Statistical Hurricane Intensity Prediction Scheme (SHIPS). Wea. Forecasting, 20, Doyle, J.D, R.M. Hodur, J. Moskaitis, S. Chen, E. Hendricks, T. Holt, H. Jin, Y. Jin, P.A. Reinecke, K. Sashegyi, J. Schmidt, and S. Wang, 2014: An Overview of Recent COAMPS-TC Advancements. 31 st Conference on Hurricanes and Tropical Meteorology, 31 March - 4 April 2014, San Diego, CA. Doyle, J.D., R.M. Hodur, S. Chen, J. Cummings, E. Hendricks, T. Holt, H. Jin, Y. Jin, C.S. Liou, J.R. Moskaitis, M.S. Peng, P.A. Reinecke, K. Sashegyi, J. Schmidt, and S. Wang, 2012: Prediction of tropical cyclone intensity and track using COAMPS-TC. 30th Conference on Hurricanes and Tropical Meteorology, April 2012, Ponte Vedra Beach, Florida. Elsberry, R.L. and H.-C. Tsai, 2014: Situation-dependent intensity skill metric and intensity spread guidance for western North Pacific tropical cyclones. Asia-Pac. J. Atmos. Sci., doi: /s Elsberry, R.L., M.S. Jordan, and F. Vitart, 2011: Evaluation of the ECMWF 32-day ensemble predictions during 2009 season of western North Pacific tropical cyclone events on intraseasonal timescales. Asia-Pacific J. Atmos. Sci., 47, Emanuel, K., C. DesAutels, C. Holloway, and R. Korty, 2004: Environmental control of tropical cyclone intensity. J. Atmos. Sci., 61, Fischer, C.C., 2014: Sensitivity of 96 and 120-hour numerical model tropical cyclone position forecasts to initial position errors. M.S. thesis, Department of Engineering, Physics, Air Force Institute of Technology, 77 pp. Fu, B., M.S. Peng, T. Li, and D.E. Stevens, 2012: Developing versus nondeveloping disturbances for tropical cyclone formation. Part II: Western North Pacific. Mon. Wea. Rev., 140, Goerss, J., and C. Sampson, 2014: Prediction of Consensus Tropical Cyclone Intensity Forecast Error. Wea. Forecasting. doi: /waf-d , in press. Gopalakrishnan, S., Q. Liu, T. Marchok, D. Sheinin, V. Tallapragada, M. Tong, R. Tuleya, R. Yablonsky, and X. Zhang, 2012: Hurricane Weather Research and Forecasting (HWRF) Model: 2012 scientific documentation. L. Bernardet, Ed., 96 pp. [Available online at DTCenter.org] Hacker, J.P., S.-Y. Ha, C. Snyder, J. Berner, F.A. Eckel, E. Kuchera, M. Pocernich, S. Rugg, J. Schramm, and X. Wang, 2011: The U.S. Air Force Weather Agency's mesoscale ensemble: Scientific description and performance results. Tellus, 63A, , DOI: /j Hsiao, Ling-Feng, Der-Song Chen, Ying-Hwa Kuo, Yong-Run Guo, Tien-Chiang Yeh, Jing-Shan Hong, Chin-Tzu Fong, Cheng-Shang Lee, 2012: Application of WRF 3DVAR to Operational Pg. 131
133 Typhoon Prediction in Taiwan: Impact of Outer Loop and Partial Cycling Approaches. Wea. Forecasting, 27, Huffman, G.J., R.F. Adler, D.T. Bolvin, G. Gu, E.J. Nelkin, K.P Bowman, Y. Hong, E.F. Stocker, and D.B. Wolff, 2007: The TRMM Multisatellite Precipitation Analysis (TMPA): Quasi-global, multiyear, combined-sensor precipitation estimates at fine scales. J. Hydrometeor., 8, Kaplan, J., M. DeMaria, and J.A. Knaff, 2010: A revised tropical cyclone rapid intensification index for the Atlantic and eastern North Pacific basins. Wea. Forecasting, 25, Kucas, M.E., S.J. Barlow, and R.C. Ballucanag, 2014: Subtropical cyclones: Operational Practices and analysis methods applied at the Joint Typhoon Warning Center. Extended abstracts, 31 st Conference on Hurricanes and Tropical Meteorology, San Diego, CA, Amer. Meteor. Soc., 1-8. Kucas, M.E. and J.W.E. Darlow, 2012: A subjective method for assessing tropical cyclogenesis at the Joint Typhoon Warning Center. Tropical Cyclone Research and Review, 1, Meyer, D. and T. Murphree, 2012: Intraseasonal to seasonal forecasting of tropical cyclone formations: Comparison of model results using both CFSv1 and CFSv2 forcing. Presentation, 37th Climate Prediction and Diagnostics Workshop, Fort Collins, CO, NOAA, [Available online at OFCM, 2013: National Hurricane Operations Plan. Office of the Federal Coordinator for Meteorological Services and Supporting Research Publication FCM-P , 166 pp. [Available online at Peng, M.S., B. Fu, T. Li, and D.E. Stevens, 2012: Developing versus nondeveloping disturbances for tropical cyclone formation. Part I: North Atlantic. Mon. Wea. Rev., 140, Piñeros, M. F., E.A. Ritchie, and J.S. Tyo, 2008: Objective measures of tropical cyclone structure and intensity change from remotely sensed infrared image data. IEEE Trans. Geosci. Remote Sens., 46, Piñeros, M.F., E.A. Ritchie, and J.S. Tyo, 2010: Detecting tropical cyclone genesis from remotely-sensed infrared image data. IEEE Geosci. Remote Sens. Lett., 7, Schumacher, A.S., M. DeMaria, and J. Knaff, 2013: Summary of the New Statistical-Dynamical Intensity Forecast Models for the Indian Ocean and Southern Hemisphere and Resulting Performance. JTWC Project Final Report. Tallapragada, V., C Kieu, S. Trahan, Z Zhang, Q Liu, Y C Kwon, W Wang, M Tong, and B. R Strahl, 2014a: Experimental, real-time forecasts for the 2012 North-Western Pacific basin using the NCEP operational HWRF. Submitted to Wea. Forecasting. Tallapragada, V., S. Trahan, Y. C. Kwon, Z. Zhang, C. Kieu, Q. Liu, W. Wang, M. Tong, D. Sheinin, E. Liu, B. Zhang, S. Gopalakrishnan, X. Zhang, L. R. Bernardet, R. M. Yablonsky, J. W. Bao, R. J. Pasch, J. L. Franklin, D. A. Zelinsky, B. Strahl, W. Lapenta, R. L. Gall, and F. Toepfer, 2014b: Significant advances to the NCEP operational HWRF modelling system for improved hurricane Pg. 132
134 forecasts. 31 st Conference on Hurricanes and Tropical Meteorology, 31 March - 4 April 2014, San Diego, CA. Shieh, O. H., M. Fiorino, M. E. Kucas, and B. Wang, 2013: Extreme rapid intensification of Typhoon Vicente (2012) in the South China Sea. Wea. Forecasting, 28, Shubert, W.H., M. DeMaria, C.R. Sampson, and J. Cummings, 2012: Improving Tropical Cyclone Intensity Forecasting with Theoretically-Based Statistical Models, Year 3 (Final) Report. Department of Atmospheric Science, Colorado State University, 1371 Campus Delivery Fort Collins, CO, 13 pp. Tsai, H.C. and R.L. Elsberry, 2013: Detection of tropical cyclone track changes from the ECMWF ensemble prediction system. Geophys. Res. Lett., 40, , doi: /grl Wentz, F. J., C. L. Gentemann, D. K. Smith, and D. B. Chelton, 2000: Satellite measurements of seasurface temperature through clouds, Science, 288, Pg. 133
135 Chapter 6 Summary of Forecast Verification Verification of warning position and intensities at 24-, 48-, and 72-, 96-, 120-hour forecast periods are made against the final best track. The (scalar) track forecast, along-track and cross track errors (illustrated in Figure 6-1) were calculated for each verifying JTWC forecast. These data are included in this chapter. This section summarizes verification data for the 2013 season, and contrasts it with annual verification statistics from previous years. Figure 6-1. Definition of cross-track error (XTE), along track error (ATE), and forecast track error (FTE). In this example, the forecast position is ahead of and to the right of the verifying best track position. Therefore, the XTE is positive (to the right of track) and the ATE is positive (ahead of the best track). Adapted from Tsui and Miller, Pg. 134

136 Section 1 Annual Forecast Verification Pg. 135


137 Figure 6-2. Graph of JTWC forecast errors and five year running mean errors for the western North Pacific at 24, 48, and 72 hours. Figure 6-3. Graph of JTWC forecast errors and five year running mean errors for the western North Pacific at 96 and 120 hours. Pg. 136

138 Pg. 137

139 Figure 6-4. Graph of JTWC forecast errors and five year running mean errors for the north Indian Ocean at 24, 48, 72, 96, and 120 hours. Pg. 138

140 Pg. 139

141 Figure 6-5. Graph of JTWC forecast errors for the Southern Hemisphere at 24, 48, 72, 96, and 120 hours. Pg. 140

142 Figure 6-6. Graph of JTWC intensity forecast errors for the western North Pacific at 24, 48, 72, 96, and 120 hours. Pg. 141

143 Figure 6-7. Graph of JTWC intensity forecast errors for the North Indian Ocean at 24, 48, 72, 96, and 120 hours. Pg. 142

144 Figure 6-8. Graph of JTWC intensity forecast errors for the Southern Hemisphere at 24, 48, 72, 96, and 120 hours. Pg. 143
2006 Annual Tropical Cyclone Report U.S. Naval Maritime Forecast Center/ Joint Typhoon Warning Center Pearl Harbor, Hawaii
 Annual Tropical Cyclone Report U.S. Naval Maritime Forecast Center/ Joint Typhoon Warning Center Pearl Harbor, Hawaii Composite MODIS true color image from the Aqua satellite of Super Typhoon C (Ioke)
JTWC use of ensemble products. Matthew Kucas Joint Typhoon Warning Center Pearl Harbor, HI
 Matthew Kucas Joint Typhoon Warning Center Pearl Harbor, HI Overview Tropical cyclone track forecasting Deterministic model consensus and single-model ensembles as track forecasting aids Conveying uncertainty
Numerical Prediction of Tropical Cyclones (PAGASA Experience)
") Numerical Prediction of Tropical Cyclones (PAGASA Experience) BONIFACIO G. PAJUELAS Philippine Atmospheric, Geophysical and Astronomical Services Administration (PAGASA) Science Garden, Agham Road, Diliman,
Numerical Prediction of Tropical Cyclones (PAGASA Experience) BONIFACIO G. PAJUELAS Philippine Atmospheric, Geophysical and Astronomical Services Administration (PAGASA) Science Garden, Agham Road, Diliman,
T-PARC and TCS08 (Submitted by Pat Harr, Russell Elsberry and Tetsuo Nakazawa)
") WORLD METEOROLOGICAL ORGANIZATION COMMISSION FOR ATMOSPHERIC SCIENCES INTERNATIONAL CORE STEERING COMMITTEE FOR THORPEX Eighth Session DWD, Offenbach (2 4 November 2009) CAS/ICSC-8/DOC4.1 (3 X.2009) Item:
WORLD METEOROLOGICAL ORGANIZATION COMMISSION FOR ATMOSPHERIC SCIENCES INTERNATIONAL CORE STEERING COMMITTEE FOR THORPEX Eighth Session DWD, Offenbach (2 4 November 2009) CAS/ICSC-8/DOC4.1 (3 X.2009) Item:
Tropical Cyclone Formation/Structure/Motion Studies
 Tropical Cyclone Formation/Structure/Motion Studies Patrick A. Harr Department of Meteorology Naval Postgraduate School Monterey, CA 93943-5114 phone: (831) 656-3787 fax: (831) 656-3061 email: paharr@nps.edu
Annual Report on Activities of the RSMC Tokyo Typhoon Center 2001
 Annual Report on Activities of the RSMC Tokyo Typhoon Center 2001 Japan Meteorological Agency Annual Report 2001 Table of Contents Introduction Page Chapter 1 Operations at the RSMC Tokyo Typhoon Center
Analysis of Fall Transition Season (Sept-Early Dec) Why has the weather been so violent?
 Why has the weather been so violent?") WEATHER TOPICS Analysis of Fall Transition Season (Sept-Early Dec) 2009 Why has the weather been so violent? As can be seen by the following forecast map, the Fall Transition and early Winter Season of
WEATHER TOPICS Analysis of Fall Transition Season (Sept-Early Dec) 2009 Why has the weather been so violent? As can be seen by the following forecast map, the Fall Transition and early Winter Season of
SH RI Events. Influence From Patterns Of Different Scale
 SH072014 RI Events Influence From Patterns Of Different Scale RI Explanation * Rapid intensification, approximately an increase of 2 Dvorak T-numbers or 30 knots in 24 hours, frequently occurs in JTWC
2017 Year in review: JTWC TC Activity, Forecast Challenges, and Developmental Priorities
 2017 Year in review: JTWC TC Activity, Forecast Challenges, and Developmental Priorities Mean Annual TC Activity????????? Hurricane Forecast Improvement Program Annual Review 8-9 NOV 2017 Brian Strahl,
Brian Strahl, JTWC Buck Sampson, NRL-MRY AG2 Jack Tracey, JTWC. Forward, Ready, Responsive Decision Superiority. Joint Typhoon Warning Center
 A Preliminary Evaluation of a Dynamically Sized Swath of Potential Gale Force Winds Using Goerss Predicted Consensus Errors (GPCE) This Brief is Unclassified Brian Strahl, JTWC Buck Sampson, NRL-MRY AG2
A Preliminary Climatology of Extratropical Transitions in the Southwest Indian Ocean
 A Preliminary Climatology of Extratropical Transitions in the Southwest Indian Ocean Kyle S. Griffin Department of Atmospheric and Environmental Sciences, University at Albany, State University of New
2013 ATLANTIC HURRICANE SEASON OUTLOOK. June RMS Cat Response
 2013 ATLANTIC HURRICANE SEASON OUTLOOK June 2013 - RMS Cat Response Season Outlook At the start of the 2013 Atlantic hurricane season, which officially runs from June 1 to November 30, seasonal forecasts
TROPICAL CYCLONE TC 03A FOR THE PERIOD 3 RD JUNE TO 10 TH JUNE, 1998
 TROPICAL CYCLONE TC 03A FOR THE PERIOD 3 RD JUNE TO 10 TH JUNE, 1998 Hazrat Mir, Abdul Rashid, Waqarul Wheed Khan. Introduction: This report gives the review of cyclonic storm formed over the East Arabian
1. Introduction. 2. Verification of the 2010 forecasts. Research Brief 2011/ February 2011
 Research Brief 2011/01 Verification of Forecasts of Tropical Cyclone Activity over the Western North Pacific and Number of Tropical Cyclones Making Landfall in South China and the Korea and Japan region
(April 7, 2010, Wednesday) Tropical Storms & Hurricanes Part 2
 Tropical Storms & Hurricanes Part 2") Lecture #17 (April 7, 2010, Wednesday) Tropical Storms & Hurricanes Part 2 Hurricane Katrina August 2005 All tropical cyclone tracks (1945-2006). Hurricane Formation While moving westward, tropical disturbances
Lecture #17 (April 7, 2010, Wednesday) Tropical Storms & Hurricanes Part 2 Hurricane Katrina August 2005 All tropical cyclone tracks (1945-2006). Hurricane Formation While moving westward, tropical disturbances
A Multi-Model Ensemble for Western North Pacific Tropical Cyclone Intensity Prediction
 DISTRIBUTION STATEMENT A. Approved for public release; distribution is unlimited. A Multi-Model Ensemble for Western North Pacific Tropical Cyclone Intensity Prediction Jonathan R. Moskaitis Naval Research
Verification of the Seasonal Forecast for the 2005/06 Winter
 Verification of the Seasonal Forecast for the 2005/06 Winter Shingo Yamada Tokyo Climate Center Japan Meteorological Agency 2006/11/02 7 th Joint Meeting on EAWM Contents 1. Verification of the Seasonal
A Tropical Cyclone with a Very Large Eye
 JANUARY 1999 PICTURES OF THE MONTH 137 A Tropical Cyclone with a Very Large Eye MARK A. LANDER University of Guam, Mangilao, Guam 9 September 1997 and 2 March 1998 1. Introduction The well-defined eye
7 December 2016 Tokyo Climate Center, Japan Meteorological Agency
 Summary of the 2016 Asian Summer Monsoon 7 December 2016 Tokyo Climate Center, Japan Meteorological Agency This report summarizes the characteristics of the surface climate and atmospheric/oceanographic
11A.1 PREDICTION OF TROPICAL CYCLONE TRACK FORECAST ERROR FOR HURRICANES KATRINA, RITA, AND WILMA
 11A.1 PREDICTION OF TROPICAL CYCLONE TRACK FORECAST ERROR FOR HURRICANES KATRINA, RITA, AND WILMA James S. Goerss* Naval Research Laboratory, Monterey, California 1. INTRODUCTION Consensus tropical cyclone
NHC Ensemble/Probabilistic Guidance Products
 NHC Ensemble/Probabilistic Guidance Products Michael Brennan NOAA/NWS/NCEP/NHC Mark DeMaria NESDIS/STAR HFIP Ensemble Product Development Workshop 21 April 2010 Boulder, CO 1 Current Ensemble/Probability
ATCF: LESSONS LEARNED ON TC CONSENSUS FORECASTING. John Knaff, NOAA/NESDIS and Buck Sampson, NRL, Monterey
 ATCF: LESSONS LEARNED ON TC CONSENSUS FORECASTING John Knaff, NOAA/NESDIS and Buck Sampson, NRL, Monterey Definitions TC tropical cyclone Aid individual model forecast Guidance any method that provides
Current Details from the Joint Typhoon Warning Center
 Current Details from the Joint Warning Center COORDINATES: 19.6 north, 125.5 east (previous location: 17.9 north, 130.3 east) LOCATION: 737 kilometers (458 miles) southeast of Taipei, Taiwan MOVEMENT:
Tropical Cyclone Intensity and Structure Changes due to Upper-Level Outflow and Environmental Interactions
 DISTRIBUTION STATEMENT A. Approved for public release; distribution is unlimited. Tropical Cyclone Intensity and Structure Changes due to Upper-Level Outflow and Environmental Interactions Russell L. Elsberry
Chapter 24 Tropical Cyclones
 Chapter 24 Tropical Cyclones Tropical Weather Systems Tropical disturbance a cluster of thunderstorms about 250 to 600 km in diameter, originating in the tropics or sub-tropics Tropical depression a cluster
PRMS WHITE PAPER 2014 NORTH ATLANTIC HURRICANE SEASON OUTLOOK. June RMS Event Response
 PRMS WHITE PAPER 2014 NORTH ATLANTIC HURRICANE SEASON OUTLOOK June 2014 - RMS Event Response 2014 SEASON OUTLOOK The 2013 North Atlantic hurricane season saw the fewest hurricanes in the Atlantic Basin
SUMMARY OF THE 2011 TYPHOON SEASON
 ECONOMIC AND SOCIAL COMMISSION FOR ASIA AND THE PACIFIC AND WORLD METEOROLOGICAL ORGANIZATION WRD/TC.44/4.1 Add. 2 06 February 2012 Typhoon Committee Forty Fourth Session 06 to 12 February 2012 Hangzhou,
UPDATE OF REGIONAL WEATHER AND SMOKE HAZE (December 2017)
") UPDATE OF REGIONAL WEATHER AND SMOKE HAZE (December 2017) 1. Review of Regional Weather Conditions for November 2017 1.1 In November 2017, Southeast Asia experienced inter-monsoon conditions in the first
UPDATE OF REGIONAL WEATHER AND SMOKE HAZE (December 2017) 1. Review of Regional Weather Conditions for November 2017 1.1 In November 2017, Southeast Asia experienced inter-monsoon conditions in the first
Probabilistic Evaluation of Prediction and Dynamics of Super Typhoon MEGI (2010)
") Probabilistic Evaluation of Prediction and Dynamics of Super Typhoon MEGI (2010) 6 November 2012 Chuanhai Qian 1, Fuqing Zhang 2, Yihong Duan 1 1 China Meteorological Administration 2 Pennsylvania State
Probabilistic Evaluation of Prediction and Dynamics of Super Typhoon MEGI (2010) 6 November 2012 Chuanhai Qian 1, Fuqing Zhang 2, Yihong Duan 1 1 China Meteorological Administration 2 Pennsylvania State
Evolution of Tropical Cyclone Characteristics
 Evolution of Tropical Cyclone Characteristics Patrick A. Harr Department of Meteorology Naval Postgraduate School Monterey, CA 93943-5114 Telephone : (831) 656-3787 FAX: (831) 656-3061 email: paharr@nps.navy.mil
AnuMS 2018 Atlantic Hurricane Season Forecast
 AnuMS 2018 Atlantic Hurricane Season Forecast Issued: May 10, 2018 by Dale C. S. Destin (follow @anumetservice) Director (Ag), Antigua and Barbuda Meteorological Service (ABMS) The *AnuMS (Antigua Met
Government of Sultanate of Oman Public Authority of Civil Aviation Directorate General of Meteorology. National Report To
 Government of Sultanate of Oman Public Authority of Civil Aviation Directorate General of Meteorology National Report To Panel on Tropical Cyclones in the Bay of Bengal And Arabian Sea 43rd Session, India
1. INTRODUCTION: 2. DATA AND METHODOLOGY:
 27th Conference on Hurricanes and Tropical Meteorology, 24-28 April 2006, Monterey, CA 3A.4 SUPERTYPHOON DALE (1996): A REMARKABLE STORM FROM BIRTH THROUGH EXTRATROPICAL TRANSITION TO EXPLOSIVE REINTENSIFICATION
KUALA LUMPUR MONSOON ACTIVITY CENT
 T KUALA LUMPUR MONSOON ACTIVITY CENT 2 ALAYSIAN METEOROLOGICAL http://www.met.gov.my DEPARTMENT MINISTRY OF SCIENCE. TECHNOLOGY AND INNOVATIO Introduction Atmospheric and oceanic conditions over the tropical
Department of Atmospheric Sciences, National Taiwan University, Taipei, Taiwan
 10A.4 TROPICAL CYCLONE FORMATIONS IN THE SOUTH CHINA SEA CHENG-SHANG LEE 1 AND YUNG-LAN LIN* 1, 2 1 Department of Atmospheric Sciences, National Taiwan University, Taipei, Taiwan 2 Taipei Aeronautic Meteorological
1. INTRODUCTION. designed. The primary focus of this strategy was the extratropical transition (ET) of tropical cyclones based on the poleward
 of tropical cyclones based on the poleward") P1.98 THE THORPEX PACIFIC ASIAN REGIONAL CAMPAIGN (T-PARC) OBJECTIVE ON THE EXTRATROPICAL TRANSITION OF TROPICAL CYCLONES: OBSERVED CASES, THEIR STRUCTURE AND DOWNSTREAM IMPACTS P. A. Harr 1, S. C. Jones
P1.98 THE THORPEX PACIFIC ASIAN REGIONAL CAMPAIGN (T-PARC) OBJECTIVE ON THE EXTRATROPICAL TRANSITION OF TROPICAL CYCLONES: OBSERVED CASES, THEIR STRUCTURE AND DOWNSTREAM IMPACTS P. A. Harr 1, S. C. Jones
August Forecast Update for Atlantic Hurricane Activity in 2012
 August Forecast Update for Atlantic Hurricane Activity in 2012 Issued: 6 th August 2012 by Professor Mark Saunders and Dr Adam Lea Dept. of Space and Climate Physics, UCL (University College London), UK
Northeastern United States Snowstorm of 9 February 2017
 Northeastern United States Snowstorm of 9 February 2017 By Richard H. Grumm and Charles Ross National Weather Service State College, PA 1. Overview A strong shortwave produced a stripe of precipitation
AnuMS 2018 Atlantic Hurricane Season Forecast
 AnuMS 2018 Atlantic Hurricane Season Forecast : June 11, 2018 by Dale C. S. Destin (follow @anumetservice) Director (Ag), Antigua and Barbuda Meteorological Service (ABMS) The *AnuMS (Antigua Met Service)
Extratropical transition of tropical cyclones: Operational forecasting challenges. Matthew Kucas Joint Typhoon Warning Center Pearl Harbor, HI, USA
 Extratropical transition of tropical cyclones: Operational forecasting challenges Matthew Kucas Joint Typhoon Warning Center Pearl Harbor, HI, USA Outline Motivation for discussion Brief overview of tropical
Predicting Tropical Cyclone Formation and Structure Change
 Predicting Tropical Cyclone Formation and Structure Change Patrick A. Harr Department of Meteorology Naval Postgraduate School Monterey, CA 93943-5114 phone: (831)656-3787 fax: (831)656-3061 email: paharr@nps.navy.mil
Topic 2: Cyclogenesis, Intensity and Intensity Change
 EIGHTH INTERNATIONAL WORKSHOP ON TROPICAL CYCLONES Topic 2: Cyclogenesis, Intensity and Intensity Change Topic chairs: Elizabeth A. Ritchie (UA) and Chun-Chieh Wu (NTU) Rapporteurs: Anantha Aiyyar (NCSU),
Storm Summary for Hurricane Joaquin
 Storm Summary for Hurricane Joaquin Wednesday, September 30, 2015 at 5 PM EDT (Output from Hurrevac, based on National Hurricane Center Forecast Advisory #12) Joaquin is currently a Category 1 hurricane
Comparative Study of Dvorak Analysis in the western North Pacific. Naohisa Koide and Shuji Nishimura Forecast Division, Japan Meteorological Agency
 Comparative Study of Dvorak Analysis in the western North Pacific Naohisa Koide and Shuji Nishimura Forecast Division, Japan Meteorological Agency 1. Introduction The United Nations Economic and Social
AnuMS 2018 Atlantic Hurricane Season Forecast
 AnuMS 2018 Atlantic Hurricane Season : August 12, 2018 by Dale C. S. Destin (follow @anumetservice) Director (Ag), Antigua and Barbuda Meteorological Service (ABMS) The *AnuMS (Antigua Met Service) is
Comments by William M. Gray (Colorado State University) on the recently published paper in Science by Webster, et al
 on the recently published paper in Science by Webster, et al") Comments by William M. Gray (Colorado State University) on the recently published paper in Science by Webster, et al., titled Changes in tropical cyclone number, duration, and intensity in a warming environment
Comments by William M. Gray (Colorado State University) on the recently published paper in Science by Webster, et al., titled Changes in tropical cyclone number, duration, and intensity in a warming environment
Ensemble Prediction Systems
 Ensemble Prediction Systems Eric Blake National Hurricane Center 7 March 2017 Acknowledgements to Michael Brennan 1 Question 1 What are some current advantages of using single-model ensembles? A. Estimates
TROPICAL CYCLONES, TCS08, T-PARC and YOTC
 TROPICAL CYCLONES, TCS08, T-PARC and YOTC Russell L. Elsberry Graduate School of Engineering and Applied Sciences Department of Meteorology Naval Postgraduate School TCS08: Tropical Cyclone Structure 2008
Reduction of the Radius of Probability Circle. in Typhoon Track Forecast
 Reduction of the Radius of Probability Circle in Typhoon Track Forecast Nobutaka MANNOJI National Typhoon Center, Japan Meteorological Agency Abstract RSMC Tokyo - Typhoon Center of the Japan Meteorological
ESCI 241 Meteorology Lesson 19 Tropical Cyclones Dr. DeCaria
 ESCI 241 Meteorology Lesson 19 Tropical Cyclones Dr. DeCaria READING: Chapter 16 GENERAL A tropical cyclone is a large, low-pressure system that forms over the tropical oceans. Tropical cyclones are classified
AnuMS 2018 Atlantic Hurricane Season Forecast
 AnuMS 2018 Atlantic Hurricane Season Forecast Issued: April 10, 2018 by Dale C. S. Destin (follow @anumetservice) Director (Ag), Antigua and Barbuda Meteorological Service (ABMS) The *AnuMS (Antigua Met
Chapter 24. Tropical Cyclones. Tropical Cyclone Classification 4/19/17
 Chapter 24 Tropical Cyclones Tropical Cyclones Most destructive storms on the planet Originate over tropical waters, but their paths often take them over land and into midlatitudes Names Hurricane (Atlantic
Upgrade of JMA s Typhoon Ensemble Prediction System
 Upgrade of JMA s Typhoon Ensemble Prediction System Masayuki Kyouda Numerical Prediction Division, Japan Meteorological Agency and Masakazu Higaki Office of Marine Prediction, Japan Meteorological Agency
Changes in the Characteristics of Typhoons Crossing the Island of Taiwan
 Calhoun: The NPS Institutional Archive DSpace Repository Faculty and Researchers Faculty and Researchers Collection 1974-10 Changes in the Characteristics of Typhoons Crossing the Island of Taiwan Brand,
Annual Tropical 2014 Cyclone Report 2013
 U.S. Naval Maritime Forecast Center/ Joint Typhoon Warning Center Annual Tropical Pearl Harbor, Cyclone Hawaii Report Annual Tropical 2014 Cyclone Report 2013 STEVEN P. SOPKO Captain, United States Navy
Verification of Tropical Storm Track Prediction in Southeast Asia Using GFS Model
 1 Verification of Tropical Storm Track Prediction in Southeast Asia Using GFS Model Honors Thesis Presented to the College of Agriculture and Life Sciences Department of Earth and Atmospheric Sciences
Predicting Tropical Cyclone Formation and Structure Change
 Predicting Tropical Cyclone Formation and Structure Change Patrick A. Harr Department of Meteorology Naval Postgraduate School Monterey, CA 93943-5114 Telephone: (831)656-3787 FAX:(831)656-3061 email:
The Impact of air-sea interaction on the extratropical transition of tropical cyclones
 The Impact of air-sea interaction on the extratropical transition of tropical cyclones Sarah Jones Institut für Meteorologie und Klimaforschung Universität Karlsruhe / Forschungszentrum Karlsruhe 1. Introduction
Tropical Storm List
 Tropical Storm Email List http://tstorms.org/ tropical-storms@tstorms.org Tropical-Storms is a mailing list only for those who are professionally active in either the research or forecasting of tropical
THE EXTRATROPICAL TRANSITION OF TYPHOON WINNIE (1997): SELF-AMPLIFICATION AFTER LANDFALL
: SELF-AMPLIFICATION AFTER LANDFALL") THE EXTRATROPICAL TRANSITION OF TYPHOON WINNIE (1997): SELF-AMPLIFICATION AFTER LANDFALL Chih-Shin Liu *1,2 and George Tai-Jen Chen 2 1 Weather Forecast Center, Central Weather Bureau, 2 Department of
THE EXTRATROPICAL TRANSITION OF TYPHOON WINNIE (1997): SELF-AMPLIFICATION AFTER LANDFALL Chih-Shin Liu *1,2 and George Tai-Jen Chen 2 1 Weather Forecast Center, Central Weather Bureau, 2 Department of
The Extratropical Transition of Tropical Cyclones
 The Extratropical Transition of Tropical Cyclones Elizabeth A. Ritchie Department of Electrical and Computer Engineering and the Center for High Performance Computing Room 125, EECE Building Albuquerque,
The 2009 Hurricane Season Overview
 The 2009 Hurricane Season Overview Jae-Kyung Schemm Gerry Bell Climate Prediction Center NOAA/ NWS/ NCEP 1 Overview outline 1. Current status for the Atlantic, Eastern Pacific and Western Pacific basins
Table of Contents. Chapter 1 Operations at the RSMC Tokyo - Typhoon Center in 2006
 Annual Report on the Activities of the RSMC Tokyo - Typhoon Center 20 06 TY SAOMAI (0608) 00 UTC, 10 Aug. 2006 Japan Meteorological lagency Table of Contents Introduction Page Chapter 1 Operations at the
The feature of atmospheric circulation in the extremely warm winter 2006/2007
 The feature of atmospheric circulation in the extremely warm winter 2006/2007 Hiroshi Hasegawa 1, Yayoi Harada 1, Hiroshi Nakamigawa 1, Atsushi Goto 1 1 Climate Prediction Division, Japan Meteorological
Ch. 11: Hurricanes. Be able to. Define what hurricane is. Identify the life and death of a hurricane. Identify the ways we track hurricanes.
 Ch. 11: Hurricanes Be able to Define what hurricane is. Identify the life and death of a hurricane. Identify the ways we track hurricanes. What are Hurricanes? Smaller than mid-latitude cyclones. Don t
On African easterly waves that impacted two tropical cyclones in 2004
 GEOPHYSICAL RESEARCH LETTERS, VOL. 33,, doi:10.1029/2006gl026038, 2006 On African easterly waves that impacted two tropical cyclones in 2004 Melinda S. Peng, 1 Bing Fu, 2 Timothy F. Hogan, 1 and Tim Li
Impact of Stochastic Convection on Ensemble Forecasts of Tropical Cyclone Development
 620 M O N T H L Y W E A T H E R R E V I E W VOLUME 139 Impact of Stochastic Convection on Ensemble Forecasts of Tropical Cyclone Development ANDREW SNYDER AND ZHAOXIA PU Department of Atmospheric Sciences,
2008 Annual Tropical Cyclone Report U.S. Naval Maritime Forecast Center/ Joint Typhoon Warning Center Pearl Harbor, Hawaii
 2008 Annual Tropical Cyclone Report U.S. Naval Maritime Forecast Center/ Joint Typhoon Warning Center Pearl Harbor, Hawaii MODIS visible image of Typhoon Rammasun (03W) in the eastern Philippine Sea showing
NW Pacific and Japan Landfalling Typhoons in 2000
 NW Pacific and Japan Landfalling Typhoons in 2000 Pre-Season Forecast Issued 26th May, 2000 Produced under contract for TSUNAMI in collaboration with the UK Met. Office by Drs Paul Rockett, Mark Saunders
Predicting Tropical Cyclone Genesis
 DISTRIBUTION STATEMENT A. Approved for public release; distribution is unlimited. Predicting Tropical Cyclone Genesis PI: Melinda S. Peng Naval Research Laboratory Monterey CA 93943-5502 Phone: (831) 656-4704
UPDATE OF REGIONAL WEATHER AND SMOKE HAZE (September 2017)
") UPDATE OF REGIONAL WEATHER AND SMOKE HAZE (September 2017) 1. Review of Regional Weather Conditions in August 2017 1.1 Southwest Monsoon conditions continued to prevail in the region in August 2017. The
UPDATE OF REGIONAL WEATHER AND SMOKE HAZE (September 2017) 1. Review of Regional Weather Conditions in August 2017 1.1 Southwest Monsoon conditions continued to prevail in the region in August 2017. The
The Role of PAGASA in Disaster Mitigation
 The Role of PAGASA in Disaster Mitigation Christopher F. Perez 2017 ACTS Workshop on Extreme Weather Forecast and Water Resource Management Hanoi, Vietnam September 26-27, 2017 Tropical Storm AMANG(Mekkhala),
2016 Hurricane Season Preview
 2016 Hurricane Season Preview Eric Uhlhorn, Ph.D. 1 2 Recap of 2015 Hurricane Season - El Niño played a significant role in activity - Atlantic activity was slightly below normal 11 named storms, 4 hurricanes,
P4.1 CONSENSUS ESTIMATES OF TROPICAL CYCLONE INTENSITY USING MULTISPECTRAL (IR AND MW) SATELLITE OBSERVATIONS
 SATELLITE OBSERVATIONS") P4.1 CONSENSUS ESTIMATES OF TROPICAL CYCLONE INTENSITY USING MULTISPECTRAL (IR AND MW) SATELLITE OBSERVATIONS Christopher Velden* Derrick C. Herndon and James Kossin University of Wisconsin Cooperative
P4.1 CONSENSUS ESTIMATES OF TROPICAL CYCLONE INTENSITY USING MULTISPECTRAL (IR AND MW) SATELLITE OBSERVATIONS Christopher Velden* Derrick C. Herndon and James Kossin University of Wisconsin Cooperative
11/17/2017. Memorable Hurricanes of 2004 MET 4532
 MET 4532 2004 Hurricane Season Lecture 31 & 32 2004, 2005, and After 17-20 November 2017 1 2 Memorable Hurricanes of 2004 Hurricane Dates Damage (US) Deaths (US) Charlie (4) 9-14 AUG $14B 10 Ivan (4) 2-24
11A.3 The Impact on Tropical Cyclone Predictions of a Major Upgrade to the Met Office Global Model
 11A.3 The Impact on Tropical Cyclone Predictions of a Major Upgrade to the Met Office Global Model Julian T. Heming * Met Office, Exeter, UK 1. BACKGROUND TO MODEL UPGRADE The last major upgrade to the
NOTES AND CORRESPONDENCE. What Has Changed the Proportion of Intense Hurricanes in the Last 30 Years?
 1432 J O U R N A L O F C L I M A T E VOLUME 21 NOTES AND CORRESPONDENCE What Has Changed the Proportion of Intense Hurricanes in the Last 30 Years? LIGUANG WU Laboratory for Atmospheres, NASA Goddard Space
DISTRIBUTION STATEMENT A. Approved for public release; distribution is unlimited.
 DISTRIBUTION STATEMENT A. Approved for public release; distribution is unlimited. The Probabilistic Nature of Extended-Range Predictions of Tropical Cyclone Activity and Tracks as a Factor in Forecasts
Climate Outlook for December 2015 May 2016
 The APEC CLIMATE CENTER Climate Outlook for December 2015 May 2016 BUSAN, 25 November 2015 Synthesis of the latest model forecasts for December 2015 to May 2016 (DJFMAM) at the APEC Climate Center (APCC),
HURRICANE FRANCES CHARACTERISTICS and STORM TIDE EVALUATION
 HURRICANE FRANCES CHARACTERISTICS and STORM TIDE EVALUATION ((DRAFT)) By Robert Wang and Michael Manausa Sponsored by Florida Department of Environmental Protection, Bureau of Beaches and Coastal Systems
Current Details from the Joint Typhoon Warning Center
 Current Details from the Joint Warning Center COORDINATES: 10.2 north, 148.1 east (previous location: 10.1 north, 148.3 east) LOCATION: 520 kilometers (325 miles) southeast of Andersen Air Force Base,
Development of Tropical Storm Falcon (Meari) over the Philippines
 over the Philippines") Development of Tropical Storm Falcon (Meari) over the Philippines June 20-27, 2011 At the end of June, 2011, the Philippines were struck again by Tropical storm Falcon (Meari). After gaining strength over
Development of Tropical Storm Falcon (Meari) over the Philippines June 20-27, 2011 At the end of June, 2011, the Philippines were struck again by Tropical storm Falcon (Meari). After gaining strength over
PATRICK A. HARR. Department of Meteorology, Naval Postgraduate School, Monterey, California
 VOLUME 136 M O N T H L Y W E A T H E R R E V I E W SEPTEMBER 2008 Predictability Associated with the Downstream Impacts of the Extratropical Transition of Tropical Cyclones: Methodology and a Case Study
Overview of the Tropical Cyclone Guidance Project
 Overview of the Tropical Cyclone Guidance Project Dr. Jonathan L. Vigh With thanks to Mahsa Mirzargar (Univ. of Miami) Shanghai Typhoon Institute 09 July 2018 NCAR is sponsored by the National Science
Fernando Prates. Evaluation Section. Slide 1
 Fernando Prates Evaluation Section Slide 1 Objectives Ø Have a better understanding of the Tropical Cyclone Products generated at ECMWF Ø Learn the recent developments in the forecast system and its impact
FORECAST OF ATLANTIC SEASONAL HURRICANE ACTIVITY AND LANDFALL STRIKE PROBABILITY FOR 2015
 FORECAST OF ATLANTIC SEASONAL HURRICANE ACTIVITY AND LANDFALL STRIKE PROBABILITY FOR 2015 We continue to foresee a below-average 2015 Atlantic hurricane season. A moderate to strong El Niño is underway,
Tropical Cyclone Data Impact Studies: Influence of Model Bias and Synthetic Observations
 Tropical Cyclone Data Impact Studies: Influence of Model Bias and Synthetic Observations C. Reynolds, R. Langland and P. Pauley, Naval Research Laboratory, Marine Meteorology Division, Monterey, CA C.
DISTRIBUTION STATEMENT A. Approved for public release; distribution is unlimited.
 DISTRIBUTION STATEMENT A. Approved for public release; distribution is unlimited. The Probabilistic Nature of Extended-Range Predictions of Tropical Cyclone Activity and Tracks as a Factor in Forecasts
Initialization of Tropical Cyclone Structure for Operational Application
 DISTRIBUTION STATEMENT A. Approved for public release; distribution is unlimited. Initialization of Tropical Cyclone Structure for Operational Application PI: Tim Li IPRC/SOEST, University of Hawaii at
Subtropical and Hybrid Systems IWTC VII Topic 1.6
 Subtropical and Hybrid Systems IWTC VII Topic 1.6 John R. Gyakum Department of Atmospheric and Oceanic Sciences McGill University, Montreal Canada Working group: John L. Beven II, Lance F. Bosart, Fermin
MONSOON DISTURBANCES OVER SOUTHEAST AND EAST ASIA AND THE ADJACENT SEAS
 MONSOON DISTURBANCES OVER SOUTHEAST AND EAST ASIA AND THE ADJACENT SEAS LONG TERM GOALS C.-P. Chang Department of Meteorology Naval Postgraduate School, Code MR/Cp Monterey, CA 93943 Telephone 408-656-2840,
The Pressure s On: Increased. Introduction. By Jason Butke Edited by Meagan Phelan
 The Pressure s On: Increased Realism in Tropical Cyclone Wind Speeds through Attention to Environmental Pressure 01.2012 By Jason Butke Introduction Because the Earth has a tilted axis and rotates, the
Typhoon Relocation in CWB WRF
 Typhoon Relocation in CWB WRF L.-F. Hsiao 1, C.-S. Liou 2, Y.-R. Guo 3, D.-S. Chen 1, T.-C. Yeh 1, K.-N. Huang 1, and C. -T. Terng 1 1 Central Weather Bureau, Taiwan 2 Naval Research Laboratory, Monterey,
Lec 10: Interpreting Weather Maps
 Lec 10: Interpreting Weather Maps Case Study: October 2011 Nor easter FIU MET 3502 Synoptic Hurricane Forecasts Genesis: on large scale weather maps or satellite images, look for tropical waves (Africa
On the presence of tropical vortices over the Southeast Asian Sea- Maritime Continent region
 Technical Conference of 50 th Annual Session of Typhoon Committee 2018 On the presence of tropical vortices over the Southeast Asian Sea- Maritime Continent region Nguyen Dang-Quang 1, James Renwick 2,
Recent studies on tropical cyclone landfalling in China
 Recent studies on tropical cyclone landfalling in China Lei Xiaotu Shanghai Typhoon Institute CMA, Shanghai, China email: xtlei@21cn.com 1. Losses caused by tropical cyclones in China China is one of the
Tropical-Extratropical Transition
 Tropical-Extratropical Transition Extratropical Transition A significant number of tropical cyclones move into the midlatitudes and transform into extratropical cyclones. This process is generally referred
JTWC's Use of TRMM in Typhoon Forecast Operations
 Use of TRMM in Typhoon Forecast Operations JTWC's Use of TRMM in Typhoon Forecast Operations Slide 1/24 Use of TRMM in Typhoon Forecast Operations Slide 2/24 Opening Comments The current microwave satellite
UPDATE OF REGIONAL WEATHER AND SMOKE HAZE (May 2017)
") UPDATE OF REGIONAL WEATHER AND SMOKE HAZE (May 2017) 1. Review of Regional Weather Conditions in April 2017 1.1 Inter monsoon conditions, characterised by afternoon showers and winds that are generally
UPDATE OF REGIONAL WEATHER AND SMOKE HAZE (May 2017) 1. Review of Regional Weather Conditions in April 2017 1.1 Inter monsoon conditions, characterised by afternoon showers and winds that are generally
Ensemble Prediction Systems
 Ensemble Prediction Systems Eric S. Blake & Michael J. Brennan National Hurricane Center 8 March 2016 Acknowledgements to Rick Knabb and Jessica Schauer 1 Why Aren t Models Perfect? Atmospheric variables