Wind Resource Assessment in Cold Climate Regions
|
|
|
- Reginald Pearson
- 6 years ago
- Views:
Transcription

1 Faculty of Engineering Science & Technology Institute of Industrial Engineering Wind Resource Assessment in Cold Climate Regions Jiayi Jin Master s thesis in Industrial Engineering 2015, June 2017
2 Title: Wind Resource Assessment in Cold Climate Regions Author: Student no: Subject Name: Department: Master Program: Supervisor: Advisor: Jiayi Jin jji000 Master s Thesis External Organization/Company: Institute of Industrial Technology Industrial Engineering Professor Muhammad Shakeel Virk Dr. Mathew Carl Homola Nordkraft External Organization s/company s Liaison: Norway Date: 1 June, 2017 Classification: Open Number of Pages: 111 Number of Attachments: 0 Subject Code: SHO6266 Keywords (max 10): Cold climate, Atmospheric icing, Wind resource assessment, SCADA data, Analytical, Numerical, CFD, AEP Abstract (max 150 words): Cold climate regions have good potential for wind energy development, but icing on wind turbines is recognized as a hindrance limiting the wind energy production in ice prone regions. This master thesis work is linked with Wind-CoE project of Artic Technology Research Team and is aimed at better understanding of wind resource assessment in cold climate regions. Three years ( ) field SCADA data from Nygårdsfjellet wind park, which is in an ice prone region near Narvik, is used for this study. This work encompasses both analytical and numerical analyses to better estimate the annual energy production (AEP) and study wind flow physics over complex terrain. Computational fluid dynamics based numerical techniques has been used. A good agreement is found between analytical and numerical results.
3 Acknowledgement I would like to take this opportunity to thank a number of people for their assistance and guidance in this master thesis. First, I would like to thank my principle supervisor Professor Muhammad Shakeel Virk who is a humble, moderate, low profile and very knowledgeable person. It has been my pleasure to meet and work with him. I am very grateful for his supervision and good guidance. His passion for energetic research also has a great influence on me, due to which I started to recognize my willingness for doing research and gradually grew fond of academic research. I am very grateful to him for his constant encouragement and helpful comments, which helped me overcome frustration and anxiety. I sincerely thank my advisor Dr. Mathew Carl Homola from Nordkraft AS for providing me all the critical technical support and SCADA data. Moreover, Dr. Mathew Carl Homola introduced me to the useful methods of data classification at the start of SCADA data sorting, which gave me inspiration to make my master thesis better. I would also like to thank Dr. Nikolaos Simisroglou from WindSIM for his technical support regarding WindSIM. Special thanks go for my parents and friends who gave me strong spiritual support. Especially my good friend Dr. Xu Zhang from Brown University, US, gave me very useful suggestions for my master thesis. Jiayi Jin 30 th May, 2017 I
4 Table of Contents 1 Introduction Research need Wind park site description Thesis outline Literature Review Wind energy & ice prone regions Field measurements Met mast design and instrumentation Meteorological data Icing conditions SCADA method Wind resource assessment in cold climate regions Scope of wind resource assessment Numerical methods of wind resource assessment Terrain roughness effects Effects from climate change Design of Experiment Wind park site description Design of experiment Software overview- used for this study Microsoft Access Microsoft Excel MATLAB R2016b WindRose PRO WindSim v SCADA Data Analysis SCADA data sorting Microsoft Access to Excel (.csv) Excel (.csv) to Excel (.xlsx) Microsoft Excel to MATLAB Microsoft Excel to WindRose PRO II
5 4.2 SCADA data analysis Comprehensive analysis Specific analysis Wind rose Annual Energy Production (AEP) Findings Numerical Simulations CFD software- WindSim WindSim Express MS Excel to Notepad CFD simulation Numerical simulation Annual Energy Production (AEP) Findings Conclusions & Future Work Conclusions Future work Planned scientific publication References III
6 List of Tables Table 1-1 Technical details of wind turbines installed at Nygårdsfjellet wind park... 3 Table 2-1 Top 10 targets shows in IEA Task Table 2-2 IEA site classification [6]... 5 Table 2-3 Met mast and instrumentation examples for icing regions [6] Table 2-4 Icing Characteristics... 8 Table 2-5 Icing index classification... 8 Table 2-6 SCADA analysis techniques... 9 Table 2-7 DNV GL methodology Table 2-8 The way to solve the problem under wind assessment Table 2-9 Wind resource assessment estimation Table 2-10 Wind resource assessment estimation Table 2-11 Approaches of microscale analysis Table 2-12 Topography separation [17] Table 2-13 Ireland and the climate change challenge Table 3-1 Software Selection Table 4-1 Location and SCADA data file number for each wind turbine used Table 4-2 Power production & wind speed (R-square) for 3 years data and 14 turbines SCADA data Table 4-3 Average temperature and time series (R-square) for 3 years data and 14 turbines SCADA data Table 4-4 Six relationship comparison for year 2014 (R-square) Table 4-5 Wind rose observations Table years wind power production comparison for 14 turbines Table 5-1 WindSim main input files Table 5-2 Climatology characteristics including average wind speed (m/s) for all sectors, Weibull shape (k) and scale (A) parameters for all sectors Table 5-3 Average wind speed, frequency and Weibull shape (k) & scale (A) parameters versus sectors Wind parks layout and turbines Table 5-4 Wind turbine specifications Table 5-5 Nygårdsfjellet wind park technical specifications Table 5-6 Digital terrain model referring to coordinate system Table 5-7 Grid spacing and cells Table 5-8 Elevation of first 10 nodes in Z direction Table 5-9 Open area data Table 5-10 Solvers settings Table 5-11 Simulation time, number of iterations and convergence status Table 5-12 Nygårdsfjellet wind park annual energy production Table 5-13 Nygårdsfjellet wind park frequency distribution Table 5-14 Nygårdsfjellet wind park 14 turbines annually wind production Table 5-15 SCADA AEP compare with AEP in CFD model IV
7 List of Figures Figure 1-1 Gant Chart... 2 Figure 1-2 Terrain overview of Nygårdsfjellet wind park... 2 Figure 2-1 Cold climate classification [4]... 4 Figure 2-2 Single wind turbine work conditions [12] Figure 2-3 Processing of the scale of wind resource assessment [14] Figure 2-4 Comparison of mean power density [13] Figure 3-1 Nygårdsfjellet wind park during summer and winter periods Figure 3-2 Schematic overview of design of experiment used for this study Figure 4-1 Nygårdsfjellet wind park design layout Figure 4-2 SCADA Data Analysis Structure Figure 4-3 SQL Query structure Figure 4-4 Data table sorting Figure 4-5 Data table sorting Figure 4-6 CSV split Figure 4-7 Import data to MATLAB Figure 4-8 Import Selection & save workspace Figure 4-9 Wind Rose data load Figure 4-10 Intervals Figure 4-11 Title Figure 4-12 Legend Figure 4-13 Type Figure 4-14 Circles Figure 4-15 Different polynomial and linear curve fitting yearly comparison (2014) Figure 4-16 Three years, 7 th polynomial and linear curve fitting comparison ( ) Figure 4-17 Wind Power Production & Wind Average Velocity Figure 4-18 Time & Wind Average Temperature Figure 4-19 Average Wind Velocity & Power Production (2014 whole year 14 turbines) Figure 4-20 Wind Temperature & Time (2014 whole year 14 turbines) Figure 4-21 Power Production & wind velocity Figure 4-22 Wind rose analysis for year 2014 (14 turbines) Figure 4-23 Wind energy production comparison Figure 4-24 Wind energy of each turbines three years comparison Figure 5-1 CFD simulation approach [22] Figure 5-2 WindSim simulation structure Figure 5-3 WindSim modules processing Figure 5-4 Create new project in WindSim Figure 5-5 Properties setup in terrain module Figure 5-6 Properties setup in Wind Fields module Figure 5-7 Climatology object built Figure 5-8 Climatology and 14-transfer climatology objects setup Figure 5-9 Properties setup in Objects module V
8 Figure 5-10 Properties setup in Wind Resources module Figure 5-11 Properties setup in Energy module Figure 5-12 Start WindSim Express Figure 5-13 WindSim project Figure 5-14 Object layout Figure 5-15 Map dataset Figure 5-16 Nygårdsfjellet wind park Figure 5-17 Database in 12 wind directions and 25 different ranges of wind speed Figure 5-18 Choose sum of the data Figure 5-19.wws sub model in Excel Figure 5-20.wws files Figure 5-21 Wind Rose of climatology Figure 5-22 Frequency distribution with Weibull fitting Figure 5-23 Nygårdsfjellet wind park 14 turbines layout Figure 5-24 Google Earth map of Nygårdsfjellet wind park 14 turbines layout Figure 5-25 Turbine characteristics with power and thrust coefficient Figure 5-26 Terrain elevation (m) (left) and roughness (m) (right) Figure 5-27 Terrain inclination (deg) (left) and logarithmic roughness (m) (right) Figure 5-28 Horizontal grid resolution (left) and schematic view of the vertical grid resolution (right) Figure D model open area Figure 5-30 Wind resource map Figure 5-31 AEP comparison between SCADA and CFD VI
9 1 Introduction 1.1 Research need Low temperature and icing prone regions are not most common areas for wind turbines installation, despite the fact of having good wind resources. Cold regions have good potential for wind energy development, but icing on wind turbines is recognize as a hindrance limiting the wind energy production at elevated cold climate sites in Scandinavia as well as the Alpine regions of Europe. Heavy icing regions, where icing has a major impact on wind turbine performance and annual energy production contains 4% of installed wind turbines worldwide. The wind based electricity production in moderate to heavy icing regions is expected to grow from 11.5 GW at the end of 2012 to 19.5 GW by 2017 [1]. Therefore, improved estimation of icing related power production losses is much needed both for the proper operation of new wind parks and to provide more accurate wind energy production forecasts [2]. Ice accretion on wind turbines can lead to a number of problems including health and safety risk from ice throw, increased fatigue on the wind turbine components from increased mass and potential imbalance, reduced power production due to changes in blade aerodynamics and complete shutdown of turbine. Due to these risks and their economic consequences, it is important to be able to better forecast, both through real-time and with retrospective analysis, how and when ice will accrete on wind turbines and what will be its effects. The International Energy Agency (IEA) Annex 19: 'Wind energy in cold climates, also calls for finding methods to better estimate the effects of ice accretion on wind turbine performance and resultant wind energy production. No standard methodologies are yet available for the reliable wind resources and icing condition assessment for the cold climate regions. The complexity of wind resource assessment in cold climate regions varies greatly depending on the location of wind parks and the meteorological conditions in these regions. The planetary boundary layers of high latitude cold climate (HLCC) regions have a big difference from low latitudes, primarily due to reason that is in HLCC regions thermal energy is unavailable to drive transport processes for most of the year. These transport processes modulate the local atmospheric structure. This master thesis project is linked with an ongoing research project (Wind-CoE) of Arctic Technology Research Team of University of Tromsø. WindCoE project is focused on wind energy in cold climate and is funded by EU- INTERREG Botnia-Atlantica, Nordlandfylkes Kommune & University of Tromsø. The wind park SCADA data used in this master thesis project is collected from Nygårdsfjellet wind park operated by NordKraftVind AS and owned by FORTUM. Nygårdsfjellet wind park is suitable for this study as it is located in an ice prone region near Narvik, Norway ( N E). This wind park comprises 14 wind turbines at an average elevation of 400 m a.s.l with a total production capacity of 32.2 MW and annual production of GWh. This master thesis work is focused on wind resource assessment in cold regions and has been carried out as per following main tasks. 1


10 i. Filed measurements and data analysis of meteorological parameters such as atmospheric temperature, wind speed and wind direction at Nygårdsfjellet wind park site. ii. Wind park SCADA data collection and sorting. iii. SCADA data analysis iv. Computational fluid dynamics (CFD) based numerical simulation of wind resource assessment over Nygårdsfjellet wind park. Following figure 1-1 shows the Gant chart of this master thesis work that has been accomplished over a period of 8 months from October 2016 to May Wind park site description Figure 1-1 Gant Chart The Nygårdsfjellet wind park is located on complex terrain right beside E10 on Skitdalshøgda around the Skitdalsvatnet lake and near Norwegian and Swedish border. Nygårdsfjellet wind park consists of 14 wind turbines built in 2011 with total production capacity of 32.2MW. Technical details of wind turbines installed at Nygårdsfjellet wind park are specified in table 1-1. Figures 1-2 shows the terrain/location of Nygårdsfjellet wind park. Figure 1-2 Terrain overview of Nygårdsfjellet wind park 2
11 Turbine Manufacturer Siemens_23_93VS Max Production Capacity GWh Tower Height 80 m Nacelle Weight 83 tonn Rotor Diameter 90 m Tower Weight 158 tonn Rotor Area 6361 m 2 Rotor Weight 60 tonn Production Speed 3 ~ 25 m/s Total Weight 300 tonn 1.3 Thesis outline Table 1-1 Technical details of wind turbines installed at Nygårdsfjellet wind park This thesis comprises of 6 chapters. Chapter 1 is introduction. Chapter 2 describes literature review study about previous work on wind resource assessment in cold regions. Chapter 3 describes the design of experiment methodology used for this master thesis. Chapter 4 describes the SCADA data sorting and analysis for three years ( ). Chapter 5 describes CFD based numerical simulations of wind resource assessment using the SCADA data for year This chapter also includes a comparison of SCADA data with the CFD results, where a good agreement has been found between analytical and numerical results. Chapter 6 describes the conclusion part and future work recommendations. 3
12 2 Literature Review 2.1 Wind energy & ice prone regions Due to increasing demand of electrical power and efforts to protect the environment, there has been an increasing need of rapid expansion of better use of renewable energy sources to cut the toxic emissions [3]. The cold climate regions around the world like Finland, Germany, Slovak Republic, Norway, Czech Republic, UK, Sweden, Bulgaria, Hungary, Russia, Canada and USA have great potential of wind resources. Estimated wind energy capacity in cold climates is about 60 GW[4]. Cold climate conditions mainly affect wind park site access, wind turbine operations, working and maintenance, finances, noises, health and safety of workers. Cold climate wind energy projects need to take into consideration the high safety standards in addition to other undertakings in the normal operating climate. Cold climate regions have good resources of wind energy but still have reasons that stop financers from investing on wind energy projects in ice prone cold regions mainly due to non-existence of appropriate wind resource assessment and reliable ice forecasting methods for better estimation of wind turbine production losses under icing conditions. Figure 2-1 Cold climate classification [4] Safe operation of wind turbines under icing conditions requires improved wind turbine design and special safety procedures as ice accretion on wind turbines can lead to possible ice chunk fall, which is hazardous to human safety. The most common effects of ice accretion on wind turbines include [5]: a. Increasing the static load on wind turbine rotor that can lead to alteration of the dynamic balance of the rotor leading to possible structural fatigue. b. Disrupted blade aerodynamics due to ice accretion, which can lead to change in its aerodynamic performance and resultant wind energy production. c. Ice chuck fall, which is hazardous for humans and can strike the rotor blade. The International Energy Agency (IEA) Annex 19: 'Wind energy in cold climates, also calls for finding methods to better estimate the effects of ice accretion on wind turbine performance and resultant wind energy production. Following table 2-1 highlights the main targets of IEA task 19 [6]: 4
13 No. Target 1 To collect information on ice mapping. 2 To collect information and experiences related to the forecasting of icing conditions. 3 To find some new solutions under power supply, sensor options and detection of ice. 4 To develop some coating solutions under anti- and de-icing conditions. 5 To review the current standards and recommendations in CC regions. 6 To find methods for better estimation of the effects of icing on the wind production. 7 To clarify the significance of the extra ice loading. 8 To initiate a market survey for the technology of CC wind production. 9 To improve the considerable of the risks in extreme climate. 10 To update the state-of-the-art report and studied the expert group. Table 2-1 Top 10 targets shows in IEA Task 19 The wind park classification based upon icing events and resultant production losses is an important deliverable of IEA task 19 report. Table 2-2 shows the IEA wind park site classification based on icing events [6, 7]: IEA Ice class Meteorological Icing Instrumental icing Production loss % of year % of year % of annual production 5 >10 >20 >20 4 5~10 10~30 10~25 3 3~5 6~15 3~ ~3 1~9 0.5~5 1 0~0.5 <1.5 0~0.5 Table 2-2 IEA site classification [6] 5
14 2.2 Field measurements Field measurements are important part of wind resource assessment in cold regions. To carry out highquality and reliable field measurements in cold regions, special meteorological equipment is required[8]. In addition, we also need to consider special met mast design for icing conditions Met mast design and instrumentation Special met mast design is required to support heavy snow, ice loads and high wind speeds at ice prone cold climate sites [4]. Meteorological measurement instrumentation mainly consists of: 1) heated anemometer, 2) non-heated anemometer (for comparison), 3) CCTV camera, 4) Ice load sensor, 5) Temperature sensor, 6) Relative humidity sensor. Depending on the requirement and ice loads, different types of met mast can be used such as: small masts, tubular hi-masts and lattice masts [9]. Table 2-3 shows three different classifications of met mast that have been used in Sweden [7]. Installer Feature Figure 1). The most equipped mast in regard to ice detectors; Granliden 2). Mobotix camera MXM12D; 3). 3NRG ice detection system. 6
15 1). 50 turbines at Blakliden wind park, 40 turbines at Föboberget; Blakliden and Föboberget 2). Different booms towards different directions. Boom 1,2,3 are directed towards 320 degree (west), while 4,5,6 are directed towards 200 degree (south) in Föboberget; but in Blakliden, 1,2,3 are directed towards 180 degree (south), while 4,5,6 are directed towards 60 degree (east). Table 2-3 Met mast and instrumentation examples for icing regions [6]. Above mentioned three different met mast installations have three-cup anemometers on the top of the met masts that can possibly identify ice directly. For the Granliden, the HoloOptics & IceMonitor are connected to Goodrich, LID and 3NRG and a camera. In Blakliden and Föboberget, the met mast is quite different. The HoloOptics and IceMonitor are separated on both sides of the ice detector booms. 2.3 Meteorological data Generally meteorological instruments used for wind resources assessment collect and sample the data on regular intervals. For example in some cases, they log data for every 10 minutes and sample data for every 30 minutes. There are different techniques for data sorting and analysis. The normal data analysis techniques use SCADA system to analyze database and use wind rose plots to show the wind directions with different wind speeds. In addition, statistical methods like mean, standard deviation, regression, sample size determination and hypothesis testing are applied to calculate the databases in daily, monthly and annually time intervals Icing conditions Icing events are defined as time periods when the atmospheric temperature is below 0 C and the relative humidity is above 95% [10]. There are two ways to calculate the icing conditions: meteorological icing (M icing) and instrument icing (I icing). Table 2-4 briefly describes this. 7
16 Condition Meteorological icing (M icing) Instrument icing (I icing) Characteristics a. The total amount of ice accreted on a standard event in the period of the icing problem; b. The conditions of meteorological; c. The average and/or maximum the accretion rate. An instrument to keep ice-free under the icing conditions. Table 2-4 Icing Characteristics According to ISO standards, the site icing index should be classified as per table 2-5 (from EUMETNET/SWS II Report). This classification simplifies the way to find out icing severity and helps wind park operators and wind turbine manufactures to find out the icing conditions and to modify the design and safety requirements for the wind park accordingly. Site icing index Days with meteorological icing/year Duration of meteorological icing %/year Intensity of icing g/100 cm 2 /h (typical) Icing severity S5 >60 >20 >50 Heavy S Strong S Moderate S <5 5 Light S Occasional SCADA method Table 2-5 Icing index classification SCADA (Supervisory Control Andi Data Acquisition) system in general is not only a system of data acquisition and monitoring, but also is a computer based system to complete process control and automation. In order to implement the data acquisition, equipment control, data measurement, parameter adjustment and various signal alarms, it can monitor and control the wind turbine operation. In the normal area, the SCADA data analysis system contains: a. Database management system that has fast data reading and establishing a relationship between the data; also has a grid data model and standard access interface and so on. b. Internet management system that uses COM interface with other applications, transmitting data which are received by the network layers. c. Figure management system that has very friendly graphics editors and geographic information systems. 8
17 d. System management system which has high-safety distributed network management, as well as self-diagnosis system management and timing task management. However, in the cold climate ice prone regions, the wind turbines are operated differently than in the normal regions. When running the SCADA data analysis, we need to consider not only the lowtemperature and icing climates but also the ice accretion on rotor blades and instruments. Therefore, the wind production in CC regions demands lubricants and cold start-up procedures. This makes the SCADA data analysis more complicated and specialized. SCADA data are often used to optimize the performance of the wind turbines, as Table 2-6 shows below: [11] Methodology Identification of ice-induced downtime Explanation Each 10-minute record in the SCADA database is flagged as being associated with either available to operate, un-available due to icing or un-available due to non-icing 1.Analysis of the production data Identification of ice-induced power curve degradation Quantification of ice-induced energy loss Each record in the SCADA database is flagged as being associated with a specific measurement consistency period, systematic performance variation period or a specific intermittent performance issue, or not being affected by any performance issue (i.e. normal performance ). Quantify the energy loss incurred due to icing-induced unavailability and power curve degradation. 2.Production data ice induced energy loss investigations 3.Analysis of pre-construction meteorological data 4.Development of a methodology for predicting long-term energy losses due to icing from preconstruction data Combined with the geographic location and hub height altitude, SCADA estimation could be applied to build the icing map, using the relationship between the average annual losses observed in the operation data and altitude. Icing periods are identified by comparing the wind speeds and directions between sensors at different levels, parallel sensors at the same level, sensors with different heating arrangements and corresponding temperature and relative humidity values where available. Use anemometer icing in pre-construction data to predict icing losses during wind park operation. Extrapolate historical icing events and inform a long-term adjustment from the matrices of relative humidity and temperature. Table 2-6 SCADA analysis techniques 9
18 SCADA system for single wind turbine When we focus on the SCADA data system, which is based on many single wind turbines, we need to understand the working steps as shown in figure 2-2 for monitoring and inspecting a single wind turbine [12]. Figure 2-2 Single wind turbine work conditions [12] SCADA data analysis for wind parks For wind parks SCADA data analysis in cold regions, we need to know that inside the wind parks, there are many single wind turbines working together and outside the wind parks there are complex power grids connecting the wind parks with others or power users. In the cold climate regions, the performance of wind turbines probably decreases considerably because of ice accretion at turbine blades, and the loss of energy could be as high as around 50% in the wintertime, 10% annually [11]. Therefore, the ice accretion will be a big challenge for the wind energy development and operations under cold climate. DNV GL presented a study based on 20 operational wind parks in Scandinavia to find out the actual production losses due to icing [11]. Their methodology is summarized in Table 2-7: Methodology 1 Analysis of the production data. Identification of ice-induced downtime Identification of ice-induced power curve degradation Quantification of ice-induced energy loss 2 Investigations of ice-induced energy loss with production data. 3 Analysis of pre-construction meteorological data. 4 Development of a methodology for predicting long-term energy losses due to icing from preconstruction data. Table 2-7 DNV GL methodology 10
19 Following are the conclusions of this study: 1. Wind turbines could continuously work during ice accretion period, so as to minimize the loss of energy caused by icing. 2. Polynomial relationship exists between icing production loss and altitudes of the sites in Sweden; 3. The icing problems have high variability, and the resulted energy loss decreases with an increase in the mean icing loss; 4. Fully heated cup anemometers outperform the unheated or partially heated ones in ice reduction; 5. A method is proposed and validated for predicting annual energy loss due to icing from the occurrences of anemometer icing; 6. A method based on temperature and humility data is developed for studying icing losses in a longterm context. However, the problem of this method is that: 1. They didn t consider safety issues, noise problem and turbine life cycle; 2. Need to conduct more SCADA data analysis and find the correlation between the slope and shape with the ice loss and different altitudes; 3. There may be some difference in the energy loss and average of annual history; 4. The effects of ice on the sensors, such as the heated sensors, on SCADA data analysis vary across different icing conditions. Based on the above description, we can use the method DNV GL proposed, but need to add more performance comparisons in our work. 2.4 Wind resource assessment in cold climate regions Scope of wind resource assessment The wind resource assessment in cold climate regions not only directly affects the site access, the working conditions and the production of the wind energy, but also affects the chosen techniques, wind noise, working loads and public safety. Many CC regions could offer great wind power potential but need to overcome the atmospheric icing problems and the difficult working conditions under low temperature [4]. We did not fully recognize these special challenges and had no way to solve the technical and financial problems until a few years ago. IEA report published in 2011 also points out the wind measuring methods to solve these problems, as stated in Table 2-8: [4] Methods Site assessment Techniques a. Adoptable equipment of site measurement; b. At least one year icing measurement data collection; c. The procedure of the measuring program needs to consider the location, parameters and working conditions. 11
20 Instrument and turbine manufacturers High safety standards a. Some partly sensors under the level of prototype; b. The devices for anti-icing and de-icing; c. Heated involving and so on. a. High risks should be considered for planning, operating, insuring and investments and so on; b. Some additional costs will occur on the working condition, construction and site access. Therefore, we need to make plans to cut it. Table 2-8 The way to solve the problem under wind assessment The wind resource terms can be classified as following table 2-9 shows: [4] Term Definition Comments Atlas Large area dataset of regional wind climates. Scope: 100~10000km Scale: O (50km) Regional climate Resource Statistics of wind, the temporal and spatial variation, and the standard conditions reduced. Long-term kinetic actual energy of the wind, which has a special location and height of the wind content. Table 2-9 Wind resource assessment estimation Table 2-10 shows the eight approaches of wind assessment estimation [13]: Scope: regional validity Scale : O (50 km) Scale: O (1 m) Components method Measurements Database geostrophic winds Database land-use Database orography WASP terrain Mesoscale model CFD Microscale model Geostrophic drag law Statistical models Folklore Table 2-10 Wind resource assessment estimation 12

21 2.4.2 Numerical methods of wind resource assessment Numerical methods of wind resource assessment can be classified according to three scales, a) large, b) medium, c) small; as shown in figure 2-3: Figure 2-3 Processing of the scale of wind resource assessment [14] From figure 2-3, we can see that the numerical methods include generalization part, mesoscale modelling part, wind data retrieval part, microscale-modelling part and so on in different streams. There are two main numerical methods: a) mesoscale modelling method, b) microscale modelling method. For mesoscale, by modeling and measurement verification, it makes wind resource assessment better with uncertainties in the estimate of wind speed. In addition, mesoscale modeling could be used in verified assessment for precise national planning which is the basis for the private developers activities. For microscale, the input is from the mesoscale modeling output and the analysis of developer s measurements. We review the mesoscale and microscale approaches as follows and compare the advantages and disadvantages to find a better solution to wind resource assessment Mesoscale approach The report published in 2014 by World Wind Energy Association (WWEA), shows three approaches for the mesoscale wind resource assessment [15]. i. The first approach is Weather Research and Forecasting (WRF). This approach has metrological investigations and real-time Numerical Weather Prediction (NWP). It could conduct atmospheric 13
22 ii. iii. simulations and data assimilation studies. Moreover, it could couple with other numerical models. By using WPS to define the grid of WRF, make the generate map, evaluation and condition information from WRF, also can make some model to analysis data and make a forecast, and interpolate the data to the grid of WRF. The second approach is PSU/NCAR mesoscale model, which can also be called MM5. It is from Penn State University and built on NCAR community model, and has all the capabilities of WRF. The model is a limited-area, non- hydrostatic one which can simulate mesoscale atmosphere conditions. It also can be used to make a latitude and longitude grid in an interpolated form and make a higher variable resolution in this area. It can forecast the weather and measure climate forecasting. The third approach is Boundary layer model (BLM), which is developed by Wind Force. It creates a region of interest (Rol), and could make outside urban area masked out of the wind assessment. It not only has long-term average data region, but also considers reasons which are not suitable for wind power development Microscale approach The wind analysts must consider the accuracy of the numerical models. To use the computational fluid dynamics (CFD), we must think about whether it is sufficient as a linear model or not. Microscale methods based on CFD in wind resource assessment [16] are shown in Table Microscale list Traditional approach Tools Advanced approach Tools Horizontal extrapolation Linear model, near-neutral conditions Wind Atlas Methodology (WAsP) Non-linear model, different stabilities, builtin forest model CFD solvers, turbulence model calibrated with sonic measurements Vertical extrapolation Define most likely wind shear based on lower measurements and experience Linear model, near-neutral and/or experience Profile calibration based on remote sensing and CFD modelling Remote sensing + CFD Table 2-11 Approaches of microscale analysis From the above discussion, we see that both mesoscale and microscale approaches have their own limitations in wind resource assessment. We need to consider different methods for different wind resource assessment problems. It turns out that combining these two methods together can do a better job for wind resource assessment. 14
![2.4.2.3 Coupling meso-micro scales approach DTU wind energy department has pointed out that if we combine mesoscale and microscale together, the mean power density will expand by 50% [13].](/docs-images/74/70116575/images/23-0.jpg "The combination of mesoscale and microscale approaches has big advantages for the assessment of wind resources, especially for complex terrains of cold climate regions. 2.4.")
23 Coupling meso-micro scales approach DTU wind energy department has pointed out that if we combine mesoscale and microscale together, the mean power density will expand by 50% [13]. The combination of mesoscale and microscale approaches has big advantages for the assessment of wind resources, especially for complex terrains of cold climate regions Terrain roughness effects Figure 2-4 Comparison of mean power density [13] The first thing we need to do before assessing terrain roughness data is to separate the topography, as shown in table 2-12 [17]: Topography Surface description Resolution Elevation Land cover Shuttle Radar Topography Mission (SRTM) Viewfinder, compiles SRTM and other datasets ASTER Global Digital Elevation Model (ASTER GDEM) ESA GlobCover Modis, land cover classification Resolution m Resolution m Resolution 30 m Resolution 300 m Resolution 500 m Table 2-12 Topography separation [17] 15
24 2.4.4 Effects from climate change Nowadays, the climate change not only affects the agriculture, forestry, animal husbandry and so on, but also influences the icing conditions. For example, when the weather becomes warmer, the Baltic Sea area s temperature increases and there is more rainfall [18]. The symptoms are shown as follows: 1. More rain and less sea ice; 2. Increased nutrient flows in the rivers and sea. The results of the climate change, such as low temperature, ice detection and snow have influence on the normal operation of wind turbines, especially in cold climate regions. Ireland government published the report: Connecting How Much with How To, showing the vision for Ireland in 2050 facing climate change problems, and proposing one pragmatic approach and three tracks, as shown in Table [19]. According to this report, climate change not only influences agriculture, transport and so on, but also influences energy and natural resources, like wind energy, which is the main topic in this master thesis. Step Approach Explanation Vision A carbon-neutral Ireland society will be built by It is socially and environmentally sustainable economic development. Approach Three Ideas Climate-change is not a loop policy; How to achieve decarbonisation is critical; Involve more and more companies, public organizations and communities in decarbonisation. Track Track 1 Strategic and institutional Track 2 Track 3 Exploration and Experimentation Design and implementation Table 2-13 Ireland and the climate change challenge 16

25 3 Design of Experiment 3.1 Wind park site description Nygårdsfjellet wind park is located near Narvik Norway ( N 17, E) and comprises 14 wind turbines at an average elevation of 400 m a.s.l with a total production capacity of 32.2 MW and annual production of GWh [20]. This wind park is prone to icing conditions, which makes it suitable for the objective of this master thesis work. All 14 turbines SCADA data from Nygårdfjellet wind park has been used to further study the wind flow characterization over complex terrain and resultant power production from each wind turbine for three years ( ). Detailed analytical analysis of SCADA data has been carried out in this regard. Later computational fluid dynamics (CFD) based numerical simulations are carried out to better understand the wind flow physics and wake rotational effects on neighbouring wind turbines and its resultant effects on power production during summer and winter periods. Figure 3-1 shows the real pictures of Nygårdsfjellet wind park during summer and winter periods. 3.2 Design of experiment Figure 3-1 Nygårdsfjellet wind park during summer and winter periods The work presented in this thesis is carried out in following five main steps. 1) Literature review to better understand the previous work and nature of study 2) SCADA Data collection from Nygårdsfjellet wind park 3) SCADA Data sorting 4) Analytical analysis of SCADA data 5) CFD based numerical analysis Figure 3-2 shows a schematic overview of design of experiments used for this study. 17

26 Figure 3-2 Schematic overview of design of experiment used for this study 18
27 3.3 Software overview- used for this study Microsoft Access 2016 Microsoft Access 2016 is a Windows-based desktop relational database management software that Microsoft Company released in the end of It provides a variety of wizards, generators, templates, data storage, data query, interface design, report generation and other operational standardization to establish a fully functional database management system. Its user-friendly functionality also allows facilitating the basic/ordinary users. In this thesis, Microsoft access was used for data sorting as the original SCADA database provided by NordkraftVind was also in access database format Microsoft Excel 2016 Microsoft Excel 2016 has the background with Access Moreover, Excel is not only a data storage tool, but also a simple data analysis tool. Through Excel, we can easily get the format which can be imported to MATLAB, Wind Rose software and so on to do further analysis. In this master thesis Microsoft Excel was used for both SCADA data sorting and analysis. One Simple plugin was used to split Excel.csv format to Excel.xlsx. Because one-year database combination is too big to export to.xlsx Excel format, so we try to export to.csv format first, and then use the split tool to export to.xlsx format MATLAB R2016b MATLAB is widely used by researchers for big data set analyses. Built-in plots and graphics make it easy to visualize data. Compared with previous versions, MATLAB R2016b working interface is more concise and the mathematic and graphic tools are easier to use. In this master thesis, MATLAB is mainly used for curve fitting analysis and SCADA database analysis. Several small subroutines programs were written for this purpose WindRose PRO3 WindRose PRO3 is a software for analysing and plotting wind direction and velocity from original database based on the Windows system. Moreover, time series can be chosen when customers have some other needs. For this purpose, WindRose PRO3 was used for making wind rose from SCADA data WindSim v8 WindSim is a computational fluid dynamics based software, developed by WindSim AS. Compared with WAsP, which is good for linear simulations, WindSim is one popular numerical modelling tool for wind energy sectors and can do advanced computational fluid dynamics based numerical simulation in non-linear ways. WindSim v8.0.0 includes many new features and is a clear way towards cloud computing. In this master thesis, WindSim v8 was used for the CFD based numerical simulations of flow over complex terrain of Nygårdsfjellet wind park. An extension of WindSim 8.0, WindSim Express 8.0, was used to input the elevation and roughness data map. 19
28 Based upon the features of each above-mentioned software, a careful comparison was made for the selection of most suitable tools for this study. Following Table 3-1 highlights this selection. Name Software Selection Data Analysis WindRose Analysis CFD Simulations Excel MATLAB Excel MATLAB WindRose PRO WAsP WindSim Table 3-1 Software Selection 20
29 4 SCADA Data Analysis Three years ( ) SCADA data from all 14-wind turbines of Nygårdsfjellet Wind Park is collected for this study that contain meteorological, wind turbine operational and production data for each 10 minute time interval. The main parameters of this SCADA dataset are: (1) Average wind velocity (m/s) (2) Average atmospheric temperature ( o C) (3) Wind power production (kw) (4) Time series (10 min) Interpolation methods have been used to do SCADA data analysis for: (1) Time & Average wind velocity (2) Time & Average temperature (3) Time & Wind power production (4) Average wind velocity & Wind power production (5) Average wind velocity & Average temperature (6) Average temperature & Wind power production This SCADA dataset was sorted using Microsoft EXCEL & Access. The overall dataset size used for this study is around 70GB, where around 2.2 million data points were sorted and analysed.. 21
30 Number SCADA data File Number Wind Turbine Size(MW) Wind Turbine Manufacturer Wind Turbine Coordinates Siemens VS , Siemens VS , Siemens VS , Siemens VS , Siemens VS , Siemens VS , Siemens VS , Siemens VS , Siemens VS , Siemens VS , Siemens VS , Siemens VS , Siemens VS , Siemens VS , Table 4-1 Location and SCADA data file number for each wind turbine used Figure 4-1 shows the design layout and terrain model of the Nygårdsfjellet wind park. Figure 4-1 Nygårdsfjellet wind park design layout 22

31 Figure 4-2 shows the methodology used for SCADA data sorting and analysis in this master thesis work. A E P Figure 4-2 SCADA Data Analysis Structure 23
32 4.1 SCADA data sorting Different software s have been used for SCADA data sorting and analysis in this work. Following sections explain the procedure used for the sorting of SCADA data Microsoft Access to Excel (.csv) 1. Downloaded the following two files a. Year-month-tur (e.g tur) b. Year-month-grd (e.g grd) 2. Created a Microsoft Access Database ( accdb) 3. Imported the files from step 1 into the database a. External data b. Access c. Browse and select the file d. In the "Import items" Select All, OK Close 4. Created a union query for the files as follows. a. Create b. Query designers c. Select both tables d. Select Time stamp, Station Id from tblscturbine e. UNION f. Select Timestamp, StationIdFrom tblscturgrid; 5. Saved this relation as TimeId (or some other convenient name) 6. Created a new query. 7. Go to SQL viewing. 8. Paste in the text below. Modify the highlighted table name to the current year and month. 9. Save the query as, qry2014x01 SELECT TimeId.Timestamp, TimeId.StationId, tblscturbine.wtc_pitchref_bladea_max, tblscturgrid.wtc_actpower_mean, tblscturbine.wtc_pewindsp_mean, tblscturbine.wtc_sewindsp_mean, tblscturbine.wtc_aewindsp_mean, tblscturbine.wtc_nacelpos_mean, tblscturbine.wtc_scyawpos_mean, Day([TimeId]![Timestamp]) AS [Day], Month([TimeId]![Timestamp]) AS [Month], Year([TimeId]![Timestamp]) AS [Year], Hour([TimeId]![Timestamp]) AS [Hour], Minute([TimeId]![Timestamp]) AS [Minute] INTO tbl2014x01 FROM (TimeId LEFT JOIN tblscturbine ON (TimeId.StationId = tblscturbine.stationid) AND (TimeId.Timestamp = tblscturbine.timestamp)) INNER JOIN tblscturgrid ON (TimeId.StationId = tblscturgrid.stationid) AND (TimeId.Timestamp = tblscturgrid.timestamp); 24
.")
33 Figure 4-3 SQL Query structure 10. Create the table by double-clicking the query. The 13 columns should be in the same order or the program will not work or generate invalid results (Unless you modify the program). Figure 4-4 Data table sorting -1 Figure 4-5 Data table sorting -2 Test of data columns from turbine T04 in 2013 to see which ones should be included. TimeStamp ok StationId ok PitchRef_BladeA_max this show when the turbine is stopped. Keep. ActPower_mean this shows the power production. Keep. wtc_pewindsp_mean this shows a separate speed. Keep. wtc_sewindsp_mean this shows a separate speed. Keep. wtc_aewindsp_mean this show either PrWindSp or SeWindSp. Keep. wtc_nacelpos_mean this shows a separate direction. Keep. wtc_scyawpos_mean this shows a separate direction, and goes from -380 to Perhaps it is the absolute direction, to make sure it does not over twist. Keep. wtc_prianemo_mean this always shows 1.2. Do not use. wtc_secanemo_mean this shows the same as SeWindSp_mean. Do not use wtc_yawpos_mean this shows the same as NacelPos_mean. Do not use wtc_ambietmp_mean not included. 25
. 16. Finished export from Access to Excel (.csv). Do the same processing of wind temp. files, and added the two Excel files into one.")

34 11. Open the table produced from this relation. 12. Export this table into Excel 13. External data -> Export to Excel 14. Change filename to include the turbine, which is selected. 15. Choose option 1, (Exporter data with formatting and layout). 16. Finished export from Access to Excel (.csv). Do the same processing of wind temp. files, and added the two Excel files into one. Saved it Excel (.csv) to Excel (.xlsx) A plugin has been used to split Excel.csv format to Excel.xlsx as shown in figure 4-6. Because databases time arranges are different, e.g., January and February have different time lengths, and there may be some data missing, we need to do some data (filtering) fine-tuning before carrying them out of.xlsx files Microsoft Excel to MATLAB Figure 4-6 CSV split 1. Repeat the above process for wind temp. files, and pool the two Excel files into one. Saved it. Prepare and named Excel(.xlsx) database. 2. Open MATLAB software, click Import data button on the toolbar, as figure4-7 shows. Figure 4-7 Import data to MATLAB 3. In the pop-up dialog box, open.xlsx files that saved before. 4. In the pop-up dialog box choose Numeric Matrix in the top, and then Import Selection to import the database in workspace, saved it. As figure 4-8 shows. 26
 When you choose the data in Import data window, there may be columns or rows missing because of data missing; Solution:")
35 Figure 4-8 Import Selection & save workspace 5. Close Import window, click the workspace that you choose, then you can analysis it as you want. NOTE: There are some issues that may result in data importing failure: a) When you choose the data in Import data window, there may be columns or rows missing because of data missing; Solution: single click the top cell, then press Ctrl +Shift+, then you can choose the whole datasheet. b) Close MATLAB by mistake, and the workspace might be missing; Solution: save workspace before your analysis, then you can open workspace anytime Microsoft Excel to WindRose PRO3 1. Open WindRose PRO3 and choose File load data then renew it. a. Select the worksheet which you want; b. Choose Column with directions wtc_scyawpos_mean, which is the variable of wind direction. c. Choose Column with data wtc_sewinsp_mean, which is the variable of wind speed. d. Choose Data time use data -- Column with data and time TimeStamp, which shows time series; -- Date/time format mm/dd/yyyy hh:mm:ss, which shows the format of time series. e. Leave Third Variable. f. Choose Action for non-numerical values assign this value to non-numerical 0. Run this as figure 4-9 shows. 27

36 Figure 4-9 Wind Rose data load 2. Choose Analysis and Draw to start WindRose PRO3 analysis. 3. Change some details by choosing Options. a. Intervals Chose different speed range and different colours, as figure 4-10 shows. Figure 4-10 Intervals b. Add title and subtitle As figure 4-11 shows, change the size of letter and background colour. 28
37 Figure 4-11 Title c. Choose Legend and draw the legend as figure 4-12 shows. Figure 4-12 Legend d. Change Type as wind rose and direction chosoe 16. Shows as figure
38 Figure 4-13 Type e. Change details into Circles as figure 4-14 shows. Figure 4-14 Circles f. Leave Logo, Calms and other options unless some analysis need it. 4. Output figure or database Choose Action Batch processing Monthly plot to export wind rose monthly. Choose Output folder Image height (pixels), Image format and so on to export. 30
39 4.2 SCADA data analysis This section will present the results of SCADA data analysis, which has been done using the following methodology: (1) Comprehensive analysis a. Vertical interpolation b. Horizontal interpolation (2) Specific analysis a. Vertical analysis b. Horizontal analysis (3) Wind rose analysis Comprehensive Vertical Interpolation analysis shows 3 years data ( ) for 14 turbines, with comparison between different polynomial curves (4 th to 9 th degree) including linear analysis as reference. We choose the best polynomial curve for further analysis. Comprehensive Horizontal Interpolation analysis shows 1 year data (2014) for 14 wind turbines. Six functions (4 variables combination) are used for comparison and we choose the best correlations for further analysis. Wind rose analysis shows graphical comparison of wind direction & wind speed between turbines for the year Specific vertical and horizontal analyses show 3 years data ( ) for each turbine. Best polynomial curve (with linear reference) fitting was carried out to make the detailed comparison between turbines Comprehensive analysis Vertical interpolation In this section, 3 years database has been used in different polynomial curves fitting comparison. First, I use Microsoft Excel to make the R-Square table. After that I use Curve Fitting APPS in MATLAB R2016b to select different variables in the curve fitting comparison, then copy the table into Excel 2016 and use transpose and filter to complete database. It turns out that 7 th to 9 th polynomial curves fit better than 4 th to 6 th ones in general (linear be as reference), as shown in tables 4-2 &
40 Table 4-2 Power production & wind speed (R-square) for 3 years data and 14 turbines SCADA data Table 4-3 Average temperature and time series (R-square) for 3 years data and 14 turbines SCADA data Turbine 4th th th th th th th th th th th th th th th th th th Linear 2013 Linear 2014 Linear % 92.05% 38.29% 82.43% 92.05% 38.29% 82.81% 92.83% 38.36% 83.24% 93.24% 38.57% 83.25% 93.39% 38.58% 83.48% 93.66% 38.72% 70.81% 77.37% 33.43% % 88.77% 45.08% 60.25% 88.77% 45.79% 60.25% 89.19% 45.80% 60.27% 89.71% 46.25% 60.57% 89.77% 46.32% 61.40% 90.06% 46.33% 37.61% 74.95% 33.42% % 89.89% 71.61% 63.07% 89.89% 71.63% 63.45% 90.33% 71.86% 63.91% 90.91% 71.97% 63.91% 90.96% 72.06% 64.07% 91.32% 72.51% 51.90% 75.15% 54.96% % 74.05% 50.38% 91.02% 75.67% 50.38% 91.56% 75.70% 50.39% 91.86% 75.70% 50.82% 91.94% 75.85% 51.24% 92.20% 76.05% 51.29% 80.23% 50.38% 32.91% % 95.95% 79.23% 93.90% 96.51% 79.53% 94.52% 97.00% 79.80% 94.59% 97.03% 79.94% 94.76% 97.27% 80.13% 94.87% 97.27% 80.14% 83.64% 85.51% 70.51% % 93.53% 82.18% 94.04% 94.23% 82.42% 94.72% 94.75% 82.42% 94.72% 94.76% 82.96% 94.92% 94.97% 83.43% 94.95% 94.97% 83.43% 84.42% 84.15% 71.63% % 93.06% 85.09% 92.46% 93.51% 85.44% 92.95% 93.94% 85.61% 93.04% 93.94% 85.80% 93.26% 94.16% 85.93% 82.45% 94.16% 85.93% 82.45% 82.99% 77.01% % 90.87% 80.46% 91.74% 90.89% 80.59% 92.06% 91.57% 80.75% 92.52% 91.78% 80.75% 92.53% 91.91% 80.83% 92.71% 92.09% 80.91% 78.53% 75.83% 69.01% % 92.04% 78.24% 90.15% 92.06% 78.32% 90.47% 93.03% 78.59% 91.00% 93.23% 78.59% 91.02% 93.60% 78.80% 91.21% 93.70% 78.97% 75.85% 75.37% 66.79% % 94.91% 80.05% 91.29% 95.23% 80.46% 91.62% 95.77% 80.80% 92.10% 95.78% 80.94% 92.10% 95.95% 81.08% 92.45% 96.02% 81.08% 79.60% 82.12% 70.69% % 95.61% 80.85% 89.55% 95.80% 80.94% 90.14% 96.37% 81.28% 90.48% 96.38% 81.39% 90.54% 96.63% 81.52% 90.85% 96.64% 81.88% 77.86% 81.75% 69.87% % 94.90% 74.65% 88.90% 95.27% 75.13% 89.35% 95.74% 76.00% 89.73% 95.76% 76.03% 89.76% 96.12% 76.20% 90.14% 96.12% 76.20% 78.47% 82.79% 65.84% % 60.53% 74.05% 85.23% 60.56% 74.11% 85.58% 61.08% 74.59% 85.91% 61.21% 74.67% 85.94% 61.35% 75.25% 86.21% 61.49% 75.26% 74.26% 51.62% 64.23% % 94.20% 45.78% 93.41% 94.54% 45.82% 93.65% 95.24% 46.05% 94.42% 95.24% 46.05% 94.42% 95.65% 46.09% 94.77% 95.65% 46.09% 82.18% 82.22% 42.58% Turbine 4th th th th th th th th th th th th th th th th th th Linear 2013 Linear 2014 Linear % 69.20% 70.86% 78.71% 70.26% 73.61% 78.72% 71.09% 74.24% 78.90% 75.37% 77.93% 79.18% 77.77% 78.41% 79.22% 77.85% 78.94% 3.41% 5.76% 12.73% % 69.14% 70.77% 75.14% 70.23% 73.37% 75.14% 71.09% 73.89% 75.18% 75.20% 77.09% 75.61% 77.63% 77.59% 75.87% 77.69% 78.30% 0.53% 5.61% 11.93% % 69.07% 70.89% 78.43% 70.15% 73.50% 78.43% 71.11% 73.86% 78.62% 75.29% 77.04% 78.96% 77.66% 77.73% 78.96% 77.72% 78.47% 2.58% 5.69% 12.03% % 68.91% 71.72% 78.86% 69.15% 74.41% 78.86% 73.38% 74.93% 79.08% 73.63% 78.31% 79.38% 74.17% 78.81% 79.44% 74.24% 79.40% 3.56% 0.34% 12.52% % 69.54% 72.28% 79.22% 70.54% 74.82% 79.23% 71.27% 75.37% 79.46% 75.66% 78.70% 79.75% 78.15% 79.17% 79.78% 78.27% 79.79% 3.63% 5.73% 13.04% % 69.51% 71.32% 79.09% 70.52% 74.01% 79.09% 71.29% 74.62% 79.31% 75.54% 78.20% 79.52% 78.07% 78.65% 79.60% 78.16% 79.21% 3.90% 5.53% 12.55% % 69.28% 70.86% 78.83% 70.33% 73.64% 78.84% 71.23% 74.26% 79.13% 75.40% 77.76% 79.41% 77.80% 78.24% 3.98% 77.89% 78.82% 3.98% 5.57% 12.71% % 68.82% 70.08% 78.41% 69.96% 73.04% 78.41% 70.92% 73.69% 78.70% 74.88% 77.19% 78.97% 77.38% 77.66% 79.06% 77.46% 78.20% 3.87% 5.47% 12.30% % 68.92% 70.53% 78.56% 69.99% 73.49% 78.56% 70.95% 74.13% 78.86% 75.06% 77.68% 79.15% 77.50% 78.14% 79.24% 77.59% 78.66% 3.84% 5.70% 12.34% % 69.29% 70.32% 78.57% 70.32% 73.55% 78.75% 71.18% 75.37% 79.96% 75.41% 78.34% 79.96% 77.87% 78.54% 80.44% 77.98% 79.60% 9.14% 5.64% 14.59% % 69.12% 70.71% 78.87% 70.17% 73.49% 78.88% 71.06% 74.10% 79.18% 75.28% 77.59% 79.43% 77.73% 78.12% 79.49% 77.82% 78.71% 3.91% 5.65% 12.33% % 69.39% 72.46% 79.08% 70.45% 74.33% 79.08% 71.27% 74.50% 79.31% 75.51% 77.98% 79.61% 77.95% 79.00% 79.70% 78.05% 79.49% 4.24% 5.55% 10.73% % 70.09% 71.32% 78.48% 70.96% 73.82% 78.53% 71.59% 74.46% 78.65% 75.95% 77.85% 78.88% 78.39% 78.34% 78.88% 78.50% 79.00% 3.89% 6.11% 12.54% % 69.18% 71.80% 79.18% 70.15% 74.47% 79.18% 70.91% 75.07% 79.41% 75.33% 78.56% 79.66% 77.93% 79.00% 79.73% 78.07% 79.56% 3.90% 6.48% 12.64% 32
41 Horizontal interpolation In this section, I used one year SCADA data (2014) for each turbine, and compare 6 functional forms (4 variables combination) to choose the best correlations for further analytical analysis. Based on the curve fitting in MATLAB, average wind speed & wind power production and time & average temperature fit the data better than other alternatives by more than 50% in terms of R-square. The results are shown in Table Turbine 01 Turbine 02 Turbine 03 Turbine 04 Turbine 05 Turbine 06 Turbine 07 Turbine 08 Turbine 09 Turbine 10 Turbine 11 Turbine 12 Turbine 13 Turbine 14 7 th - time&power 7 th - time&speed 7 th - time&temp 7 th - temp&speed 7 th - power&temp 7 th - speed&power 22.51% 20.31% 75.37% 20.30% 24.39% 93.24% 23.50% 19.98% 75.20% 19.44% 22.01% 89.71% 20.20% 17.84% 75.29% 18.88% 22.49% 90.91% 17.57% 43.23% 73.63% 29.87% 16.65% 75.70% 23.49% 21.83% 75.66% 19.94% 23.11% 97.03% 21.01% 18.35% 75.54% 16.95% 18.57% 94.76% 18.11% 16.59% 75.40% 15.10% 19.48% 93.94% 17.07% 13.24% 74.88% 13.28% 17.20% 91.78% 17.27% 15.63% 75.06% 15.73% 19.06% 93.23% 17.00% 14.13% 75.41% 12.50% 16.76% 95.78% 17.28% 16.13% 75.28% 15.12% 17.54% 96.38% 19.47% 15.69% 75.51% 14.93% 19.62% 95.76% 14.26% 16.32% 75.95% 16.31% 6.22% 61.21% 22.33% 21.39% 75.33% 19.11% 21.39% 95.24% Table 4-4 Six relationship comparison for year 2014 (R-square) The most suitable correlations found from above mentioned analysis are: a. Average wind speed & wind power production b. Time & average temperature Analysis One year SCADA data (2014) is used to do comprehensive verification analysis. Figure 4-15 shows 6 different functions with 4th to 9th polynomial curve fitting (linear as reference) for 14 turbines. Ignoring errors within 1%, 4th and 5th are similar, and 6th to 9th are similar. Considering actual wind production and application, I choose the simplest equation 7th polynomial curve for further work. Analysis of Average Wind Speed & Wind Power Production and Time & Average Temperature from 2013 to 2015 are shown in Figure 4-16 for 14 turbines, with a comparison between 2 different functions, 7th polynomial and linear. From Figure 4-16, we can see that for most of the time 7th polynomial curves fit the relationship between Average Wind Speed & Wind Power Production and that between Time & Average Temperature very well. 33
42 Figure 4-15 Different polynomial and linear curve fitting yearly comparison (2014) 34
43 1. Wind Power Production and Wind Average Velocity fitting for different wind turbines 2. Wind Average Temperature and Time fitting into different wind turbines Figure 4-16 Three years, 7 th polynomial and linear curve fitting comparison ( ) 35
44 4.2.2 Specific analysis In this section, I use 7 th degree polynomial (linear as reference) to fit the relationship between Average Wind Speed & Wind Power Production and that between Time & Average Temperature in specific vertical and horizontal comparison Vertical analysis This section presents two-part analysis for 14 turbines of 3 years data with 7 th degree polynomial curve fitting (linear as reference), as shown in Figures 4-17 & a. In Average Wind Speed & Wind Power Production figures, it is observed that 3 years curves have the same trend (positive correlation), except turbine 02 (0574) in b. In Time & Wind Average Temperature figures, the 3 years curves in different turbines show roughly Normal Distribution. In addition, they all have the same trend (positive correlation). 36
45 Wind Power Production (kw) Figure 4-17 Wind Power Production & Wind Average Velocity Turbine 01 Turbine 03 Turbine 02 Turbine 04 Average Wind Velocity (m/s) 37
46 Wind Power Production (kw) Turbine 05 Turbine 06 Turbine 08 Turbine 07 Turbine 09 Average Wind Velocity (m/s) 38
47 Wind Power Production (kw) Turbine 10 Turbine 11 Turbine 13 Turbine 12 Turbine 14 Average Wind Velocity (m/s) 39
48 Wind Average Temperature ( o C) Figure 4-18 Time & Wind Average Temperature Turbine 01 Turbine 03 Summer Summer Turbine 02 Turbine 04 Summer Summer Time (min) 40
49 Wind Average Temperature ( o C) Turbine 05 Summer Turbine 06 Turbine 08 Summer Summer Turbine 07 Turbine 09 Summer Summer Time (min) 41
50 Wind Average Temperature ( 0 C) Turbine 10 Summer Turbine 11 Turbine 13 Summer Summer Turbine 12 Turbine 14 Summer Summer Time (min) 42
51 Horizontal analysis We conduct horizontal analysis for each wind turbine for the year th degree polynomial curve (with linear reference) fitting is used for comparison as shown in Figures 4-19 & 20. In addition, 6 different functions are plotted together for 14 wind turbines for a detailed comparison as shown in Figure Below are the main observations: a. From Figure 4-19: i. As wind velocity increases, wind power production also increases (positive correlation); ii. Maximal power production is 2290 kw. In general, wind power production stays the same after reaching its peak, even when wind velocity increases further; iii. Some points show a different trend after reaching maximal power production --the power production decreases as average wind velocity increases. This feature needs further consideration in the future work; iv. As the time series expand, temperature has the trends: increasing decreasing-increasing a little bit; v. Turbine 04 (4531) has some special features in speed &power plot: The data points can be divided into two groups, one of which go to the maximal power production faster than the other. b. From Figure 4-20: i. Average Wind Velocity and Wind Power Production have similar trends over time (positive correlation), but the Average Temperature has the opposite trend (negative correlation).we need to note this in wind power production problems; ii. Average Wind Velocity and Wind Power Production do not correlate with average temperature. 43

 X Axis: Average Wind")

 Turbine 03 Turbine 02 Turbine")
52 Wind Power Production (kw) Figure 4-19 Average Wind Velocity & Power Production (2014 whole year 14 turbines) X Axis: Average Wind Velocity (m/s) range 0~26 m/s Turbine 01 Y Axis: Power Production-- range (-500)0~2500 (kw) Turbine 03 Turbine 02 Turbine 04 Average Wind Velocity (m/s) 44
")


53 Wind Power Production (kw) Turbine 05 Turbine 08 Turbine 06 Turbine 09 Turbine 07 Turbine 10 Average Wind Velocity (m/s) 45


54 Wind Power Production (kw) Turbine 11 Turbine 13 Turbine 12 Turbine 14 Average Wind Velocity (m/s) 46


55 Wind Average Temperature ( 0 C) Figure 4-20 Wind Temperature & Time (2014 whole year 14 turbines) X Axis: Time Series (per 10 mins) range 0~5.2 *10^5 min. Turbine 01 Y Axis: Temperature ( 0 C) range -30~30 C Turbine 03 Summer Summer Turbine 02 Turbine 04 Summer Summer Time (mins) 47


 48")
56 Wind Average Temperature ( 0 C) Turbine 05 Turbine 08 Summer Summer Turbine 06 Turbine 09 Summer Summer Turbine 07 Turbine 10 Summer Summer Time (min) 48
 Figure 4-21 Power Production & wind velocity")
57 Wind Average Temperature ( 0 C) Turbine 11 Turbine 13 Summer Summer Turbine 12 Turbine 14 Summer Summer Time (min) Figure 4-21 Power Production & wind velocity 49

58 Turbine - 1 Average Wind Velocity & Power Production Time & Average Wind Velocity Average Wind Velocity & Temperature Time & Temperature Summer Temperature & Power Production Time & Power Production 50


59 Turbine - 2 Average Wind Velocity & Power Production Time & Average Wind Velocity Average Wind Velocity & Temperature Time & Temperature Summer Temperature & Power Production Time & Power Production 51


60 Turbine - 3 Average Wind Velocity & Power Production Time & Average Wind Velocity Average Wind Velocity & Temperature Time & Temperature Summer Temperature & Power Production Time & Power Production 52


61 Turbine - 4 Average Wind Velocity & Power Production Time & Average Wind Velocity Average Wind Velocity & Temperature Time & Temperature Summer Temperature & Power Production Time & Power Production 53

62 Turbine - 5 Average Wind Velocity & Power Production Time & Average Wind Velocity Average Wind Velocity & Temperature Time & Temperature Summer Temperature & Power Production Time & Power Production 54

63 Turbine 6 Average Wind Velocity & Power Production Time & Average Wind Velocity Average Wind Velocity & Temperature Time & Temperature Summer Temperature & Power Production Time & Power Production 55


64 Turbine - 7 Average Wind Velocity & Power Production Time & Average Wind Velocity Average Wind Velocity & Temperature Time & Temperature Summer Temperature & Power Production Time & Power Production 56


65 Turbine - 8 Average Wind Velocity & Power Production Time & Average Wind Velocity Average Wind Velocity & Temperature Time & Temperature Summer Temperature & Power Production Time & Power Production 57


66 Turbine - 9 Average Wind Velocity & Power Production Time & Average Wind Velocity Average Wind Velocity & Temperature Time & Temperature Summer Temperature & Power Production Time & Power Production 58

67 Turbine - 10 Average Wind Velocity & Power Production Time & Average Wind Velocity Average Wind Velocity & Temperature Time & Temperature Summer Temperature & Power Production Time & Power Production 59


68 Turbine - 11 Average Wind Velocity & Power Production Time & Average Wind Velocity Average Wind Velocity & Temperature Time & Temperature Summer Temperature & Power Production Time & Power Production 60

69 Turbine - 12 Average Wind Velocity & Power Production Time & Average Wind Velocity Average Wind Velocity & Temperature Time & Temperature Summer Temperature & Power Production Time & Power Production 61


70 Turbine - 13 Average Wind Velocity & Power Production Time & Average Wind Velocity Average Wind Velocity & Temperature Time & Temperature Summer Temperature & Power Production Time & Power Production 62

71 Turbine - 14 Average Wind Velocity & Power Production Time & Average Wind Velocity Average Wind Velocity & Temperature Time & Temperature Summer Temperature & Power Production Time & Power Production 63
72 4.3 Wind rose Wind rose is the best way to show the typical distribution of wind velocity and direction in a particular region. This section shows wind rose analysis for one year data of each turbine s wind direction & wind speed. In order to be consistent with previous analysis, data from year 2014 have been used for wind rose analysis. WindRose PRO3 has been used to complete the wind rose analysis. The example below demonstrates the process: Worksheet with data: Sheet1 Column with directions: wtc_scyawpos_mean Column with data: wtc_sewindsp_mean Column with 3rd variable: Not used Column with dates: TimeStamp Date/time format: mm/dd/yyyy hh:mm:ss Total number of data in file: Number of valid data: Data filtering options: None 75th percentile: th percentile: Maximum value: Direction: 0 Angle: Data (%): Direction: 1 Angle: Data (%): Direction: 2 Angle: Data (%): Direction: 3 Angle: Data (%): Direction: 4 Angle: Data (%): Direction: 5 Angle: Data (%): Direction: 6 Angle: Data (%): Direction: 7 Angle: Data (%): Direction: 12 Angle: Data (%): Direction: 13 Angle: Data (%): Direction: 14 Angle: Data (%): Direction: 15 Angle: Data (%): Interval: 0 From: 0 To: 5 #Data: Data (%): Interval: 1 From: 5 To: 10 #Data: Data (%): Interval: 2 From: 10 To: 15 #Data: 8508 Data (%): Interval: 3 From: 15 To: 20 #Data: 3473 Data (%): Interval: 4 From: 20 To: 25 #Data: 762 Data (%): counts Exceeding frequency(%) Number of data after date/time filtering: Minimum value: 0 5th percentile: th percentile: th percentile: 6.41 Direction: 8 Angle: Data (%): Direction: 9 Angle: Data (%): Direction: 10 Angle: Data (%): Direction: 11 Angle: Data (%): Interval: 5 From: 25 To: 30 #Data: 11 Data (%): EXCEEDING FREQUENCIES (Calculated using >) Interval Counts Frequency(%) Value Exceeding Input directions rotated of 0 degree Direction: 0 Angle: Min: Avg: Max: Direction: 1 Angle: Min: Avg: Max:
73 Direction: 2 Angle: Min: Avg: Max: Direction: 3 Angle: Min: Avg: Max: Direction: 4 Angle: Min: Avg: Max: Direction: 5 Angle: Min: Avg: Max: Direction: 6 Angle: Min: Avg: Max: Direction: 7 Angle: Min: Avg: Max: Direction: 8 Angle: Min: Avg: Max: Direction: 9 Angle: Min: Avg: Max: Direction: 10 Angle: Min: Avg: Max: Direction: 11 Angle: Min: Avg: Max: Direction: 12 Angle: Min: Avg: Max: Direction: 13 Angle: Min: Avg: Max: Direction: 14 Angle: Min: Avg: Max: Direction: 15 Angle: Min: Avg: Max: CIRCULAR STATISTICS Interval: 0-5 Counts: Scalar average of direction: Scalar average of data: Vector average of direction: Vector average of data: Persistence: Standard deviation of direction: Root mean square of data: Variance of data: Variance of the X component of data: Variance of the Y component of data: Covariance of the X and Y components of data: Cross wind data variance: Along wind data variance: Interval: 5-10 Counts: Scalar average of direction: Scalar average of data: Vector average of direction: Vector average of data: Persistence: Standard deviation of direction: Root mean square of data: Variance of data: Variance of the X component of data: Variance of the Y component of data: Covariance of the X and Y components of data: Cross wind data variance: Along wind data variance: Interval: Counts: 8508 Scalar average of direction: Scalar average of data: Vector average of direction: Vector average of data: Persistence: Standard deviation of direction: Root mean square of data: Variance of data: Variance of the X component of data: Variance of the Y component of data: Covariance of the X and Y components of data: Cross wind data variance: Along wind data variance: Interval: Counts: 3473 Scalar average of direction: Scalar average of data: Vector average of direction: Vector average of data: Persistence: Standard deviation of direction: Root mean square of data: Variance of data: Variance of the X component of data: Variance of the Y component of data: Covariance of the X and Y components of data: Cross wind data variance: Along wind data variance: Interval: Counts: 762 Scalar average of direction:
74 Scalar average of data: Vector average of direction: Vector average of data: Persistence: Standard deviation of direction: Root mean square of data: Variance of data: Variance of the X component of data: Variance of the Y component of data: Covariance of the X and Y components of data: Cross wind data variance: Along wind data variance: Interval: Counts: 11 Scalar average of direction: Scalar average of data: Vector average of direction: Persistence: Standard deviation of direction: Root mean square of data: Variance of data: Variance of the X component of data: Variance of the Y component of data: Covariance of the X and Y components of data: Cross wind data variance: Along wind data variance: Interval: All data Counts: Scalar average of direction: Scalar average of data: Vector average of direction: Vector average of data: Persistence: Standard deviation of direction: Variance of data: Variance of the X component of data: Variance of the Y component of data: Covariance of the X and Y components of data: Cross wind data variance: Along wind data variance: AUTOCORRELATION AND STRUCTURE FUNCTION Distance Autocorrelation Structure function E E E E E E E E E E E E E E E E E E E E E E E E E E E E E E E E E E E E E E E E E E E E E E E E+000 Vector average of data: Root mean square of data: E E+000 Figure 4-22 shows the wind rose analysis of each wind turbine for year


75 Turbine 01 Figure 4-22 Wind rose analysis for year 2014 (14 turbines) Turbine 06 Turbine 11 Turbine 02 Turbine 07 Turbine 12 Turbine 03 Turbine 08 Turbine 13 Turbine 04 Turbine 09 Turbine 14 Turbine 05 Turbine 10 (velocity) (direction) Sample 68
76 From Figure 4-22, we can see that for five turbines wind rose plots show one main wind direction, eight turbines show two main directions, and one turbine s shows three main directions, as specified in Table 4-5. Table 4-5 Wind rose observations Number of wind direction Turbine Direction 1 main direction 2nd main direction Turbine 01 Turbine 03 Turbine 06 Turbine 08 Turbine 09 Turbine 02 Turbine 04 Turbine 05 Turbine 07 Turbine 10 Turbine 11 Turbine 12 Turbine 13 West East West East Sourthwest Northeast West East West East West East Northwest Sourthwest West East Northwest Sourthwest West East Sourthwest Northeast West East Northwest Sourthwest Sourthwest Northeast Northwest Sourthwest West East North South Northwest Sourthwest(*2) Sourthwest Northeast 3 rd main direction Turbine 14 Sourthwest Northeast Northwest Sourthwest(*2) 69
77 4.4 Annual Energy Production (AEP) Based on SCADA data sorting and analysis combined with real conditions of wind parks, the annual wind energy is one of the most significant factors in wind energy production. The database of 14 Turbines wind power production (GW) from 2013 to 2015 is shown in Table 4-6. Table years wind power production comparison for 14 turbines Wind power production (GW) Total (GW) T01 T T02 T T03 T T04 T T05 T T06 T T07 T T08 T T09 T T10 T T11 T T12 T T13 T T14 T Total

78 From Figure 4-23, we can see: Figure 4-23 Wind energy production comparison i. In 2013, 2014 and 2015, turbine 4531, 0574 and 4531 got the maximal wind power production respectively; ii. In 2013, 2014 and 2015, turbine 4537,4540 and 0575 got the minimal wind power production respectively; iii. In 2014, the total wind energy was the highest; turbine 4531 produced the most wind power during turbines monthly wind energy production for the three years is shown in Figure From these figures, we can easily see: i. The wind energy production in each year is highest in winter (October in first year to March of next year) and lowest in summer. ii. Figure 4-24 confirms that the observed trend of Wind Power Production over time in Figure 4-21 holds for 2013 and 2015 as well. 71

79 Figure 4-24 Wind energy of each turbines three years comparison 72


80 73
81 74
82 4.5 Findings Chapter 4 presents the results of SCADA data analysis for 3 years ( ) using all 14 wind turbines of Nygårdfjellet wind park. Comprehensive Vertical Interpolation analyses are presented with a comparison between different polynomial (4 th to 9 th ) forms, including linear analysis as reference. Based on the comparison, the best polynomial curve is chosen. Comprehensive Horizontal Interpolation analysis shows 1 year and each turbine s comparison between 6 functions (4 variables combination), then chooses the best correlations. Specific vertical and horizontal analysis shows with 3 years data each turbine s best polynomial curve (with linear reference) fitting and the comparison between highly related functions, as well as the inner comparison within each turbine (7 th polynomial with linear reference and 6 different functions). Windrose analysis shows for the year 2014 the graphical comparison between turbines wind direction & wind speed. Below are the main findings of these analyses. i. 7 th degree polynomial curve fitting (linear as reference) is found to be the best choice for wind park SCADA data regression analysis in this study. ii. Average Wind Speed & Wind Power Production and Time & Average Temperature are found to be the most suitable correlations. iii. Average Wind Velocity and Wind Power Production have the same trends over time (positive correlation), but the Average Temperature has the opposite trend with them (negative correlation); iv. Windrose analyses show that for Nygårdfjellet Wind Park, West East wind direction is the most common wind direction. v. In 2013, 2014 and 2015, turbine 4531, 0574 and 4531 got the maximal wind power production respectively; In 2013, 2014 and 2015, turbine 4537,4540 and 0575 got the minimal wind power production respectively; vi. In 2014, the total wind energy got the most, which is Gw; turbine 4531 produced the most wind power during Below are some issues experienced during SCADA data sorting and analysis: i. Row database from Nygårdfjellet wind park has some missing items, so Excel combination and MATLAB importation should do some numerical format change; ii. Data 0 and NONE have different meaning. 0 means that the sensor may have no data import but it worked. NONE means that the turbine is probably logged or no data collection; iii. In 2015 turbine 01 (0375), the goodness of fit of the Average Wind Velocity & Wind Power Production curve is just 30%. The reason may be too many missing items, which requires specific research afterwards; iv. In 2015 turbine 02 (0374), the plot of Average Wind Velocity & Wind Power Production has data exception situation: Normally wind power production could be around 0 to 2290, but in this case, its range is just 0 to 20. The reason may be that the sensor in turbine 02 has some measurement or detection problems. 75

83 5 Numerical Simulations The wind resource assessment most commonly uses microscale and mesoscale models. Microscale is the scale applicable order of 100 Km. In other words, microscales are used to show wind resource assessment over large areas, which can cover hundreds of square kilometres. Mesoscale describes the meteorological phenomena with 20 to 2000 Km spatial resolution. Moreover, the temporal resolution ranges from hours to days. Computational Fluid Dynamics (CFD) based microscale approach can simulate airflow behaviour over complex terrain, including thermal effects. It can be done by solving the Navier-Stokes equation, which is a nonlinear problem [21]. Three main inputs for CFD model are: elevation (digital terrain model), roughness map and stratification (wind data at multiple locations in a period) as shown in Figure 5-1[22]. Figure 5-1 CFD simulation approach [22] For this master thesis work we have used WindSim software which is a modern Wind park Design Tool (WFDT) that helps to optimize the wind parks energy production within acceptable limits by using non-linear mathematical methods. One year SCADA data (2014) for 14 wind turbines of Nygårdsfjellet Wind Park have been used for this study. Table 5-1 shows the main inputs required to setup the WindSIM simulations. Input Files.gws.wws.pws.ows Significance Grid WindSim File Climatology File Power WindSim File Object WindSim File Table 5-1 WindSim main input files 76

84 Figure 5-2 WindSim simulation structure 77

85 5.1 CFD software- WindSim Four main inputs are required for WindSim CFD simulations:.ows,.gws,.pws,.wws. Among them,.pws is built from Nygårdfjellet Nordkraft Vind Company based on real wind product condition;.ows and.gws files could be built with WindSim Express 8.0 at the same time;.wws could be built in Excel and then put into Notepad. WindSim is a new climatology Wind park Design Tool (WFDT) to optimize the energy production for target wind park design. Moreover, it can generate a digital terrain, which is called micro-siting numerical wind fields. The modules in WindSim are Terrain, Wind Fields, Objects, Results, Wind Resources and Energy. A complete micro-siting process needs to finish all these six modules in turn as shown in Figure 5-3 from left to right. The functions of those six modules are: Figure 5-3 WindSim modules processing a) Terrain establish the numerical model based on the data of elevation and roughness; b) Wind Fields calculation of the numerical wind parks model; c) Objects set up and process the climatology database and wind turbines; d) Results analyze numerical wind parks; e) Wind Resources through statistical methods, using climatology data and numerical result from wind parks to provide Wind Resources maps. f) Energy through statistical methods, using climatology data and numerical result from wind parks to calculate Annual Energy Production (AEP), contains wake loses. Moreover, make sure the characteristic for wind turbine loads. For the WindSim simulation of Nygårdfjellet wind parks, following steps have been used for the six modules. 1. Create a new project named Nygardfjellet, give a name of layout and then define customer. In addition, choose.gws, which is created from WindExpress (shows as 5.1.2). Click ok. As Figure 5-4 shows. 78
86 Figure 5-4 Create new project in WindSim 2. Change the properties as Figure 5-5 shows. The terrain extension values need to contains Nygårdfjellet wind parks region. In this projectwind park, the roughness and elevation are chosen from the grid generated from WindSim Express. The number of cells in Z direction is the default number 20. Figure 5-5 Properties setup in terrain module 3. In Wind Fields module, choose 12 for the number of sectors and uniform distribution of the sector angles for the input type, and 300 meters of boundary layer height, wind parkbased on the actual conditions of the wind parks. In addition, in physical models, for the turbulence model choose RNG k-epsilon, because ReNormalization Group (RNG) modifies standard k-ε model. The range of iteration number is from 100 to Choose 500 as Nygårdfjellet wind parks simulation iterations and as convergence criteria standard in this model. The General Collected Velocity method (CGV) solar chosen from parameter calculation have two features: First, CGV methods could use a block-structured multi-block formulation; second, CGV can handle highly non-orthogonal girds that could cover angles as small as 10 degrees and does much better than separation solver. It is worth emphasizing that convergence monitoring X and Y spot values are the centre points of the ranges of X and Y from step 2, which are defined in terrain extension model. The properties setup in Wind Files module is shown as Figure
87 Figure 5-6 Properties setup in Wind Fields module 4. The Object module is used to position wind turbines and transfer climatology.. Climatology object needs to be built in the start. In this project, choose turbine 0575 as climatology object. Shows as Figure 5-7. See Section for how to build the climatology files ( wws ). 14 turbines in Nygårdfjellet wind parks are transferred to this climatology object. Figure 5-7 Climatology object built 5. Once the climatology is built (in step 4) and the 14 turbines are transferred from WindSim Express (see following section 5.1.2), we can set up the objects as Figure 5-8 shows. Figure 5-8 Climatology and 14-transfer climatology objects setup 80
88 6. The results of wind fields are stored in a database which could keep wind data from ground to the Height of reduced wind database. Choose Speed scalar XYZ in normalisation variable and planers heights are 60 and 80 meters. The properties are shown in Figure 5-9. Figure 5-9 Properties setup in Objects module 7. In the Wind Resources module choose Wake Model 1 Jensen model [30], which leads the wake decay factor to increase with increasing level of ambient turbulence whose typical range is from 0.04 to The properties are shown in Figure Figure 5-10 Properties setup in Wind Resources module 8. In Energy Module, choose Wake Model 1 as in step 7. The heights of reference product are 60, 80 and 100 meters. 80 meters is the climatology Wind turbine s position. The properties are shown in Figure Figure 5-11 Properties setup in Energy module 81
 which will be imported to WindSim to complete CFD modules. 1. Open WindSim Express 8.0 software and click Next bottom in the right corner, as Figure 5-12 shows.")
89 5.1.1 WindSim Express WindSim Express accompanies WindSim to create CFD model-based micro-siting procedures. We use it to create the.ows file (obtain.gws file) which will be imported to WindSim to complete CFD modules. 1. Open WindSim Express 8.0 software and click Next bottom in the right corner, as Figure 5-12 shows. Figure 5-12 Start WindSim Express 2. Create a new project in WindSim project which is located at C Disk (the same disk as WindSim builder is), define layout and customer and then click Next as Figure 5-13 shows. Figure 5-13 WindSim project 3. Build.ows files in layout. Choose.pws files which is from Nygårdfjellet Nordkraft Vind Company. Define the turbine height as 80m, and the rotator diameter as 90m. Select UTM 33 zone in Coordinate Systems (datum is WGS84 and the units is METERS) and input 14 turbines coordinates. Click Ok. See Figure
 ; c. Map Image dataset from World Imagery ; d. Chose No at import map. Click Next as Figure 5-15 shows.")
 in Figure 5-16.")
90 Figure 5-14 Object layout 4. After ows files is built, choose map data source: a. Elevation dataset from ASTER.GDEM V2 Worldwide Elevation Data ; b. Roughness dataset from GlobCover ESA 2009 (Global Land Cover) ; c. Map Image dataset from World Imagery ; d. Chose No at import map. Click Next as Figure 5-15 shows. Figure 5-15 Map dataset 5. The simulated wind park which we build according to the parameters of Nygårdsfjellet wind park is shown (with an enlarged view of the selected area) in Figure Click Switch to WindSim bottom at left corner. (Alternatively, click Next bottom at right corner and switch to cloud.) Figure 5-16 Nygårdsfjellet wind park 83

, and copy red box of #Data as the sum of different ranges of wind speed (25 ranges) to the Excel created in step 1, as Figure")
91 5.1.2 MS Excel to Notepad The dataset output from WindRose PRO3 (in chapter 4) is of MS Excel format. We need to reorganize this dataset and generate 14.wws files for the 14 turbines respectively. Here we take turbine 0575 for an example. Others turbine s.wws files are created in the same way. 1. Copy Joint frequencies and transpose to another Excel work sheet, shown as Figure Figure 5-17 Database in 12 wind directions and 25 different ranges of wind speed 2. Copy blue box of #Data as the sum of different directions (12 sectors), and copy red box of #Data as the sum of different ranges of wind speed (25 ranges) to the Excel created in step 1, as Figure 5-18 shows. Figure 5-18 Choose sum of the data 3. Create a new Excel sheet and follow the steps shown in Figure Region 1 is the dataset generated in step 1 and step 2. To create region 2 (region 3), we sum the data in each row (column) of region 1 and divide every element in region 1 by the sum of its row (column), i.e., normalize data with respect to wind speed (direction). Region 4 is final region that we use in.wws files. The region 4 is created with the data in region 1 divided by the sum of data. Check whether the numbers in the last row of region 4 sum to 1. 84

.")
92 Figure 5-19.wws sub model in Excel 4. Following the requirement in WindSim 8.0.0, the.wws files are created as Figure 5-20 shows. 5.2 CFD simulation Figure 5-20.wws files CFD simulation has been carried out using WindSim for Nygårdsfjellet wind park. The simulated wind climate is contrary to the real wind climate in Nygårdsfjellet. The average wind conditions of Nygårdsfjellet wind park are used to calibrate wind resources and estimate annual energy production (AEP) Local wind climatology For wind climatology Turbine 0575 of Nygårdsfjellet wind park is used (Table 5-2). Wind rose shown in Figure 5-21 (output from WindSim same as turbine 0575 wind rose shown in chapter 4), with the average wind speed distribution divided in wind direction (sectors) and velocity intervals (bins). The original wind speed is 1m/s per bins. Graphical wind rose shows all occurrences of wind speed above 16 m/s. The wind directions are divided into 12 sectors, where the first sector is pointed centre of north. In addition, the frequency distribution has been fitted to Weibull distribution, shown as Figure Table 5-3 shows Weibull frequency distribution. 85


93 File name Nygardsfjellet Time Period to Position: easting, northing, z (agl) Average wind speed, Weibull k, A Table 5-2 Climatology characteristics including average wind speed (m/s) for all sectors, Weibull shape (k) and scale (A) parameters for all sectors Figure 5-21 Wind Rose of climatology Figure 5-22 Frequency distribution with Weibull fitting Average wind speed (m/s) Frequency (%) Weibull shape, k Weibull scale, A Table 5-3 Average wind speed, frequency and Weibull shape (k) & scale (A) parameters versus sectors Wind parks layout and turbines 86

94 Nygårdsfjellet wind park layout is presented in figure Turbine 0575 is used as climatology for this study. Enlarged View Figure 5-23 Nygårdsfjellet wind park 14 turbines layout Figure 5-24 Google Earth map of Nygårdsfjellet wind park 14 turbines layout Turbine Turbine name Turbine type Hub height East North z 0575 wecs1 SWT VS wecs2 SWT VS wecs3 SWT VS wecs4 SWT VS wecs5 SWT VS wecs6 SWT VS wecs7 SWT VS wecs8 SWT VS wecs9 SWT VS wecs10 SWT VS wecs11 SWT VS wecs12 SWT VS wecs13 SWT VS wecs14 SWT VS Table 5-4 Wind turbine specifications 87

95 Turbine type SWT VS Cut-in wind speed (m/s) 3m/s Cut-off wind speed (m/s) 25m/s Diameter (m) air density (kg/m3) Wind Speed (m/s) Power (kw) Thrust Coefficient Table 5-5 Nygårdsfjellet wind park technical specifications By using turbine SWT VS and importing the.ows files from WindSim Express 8.0.0, the turbine characteristics with power and thrust coefficient are shown as Figure Figure 5-25 Turbine characteristics with power and thrust coefficient 88

96 5.2.2 Numerical simulation In this section, we establish a CFD simulation model of the numerical wind database from Nygårdsfjellet Wind park, and explain how it is built, simulated and validated. This numerical simulation is used to study the wind condition from the measurement point to the position of wind turbine hub Digital terrain model As Figure 5-26 and Table 5.6 demonstrate, a digital terrain model with elevation and roughness data has been established for the area. Figure 5-26 Terrain elevation (m) (left) and roughness (m) (right) Min (m) Max (m) Extension (m) Resolution Terrain Data (m) East (m) North (m) Table 5-6 Digital terrain model referring to coordinate system The coordinate system is UTM and in 33 zone (Datum: WGS84), which is the coordinate system in Google Earth. In Nygårdsfjellet project, choose ASTER GDEM v2 as the elevation data map and GlobCover ESA 2009 (Global land Cover -300m Resolution) as roughness data map. The complexity of wind park site depends on the change of elevation and roughness data. The Terrain inclination and logarithmic roughness are shown as Figure
 The elevation and roughness model defined above is also used to define the 3D ground level that")


97 D model setup Figure 5-27 Terrain inclination (deg) (left) and logarithmic roughness (m) (right) The elevation and roughness model defined above is also used to define the 3D ground level that is divided in 20 cells (could be a variable vertical and horizontal resolution), shown as Table 5-7. The grids are generated and optimized from digital terrain model as Figure East North z Total Grid spacing (m) Variable - Number of cells Table 5-7 Grid spacing and cells Figure 5-28 Horizontal grid resolution (left) and schematic view of the vertical grid resolution (right) 90
 31.4 109.0 216.4 353.6 520.4 717.0 943.4 1199.")

98 The grids maximum and minimum of the points elevation could be displayed in a schematic view of the distribution. Distribution of elevation of the first 10 nodes in z-direction, relative to the ground, are shown in Table z-dist. max (m) z-dist. min (m) Table 5-8 Elevation of first 10 nodes in Z direction The open area between the ground and upper boundary is calculated as the model is traversed in westeast and south-north direction. The maximum area is displayed as black rectangles while a red profile displays the ground level of the minimum area. The upper plot is for the traverse in west-east direction and the lower plot for the traverse in south-north direction. If the fraction between the minimum and maximum of the open area becomes too small, blocking effects might lead to unphysical speed-ups. See Figure 5-29 and Table 5-9 below. Figure D model open area Min (m 2 ) Max (m 2 ) Min/Max Open area, west-east traverse Open area, south-north traverse Table 5-9 Open area data Numerical Simulation For numerical simulation, a model that represents the Reynolds averaged Navier Stokes equation has been solved numerically as Table 5-10 sets. Totally, 12 simulations have been performed and every 30 degree sector has a 3D wind fields. The number of iteration and simulation time are shown as Table Height of boundary layer (m) Speed above boundary layer (m/s) 10.0 Boundary condition at the top fix pres. Potential temperature No Turbulence model RNG k-e Solver GCV Maximum iterations 500 Table 5-10 Solvers settings 91


99 Sectors Simulation time Iterations Status Sectors Simulation time Iterations Status :01:39 88 C :01:43 94 C :01:40 90 C :01:32 82 C :01:37 88 C :01:35 85 C :01:47 97 C :01:48 98 C :01:44 84 C :01:45 84 C :01:41 85 C :01:41 84 C Table 5-11 Simulation time, number of iterations and convergence status In Table 5-11, Status C means the numerical procedure has converged. It means this solution is an actual solution of our specified problem. If the status shows D for divergence or a -, it indicates that the solution procedure has reached the maximal number of interactions before convergence. In order to assess the convergence of Nygårdsfjellet wind field, we need to check the spot and residual values of velocity components (U1,V1,W1), the turbulent kinetic energy (KE) and its dissipation rate (EP). According to the maximum and minimum, all the variables are scaled during the simulation. The simulation stops automatically when the solution falls below a certain convergence criteria, and the solution is called to be convergent. The 12 spot values and residual values are shown in Figure 4-30 (1) to (12). Figure 5 30 Spot values and residual values in assessment (1) Sector 000 (2) Sector

")

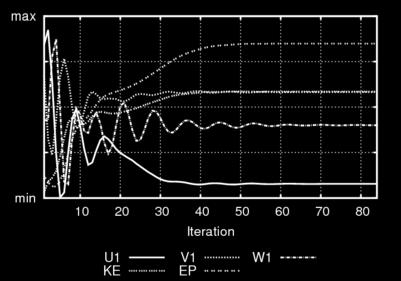


100 (3) Sector 060 (4) Sector 090 (5) Sector 120 (6) Sector

")


101 (7) Sector 180 (8) Sector 210 (9) Sector 240 (10) Sector


102 (11) Sector 300 (12) Sector Annual Energy Production (AEP) The Annual Energy Production (AEP) is the most significant parameter estimated in the majority of wind parks micro-siting projects. According to long term on-site wind production and CFD resolutions, the wind resource map and the AEP have been calculated Wind resource map Based on the average wind velocity, wind resource map identifies high wind velocity regions. Combining CFD solution and the expected average conditions of wind resources together can establish the wind resource map. In Nygårdsfjellet wind park simulation, two hub heights are used for comparison, 60m and 80m. The wind resources are shown as Figure 5-30 (1) to (3). 95
 The wind resource map with average wind speed (m/s) at the hub height of 60m (left) and 80m (right) for Nygårdsfjellet wind")
103 Figure 5-30 Wind resource map (1) The wind resource map with average wind speed-wake deficit (m/s) at the hub height of 60m (left) and 80m (right) for Nygårdsfjellet wind park (2) The wind resource map with average wind speed (m/s) at the hub height of 60m (left) and 80m (right) for Nygårdsfjellet wind park 96

 shows that the wind speed at the hub height of 80m is higher than that at 60m, and the high wind speed area is also larger at 80m; 2.")
104 (3) The wind resource map with power density (W/m 2 ) at the hub height of 60m (left) and 80m (right) for Nygårdsfjellet wind park For a cross check in wind resources part, we choose 80m as the hub height which wind turbines already use. Because only heights below the Height of reduced wind database specified in the Wind Fields module are valid, we choose 60 m as the hub height for comparison. From the above graphs, we can see: 1. The wind resource map with mean wind speed (with deficit or not) shows that the wind speed at the hub height of 80m is higher than that at 60m, and the high wind speed area is also larger at 80m; 2. The wind resource map with Power density (W/m 2 ) shows that at height 80m power production is higher than height 60m. The main reason why 80m is much better in terms of wind resources lies in the atmospheric boundary layer effects. When the atmospheric boundary layer changes in different altitude, the wake effects vary, so the atmospheric boundary layers have effect on this wind resources result Energy production estimation Gross energy production is calculated with the free stream wind velocity (or speed) distribution according to every turbine s hub height and power curve. The wake model 1 in WindSim could simulate the free stream wind speed distribution of wind flow model based on the actual long term conditions. In addition, the potential of Nygårdsfjellet Wind Park s energy production is obtained by considering the wake losses. Through WindSim CFD simulation, the characteristics of annual Nygårdsfjellet wind park production is shown as Table
105 Turbine Type SWT VS Hub Height (m) No. of turbines Capacity (MW) Gross AEP (GWh/y) Average wind speed (m/s) Wake losses (%) AEP with wake losses (GWh/y) Full load hours (hours) Table 5-12 Nygårdsfjellet wind park annual energy production In addition, the frequency distribution of wind energy production wake losses is shown as Table Gross AEP AEP with wake Wake losses Wake Climatology name (GWh/y) losses (GWh/y) (GWh/y) losses (%) Nygardsfjellet Table 5-13 Nygårdsfjellet wind park frequency distribution Moreover, through WindSim CFD simulation, the annual energy production of each turbine is also shown in Table Turbine name wecs1 wecs2 wecs3 wecs4 wecs5 wecs6 wecs7 wecs8 wecs9 wecs10 wecs11 wecs12 wecs13 wecs14 Turbine type Air density (kg/m3) Average wind speed (m/s) Gross AEP (GWh/y) Wake Losses (%) AEP with wake losses (GWh/y) Full load hours (hours) SWT VS SWT VS SWT VS SWT VS SWT VS SWT VS SWT VS SWT VS SWT VS SWT VS SWT VS SWT VS SWT VS SWT VS Table 5-14 Nygårdsfjellet wind park 14 turbines annually wind production 98
106 According to the CFD simulation, the annual energy production is GWh/y with wake losses. Comparison with AEP from SCADA part in chapter 4 is shown in Table The yellow regions are where the SCADA AEP is bigger than the gross AEP in CFD simulation, which means the actual wind energy production is ideal in turbine 0573, 4531, 4532, 4533 and With wake loss in CFD simulation, the orange regions show where the actual SCADA AEP is smaller than the AEP with wake loss, which means the annual power production in turbine 4535, 4536, 4537, 4538, 4539 and 4540 are not ideal in this regions, and need to change or rebuild the wind turbine sites to improve the actual wind power productions. Turbine Gross AEP (GWh/y) AEP with wake losses (GWh/y) SCADA AEP (GWh/y) SCADA AEP/Gross AEP Production loss 1 SCADA AEP/AEP with wake loss Production loss 2 T % 10.05% % -6.00% T % 1.84% % -8.76% T % -0.70% % % T % -2.11% % -7.50% T % -2.88% % % T % -4.13% % % T % 2.27% % % T % 13.11% 90.29% 9.71% T % 9.44% 98.05% 1.95% T % 9.52% 93.42% 6.58% T % 9.94% 93.72% 6.28% T % 5.02% 98.30% 1.70% T % 10.40% 91.88% 8.21% T % -8.42% % -9.94% Total % 4.10% % -3.09% Table 5-15 SCADA AEP compare with AEP in CFD model 99

107 Figure 5-31 AEP comparison between SCADA and CFD From this figure, we can easily compare the AEP of all 14 turbines in percentage. We can also compare SCADA AEP with gross AEP and AEP with wake loss. The trends show that SCADA AEP is in the middle of Gross AEP and AEP with wake loss in CFD simulation, in addition, AEP with wake loss is smaller than Gross AEP. In other words, it means SCADA AEP resolution is ideal. 5.3 Findings WindSim has been used to do the CFD simulation of Nygårdsfjellet Wind Park for year Based on the methodology the numerical wind flow modeling is used to transfer the wind conditions from a spot value to the wind turbines position of hub height. Annual energy production estimation has been carried our in comparison with actual field SCADA data. A good agreement has been found between CFD simulations and actual wind production. In AEP estimation which has wake loss based on Jensen model [23], the AEP in 2014 is 103.2GWh/y with Jensen wake model losses (7% annually). Comparison between gross AEP and AEP with wake loss and the trends show that SCADA AEP/ Gross AEP is smaller than SCADA AEP/AEP with wake loss. In other words, it means AEP with wake loss is smaller than Gross AEP. 100
Site assessment for a type certification icing class Fraunhofer IWES Kassel, Germany
 Site assessment for a type certification icing class Kai Freudenreich 1, Michael Steiniger 1, Zouhair Khadiri-Yazami 2, Ting Tang 2, Thomas Säger 2 1 DNV GL Renewables Certification, Hamburg, Germany kai.freudenreich@dnvgl.com,
Estimating icing in Finnish climate conditions
 VTT TECHNICAL RESEARCH CENTRE OF FINLAND LTD Estimating icing in Finnish climate conditions Ville Lehtomäki, Timo Karlsson, Simo Rissanen, VTT Teppo Hilakivi, Puhuri Oy Staffan Asplund, Etha Wind Wind
June 2011 Wind Speed Prediction using Global and Regional Based Virtual Towers in CFD Simulations
 June 2011 Wind Speed Prediction using Global and Regional Based Virtual Towers in CFD Simulations Master of Science in Wind Power Project Management By Roger Moubarak Energy Technology at Gotland University
Generating Virtual Wind Climatologies through the Direct Downscaling of MERRA Reanalysis Data using WindSim
 Generating Virtual Wind Climatologies through the Direct Downscaling of MERRA Reanalysis Data using WindSim WindSim Americas User Meeting December 4 th, 2014 Orlando, FL, USA Christopher G. Nunalee cgnunale@ncsu.edu
The Global Wind Atlas: The New Worldwide Microscale Wind Resource Assessment Data and Tools
 ICEM 2015, Boulder, Colorado USA The Global Wind Atlas: The New Worldwide Microscale Wind Resource Assessment Data and Tools Jake Badger, Neil Davis, Andrea Hahmann, Bjarke T. Olsen Xiaoli G. Larsén, Mark
DNV GL s empirical icing map of Sweden and methodology for estimating annual icing losses
 ENERGY DNV GL s empirical icing map of Sweden and methodology for estimating annual icing losses An update with further Nordic data Till Beckford 1 SAFER, SMARTER, GREENER Contents Experience from operational
W I N D R E S O U R C E A S S E S S M E N T
 W I N D R E S O U R C E A S S E S S M E N T Annual Energy Production Project: Hundhammer_WS_Express Layout: Layout1 Customer: WindSim 2014-01-29 WindSim AS Fjordgaten 15, N- 3125 Tønsberg, Norway phone.:
Wind Resource Assessment Practical Guidance for Developing A Successful Wind Project
 December 11, 2012 Wind Resource Assessment Practical Guidance for Developing A Successful Wind Project Michael C Brower, PhD Chief Technical Officer Presented at: What We Do AWS Truepower partners with
Quantification of energy losses caused by blade icing and the development of an Icing Loss Climatology
 Quantification of energy losses caused by blade icing and the development of an Icing Loss Climatology Using SCADA data from Scandinavian wind farms Staffan Lindahl Winterwind 201 1 SAFER, SMARTER, GREENER
Vindkraftmeteorologi - metoder, målinger og data, kort, WAsP, WaSPEngineering,
 Downloaded from orbit.dtu.dk on: Dec 19, 2017 Vindkraftmeteorologi - metoder, målinger og data, kort, WAsP, WaSPEngineering, meso-scale metoder, prediction, vindatlasser worldwide, energiproduktionsberegninger,
AN INTERNATIONAL SOLAR IRRADIANCE DATA INGEST SYSTEM FOR FORECASTING SOLAR POWER AND AGRICULTURAL CROP YIELDS
 AN INTERNATIONAL SOLAR IRRADIANCE DATA INGEST SYSTEM FOR FORECASTING SOLAR POWER AND AGRICULTURAL CROP YIELDS James Hall JHTech PO Box 877 Divide, CO 80814 Email: jameshall@jhtech.com Jeffrey Hall JHTech
EWEA 2016 Methods for Detection of Icing Losses in Scada Data. Staffan Asplund, Christian Granlund Etha Wind Oy Teppo Hilakivi, Puhuri Oy
 EWEA 2016 Methods for Detection of Icing Losses in Scada Data Staffan Asplund, Christian Granlund Etha Wind Oy Teppo Hilakivi, Puhuri Oy Understanding Icing Extreme difference between WTG suppliers operational
Wind Forecasts in Complex Terrain Experiences with SODAR and LIDAR
 Wind Forecasts in Complex Terrain René Cattin, Saskia Bourgeois, Silke Dierer, Markus Müller, Sara Koller Meteotest, Switzerland Private company founded in 1981 28 employees Any kind of meteorological
RESULTS OF THE NEW ICETOOLS INQUIRY ON OPERATOR S EXPERIENCE WITH TURBINE ICING
 RESULTS OF THE NEW ICETOOLS INQUIRY ON OPERATOR S EXPERIENCE WITH TURBINE ICING Michael Durstewitz Institut für Solare Energieversorgungstechnik e.v. (ISET) Division Information and Energy Economy Königstor
The use of high resolution prediciton models for energy asessment -challenges in cold climate. Gard Hauge
 The use of high resolution prediciton models for energy asessment -challenges in cold climate Gard Hauge gard.hauge@stormgeo.com Outline Models and methods Wind Resource Mapping Challenges in cold climate
Microscale Modelling and Applications New high-res resource map for the WASA domain and improved data for wind farm planning and development
 Microscale Modelling and Applications New high-res resource map for the WASA domain and improved data for wind farm planning and development Niels G. Mortensen, Jens Carsten Hansen and Mark C. Kelly DTU
Simulating the Vertical Structure of the Wind with the WRF Model
 Simulating the Vertical Structure of the Wind with the WRF Model Andrea N Hahmann, Caroline Draxl, Alfredo Peña, Jake Badger, Xiaoli Lársen, and Joakim R. Nielsen Wind Energy Division Risø National Laboratory
1. Wind turbines are designed to operate within specified design criteria. Often the operating environment extends beyond these limits and causes
 1 2 1. Wind turbines are designed to operate within specified design criteria. Often the operating environment extends beyond these limits and causes outages. How these outages are classified can be challenging
Kommerciel arbejde med WAsP
 Downloaded from orbit.dtu.dk on: Dec 19, 2017 Kommerciel arbejde med WAsP Mortensen, Niels Gylling Publication date: 2002 Document Version Peer reviewed version Link back to DTU Orbit Citation (APA): Mortensen,
WindNinja Tutorial 3: Point Initialization
 WindNinja Tutorial 3: Point Initialization 6/27/2018 Introduction Welcome to WindNinja Tutorial 3: Point Initialization. This tutorial will step you through the process of downloading weather station data
Interim (5 km) High-Resolution Wind Resource Map for South Africa
 High-Resolution Wind Resource Map for South Africa") Interim (5 km) High-Resolution Wind Resource Map for South Africa Metadata and further information October 2017 METADATA Data set name Interim (5 km) High-Resolution Wind Resource Map for South Africa
Interim (5 km) High-Resolution Wind Resource Map for South Africa Metadata and further information October 2017 METADATA Data set name Interim (5 km) High-Resolution Wind Resource Map for South Africa
Design of a measurement arrangement for estimating the icing duration of wind turbines prior erection
 Design of a measurement arrangement for estimating the icing duration of wind turbines prior erection Master thesis Sebastian Haym 1 Cooperation partners for this master thesis Michael J. Moser, Hubert
Wind Resource Data Summary Cotal Area, Guam Data Summary and Transmittal for December 2011
 Wind Resource Data Summary Cotal Area, Guam Data Summary and Transmittal for December 2011 Prepared for: GHD Inc. 194 Hernan Cortez Avenue 2nd Floor, Ste. 203 Hagatna, Guam 96910 January 2012 DNV Renewables
A comparative and quantitative assessment of South Africa's wind resource the WASA project
 A comparative and quantitative assessment of South Africa's wind resource the WASA project Jens Carsten Hansen Wind Energy Division Risø DTU Chris Lennard Climate Systems Analysis Group University of Cape
Investigating Factors that Influence Climate
 Investigating Factors that Influence Climate Description In this lesson* students investigate the climate of a particular latitude and longitude in North America by collecting real data from My NASA Data
What is a wind atlas and where does it fit into the wind energy sector?
 What is a wind atlas and where does it fit into the wind energy sector? DTU Wind Energy By Hans E. Jørgensen Head of section : Meteorology & Remote sensing Program manager : Siting & Integration Outline
Geospatial Tactical Decision Aids
 Geospatial Tactical Decision Aids Miguel Pacheco Abstract Environmental conditions are known to affect the efficiency and effectiveness of military platforms, weapon systems and personnel. The translation
WYANDOTTE MUNICIPAL SERVICES COMMUNITY WIND ENERGY PROJECT WIND RESOUCE SUMMARY
 WYANDOTTE MUNICIPAL SERVICES COMMUNITY WIND ENERGY PROJECT WIND RESOUCE SUMMARY MONTHLY REPORT October 15, 2007 Black & Veatch Project: 144374 Prepared by: Black & Veatch Corporation 6300 S. Syracuse Way
Why WASA an introduction to the wind atlas method and some applications
 Why WASA an introduction to the wind atlas method and some applications Jens Carsten Hansen and Niels G. Mortensen DTU Wind Energy (Dept of Wind Energy, Technical University of Denmark) Eugene Mabille,
Wind Atlas for South Africa (WASA)
") Wind Atlas for South Africa (WASA) Andre Otto (SANEDI), Jens Carsten Hansen (DTU Wind Energy) 7 November 2014 Outline Why Wind Resource Assessment Historical South African Wind Atlases Wind Atlas for South
Wind Atlas for South Africa (WASA) Andre Otto (SANEDI), Jens Carsten Hansen (DTU Wind Energy) 7 November 2014 Outline Why Wind Resource Assessment Historical South African Wind Atlases Wind Atlas for South
Wind Assessment & Forecasting
 Wind Assessment & Forecasting GCEP Energy Workshop Stanford University April 26, 2004 Mark Ahlstrom CEO, WindLogics Inc. mark@windlogics.com WindLogics Background Founders from supercomputing industry
Estimating icing losses at proposed wind farms
 ENERGY Estimating icing losses at proposed wind farms An update of DNV GL s empirical methods for estimating icing losses at proposed wind farms Till Beckford 1 SAFER, SMARTER, GREENER Contents Operational
wind power forecasts
 wind power forecasts the user friendly forecast studio about aiolos users Aiolos is Vitec s market-leading tool for effective management for all of your forecasts. With Aiolos it is possible to predict
Achieving Reliable Energy Production During Winter Months
 Achieving Reliable Energy Production During Winter Months Monelle Comeau CanWEA 2017 2017-10-05 1 AGENDA 1 Overview of ENERCON s Icing and Cold Climate Innovations 2 Ice Detection System Evaluations Technology
WEATHER AND CLIMATE COMPLETING THE WEATHER OBSERVATION PROJECT CAMERON DOUGLAS CRAIG
 WEATHER AND CLIMATE COMPLETING THE WEATHER OBSERVATION PROJECT CAMERON DOUGLAS CRAIG Introduction The Weather Observation Project is an important component of this course that gets you to look at real
Icing prediction on blade wind turbine using forecast data
 Icing prediction on blade wind turbine using forecast data From Antoine Amossé, instrumentation and control Engineer Summary 1. Context & Challenge 2. Data integration and algorithm 3. Results 4. Conclusion
Evaluating Physical, Chemical, and Biological Impacts from the Savannah Harbor Expansion Project Cooperative Agreement Number W912HZ
 Evaluating Physical, Chemical, and Biological Impacts from the Savannah Harbor Expansion Project Cooperative Agreement Number W912HZ-13-2-0013 Annual Report FY 2018 Submitted by Sergio Bernardes and Marguerite
WindNinja Tutorial 3: Point Initialization
 WindNinja Tutorial 3: Point Initialization 07/20/2017 Introduction Welcome to. This tutorial will step you through the process of running a WindNinja simulation that is initialized by location specific
CSO Climate Data Rescue Project Formal Statistics Liaison Group June 12th, 2018
 CSO Climate Data Rescue Project Formal Statistics Liaison Group June 12th, 2018 Dimitri Cernize and Paul McElvaney Environment Statistics and Accounts Presentation Structure Background to Data Rescue Project
Appendix 4 Weather. Weather Providers
 Appendix 4 Weather Using weather data in your automation solution can have many benefits. Without weather data, your home automation happens regardless of environmental conditions. Some things you can
Worksheet: The Climate in Numbers and Graphs
 Worksheet: The Climate in Numbers and Graphs Purpose of this activity You will determine the climatic conditions of a city using a graphical tool called a climate chart. It represents the long-term climatic
Validation of Icing atlases using SCADA data
 VTT TECHNICAL RESEARCH CENTRE OF FINLAND LTD Validation of Icing atlases using SCADA data Timo Karlsson Research Scientist, VTT Technical Research Center of Finland Winterwind 2016, Åre, Sweden Aim Compare
Regional influence on road slipperiness during winter precipitation events. Marie Eriksson and Sven Lindqvist
 Regional influence on road slipperiness during winter precipitation events Marie Eriksson and Sven Lindqvist Physical Geography, Department of Earth Sciences, Göteborg University Box 460, SE-405 30 Göteborg,
Numerical Modelling for Optimization of Wind Farm Turbine Performance
 Numerical Modelling for Optimization of Wind Farm Turbine Performance M. O. Mughal, M.Lynch, F.Yu, B. McGann, F. Jeanneret & J.Sutton Curtin University, Perth, Western Australia 19/05/2015 COOPERATIVE
Climate Variables for Energy: WP2
 Climate Variables for Energy: WP2 Phil Jones CRU, UEA, Norwich, UK Within ECEM, WP2 provides climate data for numerous variables to feed into WP3, where ESCIIs will be used to produce energy-relevant series
SOFTWARE FOR WEATHER DATABASES MANAGEMENT AND CONSTRUCTION OF REFERENCE YEARS
 SOFTWARE FOR WEATHER DATABASES MANAGEMENT AND CONSTRUCTION OF REFERENCE YEARS Marco Beccali 1, Ilaria Bertini 2, Giuseppina Ciulla 1, Biagio Di Pietra 2, and Valerio Lo Brano 1 1 Department of Energy,
Data Structures & Database Queries in GIS
 Data Structures & Database Queries in GIS Objective In this lab we will show you how to use ArcGIS for analysis of digital elevation models (DEM s), in relationship to Rocky Mountain bighorn sheep (Ovis
EVALUATION OF OPERATIONAL DATA IN RESPECT TO PRODUCTION LOSSES DUE TO ICING
 EVALUATION OF OPERATIONAL DATA IN RESPECT TO PRODUCTION LOSSES DUE TO ICING Annette Westerhellweg, Kai Mönnich DEWI GmbH, Wilhelmshaven, Germany, Tel. 0049 4421 4808 828, Fax. 0049 4421 4808 43, a.westerhellweg@
elgian energ imports are managed using forecasting software to increase overall network e 칁 cienc.
 Elia linemen install Ampacimon real time sensors that will communicate with the dynamic thermal ratings software to control energy import levels over this transmission line. OV RH AD TRAN MI ION D namic
LATE REQUEST FOR A SPECIAL PROJECT
 LATE REQUEST FOR A SPECIAL PROJECT 2014 2016 MEMBER STATE: ITALY Principal Investigator 1 : Affiliation: Address: E-mail: Other researchers: Prof. Luca G. Lanza WMO/CIMO Lead Centre B. Castelli on Precipitation
J17.3 Impact Assessment on Local Meteorology due to the Land Use Changes During Urban Development in Seoul
 J17.3 Impact Assessment on Local Meteorology due to the Land Use Changes During Urban Development in Seoul Hae-Jung Koo *, Kyu Rang Kim, Young-Jean Choi, Tae Heon Kwon, Yeon-Hee Kim, and Chee-Young Choi
Windcube TM Pulsed lidar wind profiler Overview of more than 2 years of field experience J.P.Cariou, R. Parmentier, M. Boquet, L.
 Windcube TM Pulsed lidar wind profiler Overview of more than 2 years of field experience J.P.Cariou, R. Parmentier, M. Boquet, L.Sauvage 15 th Coherent Laser Radar Conference Toulouse, France 25/06/2009
Comparison of Vaisala Radiosondes RS41 and RS92 WHITE PAPER
 Comparison of Vaisala Radiosondes RS41 and RS92 WHITE PAPER Table of Contents CHAPTER 1 Introduction... 4 CHAPTER 2 Key Improvements in RS41... 5 CHAPTER 3 RS41 and RS92 Comparison Tables... 6 CHAPTER
Transactions on Information and Communications Technologies vol 18, 1998 WIT Press, ISSN
 STREAM, spatial tools for river basins, environment and analysis of management options Menno Schepel Resource Analysis, Zuiderstraat 110, 2611 SJDelft, the Netherlands; e-mail: menno.schepel@resource.nl
MeteoSwiss Spatial Climate Analyses: Documentation of Datasets for Users
 Federal Department of Home Affairs FDHA Federal Office of Meteorology and Climatology MeteoSwiss MeteoSwiss Spatial Climate Analyses: Documentation of Datasets for Users Figure 1: Distribution of the 48-hour
1 Introduction. Station Type No. Synoptic/GTS 17 Principal 172 Ordinary 546 Precipitation
 Use of Automatic Weather Stations in Ethiopia Dula Shanko National Meteorological Agency(NMA), Addis Ababa, Ethiopia Phone: +251116639662, Mob +251911208024 Fax +251116625292, Email: Du_shanko@yahoo.com
The Vaisala AUTOSONDE AS41 OPERATIONAL EFFICIENCY AND RELIABILITY TO A TOTALLY NEW LEVEL.
 The Vaisala AUTOSONDE AS41 OPERATIONAL EFFICIENCY AND RELIABILITY TO A TOTALLY NEW LEVEL. Weather Data Benefit For Society The four most important things about weather prediction are quality, reliability,
Studying Topography, Orographic Rainfall, and Ecosystems (STORE)
") Studying Topography, Orographic Rainfall, and Ecosystems (STORE) Introduction Basic Lesson 3: Using Microsoft Excel to Analyze Weather Data: Topography and Temperature This lesson uses NCDC data to compare
Studying Topography, Orographic Rainfall, and Ecosystems (STORE) Introduction Basic Lesson 3: Using Microsoft Excel to Analyze Weather Data: Topography and Temperature This lesson uses NCDC data to compare
Integration of WindSim s Forecasting Module into an Existing Multi-Asset Forecasting Framework
 Chad Ringley Manager of Atmospheric Modeling Integration of WindSim s Forecasting Module into an Existing Multi-Asset Forecasting Framework 26 JUNE 2014 2014 WINDSIM USER S MEETING TONSBERG, NORWAY SAFE
Forecasting of icing for wind power applications. Øyvind Byrkjedal, Johan Hansson and Henrik van der Velde
 Forecasting of icing for wind power applications Øyvind Byrkjedal, Johan Hansson and Henrik van der Velde oyvind.byrkjedal@vindteknikk.no EWEA Wind Power Forecasting, Leuven, Belgium, 1-2 October 2015
The new worldwide microscale wind resource assessment data on IRENA s Global Atlas. The EUDP Global Wind Atlas
 Downloaded from orbit.dtu.dk on: Dec 25, 2017 The new worldwide microscale wind resource assessment data on IRENA s Global Atlas. The EUDP Global Wind Atlas Badger, Jake; Davis, Neil; Hahmann, Andrea N.;
WeatherHawk Weather Station Protocol
 WeatherHawk Weather Station Protocol Purpose To log atmosphere data using a WeatherHawk TM weather station Overview A weather station is setup to measure and record atmospheric measurements at 15 minute
AUTOMATIC MEASUREMENT OF ICING ON THE WEST OF THE CZECH REPUBLIC
 AUTOMATIC MEASUREMENT OF ICING ON THE WEST OF THE CZECH REPUBLIC J. Chum, J. Vojta, J. Hošek Institute of Atmospheric Physics, Boční II / 1401, Praha 4, Czech republic 1 INTRODUCTION We report our experience
FLOOD HAZARD AND RISK ASSESSMENT IN MID- EASTERN PART OF DHAKA, BANGLADESH
 FLOOD HAZARD AND RISK ASSESSMENT IN MID- EASTERN PART OF DHAKA, BANGLADESH Muhammad MASOOD MEE07180 Supervisor: Prof. Kuniyoshi TAKEUCHI ABSTRACT An inundation simulation has been done for the mid-eastern
London Heathrow Field Site Metadata
 London Heathrow Field Site Metadata Field Site Information Name: Heathrow src_id (Station ID number): 708 Geographic Area: Greater London Latitude (decimal ): 51.479 Longitude (decimal ): -0.449 OS Grid
Examples of the use of operational WTG data
 Examples of the use of operational WTG data Mark Žagar, Ph.D., Specialist Plant Siting & Forecasting Vestas Wind Systems A/S mazag@vestas.com [14 April 2016, EWEA Technology Workshop, Bilbao] Vestas in
Wind speed and direction predictions by WRF and WindSim coupling over Nygårdsfjell
 Journal of Physics: Conference Series PAPER OPEN ACCESS Wind speed and direction predictions by WRF and WindSim coupling over Nygårdsfjell To cite this article: M Bilal et al 1 J. Phys.: Conf. Ser. 753
Working with Digital Elevation Models in ArcGIS 8.3
 Working with Digital Elevation Models in ArcGIS 8.3 The homework that you need to turn in is found at the end of this document. This lab continues your introduction to using the Spatial Analyst Extension
How to shape future met-services: a seamless perspective
 How to shape future met-services: a seamless perspective Paolo Ruti, Chief World Weather Research Division Sarah Jones, Chair Scientific Steering Committee Improving the skill big resources ECMWF s forecast
The Montague Doppler Radar, An Overview
 ISSUE PAPER SERIES The Montague Doppler Radar, An Overview June 2018 NEW YORK STATE TUG HILL COMMISSION DULLES STATE OFFICE BUILDING 317 WASHINGTON STREET WATERTOWN, NY 13601 (315) 785-2380 WWW.TUGHILL.ORG
DEVELOPMENT OF GPS PHOTOS DATABASE FOR LAND USE AND LAND COVER APPLICATIONS
 DEVELOPMENT OF GPS PHOTOS DATABASE FOR LAND USE AND LAND COVER APPLICATIONS An Ngoc VAN and Wataru TAKEUCHI Institute of Industrial Science University of Tokyo 4-6-1 Komaba, Meguro-ku, Tokyo 153-8505 Japan
Using Microsoft Excel
 Using Microsoft Excel Objective: Students will gain familiarity with using Excel to record data, display data properly, use built-in formulae to do calculations, and plot and fit data with linear functions.
Graduate Courses Meteorology / Atmospheric Science UNC Charlotte
 Graduate Courses Meteorology / Atmospheric Science UNC Charlotte In order to inform prospective M.S. Earth Science students as to what graduate-level courses are offered across the broad disciplines of
Expanding Canada s Rail Network to Meet the Challenges of the Future
 Expanding Canada s Rail Network to Meet the Challenges of the Future Lesson Overview Rail may become a more popular mode of transportation in the future due to increased population, higher energy costs,
Descripiton of method used for wind estimates in StormGeo
 Descripiton of method used for wind estimates in StormGeo Photo taken from http://juzzi-juzzi.deviantart.com/art/kite-169538553 StormGeo, 2012.10.16 Introduction The wind studies made by StormGeo for HybridTech
Studnice Test Station (EGÚ Brno)
") Test Station (EGÚ Brno) Ing. Jaroslav Šabata EGÚ a.s. Hudcova 487/76a, 612 48 Brno-Medlánky,, jaroslav.sabata@egubrno.cz Abstract EGÚ Brno has been involved in solving the problems of icing on overhead
Test Station (EGÚ Brno) Ing. Jaroslav Šabata EGÚ a.s. Hudcova 487/76a, 612 48 Brno-Medlánky,, jaroslav.sabata@egubrno.cz Abstract EGÚ Brno has been involved in solving the problems of icing on overhead
GEOGRAPHY (GE) Courses of Instruction
 Courses of Instruction") GEOGRAPHY (GE) GE 102. (3) World Regional Geography. The geographic method of inquiry is used to examine, describe, explain, and analyze the human and physical environments of the major regions of the
GEOGRAPHY (GE) GE 102. (3) World Regional Geography. The geographic method of inquiry is used to examine, describe, explain, and analyze the human and physical environments of the major regions of the
C1: From Weather to Climate Looking at Air Temperature Data
 C1: From Weather to Climate Looking at Air Temperature Data Purpose Students will work with short- and longterm air temperature data in order to better understand the differences between weather and climate.
WASA Project Team. 13 March 2012, Cape Town, South Africa
 Overview of Wind Atlas for South Africa (WASA) project WASA Project Team 13 March 2012, Cape Town, South Africa Outline The WASA Project Team The First Verified Numerical Wind Atlas for South Africa The
Enhancing Weather Information with Probability Forecasts. An Information Statement of the American Meteorological Society
 Enhancing Weather Information with Probability Forecasts An Information Statement of the American Meteorological Society (Adopted by AMS Council on 12 May 2008) Bull. Amer. Meteor. Soc., 89 Summary This
Representivity of wind measurements for design wind speed estimations
 Representivity of wind measurements for design wind speed estimations Adam Goliger 1, Andries Kruger 2 and Johan Retief 3 1 Built Environment, Council for Scientific and Industrial Research, South Africa.
TEMPLATE FOR CMaP PROJECT
 TEMPLATE FOR CMaP PROJECT Project Title: Native Utah Plants Created by: Anna Davis Class: Box Elder 2008 Project Description Community Issue or Problem Selected -How project evolved? Community Partner(s)
WASA WP1:Mesoscale modeling UCT (CSAG) & DTU Wind Energy Oct March 2014
 & DTU Wind Energy Oct March 2014") WASA WP1:Mesoscale modeling UCT (CSAG) & DTU Wind Energy Oct 2013 - March 2014 Chris Lennard and Brendan Argent University of Cape Town, Cape Town, South Africa Andrea N. Hahmann (ahah@dtu.dk), Jake Badger,
WASA WP1:Mesoscale modeling UCT (CSAG) & DTU Wind Energy Oct 2013 - March 2014 Chris Lennard and Brendan Argent University of Cape Town, Cape Town, South Africa Andrea N. Hahmann (ahah@dtu.dk), Jake Badger,
W. Douglas Wewer 1,2 *, Michael J. Jenkins 1
 A PRACTITIONER S PERSPECTIVE: PROVIDING TIMELY AND RELEVANT MOUNTAIN WEATHER INFORMATION TO AVALANCHE WORKERS AT SNOWBASIN, A SUN VALLEY RESORT AND THE FOREST SERVICE UTAH AVALANCHE CENTER W. Douglas Wewer
PRELIMINARY WIND RESOURCE ASSESSMENT OF WINDYGATES FIRST NATIONS PROJECT. Department of Innovation, Energy and Mines Contact. Rick Halas Document No
 PRELIMINARY WIND RESOURCE ASSESSMENT OF WINDYGATES FIRST NATIONS PROJECT Client Department of Innovation, Energy and Mines Contact Rick Halas Document No Issue B Status Classification Client s Discretion
USE OF SATELLITE INFORMATION IN THE HUNGARIAN NOWCASTING SYSTEM
 USE OF SATELLITE INFORMATION IN THE HUNGARIAN NOWCASTING SYSTEM Mária Putsay, Zsófia Kocsis and Ildikó Szenyán Hungarian Meteorological Service, Kitaibel Pál u. 1, H-1024, Budapest, Hungary Abstract The
Solar Radiation and Solar Programs. Training Consulting Engineering Publications GSES P/L
 Solar Radiation and Solar Programs Training Consulting Engineering Publications SOLAR RADIATION Purposes of Solar Radiation Software Successful project planning and solar plant implementation starts by
PowerPredict Wind Power Forecasting September 2011
 PowerPredict Wind Power Forecasting September 2011 For further information please contact: Dr Geoff Dutton, Energy Research Unit, STFC Rutherford Appleton Laboratory, Didcot, Oxon OX11 0QX E-mail: geoff.dutton@stfc.ac.uk
Popular Mechanics, 1954
 Introduction to GIS Popular Mechanics, 1954 1986 $2,599 1 MB of RAM 2017, $750, 128 GB memory, 2 GB of RAM Computing power has increased exponentially over the past 30 years, Allowing the existence of
Centralized Forecasting Registration and Communication Requirements for Distribution Connected Variable Generators. IESO Training
 Centralized Forecasting Registration and Communication Requirements for Distribution Connected Variable Generators IESO Training May 2017 Centralized Forecasting - Registration and Communication Requirements
Speedwell High Resolution WRF Forecasts. Application
 Speedwell High Resolution WRF Forecasts Speedwell weather are providers of high quality weather data and forecasts for many markets. Historically we have provided forecasts which use a statistical bias
The Combination of Geospatial Data with Statistical Data for SDG Indicators
 Session x: Sustainable Development Goals, SDG indicators The Combination of Geospatial Data with Statistical Data for SDG Indicators Pier-Giorgio Zaccheddu Fabio Volpe 5-8 December2018, Nairobi IAEG SDG
Methodology for the creation of meteorological datasets for Local Air Quality modelling at airports
 Methodology for the creation of meteorological datasets for Local Air Quality modelling at airports Nicolas DUCHENE, James SMITH (ENVISA) Ian FULLER (EUROCONTROL Experimental Centre) About ENVISA Noise
INSPIRE in the context of EC Directive 2002/49/EC on Environmental Noise
 INSPIRE in the context of EC Directive 2002/49/EC on Environmental Noise Simon Shilton Acustica Ltd, United Kingdom Nigel Jones Extrium Ltd, United Kingdom About the Authors www.acustica.co.uk Acoustics
Renewable Energy Development and Airborne Wildlife Conservation
 Whitepaper ECHOTRACK TM RADAR ACOUSTIC TM SURVEILLANCE SYSTEM Renewable Energy Development and Airborne Wildlife Conservation Renewable energy developers must meet regulatory requirements to mitigate for
Wind Power Forecasting Using Non-Linear ARMAX Models and Neural Networks
 Wind Power Forecasting Using Non-Linear ARMAX Models and Neural Networks Frede Aakmann Tøgersen & Kim Emil Andersen Wind & Site Competence Centre Technology R & D Vestas Wind Systems A/S Agenda Introducing
Training: Climate Change Scenarios for PEI. Training Session April Neil Comer Research Climatologist
 Training: Climate Change Scenarios for PEI Training Session April 16 2012 Neil Comer Research Climatologist Considerations: Which Models? Which Scenarios?? How do I get information for my location? Uncertainty
Use of Geophysical Software for Interpretation of Ice-Penetrating Radar Data and Mapping of Polar Ice Sheets
 Use of Geophysical Software for Interpretation of Ice-Penetrating Radar Data and Mapping of Polar Ice Sheets Alex O. Martinez University of Kansas 2335 Irving Hill Road Lawrence, KS 66045-7612 http://cresis.ku.edu
Wind Tower Deployments and Pressure Sensor Installation on Coastal Houses Preliminary Data Summary _ Sea Grant Project No.
 Wind Tower Deployments and Pressure Sensor Installation on Coastal Houses Preliminary Data Summary _ Sea Grant Project No.:1020040317 Submitted to: South Carolina Sea Grant Consortium 287 Meeting Street
Model Output Statistics (MOS)
") Model Output Statistics (MOS) Numerical Weather Prediction (NWP) models calculate the future state of the atmosphere at certain points of time (forecasts). The calculation of these forecasts is based on
Model Output Statistics (MOS) Numerical Weather Prediction (NWP) models calculate the future state of the atmosphere at certain points of time (forecasts). The calculation of these forecasts is based on