Snow Survey at the Ancient Forest 27 January 2017
|
|
|
- Cory Pope
- 6 years ago
- Views:
Transcription

1 Snow Survey at the Ancient Forest 27 January
2 Snow Survey 2
3 Tentative Agenda 3
4 Snow Survey Components Snow course for snow depth distribution. Snow core measurements for SWE. Snow pit for measurements and observations of snow temperature, snow grain sizes, layering and impurities. Meteorological data acquisition for interpretation of snowpack conditions. 4
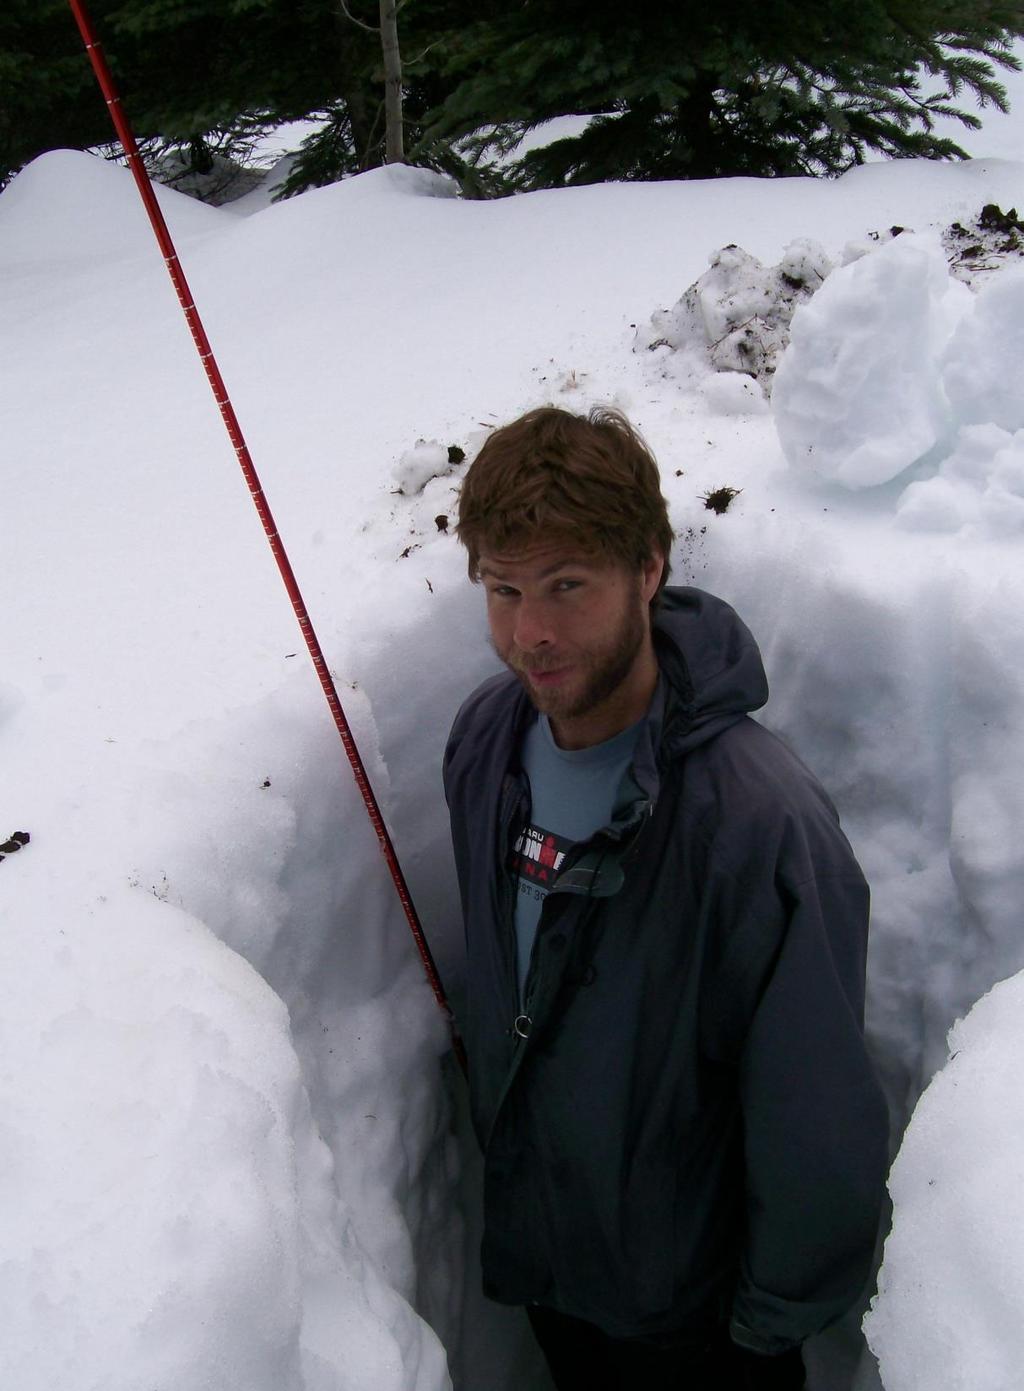
5 Point measurements of snow depth Most simply, depth measurements of snow (snow accumulated on the ground) are made with a snow ruler or similar graduated rod that is pushed through the snow to the ground surface. Representative measurements by this method may be difficult to obtain in open areas since the snowcover undergoes drifting and may have embedded ice layers that limit penetration with a ruler. 5
6 Measurements of snow depth At each observing station a number of measurements are made and averaged. In remote regions, graduated snow stakes or aerial markers may be used. The snow depth at the stake or marker is observed from a distant point through binoculars or telescopes. However, rulers, stakes and aerial markers do not provide SWE information. 6
7 Sonic Ranger Automatic snow depth measure Determines the distance to a target by sending out ultrasonic pulses and listening for the returning echoes that are reflected from the target The time from transmission to return of an echo is used to obtain the distance measurement Air temperature correction required for variations in the speed of sound in air 7
8 Sonic Ranger January 20 th,

9 March 23 rd, 2012

10 March 20 th, 2013
11 Snow depth distribution Neumann et al. (2006) 11
12 Neumann et al. (2006) 12

13 April 28 th, 2011 May 10 th, 2011
14 14
15 15
16 Snow Water Equivalent (SWE) The vertical depth of water that would be obtained by melting snow Snowfall measurement can be problematic Determining SWE from snowpack depth can be problematic Assuming mean density 100 kg m -3 (i.e. 10:1 ratio) Regional density variations (new snow: kg m -3 ) Densification over time Measuring snowpack SWE is the standard by weight of snowpack sample 16
17 Snow Pillows An antifreeze filled bladder of various shapes, sizes, and materials. Minimum size based on expected winter SWE Pressure inside the pillow changes in response to the weight of snow Fluid pressure changes are measured with a manometer or pressure transducer data can be transmitted remotely 17

18 Snow Pillow tana.edu/hydrology/i mages/img_1053.jpg 18
19 Advantages: A non-destructive sampling technique Snow Pillows An automatic measure of SWE in remote locations Identify snowfall and snowmelt events Can provide rough estimates of loss of SWE Disadvantages: A point SWE measurement site representativeness important Bridging may occur separation of pillow from overlaying snow under measurement of SWE Snow pillow is a barrier to heat and moisture fluxes between snowpack and ground 19
20 Snow Pillows B.C. Ministry of Environment River Forecast Centre Automated Snow Pillows (ASPs) and manual snow surveys view ASP SWE graphs (daily) download temperature, precipitation, and SWE data from ASP sites (near real-time) download manual snow survey data Historic data present Over 50 active ASP sites and almost 200 snow survey sites in the province 20
21 Snow Surveys Measure snow depth, density and SWE Snow course is the line of permanently marked sampling points Repeat measurements at regular intervals throughout season Location and frequency of snow survey depends on purpose: 1) as index of SWE for spring runoff prediction 2) absolute measure for hydrologic, agricultural, ecologic, transportation, recreational, and engineering functions Snow survey data are the ultimate base of comparison for other methods 21
22 Snow Surveys Considerations What are you measuring SWE for? Where to set up snow course? How long should the snow course be? How many sample points per course? SWE depth sampling ratio? When and how often to sample? What equipment to use? 22
23 Index of SWE: Snow Surveys Purpose Choose high accumulation area Show changes in SWE Represent basin characteristics Forest cover; aspect; elevation Consistent instrumentation and methodology Absolute estimate of SWE: Account for biases Instrument, method, site Account for variability in snowcover Erosional/depositional areas Stratify by landscape features 23
24 Accessibility Snow Surveys Site Selection Representativeness of terrain/land cover Choose slightly sloping terrain Avoid steep slopes Avoid areas with land use disturbances i.e. logging, mining, construction Avoid microsite irregularities at sample points i.e. stumps, logs, ponding areas Avoid areas with snow removal activity 24
25 Snow Surveys Site Selection Snowmelt for testing melt models North and south aspect Radiation differences Open and forest cover Radiation differences Similar location, slope, elevation Same weather, vegetation Access 25
26 Longer in complex terrain Snow Surveys Course Length More samples in complex terrain Snow course can zig-zag Oversample initially Length and sample density adjusted based on selected precision level Fewer SWE than depth measurements possible Density shows least variability Calculate SWE at depth measurement points 26
27 Snow Surveys Course Length cont. Cumulative coefficient of variation (C.V.) standard deviation mean Measure of variability independent of scale C.V. = Plot cumulative C.V. against length of course How many samples before C.V. levels off? 27
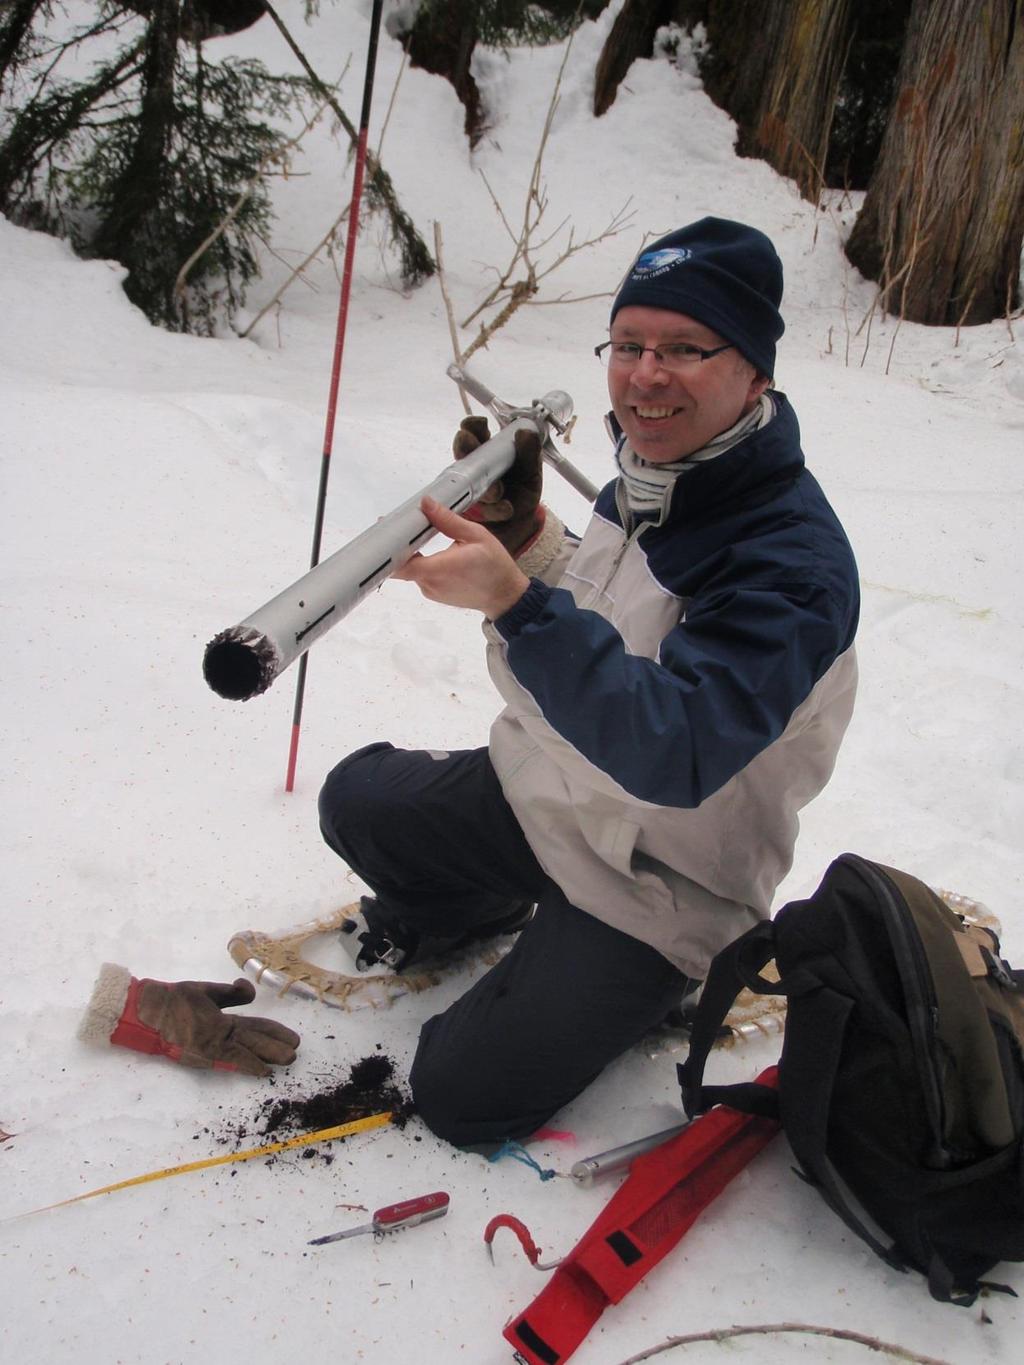
28 Snow Surveys Equipment Graduated snow tube with cutter Various materials, cutter configurations, and sizes Larger diameter tubes for shallow snowpacks Graduations on outside to measure snow depth Slots in tube to view snow core Spring balance measures SWE directly Federal (formerly Mt. Rose) snow sampler 28

29 B.C. Snow Survey Sampling Guide Snow Surveys Methods recast/snow_surveys_manual.pdf 29
30 Snow Surveys Methods Weigh and record empty tube SWE. 2. Push tube straight into snow pack to ground. 3. Push and twist into ground to obtain soil plug. 30
31 Snow Surveys Methods Weigh and record empty tube SWE. 2. Push tube straight into snow pack to ground. 3. Push and twist into ground to obtain soil plug. 4. Record snow depth from outside of tube. 5. Carefully pull tube straight out of snowpack. 6. Check for soil plug. 31
32 Snow Surveys Methods Weigh and record empty tube SWE. 2. Push tube straight into snow pack to ground. 3. Push and twist into ground to obtain soil plug. 4. Record snow depth from outside of tube. 5. Carefully pull tube straight out of snow pack. 6. Check for soil plug. 7. Remove soil plug and estimate depth of soil in tube. 32
33 Snow Surveys Methods Weigh and record empty tube SWE. 2. Push tube straight into snow pack to ground. 3. Push and twist into ground to obtain soil plug. 4. Record snow depth from outside of tube. 5. Carefully pull tube straight out of snow pack. 6. Check for soil plug. 7. Remove soil plug and estimate depth of soil in tube. 8. Weigh and record filled tube SWE. *If hit obstruction during sampling or if no soil plug obtained re-take snow sample. 33
34 34
35 Snow Surveys Methods rinse & repeat Give tube a good shake or tap it against toe of boot to get out snow core Don t hit tube or cutter end against anything hard because it is easy to damage Check that no snow remains in tube between samples No significant snow in tube 35
36 Snow Surveys Tips Weighing empty tube before each sample is at your discretion Dependent on snow conditions; tube-clearing skill; level of accuracy desired Bring small, slotted screwdriver and old knife to remove soil plug, or tricky snow core, from tube Bring many pairs of gloves, grippy palms are a good idea Waterproof paper and pencil for data recording 36
37 Site NF GPS Date Apr 27, U Aspect S Slope 16.1% Start Time 13:20 End Time 14:15 Weather Sampler Kara Recorder Audrey N-S Distance (m) 7 E-W Distance (m) Overcast, light drizzle Point Line Direction Depth w/ Soil Soil Plug SWE Empty SWE Full NOTES 1 1 5: : : : in nasty tree well 37
38 Site GPS Aspect Slope Date Start Time End Time Weather Sampler Recorder N-S Distance (m) E-W Distance (m) Point Line Direction Depth w/ Soil Soil Plug SWE Empty SWE Full NOTES
39 Snow Surveys Issues Different samplers for different conditions Federal generally regarded as best all-around Generally overestimate SWE Design of cutting point forces more snow inside tube Ice layers Losing water from the tube during melt Gaining extra snow Through slots with twisting in deep snowpack Dull cutter Shrubs, branches, vegetation beneath the snow Air pockets Check length of core 80% snow depth; consistent density between samples Freezing of snow in the tube Particularly when air temp > 0 o C, snow temp < 0 o C 39
40 Measurement Errors The number and quality of data, as well as their statistical nature, impose limitations on the information that can be usually deduced; in fact, all measurements are inaccurate to some degree. The observer s procedures, the instruments and their maintenance, data transmission and transcription, may each contribute individually or collectively to errors in the published values. 40
41 Measurement Errors Errors may be random, such as mistakes in transcribing numbers, or systematic, such as a bias introduced by an observer or an instrument. Random errors often cluster around mean values and are generally both positive and negative so that normal or Gaussian statistics apply. Some obvious errors can be easily explained and corrected; others must be rejected if they lack a sound physical explanation, but should not be discarded, since later evidence may provide 41 an explanation.
42 Measurement Errors Errors that fall within reasonable limits of possibility are the most insidious since they are virtually impossible to detect. A mean value of several measurements is a better estimate of the true value, provided systematic errors are negligible. Similarly, the average of a time series may give a superior measure of its true (normal) value. 42
43 Measurement Errors Systematic errors may either be constant or proportional to a variable s magnitude or appear only under specific environmental conditions, e.g., when snow is wet and adhesive rather than dry and easily transported by the wind. Such errors are minor in data for indices, but are serious in data required for quantitative values. Adjustment factors can be determined to compensate for exposure bias but are somewhat subjective and cannot be freely transposed to other seasons or sites. 43
44 Measurement Errors Most snow courses are established to aid in predicting runoff volumes and peaks. Their data measurements are used as indices so that the measured values need not be representative of a large area. Preferably they indicate snowcover amounts over areas that contribute substantially to runoff. 44
45 Measurement Errors A simple comparison with values in the same general area will often indicate the extent to which exposures are comparable. Major differences should be explainable in terms of elevation, land form, vegetation, or other climatic or physical features. Snowfall and snowcover data are highly amenable to statistical analyses and probabilistic statistical association. 45
46 Measurement Errors Peculiarities of the data must always be kept in mind (e.g., the data must be examined critically for the occurrence of zero values and for the frequency distribution most appropriate for analysis). The choice of the most suitable theoretical distribution to be fitted depends on each dataset; for instance the incomplete gamma function is used to represent many snowfall and snowcover variables. 46
47 Measurement Errors The distribution of a single variable can frequently be expressed in a linear form such that: X(F) = X + s k(f) Where X(F) is the expected value of the variable whose probability of not being exceeded is F, X is the estimated mean of the population, s is the estimated standard deviation, and k(f) is the frequency factor which is chosen to correspond to a given probability level, F, and whose magnitude depends on the frequency distribution and sample size. 47
48 Sources of sampling errors Riming of meteorological instruments Loss of power Incorrect wiring or programming of the instrument Malfunctioning or deteriorating instrument Tampering or involuntary displacement Others?? 48
49
50 Final Preparation Checklist Review agenda and be fully prepared for an on-time departure at the bus loop at 10:30 a.m. on Friday, January 27 th, Prepare all personal gear, pack a lunch/water Read and bring all documents related to the fieldtrip and components of the snow survey. Submit the fieldwork critical data form to Stephen. Please express any concerns to Stephen prior to or during the snow survey. 50
51 Teams Team Alpha Team Beta 1) Hadleigh 2)? 3)? 4)? 1) Taras 2)? 3)? 4)? 51
52 Weather Forecast 52
53 53
54 Snow survey data Please digitize all snow survey data including snow depth, SWE and snow pit measurements Include all relevant metadata and notes from your snow survey (e.g. GPS coordinates and weather conditions) Send all the data (preferably in an Excel spreadsheet) to Stephen for upload on website Acquire meteorological data for 1 September 2016 to 27 January 2017 and begin QA/QC 54
Water information system advances American River basin. Roger Bales, Martha Conklin, Steve Glaser, Bob Rice & collaborators UC: SNRI & CITRIS
 Water information system advances American River basin Roger Bales, Martha Conklin, Steve Glaser, Bob Rice & collaborators UC: SNRI & CITRIS Opportunities Unprecedented level of information from low-cost
Prediction of Snow Water Equivalent in the Snake River Basin
 Hobbs et al. Seasonal Forecasting 1 Jon Hobbs Steve Guimond Nate Snook Meteorology 455 Seasonal Forecasting Prediction of Snow Water Equivalent in the Snake River Basin Abstract Mountainous regions of
Snowcover accumulation and soil temperature at sites in the western Canadian Arctic
 Snowcover accumulation and soil temperature at sites in the western Canadian Arctic Philip Marsh 1, C. Cuell 1, S. Endrizzi 1, M. Sturm 2, M. Russell 1, C. Onclin 1, and J. Pomeroy 3 1. National Hydrology
Preliminary Runoff Outlook February 2018
 Preliminary Runoff Outlook February 2018 Prepared by: Flow Forecasting & Operations Planning Water Security Agency General Overview The Water Security Agency (WSA) is preparing for 2018 spring runoff including
GLACIOLOGY LAB SNOW Introduction Equipment
 GLACIOLOGY LAB SNOW Introduction The objective of this lab is to achieve a working knowledge of the snowpack. This includes descriptions and genetic analysis of features that can be observed on the surface
Surface & subsurface processes in mountain environments
 Surface & subsurface processes in mountain environments evapotranspiration snowmelt precipitation infiltration Roger Bales Martha Conklin Robert Rice Fengjing Liu Peter Kirchner runoff sublimation ground
Souris River Basin Spring Runoff Outlook As of March 15, 2018
 Souris River Basin Spring Runoff Outlook As of March 15, 2018 Prepared by: Flow Forecasting & Operations Planning Water Security Agency Basin Conditions Summer rainfall in 2017 in the Saskatchewan portion
Vermont Soil Climate Analysis Network (SCAN) sites at Lye Brook and Mount Mansfield
 sites at Lye Brook and Mount Mansfield") Vermont Soil Climate Analysis Network (SCAN) sites at Lye Brook and Mount Mansfield 13 Years of Soil Temperature and Soil Moisture Data Collection September 2000 September 2013 Soil Climate Analysis Network
Vermont Soil Climate Analysis Network (SCAN) sites at Lye Brook and Mount Mansfield 13 Years of Soil Temperature and Soil Moisture Data Collection September 2000 September 2013 Soil Climate Analysis Network
Great Lakes Update. Volume 199: 2017 Annual Summary. Background
 Great Lakes Update Volume 199: 2017 Annual Summary Background The U.S. Army Corps of Engineers (USACE) tracks and forecasts the water levels of each of the Great Lakes. This report is primarily focused
Use of the models Safran-Crocus-Mepra in operational avalanche forecasting
 Use of the models Safran-Crocus-Mepra in operational avalanche forecasting Coléou C *, Giraud G, Danielou Y, Dumas J-L, Gendre C, Pougatch E CEN, Météo France, Grenoble, France. ABSTRACT: Avalanche forecast
Midwest and Great Plains Drought and Climate Summary 20 February 2014
 Midwest and Great Plains Drought and Climate Summary 20 February 2014 Wendy Ryan Assistant State Climatologist Colorado Climate Center Colorado State University wendy.ryan@colostate.edu 970-491-8506 General
What we are trying to accomplish during the winter season
 What we are trying to accomplish during the winter season Safety first None of this is worth getting hurt over. Change your observation time if you delay your normal observation for safety reasons. Accuracy
MEASUREMENT OF PERMAFROST AND SEASONNALY FROZEN GROUND
 VOLUME II. MEASUREMENT OF CRYOSPHERIC VARIABLES 1 CHAPTER 1. CHAPTER 2. CHAPTER 3. CHAPTER 4. CHAPTER 5. CHAPTER 6. CHAPTER 7. CHAPTER 8. GENERAL MEASUREMENT OF SNOW MEASUREMENT OF GLACIER AND ICE CAPS
Raindrops. Precipitation Rate. Precipitation Rate. Precipitation Measurements. Methods of Precipitation Measurement. are shaped liked hamburger buns!
 Precipitation Measurements Raindrops are shaped liked hamburger buns! (Smaller drops are more spherical) Dr. Christopher M. Godfrey University of North Carolina at Asheville Methods of Precipitation Measurement
Hydrologic Forecast Centre Manitoba Infrastructure, Winnipeg, Manitoba. FEBRUARY OUTLOOK REPORT FOR MANITOBA February 23, 2018
 Page 1 of 17 Hydrologic Forecast Centre Manitoba Infrastructure, Winnipeg, Manitoba FEBRUARY OUTLOOK REPORT FOR MANITOBA February 23, 2018 Overview The February Outlook Report prepared by the Hydrologic
Flood Risk Assessment
 Flood Risk Assessment February 14, 2008 Larry Schick Army Corps of Engineers Seattle District Meteorologist General Assessment As promised, La Nina caused an active winter with above to much above normal
The Documentation of Extreme Hydrometeorlogical Events: Two Case Studies in Utah, Water Year 2005
 The Documentation of Extreme Hydrometeorlogical Events: Two Case Studies in Utah, Water Year 2005 Tim Bardsley1*, Mark Losleben2, Randy Julander1 1. USDA, NRCS, Snow Survey Program, Salt Lake City, Utah.
Upper Missouri River Basin February 2018 Calendar Year Runoff Forecast February 6, 2018
 Upper Missouri River Basin February 2018 Calendar Year Runoff Forecast February 6, 2018 Calendar Year Runoff Forecast Explanation and Purpose of Forecast U.S. Army Corps of Engineers, Northwestern Division
APPLICATION OF AN ARCTIC BLOWING SNOW MODEL
 APPLICATION OF AN ARCTIC BLOWING SNOW MODEL J.W. Pomero l, P. ~arsh' and D.M. Gray2 -Hydrology Research Institute Saskatoon, Saskatchewan, Canada S7N 3H5 '~ivision of Hydrology, University of Saskatchewan
Missouri River Basin Water Management
 Missouri River Basin Water Management US Army Corps of Engineers Missouri River Navigator s Meeting February 12, 2014 Bill Doan, P.E. Missouri River Basin Water Management US Army Corps of Engineers BUILDING
Impacts of snowpack accumulation and summer weather on alpine glacier hydrology
 Impacts of snowpack accumulation and summer weather on alpine glacier hydrology Caroline Aubry-Wake, Dhiraj Pradhananga, John W. Pomeroy GEWEX 8 th Open Science Meeting, Canmore AB, May 3-11 2018 Canadian
HyMet Company. Streamflow and Energy Generation Forecasting Model Columbia River Basin
 HyMet Company Streamflow and Energy Generation Forecasting Model Columbia River Basin HyMet Inc. Courthouse Square 19001 Vashon Hwy SW Suite 201 Vashon Island, WA 98070 Phone: 206-463-1610 Columbia River
Souris River Basin Spring Runoff Outlook As of March 1, 2019
 Souris River Basin Spring Runoff Outlook As of March 1, 2019 Prepared by: Flow Forecasting & Operations Planning Water Security Agency Basin Conditions Summer rainfall in 2018 over the Saskatchewan portion
ESTIMATION OF NEW SNOW DENSITY USING 42 SEASONS OF METEOROLOGICAL DATA FROM JACKSON HOLE MOUNTAIN RESORT, WYOMING. Inversion Labs, Wilson, WY, USA 2
 ESTIMATION OF NEW SNOW DENSITY USING 42 SEASONS OF METEOROLOGICAL DATA FROM JACKSON HOLE MOUNTAIN RESORT, WYOMING Patrick J. Wright 1 *, Bob Comey 2,3, Chris McCollister 2,3, and Mike Rheam 2,3 1 Inversion
Upper Missouri River Basin December 2017 Calendar Year Runoff Forecast December 5, 2017
 Upper Missouri River Basin December 2017 Calendar Year Runoff Forecast December 5, 2017 Calendar Year Runoff Forecast Explanation and Purpose of Forecast U.S. Army Corps of Engineers, Northwestern Division
Novel Snotel Data Uses: Detecting Change in Snowpack Development Controls, and Remote Basin Snow Depth Modeling
 Novel Snotel Data Uses: Detecting Change in Snowpack Development Controls, and Remote Basin Snow Depth Modeling OVERVIEW Mark Losleben and Tyler Erickson INSTAAR, University of Colorado Mountain Research
Forecast Challenges for the Colorado Basin River Forecast Center
 Forecast Challenges for the Colorado Basin River Forecast Center John Lhotak, Development and Operations Hydrologist Improving Sub-Seasonal to Seasonal (S2S) Workshop May 16th, 2018 1 River Forecast Centers
Hydrologic Forecast Centre Manitoba Infrastructure, Winnipeg, Manitoba. MARCH OUTLOOK REPORT FOR MANITOBA March 23, 2018
 Page 1 of 21 Hydrologic Forecast Centre Manitoba Infrastructure, Winnipeg, Manitoba MARCH OUTLOOK REPORT FOR MANITOBA March 23, 2018 Overview The March Outlook Report prepared by the Hydrologic Forecast
Effects of forest cover and environmental variables on snow accumulation and melt
 Effects of forest cover and environmental variables on snow accumulation and melt Mariana Dobre, William J. Elliot, Joan Q. Wu, Timothy E. Link, Ina S. Miller Abstract The goal of this study was to assess
Studying snow cover in European Russia with the use of remote sensing methods
 40 Remote Sensing and GIS for Hydrology and Water Resources (IAHS Publ. 368, 2015) (Proceedings RSHS14 and ICGRHWE14, Guangzhou, China, August 2014). Studying snow cover in European Russia with the use
Summary of Manual Snow On Ground Measurements for WMO SPICE
 Summary of Manual Snow On Ground Measurements for WMO SPICE Col de Porte Col de Porte performs a manual snow ruler and snow pit measurement on a weekly basis during the winter measurement period. Snow
January 2011 Calendar Year Runoff Forecast
 January 2011 Calendar Year Runoff Forecast 2010 Runoff Year Calendar Year 2010 was the third highest year of runoff in the Missouri River Basin above Sioux City with 38.8 MAF, behind 1978 and 1997 which
Chiang Rai Province CC Threat overview AAS1109 Mekong ARCC
 Chiang Rai Province CC Threat overview AAS1109 Mekong ARCC This threat overview relies on projections of future climate change in the Mekong Basin for the period 2045-2069 compared to a baseline of 1980-2005.
Operational Perspectives on Hydrologic Model Data Assimilation
 Operational Perspectives on Hydrologic Model Data Assimilation Rob Hartman Hydrologist in Charge NOAA / National Weather Service California-Nevada River Forecast Center Sacramento, CA USA Outline Operational
Land Surface: Snow Emanuel Dutra
 Land Surface: Snow Emanuel Dutra emanuel.dutra@ecmwf.int Slide 1 Parameterizations training course 2015, Land-surface: Snow ECMWF Outline Snow in the climate system, an overview: Observations; Modeling;
Great Lakes Update. Volume 191: 2014 January through June Summary. Vol. 191 Great Lakes Update August 2014
 Great Lakes Update Volume 191: 2014 January through June Summary The U.S. Army Corps of Engineers (USACE) monitors the water levels of each of the Great Lakes. This report provides a summary of the Great
Central Asia Regional Flash Flood Guidance System 4-6 October Hydrologic Research Center A Nonprofit, Public-Benefit Corporation
 http://www.hrcwater.org Central Asia Regional Flash Flood Guidance System 4-6 October 2016 Hydrologic Research Center A Nonprofit, Public-Benefit Corporation FFGS Snow Components Snow Accumulation and
Using MODIS imagery to validate the spatial representation of snow cover extent obtained from SWAT in a data-scarce Chilean Andean watershed
 Using MODIS imagery to validate the spatial representation of snow cover extent obtained from SWAT in a data-scarce Chilean Andean watershed Alejandra Stehr 1, Oscar Link 2, Mauricio Aguayo 1 1 Centro
How to assess a snowpack with your group:
 This avalanche awareness curriculum was produced in partnership between the Colorado Mountain Club s Conservation Department s Backcountry Snowsports Initiative and Youth Education Program as well as the
P. Marsh and J. Pomeroy National Hydrology Research Institute 11 Innovation Blvd., Saskatoon, Sask. S7N 3H5
 WATER AND ENERGY FLUXES DURING THE SNOWMELT PERIOD AT AN ARCTIC TREELINE SITE P. Marsh and J. Pomeroy National Hydrology Research Institute 11 Innovation Blvd., Saskatoon, Sask. S7N 3H5 marshp@nhrisv.nhrc.skdoe.ca
ESTIMATING SNOWMELT CONTRIBUTION FROM THE GANGOTRI GLACIER CATCHMENT INTO THE BHAGIRATHI RIVER, INDIA ABSTRACT INTRODUCTION
 ESTIMATING SNOWMELT CONTRIBUTION FROM THE GANGOTRI GLACIER CATCHMENT INTO THE BHAGIRATHI RIVER, INDIA Rodney M. Chai 1, Leigh A. Stearns 2, C. J. van der Veen 1 ABSTRACT The Bhagirathi River emerges from
Proceedings, International Snow Science Workshop, Breckenridge, Colorado, 2016
 CHARACTERISTICS OF AVALANCHE RELEASE AND AN APPROACH OF AVALANCHE FORECAST- ING SYSTEM USING SNOWPACK MODEL IN THE TIANSHAN MOUNTAINS, CHINA Osamu ABE 1*, Lanhai LI 2, Lei BAI 2, Jiansheng HAO 2, Hiroyuki
Measuring Plains Snow Water Equivalent and Depth. Missouri Basin Water Management Division and Omaha District Method
 Measuring Plains Snow Water Equivalent and Depth Missouri Basin Water Management Division and Omaha District Method U.S. Army Corps of Engineers Northwestern Division - Omaha 1616 Capitol Avenue, Suite
The indicator can be used for awareness raising, evaluation of occurred droughts, forecasting future drought risks and management purposes.
 INDICATOR FACT SHEET SSPI: Standardized SnowPack Index Indicator definition The availability of water in rivers, lakes and ground is mainly related to precipitation. However, in the cold climate when precipitation
A Report on a Statistical Model to Forecast Seasonal Inflows to Cowichan Lake
 A Report on a Statistical Model to Forecast Seasonal Inflows to Cowichan Lake Prepared by: Allan Chapman, MSc, PGeo Hydrologist, Chapman Geoscience Ltd., and Former Head, BC River Forecast Centre Victoria
The Meteorological Observatory from Neumayer Gert König-Langlo, Bernd Loose Alfred-Wegener-Institut, Bremerhaven, Germany
 The Meteorological Observatory from Neumayer Gert König-Langlo, Bernd Loose Alfred-Wegener-Institut, Bremerhaven, Germany History of Neumayer In March 1981, the Georg von Neumayer Station (70 37 S, 8 22
2017 Fall Conditions Report
 2017 Fall Conditions Report Prepared by: Hydrologic Forecast Centre Date: November 15, 2017 Table of Contents TABLE OF FIGURES... ii EXECUTIVE SUMMARY... 1 BACKGROUND... 4 SUMMER AND FALL PRECIPITATION...
Missouri River Flood Task Force River Management Working Group Improving Accuracy of Runoff Forecasts
 Missouri River Flood Task Force River Management Working Group Improving Accuracy of Runoff Forecasts Kevin Grode, P.E. Reservoir Regulation Team Lead Missouri River Basin Water Management Northwestern
LIFE12 ENV/FIN/ st summary report of snow data 30/09/2014
 LIFE Project Number 1st summary report of snow data Reporting Date 30/09/2014 LIFE+ PROJECT NAME or Acronym Climate change indicators and vulnerability of boreal zone applying innovative observation and
Modeling of peak inflow dates for a snowmelt dominated basin Evan Heisman. CVEN 6833: Advanced Data Analysis Fall 2012 Prof. Balaji Rajagopalan
 Modeling of peak inflow dates for a snowmelt dominated basin Evan Heisman CVEN 6833: Advanced Data Analysis Fall 2012 Prof. Balaji Rajagopalan The Dworshak reservoir, a project operated by the Army Corps
2015 Fall Conditions Report
 2015 Fall Conditions Report Prepared by: Hydrologic Forecast Centre Date: December 21 st, 2015 Table of Contents Table of Figures... ii EXECUTIVE SUMMARY... 1 BACKGROUND... 2 SUMMER AND FALL PRECIPITATION...
An investigation of sampling efficiency using historical data. Patrick Didier Advisor: Justine Blanford
 An investigation of sampling efficiency using historical data Patrick Didier Advisor: Justine Blanford Overview Introduction to Airborne Snow Survey program Goals of the Capstone Project Methods and Expected
Snow Melt with the Land Climate Boundary Condition
 Snow Melt with the Land Climate Boundary Condition GEO-SLOPE International Ltd. www.geo-slope.com 1200, 700-6th Ave SW, Calgary, AB, Canada T2P 0T8 Main: +1 403 269 2002 Fax: +1 888 463 2239 Introduction
Lake Tahoe Watershed Model. Lessons Learned through the Model Development Process
 Lake Tahoe Watershed Model Lessons Learned through the Model Development Process Presentation Outline Discussion of Project Objectives Model Configuration/Special Considerations Data and Research Integration
ABSTRACT INTRODUCTION
 INTER- AND INTRA-ANNUAL VARIABILITY IN SNOW ALBEDO, GRAIN SIZE, AND SNOW COVERED AREA FROM THE AIRBORNE SNOW OBSERVATORY DURING LOW SNOW YEARS (2013-2015), TUOLUMNE RIVER BASIN, CA S. McKenzie Skiles 1,
THE INVESTIGATION OF SNOWMELT PATTERNS IN AN ARCTIC UPLAND USING SAR IMAGERY
 THE INVESTIGATION OF SNOWMELT PATTERNS IN AN ARCTIC UPLAND USING SAR IMAGERY Johansson, M., Brown, I.A. and Lundén, B. Department of Physical Geography, Stockholm University, S-106 91 Stockholm, Sweden
Gauge Undercatch of Two Common Snowfall Gauges in a Prairie Environment
 64 th EASTERN SNOW CONFERENCE St. John s, Newfoundland, Canada 2007 Gauge Undercatch of Two Common Snowfall Gauges in a Prairie Environment JIMMY P. MACDONALD 1 AND JOHN W. POMEROY 1 ABSTRACT Accurate
The Hydrologic Cycle: How Do River Forecast Centers Measure the Parts?
 The Hydrologic Cycle: How Do River Forecast Centers Measure the Parts? Greg Story Meteorologist National Weather Service Fort Worth, TX Overview n Introduction What is the mission of an RFC? n The Hydrologic
Southern Sierra Critical Zone Observatory (CZO): hydrochemical characteristics, science & measurement strategy
: hydrochemical characteristics, science & measurement strategy") Southern Sierra Critical Zone Observatory (CZO): hydrochemical characteristics, science & measurement strategy R. Bales, C. Hunsaker, M. Conklin, J. Kirchner, B. Boyer, P. Kirchner underlying hypothesis:
Southern Sierra Critical Zone Observatory (CZO): hydrochemical characteristics, science & measurement strategy R. Bales, C. Hunsaker, M. Conklin, J. Kirchner, B. Boyer, P. Kirchner underlying hypothesis:
Snowcover interaction with climate, topography & vegetation in mountain catchments
 Snowcover interaction with climate, topography & vegetation in mountain catchments DANNY MARKS Northwest Watershed Research Center USDA-Agricultural Agricultural Research Service Boise, Idaho USA RCEW
Great Lakes Update. Background
 Great Lakes Update Background The U.S. Army Corps of Engineers, Detroit District, monitors and forecasts the water levels of the Great Lakes. This report summarizes the hydrologic conditions of the Great
CLIMATE CHANGE AND REGIONAL HYDROLOGY ACROSS THE NORTHEAST US: Evidence of Changes, Model Projections, and Remote Sensing Approaches
 CLIMATE CHANGE AND REGIONAL HYDROLOGY ACROSS THE NORTHEAST US: Evidence of Changes, Model Projections, and Remote Sensing Approaches Michael A. Rawlins Dept of Geosciences University of Massachusetts OUTLINE
Regional influence on road slipperiness during winter precipitation events. Marie Eriksson and Sven Lindqvist
 Regional influence on road slipperiness during winter precipitation events Marie Eriksson and Sven Lindqvist Physical Geography, Department of Earth Sciences, Göteborg University Box 460, SE-405 30 Göteborg,
NIDIS Intermountain West Drought Early Warning System March 26, 2019
 NIDIS Intermountain West Drought Early Warning System March 26, 2019 The images above use daily precipitation statistics from NWS COOP, CoCoRaHS, and CoAgMet stations. From top to bottom, and left to right:
Montana Drought & Climate
 Montana Drought & Climate MARCH 219 MONITORING AND FORECASTING FOR AGRICULTURE PRODUCERS A SERVICE OF THE MONTANA CLIMATE OFFICE IN THIS ISSUE IN BRIEF PAGE 2 REFERENCE In a Word PAGE 3 REVIEW Winter 219:
Basic Hydrologic Science Course Understanding the Hydrologic Cycle Section Six: Snowpack and Snowmelt Produced by The COMET Program
 Basic Hydrologic Science Course Understanding the Hydrologic Cycle Section Six: Snowpack and Snowmelt Produced by The COMET Program Snow and ice are critical parts of the hydrologic cycle, especially at
Incorporating Effects of Forest Litter in a Snow Process Model
 57th EASTERN SNOW CONFERENCE Syracuse, New York, USA, 2000 Incorporating Effects of Forest Litter in a Snow Process Model ABSTRACT J. P. H A R D Y, 1 R. MELLOH, 1 P. ROBINSON, 1 AND R. JORDAN 1 N e t s
NIDIS Intermountain West Drought Early Warning System January 15, 2019
 NIDIS Drought and Water Assessment NIDIS Intermountain West Drought Early Warning System January 15, 2019 Precipitation The images above use daily precipitation statistics from NWS COOP, CoCoRaHS, and
2015: A YEAR IN REVIEW F.S. ANSLOW
 2015: A YEAR IN REVIEW F.S. ANSLOW 1 INTRODUCTION Recently, three of the major centres for global climate monitoring determined with high confidence that 2015 was the warmest year on record, globally.
Presented by Larry Rundquist Alaska-Pacific River Forecast Center Anchorage, Alaska April 14, 2009
 Presented by Larry Rundquist Alaska-Pacific River Forecast Center Anchorage, Alaska April 14, 2009 Presentation Outline Who we are Breakup characteristics Climate and weather influences 2009 breakup outlook
1.Introduction 2.Relocation Information 3.Tourism 4.Population & Demographics 5.Education 6.Employment & Income 7.City Fees & Taxes 8.
 1.Introduction 2.Relocation Information 3.Tourism 4.Population & Demographics 5.Education 6.Employment & Income 7.City Fees & Taxes 8.Recreation & Activities 9.Climate Data 10.Economic Development History
Snow Measurement Guidelines for National Weather Service Snow Spotters
 Snow Measurement Guidelines for National Weather Service Snow Spotters National Weather Service Forecast Office Northern Indiana October 2004 Table of Contents Introduction 3 Definitions.. 3 Relaying Real
Hydrologic Forecast Centre. Manitoba Infrastructure. Winnipeg, Manitoba FEBRUARY FLOOD OUTLOOK REPORT FOR MANITOBA.
 Page 1 of 20 Hydrologic Forecast Centre Manitoba Infrastructure Winnipeg, Manitoba FEBRUARY FLOOD OUTLOOK REPORT FOR MANITOBA February 28, 2019 Overview The February Outlook Report prepared by the Hydrologic
ENVS S102 Earth and Environment (Cross-listed as GEOG 102) ENVS S110 Introduction to ArcGIS (Cross-listed as GEOG 110)
 ENVS S110 Introduction to ArcGIS (Cross-listed as GEOG 110)") ENVS S102 Earth and Environment (Cross-listed as GEOG 102) 1. Describe the fundamental workings of the atmospheric, hydrospheric, lithospheric, and oceanic systems of Earth 2. Explain the interactions
ENVS S102 Earth and Environment (Cross-listed as GEOG 102) 1. Describe the fundamental workings of the atmospheric, hydrospheric, lithospheric, and oceanic systems of Earth 2. Explain the interactions
Storm and Runoff Calculation Standard Review Snowmelt and Climate Change
 Storm and Runoff Calculation Standard Review Snowmelt and Climate Change Presented by Don Moss, M.Eng., P.Eng. and Jim Hartman, P.Eng. Greenland International Consulting Ltd. Map from Google Maps TOBM
EVALUATION AND MONITORING OF SNOWCOVER WATER RESOURCES IN CARPATHIAN BASINS USING GEOGRAPHIC INFORMATION AND SATELLITE DATA
 EVALUATION AND MONITORING OF SNOWCOVER WATER RESOURCES IN CARPATHIAN BASINS USING GEOGRAPHIC INFORMATION AND SATELLITE DATA Gheorghe Stancalie, Simona Catana, Anisoara Iordache National Institute of Meteorology
The Importance of Snowmelt Runoff Modeling for Sustainable Development and Disaster Prevention
 The Importance of Snowmelt Runoff Modeling for Sustainable Development and Disaster Prevention Muzafar Malikov Space Research Centre Academy of Sciences Republic of Uzbekistan Water H 2 O Gas - Water Vapor
THE ROLE OF MICROSTRUCTURE IN FORWARD MODELING AND DATA ASSIMILATION SCHEMES: A CASE STUDY IN THE KERN RIVER, SIERRA NEVADA, USA
 MICHAEL DURAND (DURAND.8@OSU.EDU), DONGYUE LI, STEVE MARGULIS Photo: Danielle Perrot THE ROLE OF MICROSTRUCTURE IN FORWARD MODELING AND DATA ASSIMILATION SCHEMES: A CASE STUDY IN THE KERN RIVER, SIERRA
Great Lakes Update. Volume 194: 2015 Annual Summary
 Great Lakes Update Volume 194: 2015 Annual Summary Background The U.S. Army Corps of Engineers (USACE) tracks and forecasts the water levels of each of the Great Lakes. This report summarizes the hydrologic
NIDIS Intermountain West Drought Early Warning System April 18, 2017
 1 of 11 4/18/2017 3:42 PM Precipitation NIDIS Intermountain West Drought Early Warning System April 18, 2017 The images above use daily precipitation statistics from NWS COOP, CoCoRaHS, and CoAgMet stations.
A Century of Meteorological Observations at Fort Valley Experimental Forest: A Cooperative Observer Program Success Story
 A Century of Meteorological Observations at Fort Valley Experimental Forest: A Cooperative Observer Program Success Story Daniel P. Huebner and Susan D. Olberding, U.S. Forest Service, Rocky Mountain Research
Location Latitude Longitude Durham, NH
 Name: Date: Weather to Climate Investigation: Snow **These are example answers using the Durham, NH dataset. Answers from students using Boise and Little Rock datasets will differ. Guiding Questions: What
Canadian Prairie Snow Cover Variability
 Canadian Prairie Snow Cover Variability Chris Derksen, Ross Brown, Murray MacKay, Anne Walker Climate Research Division Environment Canada Ongoing Activities: Snow Cover Variability and Links to Atmospheric
Persistence of Soil Moisture in the Cariboo Mountains, BC
 Persistence of Soil Moisture in the Cariboo Mountains, BC Tullia Leona Upton University of Northern Brithish Columbia M.Sc. Candidate Natural Resources and Environmental Studies upton@unbc.ca Overview
An Online Platform for Sustainable Water Management for Ontario Sod Producers
 An Online Platform for Sustainable Water Management for Ontario Sod Producers 2014 Season Update Kyle McFadden January 30, 2015 Overview In 2014, 26 weather stations in four configurations were installed
Measures Also Significant Factors of Flood Disaster Reduction
 Non-Structual Measures Also Significant Factors of Flood Disaster Reduction Babiaková Gabriela, Leškov ková Danica Slovak Hydrometeorological Institute, Bratislava Hydrological Forecasts and Warning Department
The Colorado Drought : 2003: A Growing Concern. Roger Pielke, Sr. Colorado Climate Center.
 The Colorado Drought 2001-2003: 2003: A Growing Concern Roger Pielke, Sr. Colorado Climate Center Prepared by Tara Green and Odie Bliss http://climate.atmos.colostate.edu 2 2002 Drought History in Colorado
interactive web site:
 Utah Snow Training Snow Because every drop counts! Vl Volunteers report tthi their dil daily observations on our interactive web site: http://www.cocorahs.org You will need: 1- A CoCoRaHS C 4-inch rain
Flood Forecasting Tools for Ungauged Streams in Alberta: Status and Lessons from the Flood of 2013
 Flood Forecasting Tools for Ungauged Streams in Alberta: Status and Lessons from the Flood of 2013 John Pomeroy, Xing Fang, Kevin Shook, Tom Brown Centre for Hydrology, University of Saskatchewan, Saskatoon
SLOPE SCALE AVALANCHE FORECASTING IN THE ARCTIC (SVALBARD)
") SLOPE SCALE AVALANCHE FORECASTING IN THE ARCTIC (SVALBARD) Alexander Prokop 1,2 *, Holt Hancock 2, Martin Praz 3, and Elisabeth Jahn 1 1 Snow Scan Research, Engineering, Education GmbH, Vienna, Austria
SLOPE SCALE AVALANCHE FORECASTING IN THE ARCTIC (SVALBARD) Alexander Prokop 1,2 *, Holt Hancock 2, Martin Praz 3, and Elisabeth Jahn 1 1 Snow Scan Research, Engineering, Education GmbH, Vienna, Austria
Great Lakes Update. Volume 193: 2015 January through June Summary. Vol. 193 Great Lakes Update August 2015
 Great Lakes Update Volume 193: 2015 January through June Summary The U.S. Army Corps of Engineers (USACE) monitors the water levels of each of the Great Lakes. This report provides a summary of the Great
NIDIS Intermountain West Regional Drought Early Warning System February 7, 2017
 NIDIS Drought and Water Assessment NIDIS Intermountain West Regional Drought Early Warning System February 7, 2017 Precipitation The images above use daily precipitation statistics from NWS COOP, CoCoRaHS,
Water Information Portal User Guide. Updated July 2014
 Water Information Portal User Guide Updated July 2014 1. ENTER THE WATER INFORMATION PORTAL Launch the Water Information Portal in your internet browser via http://www.bcogc.ca/public-zone/water-information
Climate Change Engineering Vulnerability Assessment. Coquihalla Highway (B.C. Highway 5) Between Nicolum River and Dry Gulch
 Between Nicolum River and Dry Gulch") SSuum mm maarryy ffoorr PPoolliiccyy M Maakkeerrss Climate Change Engineering Vulnerability Assessment Rev 2 June 2, 2010 Rev 2 June 2, 2010 Page 2 of 7 1 Conclusion 1.1 Adaptive Management Process BCMoTI
SSuum mm maarryy ffoorr PPoolliiccyy M Maakkeerrss Climate Change Engineering Vulnerability Assessment Rev 2 June 2, 2010 Rev 2 June 2, 2010 Page 2 of 7 1 Conclusion 1.1 Adaptive Management Process BCMoTI
2011 National Seasonal Assessment Workshop for the Eastern, Southern, & Southwest Geographic Areas
 2011 National Seasonal Assessment Workshop for the Eastern, Southern, & Southwest Geographic Areas On January 11-13, 2011, wildland fire, weather, and climate met virtually for the ninth annual National
Intercomparision of snowfall measured by weighing and tipping bucket precipitation gauges at Jumla Airport, Nepal
 Intercomparision of snowfall measured by weighing and tipping bucket precipitation gauges at Jumla Airport, Nepal Department of Hydrology and Meteorology, Nepal Ministry of Environment, Science and Technology
Climatic Change Implications for Hydrologic Systems in the Sierra Nevada
 Climatic Change Implications for Hydrologic Systems in the Sierra Nevada Part Two: The HSPF Model: Basis For Watershed Yield Calculator Part two presents an an overview of why the hydrologic yield calculator
Minnesota s Climatic Conditions, Outlook, and Impacts on Agriculture. Today. 1. The weather and climate of 2017 to date
 Minnesota s Climatic Conditions, Outlook, and Impacts on Agriculture Kenny Blumenfeld, State Climatology Office Crop Insurance Conference, Sep 13, 2017 Today 1. The weather and climate of 2017 to date
Terrestrial Snow Cover: Properties, Trends, and Feedbacks. Chris Derksen Climate Research Division, ECCC
 Terrestrial Snow Cover: Properties, Trends, and Feedbacks Chris Derksen Climate Research Division, ECCC Outline Three Snow Lectures: 1. Why you should care about snow: Snow and the cryosphere Classes of
Bill Kappel. Doug Hultstrand. Applied Weather Associates
 Cool-Season PMP/PMF Meteorological Time Series for Snow Melt Calculations Bill Kappel Senior Meteorologist/Vice President Doug Hultstrand Hydrometeorologist Applied Weather Associates www.appliedweatherassociates.com