37. Regional Climate Change in the Southern United States: The Implications for Wildfire Occurrence
|
|
|
- Alexina Wilson
- 6 years ago
- Views:
Transcription
1 1998 Springer-Verlag New York, Inc. The Productivity & Sustainability of Southern Forest Ecosystems in a Changing Environment by Mickler & Fox 37. Regional Climate Change in the Southern United States: The Implications for Wildfire Occurrence Warren E. Heilman, Brian E. Potter, and John I. Zerbe Fires have always been an important factor in determining the composition of forests worldwide, but particularly in the southern United States. Wildfires were a common occurrence in American forests in the early twentieth century. Before 1930, wildfires typically accounted for the burning of eight to twenty million hectares (ha) in the United States each year. By the early 1940s, wildfires were still responsible for the annual burning of over eight million ha. Over 90% of the area burned during this time was on privately owned lands, primarily in the southern United States (Fedkiw, 1989). Between 1950 and 1980, the hectares burned by wildfires steadily decreased as the area receiving organized protection increased and the intensity of the protection efforts increased (Peterson, 1982). In recent years, the total area burned by wildfires in the United States has diminished to about one to two million ha per year (USDA Forest Service, 1992). Although the decrease in the number of hectares burned by wildfires across the United States has been significant over the last seventy years, the relative importance of wildfires in the southern United States in relation to other regions of the United States is significant. More hectares are burned by wildfires in the southern United States than in any other region of the country. A notable exception occurred in 1988 when the severe drought that affected many of the central and Rocky Mountain states contributed to the massive wildfires that occurred in the Rocky Mountain region. Between 1984 and 1990, wildfires in the southern region of the United States accounted for 20 to 43% of all hectares burned in the United States. 683
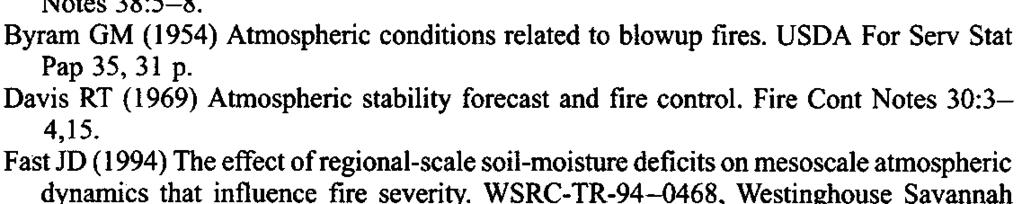
2 684 W.E. Heilman et al. Wildfire occurrence is also much more common in the southern United States than in other parts of the country. The southern and northeastern regions are dominated by human-caused wildfires, and the southern region alone accounts for roughly 53% of all wildfires occurring in the United States, excluding Alaska. Even lightning-caused fires were more common in the southern region over the entire seven-year period between 1984 and 1990 than in any other region, excluding Alaska. Regardless of the cause of wildfires in the southern region or any other region, the occurrence of severe wildfires depends to a large degree on the atmospheric conditions present before, during, and after the time of ignition. The prospect of future global or regional climate changes resulting from an increase in atmospheric carbon dioxide (CO 2 ) concentrations has raised concerns about how largescale changes in the atmosphere associated with a changed climate will affect regional wildfire occurrence. Alteration of the large-scale mean thermal structure of the atmosphere resulting from increased CO 2 concentrations has the potential for affecting the dynamics of the atmosphere across the entire spectrum of scales that govern atmospheric processes. Inherent in these changes are interactions among the scales that could change, resulting in an alteration in the frequency of relatively short-term weather systems that enhance the probability of wildfire occurrence. Indeed, climatic variability and extreme weather events (e.g., drought, flood, extreme heat, fire-weather development) are much more important factors for wildfire occurrence than the effects of systematic climate change (e.g., long-term and large-scale temperature and precipitation trends) (Fosberg et al., 1993). Given the importance of wildfires in the southern United States, this chapter describes some of the recent research efforts that have examined many of the critical atmospheric interactions with southern wildfire occurrence and the implications of regional climate change on the future development of fire-weather systems. The following sections provide an overview of present and recent research dealing with large-scale atmospheric circulation, temperature, and moisture patterns associated with severe wildfires in the region, useful atmospheric variables as indicators of severe fire potential in the region, soil-moisture effects on southern fire-weather development, El Niño/southem oscillation effects on fire occurrence in the southeastern United States, and potential changes in lightningcaused wildfires in the region. Synoptic Circulation, Temperature, and Moisture Patterns Atmospheric conditions play a critical role in affecting the severity of wildfires and the probability of their occurrence in the southern United States, as well as the rest of the country during specific times of the year. Figure 37.1 shows the distribution of severe wildland fires in the south-central and southeastern United States by month for years 1971 to 1984 and 1987 to Although severe wildland fires in the south-central United States typically occur during the months of March and April, severe fires in the southeastern United States generally occur
3 37. Climate Change: Implications for Wildfire Occurrence 685 Figure Number of wildfires burning more than 400 ha in the south-central United States (i.e., Texas. Oklahoma, Kansas, Missouri, Arkansas, Louisiana) and the southeastern United States (SE: Mississippi, Alabama, Georgia, Florida, South Carolina, North Carolina, Kentucky, Tennessee, Virginia) from 1971 to 1984 and 1987 to between March and June. Secondary peaks in severe wildfire occurrence typically occur in the month of November. There are specific synoptic-scale circulation patterns in the middle troposphere during these months that tend to be associated with severe wildfires in the southern United States. These circulation patterns result in temperature and moisture distributions in the lower atmosphere that enhance the probability of severe fires occurring. Heilman (1995) expanded upon the work of Schroeder et al., (1964) to examine the prevalent circulation patterns at the onset of past severe fires in six different regions of the United States. Using empirical-orthogonal-function analyses of the observed geopotential heights at the 500 mb pressure level in the atmosphere at the onset of severe wildfires in the United States, it was shown that severe wildfires in the south-central and southeastern United States are associated with three distinct mid-tropospheric circulation patterns. Examples of these patterns are shown in Figures 37.2a,b,c. Severe wildfires occurred on these days in the southeastern United States. The first pattern (Figure 37.2a) is described by a middle tropospheric ridge over the western half of the United States with an accompanying trough over the eastern United States that results in northwesterly to westerly flow over the southeastern United States. This circulation pattern tends to bring cool dry air from Canada into the southern and eastern states. The second pattern (Figure ) is described by a middle tropospheric ridge over the eastern half of the United States, with the western or central states dominated by a
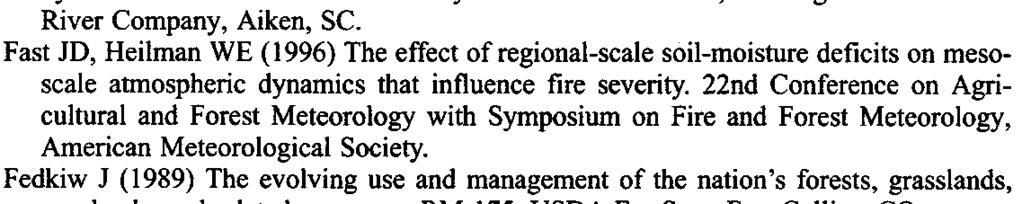
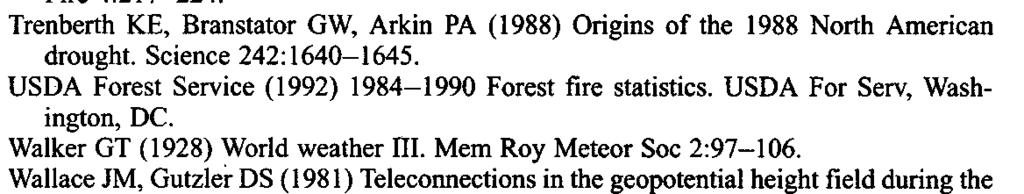
 and circulation (vectors in m s 1 ) patterns associated with severe")
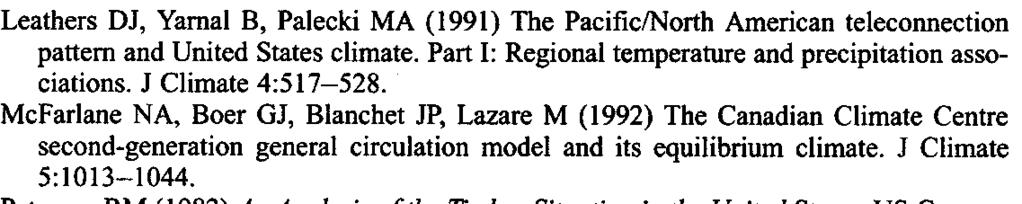
4 a b c Figure Recent examples of three 500 mb geopotential height (contours in meters) and circulation (vectors in m s 1 ) patterns associated with severe wildfires in the southeastern United States that occurred on: (a) April 6, 1989, (b) March 13, 1990, and (c) May 27, 1989.
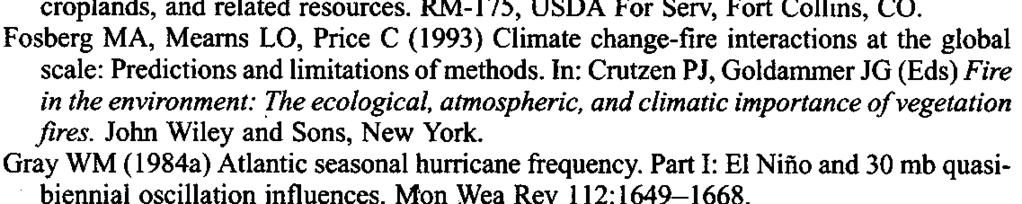
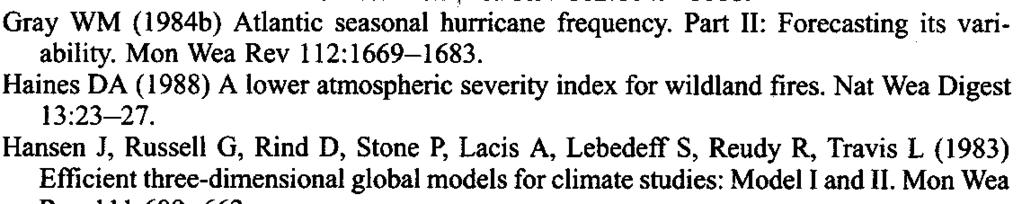
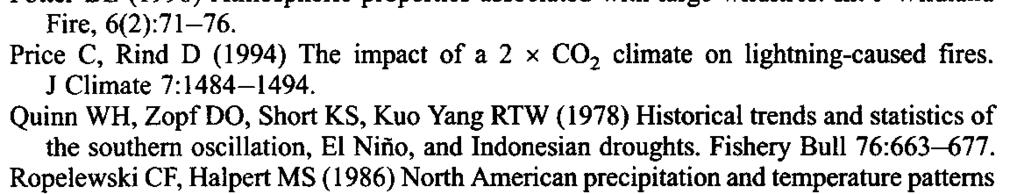
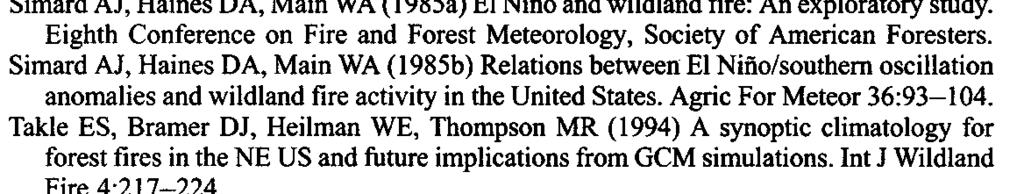
5 37. Climate Change: Implications for Wildfire Occurrence 687 middle tropospheric trough. This pattern can be very conducive to the westward shift of the surface Bermuda high-pressure system, leading to hot and dry conditions over parts of the southeastern and northeastern United States. These first two patterns are equivalent to the positive and negative phases, respectively, of the Pacific/North American (PNA) teleconnection pattern (Wallace and Gutzler, 1981) that is responsible for much of the climate variability in the northern hemisphere during the autumn, winter, and spring months (Leathers et al., 1991). The third circulation pattern is shown in Figure 37.2c and is characterized by middle tropospheric zonal flow over the southern regions of the United States. These circulation patterns that are associated with severe wildfires in the southcentral and southeastern United States produce lower atmospheric temperature and moisture patterns that enhance the probability of fire occurrence if fuel conditions are adequate. Figures 37.3a,b,c and Figures 37.4a,b,c show the corresponding average lower atmospheric temperature and relative humidity anomalies over the United States when severe wildland tires occurred in the southeastern United States from 1971 to 1984 and 1987 to The first circulation pattern (Figure 37.2a) resulted in lower than normal 850 mb temperatures over the eastern half of the United States, with maximum temperature anomalies occurring over the Ohio River Valley. Average temperature anomalies at 850 mb over the southeastern United States ranged from 1 C in Florida to about 5 C in Kentucky (Figure 37.3a). The second circulation pattern (Figure 37.2b) resulted in warmer than normal temperatures at 850 mb over all the eastern United States. Average temperature anomalies reached about 5 C over the northeastern United States, and decreased southward to about 1 C over southern Florida (Figure 37.3b). The zonal circulation pattern over the southern United States (Figure 37.2c) resulted in positive 850 mb temperature anomalies over the southern half of the United States, with the southeastern Upited States experiencing average temperature anomalies of 1 to 2 C (Figure 37.3c). For all three circulation patterns, lowerthan-normal relative humidity values occurred over at least a portion of the southeastern United States (Figures 37.4a,b,c). The average lower atmospheric moisture anomalies associated with the second circulation pattern (Figures 37.2b and 37.4b) indicate that although this pattern tends to produce dry atmospheric conditions over most of the Atlantic coast states and eastern Great Lakes region, the states west of Alabama, Tennessee, and Kentucky typically experience higherthan-normal relative humidity values. It is not uncommon for significant portions of the south-central and southeastern United States to experience higher-thannormal relative humidity values under the second circulation pattern. The location of the Bermuda high-pressure system under this particular circulation pattern determines where the northward transport of Gulf moisture will occur and those southeastern and northeastern states that will be cut off from the supply of Gulf moisture. The average lower atmospheric temperature and relative humidity anomalies occurring during severe wildland tire episodes in the south-central United States over the same time period for each of the three identified circulation patterns are shown in Figures 37.5a,b,c and Figures 37.6a,b,c, respectively. The temperature
 at the 850 mb pressure level during past tire-weather episodes in the southeastern United")
6 a b c Figure Average temperature anomalies ( K) at the 850 mb pressure level during past tire-weather episodes in the southeastern United States having circulation patterns similar to those shown in: (a) Figure 37.2a, (b) Figure 37.2b, and (c) Figure 37.2c.
 in the lower atmosphere during past tire-weather episodes in the southeastern United States")
7 a b c Figure Average relative humidity anomalies (%) in the lower atmosphere during past tire-weather episodes in the southeastern United States having circulation patterns similar to those shown in: (a) Figure 37.2a, (b) Figure 37.2b, and (c) Figure 37.2c.
 at the 850 mb pressure level during past tire-weather episodes in the south-central United")
8 a b c Figure Average temperature anomalies ( K) at the 850 mb pressure level during past tire-weather episodes in the south-central United States having circulation patterns similar to those shown in: (a) Figure 37.2a, (b) Figure 37.2b, and (c) Figure 37.2c.
 in the lower atmosphere during past fire-weather episodes in the south-central United")
9 a b c Figure Average relative humidity anomalies (%) in the lower atmosphere during past fire-weather episodes in the south-central United States having circulation patterns similar to those shown in: (a) Figure 37.2a, (b) Figure 37.2b, and (c) Figure 37.2c.
10 692 W.E. Heilman et al. patterns are similar to the patterns shown in Figures 37.3a,b,c, although the magnitudes of the computed anomalies are generally larger in Figures 37.5a,b,c because of the smaller sample size of wildland fire episodes in the south-central United States compared to the southeastern United States. The average relative humidity anomaly patterns associated with wildland tires in the southeastern (Figures 37.4a,b,c) and south-central (Figures 37.6a,b,c) United States and corresponding to the three identified circulation patterns show some differences, particularly in the spatial extent of negative humidity anomalies over the eastern half of the United States. When severe wildland fires occurred in the south-central United States for all three circulation patterns, most of the United States was characterized by drier-than-normal, lower atmospheric conditions. The spatial extent of dry conditions in the lower atmosphere was less pronounced when severe fires occurred in the southeastern U.S, particularly under the circulation patterns shown in Figures 37.2b,c. However, each circulation pattern associated with tires in the south-central and southeastern United States results in lowerthan-normal relative humidity values over some portion of the regions. The significance of lower atmospheric moisture as an indicator of the potential for wildfire occurrence in the southern United States is supported by Potter (1995, 1996) as well. In a study related to the work of Heilman (1995), Takle et al., (1994) examined surface-pressure patterns associated with reduced precipitation, high evaporation potential, and enhanced wildfire danger in the West Virginia area, and compared these observations with surface-pressure fields generated by the Canadian Climate Centre general circulation model (GCMII) (Boer et al, 1992; McFarlane et al., 1992) for simulations of the present climate and a doubled Co, climate. Using the eight synoptic meteorology patterns that tend to influence the eastern United States, as defined by Yarnal (1993) they observed that an extended high-pressure system situated over the eastern half of the United States, a high-pressure system situated off the eastern coast of the United States, and a high-pressure system centered over the western Great Lakes region are the three most common surfacepressure patterns associated with severe wildfires in the West Virginia area. Simulations of surface-pressure fields from the GCMII for the present climate and a doubled CO, climate suggested a tendency for the occurrence of more surfacepressure patterns that result in drier conditions in the northeastern United States under a changed climate. Most of the surface-pressure patterns identified by Takle et al., (1994) that produce dry conditions and enhanced fire potential in the northeastern United States are also conducive to dry conditions and increased tire potential in at least some portions of the southeastern United States. In particular, the increased occurrence of high-pressure systems centered over the Gulf coast of the United States in the changed climate simulations performed by Takle et al., (1994) suggests that the southeastern United States may experience more dry days. High-pressure systems located near the Gulf coast tend to block the transport of Gulf moisture northward over the eastern states. This surface-pressure pattern usually develops in response to mid-tropospheric circulation patterns similar to those shown in Figures 37.3b,c, which have been found to be associated
11 37. Climate Change: Implications for Wildfire Occurrence 693 with severe wildfires in the south-central and southeastern United States (Heilman, 1995). Thus, the potential for more fire-weather episodes in the southcentral and southeastern United States would probably increase under this scenario. Atmospheric Indicators of Severe Wildfire Potential In addition to the studies that have identified those atmospheric synoptic patterns conducive to severe wildfire occurrence in the southern United States, other studies have focused on specific atmospheric variables that are indicative of severe wildfire occurrence. For example, such studies as Byram (1954), Davis (1969), and Brotak and Reifsnyder (1977) examined various atmospheric conditions at or near the earth s surface and their relationships to large wildfires, including neat-surface wind speeds and profiles, frontal positions, and temperature profiles. The conditions generally considered as favorable to large wildfires are dry air and an unstable temperature profile (i.e., temperatures decreasing more than 1 C for every 100 m increase in altitude). Brotak and Reifsnyder (1977) examined atmospheric profiles for fifty-two fires, more than half of which occurred in the southeastern United States. They concluded that a low-level wind jet often accompanied the occurrence of large wildland tires. They defined this jet as a wind maximum within 3,050 m of the surface where the wind speed is 2.2 m s 1 greater than the speed 305 m above or below. They did not examine conditions on nonfire days, hence there is no indication of whether such a jet is also found on days when no fire occurred. In the most recent study of specific atmospheric variables associated with severe wildfires, Potter (1996) used analysis of variance (ANOVA) to examine how strongly atmospheric conditions differ on the days of large wildfires (over 400 ha) as compared to climatological conditions. Surface temperature, dewpoint depression, relative humidity, wind speed, wind shear, and stability were all considered. There was no indication that temperature at the surface, or stability or wind shear in the lowest 100 to 1000 m are any different when large wildfires occur than at any other time. Surface wind speed and relative humidity showed some tendency to differ from normal on large wildfire days, though not in Florida. Dewpoint depression showed the most significant difference and was most widespread in its ability to discriminate between normal conditions and large wildfire conditions. It was significant all along the southeastern Atlantic coast (from Virginia to Palm Beach, Florida), the region for which the most data were examined. The relationships between the findings of Brotak and Reifsnyder (1977) and Potter (1996) and the potential atmospheric conditions associated with a changed climate are difficult to determine. However, these studies do suggest that changes in the frequency or intensity of weather systems that produce low-level jets or that move dry air masses with large surface dewpoint depressions and low relative humidity values into the southern United States could affect the frequency of severe wildfires there.
12 694 W.E. Heilman et al. Soil-Moisture Effects on Fire-Weather Development Along with the specific large-scale circulation patterns that result in drier-thannormal conditions and enhanced wildfire probabilities in the south-central and southeastern United States, regional soil-moisture variations can also influence the development of fire-weather systems. Fast (1994) and Fast and Heilman (1996) examined the effects of soil-moisture deficits on the atmospheric mesoscale dynamics that influence tire severity. Using the regional atmospheric modeling system (RAMS) (Pielke et al., 1992) a three-dimensional nonhydrostatic mesoscale model, simulations of past fire-weather episodes in the southeastern United States were performed to examine the role of soil moisture and vegetation within and outside the southeastern United States in affecting fire-weather development in the region, as measured by the lower atmospheric severity index (LASI) (Haines, 1988). Meteorological conditions were simulated during the period May 5 to 17, 1989 when Florida experienced numerous wildfires and moderate to severe drought conditions were observed in central and southern Florida and in the northern Great Plains. During this same period, moderate to severe wet conditions were observed over much of the northeastern United States and in the states north and west of Georgia in the southeastern United States. Circulations in the middle atmosphere during this period were very similar to one particular circulation pattern identified by Heilman (1995) as being conducive for severe wildfires in the southeastern United States (see Figure 37.2a). Sensitivity tests performed with the RAMS model indicated that the addition of soil moisture significantly affects the nearsurface temperature and relative humidity fields, and affects cloud cover, precipitation, and wind speeds to a lesser extent. The simulations also indicated that the effects of soil moisture are most pronounced where the soil is sufficiently moist, but the advection of evaporated moisture from wet-soil regions can occasionally increase the relative humidity observed at locations downwind of the wetsoil regions. Daytime surface temperatures and relative humidity values are reduced and increased, respectively, when soil moisture is increased. Vegetation was found to moderate the transfer of water from the soil into the atmosphere. In regions where soil is wet, the presence of vegetation reduces the amount of water evaporated into the atmosphere, and where the soil is relatively dry, the presence of vegetation increases the amount of water evaporated compared to regions with little vegetation. Vegetation also reduces the speed of surface wind through the inhomogeneous roughness and plant lengths that increase the surface friction. Fast (1994) and Fast and Heilman (1996) found that tire-weather development in the southeastern United States., as measured by the LASI, is affected by soil moisture and vegetation distributions that determine the degree of evapotranspiration in a region. Values of LASI were reduced in areas of significant evapotranspiration because the additional moisture added to the atmospheric boundary layer reduces the lower atmospheric dew point depression, thereby reducing the probability of severe wildfire occurrence. The implication of this phenomenon is that surface evapotranspiration in regions of moist soil or significant vegetation
13 37. Climate Change: Implications for Wildfire Occurrence 695 upwind of the south-central or southeastern United States have the potential for reducing the probability of severe wildland fire occurrence in the southern United States because of the advection of low-level moisture. Thus, although large-scale circulation patterns in the middle atmosphere may be conducive to severe wildland fires in the southern United States, regional soil moisture and surface evapotranspiration patterns within and outside the region must also be considered in assessing the potential for severe wildfires in the southern United States and elsewhere. El Niño/Southern Oscillation Effects Because severe wildfires are strongly linked to relatively short-term weather events that produce conditions favorable for their occurrence, any large-scale circulation changes in the atmosphere brought about by global climatic forcing factors have the potential for altering circulation patterns in the United States and modifying the normal frequency of weather events conducive to severe wildfires. One particular forcing factor that has a major influence on atmospheric circulation patterns over North America is the El Niño/southem oscillation (ENSO) phenomenon. El Niño is a term that refers to the periodic extreme warming of surface ocean water in the eastern tropical Pacific Ocean (Wyrtki, 1979). This periodic warming has been shown to be associated with the southern oscillation, a periodic fluctuation in surface pressures observed in the western and eastern Pacific Ocean (Walker, 1928; Bjerknes, 1969). El Niño/southem oscillation events typically occur every three to eight years (Haston and Michaelsen, 1994) and they have been linked to changes in observed midlatitude circulation and weather patterns through atmospheric teleconnections. For example, Horel and Wallace (1981) showed that ENSO events are correlated with below-normal 700 mb geopotential heights in the northern Pacific and the southeastern United States, and above normal-heights over western Canada. Gray (1984a, 1984b) found that the seasonal number of hurricanes and hurricane days was negatively correlated with moderate to strong ENSO events. Ropelewski and Halpert (1986) used monthly precipitation and temperature data from from sites throughout North America to show that ENSO events are associated with above normal precipitation and below-normal temperatures in parts of the southeastern United States starting in October of ENSO years and ending in March of the following years. Trenberth et al., (1988) identified tropical Pacific sea-surface temperature changes associated with the 1988 La Niña episode as the primary factor responsible for the atmospheric circulations over North America that caused the severe drought in the Great Plains region of the United States. Many other studies have also been conducted in recent years that indicate a relation between ENSO events and climatic and weather variability over the United States and North America. The observed changes in atmospheric circulation and weather patterns associated with ENSO events, particularly trends in precipitation, suggest that ENSO
14 696 W.E. Heilman et al. events may influence the probability of severe wildfire occurrence and the number of hectares burned as a result of wildfires in certain regions of the United States. The most notable study examining ENSO/wildfire relationships was performed by Simard et al., (1985a, 1985b). They used fifty-seven years of tire activity data (1926 to 1982) along with El Niño occurrence and intensity level data (Quinn et al., 1978) to identify specific regions of the United States that tend to show changes in wildfire activity during ENSO episodes. It was found that annual tire activity in the southern region tends to decrease during El Niño years, the relation between tire activity and ENSO episodes in the north-central and eastern regions is weak, and that there is no evidence that ENSO episodes affect fire activity in the Pacific or Rocky Mountain regions. Lightning Large-scale circulation conditions in the atmosphere also play a role in the development of regional weather systems that produce lightning, a factor in wildfire occurrence throughout the country. Although large wildfires attributed to cloud-to-ground lightning strikes are much more common in the western United States., lightning is responsible for about 1,000 to 3,000 wildfires on Federal, State, and private lands in the southern United States each year (USDA Forest Service, 1992). Lightning-caused wildfires have been responsible for the burning of over 121,000 ha in some years in the southern United States. Changes in global and regional climates could result in increased frequency of weather patterns associated with drought conditions, leading to enhanced fuel dryness, and thunderstorms that generate cloud-to-ground lightning strikes, leading to fuel ignition. Price and Rind (1994) examined the impact of a changed climate resulting from an increase in atmospheric CO, concentration on lightning-caused wildfires in North America and in different regions of the United States, using the Goddard Institute for Space Studies (GISS) general circulation model (GCM) (Hansen et al., 1983). Their modeling study suggested that the number of lightning-caused wildfires in the entire United States could increase by approximately 44% over the present number. The total area burned in the United States was projected to increase by about 78%. For the south-central and southeastern regions of the United States, their modeling study suggested increases on the order of 40 to 50% in the number of wildfires caused by lightning each year. Contributing to these increases is the probable decrease in the average effective precipitation (defined as precipitation minus potential evapotranspiration) over the United States under a changed climate as a result of increased atmospheric CO 2 concentrations (Price and Rind, 1994). Summary An overview of present and recent research on atmospheric interactions with wildfire occurrence in the south-central and southeastern United States and the
15 37. Climate Change: Implications for Wildfire Occurrence 697 potential implications for fire occurrence in these regions under a changed climate have been presented. Because wildfire occurrence is very dependent on relatively short-term weather events along with fuel conditions, present research has partly focused on identifying the critical atmospheric circulation patterns that lead to enhanced wildfire activity in different regions of the United States., including the Southern Global Change Program (SCGP) study region. The results indicate that there are three specific circulation patterns in the middle atmosphere that are prevalent at the onset of severe wildfires in the south-central and southeastern United States. These circulation patterns produce drier-than-normal conditions over many parts of the south-central and southeastern United States during the spring and fall fire seasons. Examinations of the surface-pressure patterns associated with severe wildfire occurrence in the eastern United States and comparisons with general circulation model simulations under doubled CO 2 conditions tend to suggest the future occurrence of more surface pressure and atmospheric circulation patterns that produce drier conditions in the eastern and southeastern United States. Present-day research substantiates the importance of near-surface moisture (surface dew point depression values) as an indicator of enhanced wildfire activity in the southeastern United States. Recent research has also focused on the additional effects of vegetation and soil-moisture variations on fire-weather development over the southeastern United States. Research results indicate the importance of soil moisture within and outside the southern United States in affecting fire-weather development in the region. Evaporation from wet-soil regions and the advection of moisture into regions that are much drier tend to reduce the potential for severe wildfire occurrence in the drier regions, as measured by the LASI. The presence of vegetation moderates the transfer of moisture to the atmosphere in wet- and dry-soil areas. Other research has focused 9 lightning as a causative agent for wildfires. General circulation model simulatidns suggest that the south-central and southeastern United States will experience more lightning-caused wildfires under a changed climate resulting from increased atmospheric CO 2 concentrations. The periodic fluctuations in sea-surface temperatures in the eastern Pacific Ocean, commonly referred to as El Niño episodes, have also been shown to have a major impact on wildfire occurrence in the southeastern United States. El Niño events tend to reduce wildfire activity in this region. However, it is uncertain what impact periodic El Niño events would have on circulation patterns over the United States and wildfire activity in the southern states under a changed climate because of increased atmospheric CO 2 concentrations. Given the importance of wildfires in the south-central and southeastern United States, as reflected in the yearly totals of wildfire numbers and hectares burned, there is a need to better understand the potential ramifications of a changed climate and climate variability on wildfire activity in the region. The research results outlined in this chapter provide insight into some of the key atmospheric processes involved with wildfire occurrence in the southern states. They provide the foundation for new studies that are needed to further examine the relationship between those atmospheric processes relevant to large-scale climatic changes and

16 698 W.E. Heilman et al. the smaller-scale atmospheric dynamics that are most relevant to regional fireweather development and wildfire occurrence in the southern states. References


17 37. Climate Change: Implications for Wildfire Occurrence 699
National Wildland Significant Fire Potential Outlook
 National Wildland Significant Fire Potential Outlook National Interagency Fire Center Predictive Services Issued: September, 2007 Wildland Fire Outlook September through December 2007 Significant fire
National Wildland Significant Fire Potential Outlook
 National Wildland Significant Fire Potential Outlook National Interagency Fire Center Predictive Services Issued: April 1, 2008 Next Issue: May 1, 2008 Wildland Fire Outlook April 2008 through July 2008
2011 National Seasonal Assessment Workshop for the Eastern, Southern, & Southwest Geographic Areas
 2011 National Seasonal Assessment Workshop for the Eastern, Southern, & Southwest Geographic Areas On January 11-13, 2011, wildland fire, weather, and climate met virtually for the ninth annual National
Weather and Climate Summary and Forecast April 2018 Report
 Weather and Climate Summary and Forecast April 2018 Report Gregory V. Jones Linfield College April 4, 2018 Summary: A near Miracle March played out bringing cooler and wetter conditions to the majority
Weather and Climate Summary and Forecast February 2018 Report
 Weather and Climate Summary and Forecast February 2018 Report Gregory V. Jones Linfield College February 5, 2018 Summary: For the majority of the month of January the persistent ridge of high pressure
Weather and Climate Summary and Forecast January 2018 Report
 Weather and Climate Summary and Forecast January 2018 Report Gregory V. Jones Linfield College January 5, 2018 Summary: A persistent ridge of high pressure over the west in December produced strong inversions
Weather and Climate Summary and Forecast March 2018 Report
 Weather and Climate Summary and Forecast March 2018 Report Gregory V. Jones Linfield College March 7, 2018 Summary: The ridge pattern that brought drier and warmer conditions from December through most
Drought Impacts in the Southern Great Plains. Mark Shafer University of Oklahoma Norman, OK
 Drought Impacts in the Southern Great Plains Mark Shafer University of Oklahoma Norman, OK Causes of Drought: Large-Scale, Stationary High Pressure Air rotates clockwise around high pressure steers storms
Weather and Climate Summary and Forecast August 2018 Report
 Weather and Climate Summary and Forecast August 2018 Report Gregory V. Jones Linfield College August 5, 2018 Summary: July 2018 will likely go down as one of the top five warmest July s on record for many
Weather and Climate Summary and Forecast December 2017 Report
 Weather and Climate Summary and Forecast December 2017 Report Gregory V. Jones Linfield College December 5, 2017 Summary: November was relatively cool and wet from central California throughout most of
Impacts of the April 2013 Mean trough over central North America
 Impacts of the April 2013 Mean trough over central North America By Richard H. Grumm National Weather Service State College, PA Abstract: The mean 500 hpa flow over North America featured a trough over
Wind: Global Systems Chapter 10
 Wind: Global Systems Chapter 10 General Circulation of the Atmosphere General circulation of the atmosphere describes average wind patterns and is useful for understanding climate Over the earth, incoming
PRMS WHITE PAPER 2014 NORTH ATLANTIC HURRICANE SEASON OUTLOOK. June RMS Event Response
 PRMS WHITE PAPER 2014 NORTH ATLANTIC HURRICANE SEASON OUTLOOK June 2014 - RMS Event Response 2014 SEASON OUTLOOK The 2013 North Atlantic hurricane season saw the fewest hurricanes in the Atlantic Basin
Weather and Climate Summary and Forecast January 2019 Report
 Weather and Climate Summary and Forecast January 2019 Report Gregory V. Jones Linfield College January 4, 2019 Summary: December was mild and dry over much of the west, while the east was much warmer than
Weather and Climate Summary and Forecast November 2017 Report
 Weather and Climate Summary and Forecast November 2017 Report Gregory V. Jones Linfield College November 7, 2017 Summary: October was relatively cool and wet north, while warm and very dry south. Dry conditions
Weather and Climate Summary and Forecast March 2019 Report
 Weather and Climate Summary and Forecast March 2019 Report Gregory V. Jones Linfield College March 2, 2019 Summary: Dramatic flip from a mild winter to a top five coldest February on record in many locations
Analysis of Fall Transition Season (Sept-Early Dec) Why has the weather been so violent?
 Why has the weather been so violent?") WEATHER TOPICS Analysis of Fall Transition Season (Sept-Early Dec) 2009 Why has the weather been so violent? As can be seen by the following forecast map, the Fall Transition and early Winter Season of
WEATHER TOPICS Analysis of Fall Transition Season (Sept-Early Dec) 2009 Why has the weather been so violent? As can be seen by the following forecast map, the Fall Transition and early Winter Season of
Weather and Climate Summary and Forecast October 2017 Report
 Weather and Climate Summary and Forecast October 2017 Report Gregory V. Jones Linfield College October 4, 2017 Summary: Typical variability in September temperatures with the onset of fall conditions evident
Chapter outline. Reference 12/13/2016
 Chapter 2. observation CC EST 5103 Climate Change Science Rezaul Karim Environmental Science & Technology Jessore University of science & Technology Chapter outline Temperature in the instrumental record
TROPICAL-EXTRATROPICAL INTERACTIONS
 Notes of the tutorial lectures for the Natural Sciences part by Alice Grimm Fourth lecture TROPICAL-EXTRATROPICAL INTERACTIONS Anomalous tropical SST Anomalous convection Anomalous latent heat source Anomalous
Climate Outlook through 2100 South Florida Ecological Services Office Vero Beach, FL September 9, 2014
 Climate Outlook through 2100 South Florida Ecological Services Office Vero Beach, FL September 9, 2014 Short Term Drought Map: Short-term (
Climate. Annual Temperature (Last 30 Years) January Temperature. July Temperature. Average Precipitation (Last 30 Years)
 January Temperature. July Temperature. Average Precipitation (Last 30 Years)") Climate Annual Temperature (Last 30 Years) Average Annual High Temp. (F)70, (C)21 Average Annual Low Temp. (F)43, (C)6 January Temperature Average January High Temp. (F)48, (C)9 Average January Low Temp.
Climate Annual Temperature (Last 30 Years) Average Annual High Temp. (F)70, (C)21 Average Annual Low Temp. (F)43, (C)6 January Temperature Average January High Temp. (F)48, (C)9 Average January Low Temp.
Causes of the billion-dollar drought in North America in a verification study
 Prairie Perspectives 17 Causes of the billion-dollar drought in North America in 1999 - a verification study E.R Garnett University of Saskatchewan Introduction In August and September, 1999 the Toronto
Climate and the Atmosphere
 Climate and Biomes Climate Objectives: Understand how weather is affected by: 1. Variations in the amount of incoming solar radiation 2. The earth s annual path around the sun 3. The earth s daily rotation
Weather and Climate Summary and Forecast Fall/Winter 2016
 Weather and Climate Summary and Forecast Fall/Winter 2016 Gregory V. Jones Southern Oregon University November 5, 2016 After a year where we were seemingly off by a month in terms of temperatures (March
Weather and Climate Summary and Forecast Winter
 Weather and Climate Summary and Forecast Winter 2016-17 Gregory V. Jones Southern Oregon University February 7, 2017 What a difference from last year at this time. Temperatures in January and February
Summer 2018 Southern Company Temperature/Precipitation Forecast
 Scott A. Yuknis High impact weather forecasts, climate assessment and prediction. 14 Boatwright s Loop Plymouth, MA 02360 Phone/Fax 508.927.4610 Cell: 508.813.3499 ClimateImpact@comcast.net Climate Impact
Weather and Climate Summary and Forecast Winter
 Weather and Climate Summary and Forecast Winter 2016-17 Gregory V. Jones Southern Oregon University December 5, 2016 Well after an October that felt more like November, we just finished a November that
4/29/2011. Mid-latitude cyclones form along a
 Chapter 10: Cyclones: East of the Rocky Mountain Extratropical Cyclones Environment prior to the development of the Cyclone Initial Development of the Extratropical Cyclone Early Weather Along the Fronts
The New Normal or Was It?
 The New Normal or Was It? by Chuck Coffey The recent drought has caused many to reflect upon the past and wonder what is in store for the future. Just a couple of years ago, few agricultural producers
Fire Weather Drivers, Seasonal Outlook and Climate Change. Steven McGibbony, Severe Weather Manager Victoria Region Friday 9 October 2015
 Fire Weather Drivers, Seasonal Outlook and Climate Change Steven McGibbony, Severe Weather Manager Victoria Region Friday 9 October 2015 Outline Weather and Fire Risk Environmental conditions leading to
How Patterns Far Away Can Influence Our Weather. Mark Shafer University of Oklahoma Norman, OK
 Teleconnections How Patterns Far Away Can Influence Our Weather Mark Shafer University of Oklahoma Norman, OK Teleconnections Connectedness of large-scale weather patterns across the world If you poke
El Niño / Southern Oscillation
 El Niño / Southern Oscillation Student Packet 2 Use contents of this packet as you feel appropriate. You are free to copy and use any of the material in this lesson plan. Packet Contents Introduction on
Weather and Climate Summary and Forecast October 2018 Report
 Weather and Climate Summary and Forecast October 2018 Report Gregory V. Jones Linfield College October 4, 2018 Summary: Much of Washington, Oregon, coastal California and the Bay Area and delta region
Monthly Long Range Weather Commentary Issued: APRIL 18, 2017 Steven A. Root, CCM, Chief Analytics Officer, Sr. VP,
 Monthly Long Range Weather Commentary Issued: APRIL 18, 2017 Steven A. Root, CCM, Chief Analytics Officer, Sr. VP, sroot@weatherbank.com MARCH 2017 Climate Highlights The Month in Review The average contiguous
1. Which weather map symbol is associated with extremely low air pressure? A) B) C) D) 2. The diagram below represents a weather instrument.
 B) C) D) 2. The diagram below represents a weather instrument.") 1. Which weather map symbol is associated with extremely low air pressure? 2. The diagram below represents a weather instrument. Which weather variable was this instrument designed to measure? A) air pressure
1. Which weather map symbol is associated with extremely low air pressure? 2. The diagram below represents a weather instrument. Which weather variable was this instrument designed to measure? A) air pressure
Seasonal Climate Watch January to May 2016
 Seasonal Climate Watch January to May 2016 Date: Dec 17, 2015 1. Advisory Most models are showing the continuation of a strong El-Niño episode towards the latesummer season with the expectation to start
2013 ATLANTIC HURRICANE SEASON OUTLOOK. June RMS Cat Response
 2013 ATLANTIC HURRICANE SEASON OUTLOOK June 2013 - RMS Cat Response Season Outlook At the start of the 2013 Atlantic hurricane season, which officially runs from June 1 to November 30, seasonal forecasts
Name: Date: Hour: Comparing the Effects of El Nino & La Nina on the Midwest (E4.2c)
") Purpose: Comparing the Effects of El Nino & La Nina on the Midwest (E4.2c) To compare the effects of El Nino and La Nina on the Midwest United States. Background Knowledge: The El Nino-Southern Oscillation
Purpose: Comparing the Effects of El Nino & La Nina on the Midwest (E4.2c) To compare the effects of El Nino and La Nina on the Midwest United States. Background Knowledge: The El Nino-Southern Oscillation
MDA WEATHER SERVICES AG WEATHER OUTLOOK. Kyle Tapley-Senior Agricultural Meteorologist May 22, 2014 Chicago, IL
 MDA WEATHER SERVICES AG WEATHER OUTLOOK Kyle Tapley-Senior Agricultural Meteorologist May 22, 2014 Chicago, IL GLOBAL GRAIN NORTH AMERICA 2014 Agenda Spring Recap North America Forecast El Niño Discussion
THE INFLUENCE OF CLIMATE TELECONNECTIONS ON WINTER TEMPERATURES IN WESTERN NEW YORK INTRODUCTION
 Middle States Geographer, 2014, 47: 60-67 THE INFLUENCE OF CLIMATE TELECONNECTIONS ON WINTER TEMPERATURES IN WESTERN NEW YORK Frederick J. Bloom and Stephen J. Vermette Department of Geography and Planning
Climate.tgt, Version: 1 1
 Name: Key Concepts Choose the letter of the best answer. (5 points each) 1. 2. 3. 4. 5. 6. 7. 8. 9. 10. Date: A city located in the middle of North America experiences extreme temperature changes during
Weather and Climate Summary and Forecast Summer 2017
 Weather and Climate Summary and Forecast Summer 2017 Gregory V. Jones Southern Oregon University August 4, 2017 July largely held true to forecast, although it ended with the start of one of the most extreme
CHAPTER 11 THUNDERSTORMS AND TORNADOES MULTIPLE CHOICE QUESTIONS
 CHAPTER 11 THUNDERSTORMS AND TORNADOES MULTIPLE CHOICE QUESTIONS 1. A thunderstorm is considered to be a weather system. a. synoptic-scale b. micro-scale c. meso-scale 2. By convention, the mature stage
ATMOSPHERIC MODELLING. GEOG/ENST 3331 Lecture 9 Ahrens: Chapter 13; A&B: Chapters 12 and 13
 ATMOSPHERIC MODELLING GEOG/ENST 3331 Lecture 9 Ahrens: Chapter 13; A&B: Chapters 12 and 13 Agenda for February 3 Assignment 3: Due on Friday Lecture Outline Numerical modelling Long-range forecasts Oscillations
DEPARTMENT OF EARTH & CLIMATE SCIENCES Name SAN FRANCISCO STATE UNIVERSITY Nov 29, ERTH 360 Test #2 200 pts
 DEPARTMENT OF EARTH & CLIMATE SCIENCES Name SAN FRANCISCO STATE UNIVERSITY Nov 29, 2018 ERTH 360 Test #2 200 pts Each question is worth 4 points. Indicate your BEST CHOICE for each question on the Scantron
An ENSO-Neutral Winter
 An ENSO-Neutral Winter This issue of the Blue Water Outlook newsletter is devoted towards my thoughts on the long range outlook for winter. You will see that I take a comprehensive approach to this outlook
CHAPTER 9 ATMOSPHERE S PLANETARY CIRCULATION MULTIPLE CHOICE QUESTIONS
 CHAPTER 9 ATMOSPHERE S PLANETARY CIRCULATION MULTIPLE CHOICE QUESTIONS 1. Viewed from above in the Northern Hemisphere, surface winds about a subtropical high blow a. clockwise and inward. b. counterclockwise.
Climate Outlook through 2100 South Florida Ecological Services Office Vero Beach, FL January 13, 2015
 Climate Outlook through 2100 South Florida Ecological Services Office Vero Beach, FL January 13, 2015 Short Term Drought Map: Short-term (
Early May Cut-off low and Mid-Atlantic rains
 Abstract: Early May Cut-off low and Mid-Atlantic rains By Richard H. Grumm National Weather Service State College, PA A deep 500 hpa cutoff developed in the southern Plains on 3 May 2013. It produced a
MPACT OF EL-NINO ON SUMMER MONSOON RAINFALL OF PAKISTAN
 MPACT OF EL-NINO ON SUMMER MONSOON RAINFALL OF PAKISTAN Abdul Rashid 1 Abstract: El-Nino is the dominant mod of inter- annual climate variability on a planetary scale. Its impact is associated worldwide
Weather Outlook: 2015 Growing Season
 Weather Outlook: 2015 Growing Season Leon F. Osborne Chester Fritz Distinguished Professor Regional Weather Information Center University of North Dakota Grand Forks, North Dakota Why Should We Be Concerned?
Global Atmospheric Circulation
 Global Atmospheric Circulation Polar Climatology & Climate Variability Lecture 11 Nov. 22, 2010 Global Atmospheric Circulation Global Atmospheric Circulation Global Atmospheric Circulation The Polar Vortex
Weather and Climate Summary and Forecast Summer 2016
 Weather and Climate Summary and Forecast Summer 2016 Gregory V. Jones Southern Oregon University August 5, 2016 The month of July saw the continued flip, flop of the western US temperatures. It was warm
TEXAS WILDLAND FIRE POTENTIAL WINTER/SPRING 2018/2019
 TEXAS WILDLAND FIRE POTENTIAL WINTER/SPRING 2018/2019 Texas A&M Forest Service Predictive Services Prepared December 12 th 2018 Brad Smith Luke Kanclerz Scott Breit Tom Spencer Mike Dunivan 2 Fire Potential
JEFF JOHNSON S Winter Weather Outlook
 JEFF JOHNSON S 2017-2018 Winter Weather Outlook TABLE OF CONTENTS ABOUT THE AUTHOR Components of the seasonal outlook... 2 ENSO state/ocean temperatures... 3 Sub-seasonal outlooks... 4 Forecast models...
1 What Is Climate? TAKE A LOOK 2. Explain Why do areas near the equator tend to have high temperatures?
 CHAPTER 17 1 What Is Climate? SECTION Climate BEFORE YOU READ After you read this section, you should be able to answer these questions: What is climate? What factors affect climate? How do climates differ
Climate Changes due to Natural Processes
 Climate Changes due to Natural Processes 2.6.2a Summarize natural processes that can and have affected global climate (particularly El Niño/La Niña, volcanic eruptions, sunspots, shifts in Earth's orbit,
Monthly Long Range Weather Commentary Issued: APRIL 25, 2016 Steven A. Root, CCM, Chief Analytics Officer, Sr. VP, sales
 Monthly Long Range Weather Commentary Issued: APRIL 25, 2016 Steven A. Root, CCM, Chief Analytics Officer, Sr. VP, sales sroot@weatherbank.com MARCH 2016 Climate Highlights The Month in Review The March
Name the surface winds that blow between 0 and 30. GEO 101, February 25, 2014 Monsoon Global circulation aloft El Niño Atmospheric water
 GEO 101, February 25, 2014 Monsoon Global circulation aloft El Niño Atmospheric water Name the surface winds that blow between 0 and 30 What is the atmospheric pressure at 0? What is the atmospheric pressure
Science Olympiad Meteorology Quiz #2 Page 1 of 8
 1) The prevailing general direction of the jet stream is from west to east in the northern hemisphere: 2) Advection is the vertical movement of an air mass from one location to another: 3) Thunderstorms
THE ATMOSPHERE IN MOTION
 Funding provided by NOAA Sectoral Applications Research Project THE ATMOSPHERE IN MOTION Basic Climatology Oklahoma Climatological Survey Factor 1: Our Energy Source Hi, I m the Sun! I provide 99.9999+
Climate briefing. Wellington region, May Alex Pezza and Mike Thompson Environmental Science Department
 Climate briefing Wellington region, May 2016 Alex Pezza and Mike Thompson Environmental Science Department For more information, contact the Greater Wellington Regional Council: Wellington PO Box 11646
Highlight: Support for a dry climate increasing.
 Scott A. Yuknis High impact weather forecasts, climate assessment and prediction. 14 Boatwright s Loop Plymouth, MA 02360 Phone/Fax 508.927.4610 Cell: 508.813.3499 ClimateImpact@comcast.net Climate Impact
SEASONAL RAINFALL FORECAST FOR ZIMBABWE. 28 August 2017 THE ZIMBABWE NATIONAL CLIMATE OUTLOOK FORUM
 2017-18 SEASONAL RAINFALL FORECAST FOR ZIMBABWE METEOROLOGICAL SERVICES DEPARTMENT 28 August 2017 THE ZIMBABWE NATIONAL CLIMATE OUTLOOK FORUM Introduction The Meteorological Services Department of Zimbabwe
UPDATE OF REGIONAL WEATHER AND SMOKE HAZE (December 2017)
") UPDATE OF REGIONAL WEATHER AND SMOKE HAZE (December 2017) 1. Review of Regional Weather Conditions for November 2017 1.1 In November 2017, Southeast Asia experienced inter-monsoon conditions in the first
UPDATE OF REGIONAL WEATHER AND SMOKE HAZE (December 2017) 1. Review of Regional Weather Conditions for November 2017 1.1 In November 2017, Southeast Asia experienced inter-monsoon conditions in the first
Texas Wildland Fire Season Outlook. for. Winter 2009
 Texas Wildland Fire Season Outlook for Winter 2009 December 5, 2008 Contents Section Page Executive Summary 1 Introduction 2 Underlying Fuels Condition 4 Weather Outlook 8 Findings 10 Credits 11 Attachments
2015: A YEAR IN REVIEW F.S. ANSLOW
 2015: A YEAR IN REVIEW F.S. ANSLOW 1 INTRODUCTION Recently, three of the major centres for global climate monitoring determined with high confidence that 2015 was the warmest year on record, globally.
Weather and Climate Summary and Forecast Summer 2016
 Weather and Climate Summary and Forecast Summer 2016 Gregory V. Jones Southern Oregon University June 6, 2016 May 2016 continued the warm trend for portions of the west, while providing some relief for
Climate Variability and El Niño
 Climate Variability and El Niño David F. Zierden Florida State Climatologist Center for Ocean Atmospheric Prediction Studies The Florida State University UF IFAS Extenstion IST January 17, 2017 The El
Name Date Class. growth rings of trees, fossilized pollen, and ocean. in the northern hemisphere.
 Lesson Outline LESSON 2 A. Long-Term Cycles 1. A(n) climate cycle takes much longer than a lifetime to complete. a. To learn about long-term climate cycles, scientists study natural records, such as growth
The 1986 Southeast Drought in Historical Perspective
 The Southeast Drought in Historical Perspective Abstract The dry and hot weather in the southeast United States during the first seven months of caused record drought. The agricultural and hydrological
Foundations of Earth Science, 6e Lutgens, Tarbuck, & Tasa
 Foundations of Earth Science, 6e Lutgens, Tarbuck, & Tasa Weather Patterns and Severe Weather Foundations, 6e - Chapter 14 Stan Hatfield Southwestern Illinois College Air masses Characteristics Large body
The Pennsylvania Observer
 The Pennsylvania Observer April 2, 2010 March 2010 Pennsylvania Weather Recap Prepared by: Katelyn Johnson March did come in as a lion cub this year. The 1 st proved to be a calm day; however most of Pennsylvania
ATSC 2000 Final Fall 2005
 ATSC 2000 Final Fall 2005 true/false /25 multiple choice /25 short answer /23 essay /10 total /83 or % True/False Indicate whether the sentence or statement is true or false. (25 questions 1% each) 1.
Weather and Climate Risks and Effects on Agriculture
 Weather and Climate Risks and Effects on Agriculture Dr. Eric Snodgrass Official Journal of the Fluid Fertilizer Foundation Vol. 26, No. 2, Issue #100 DOWNLOAD Summary: So, what do we need to watch for?
Monthly Long Range Weather Commentary Issued: SEPTEMBER 19, 2016 Steven A. Root, CCM, Chief Analytics Officer, Sr. VP,
 Monthly Long Range Weather Commentary Issued: SEPTEMBER 19, 2016 Steven A. Root, CCM, Chief Analytics Officer, Sr. VP, sroot@weatherbank.com SEPTEMBER 2016 Climate Highlights The Month in Review The contiguous
What a Hurricane Needs to Develop
 Weather Weather is the current atmospheric conditions, such as air temperature, wind speed, wind direction, cloud cover, precipitation, relative humidity, air pressure, etc. 8.10B: global patterns of atmospheric
Role of Multiple-Level Tropospheric Circulations in Forcing ENSO Winter Precipitation Anomalies
 3102 MONTHLY WEATHER REVIEW Role of Multiple-Level Tropospheric Circulations in Forcing ENSO Winter Precipitation Anomalies SHAWN R. SMITH, PHAEDRA M. GREEN,* ALAN P. LEONARDI, AND JAMES J. O BRIEN Center
Regional overview Autumn 2016
 Autumn 2016 (March to May inclusive) was drier than average for most of the region. The south and east of the Wairarapa were the driest areas with west coast areas being the wettest. Autumn rainfall The
Energy Systems, Structures and Processes Essential Standard: Analyze patterns of global climate change over time Learning Objective: Differentiate
 Energy Systems, Structures and Processes Essential Standard: Analyze patterns of global climate change over time Learning Objective: Differentiate between weather and climate Global Climate Focus Question
South & South East Asian Region:
 Issued: 15 th December 2017 Valid Period: January June 2018 South & South East Asian Region: Indonesia Tobacco Regions 1 A] Current conditions: 1] El Niño-Southern Oscillation (ENSO) ENSO Alert System
Extreme Rainfall in the Southeast U.S.
 Extreme Rainfall in the Southeast U.S. David F. Zierden Florida State Climatologist Center for Ocean Atmospheric Prediction Studies The Florida State University March 7, 2016 Causes of Extreme Rainfall
Dynamics of the Extratropical Response to Tropical Heating
 Regional and Local Climate Modeling and Analysis Research Group R e L o C l i m Dynamics of the Extratropical Response to Tropical Heating (1) Wegener Center for Climate and Global Change (WegCenter) and
ENSO: Recent Evolution, Current Status and Predictions. Update prepared by: Climate Prediction Center / NCEP 9 November 2015
 ENSO: Recent Evolution, Current Status and Predictions Update prepared by: Climate Prediction Center / NCEP 9 November 2015 Outline Summary Recent Evolution and Current Conditions Oceanic Niño Index (ONI)
Lecture #14 March 29, 2010, Monday. Air Masses & Fronts
 Lecture #14 March 29, 2010, Monday Air Masses & Fronts General definitions air masses source regions fronts Air masses formation types Fronts formation types Air Masses General Definitions a large body
2011 Year in Review TORNADOES
 2011 Year in Review The year 2011 had weather events that will be remembered for a long time. Two significant tornado outbreaks in April, widespread damage and power outages from Hurricane Irene in August
ENSO Cycle: Recent Evolution, Current Status and Predictions. Update prepared by Climate Prediction Center / NCEP 11 November 2013
 ENSO Cycle: Recent Evolution, Current Status and Predictions Update prepared by Climate Prediction Center / NCEP 11 November 2013 Outline Overview Recent Evolution and Current Conditions Oceanic Niño Index
The North Atlantic Oscillation: Climatic Significance and Environmental Impact
 1 The North Atlantic Oscillation: Climatic Significance and Environmental Impact James W. Hurrell National Center for Atmospheric Research Climate and Global Dynamics Division, Climate Analysis Section
Why the Atlantic was surprisingly quiet in 2013
 1 Why the Atlantic was surprisingly quiet in 2013 by William Gray and Phil Klotzbach Preliminary Draft - March 2014 (Final draft by early June) ABSTRACT This paper discusses the causes of the unusual dearth
Florida State University Libraries
 Florida State University Libraries Electronic Theses, Treatises and Dissertations The Graduate School 2004 Experimental Forest Fire Threat Forecast Justin Michael Brolley Follow this and additional works
Percentage of normal rainfall for August 2017 Departure from average air temperature for August 2017
 New Zealand Climate Update No 219, August 2017 Current climate August 2017 Overall, mean sea level pressure was lower than normal over and to the west of New Zealand during August while higher than normal
The Planetary Circulation System
 12 The Planetary Circulation System Learning Goals After studying this chapter, students should be able to: 1. describe and account for the global patterns of pressure, wind patterns and ocean currents
2015 Summer Forecast
 2015 Summer Forecast Inside This Forecast Summer 2014 Recap 2 Implications of El Niño and the PDO on the Upcoming Summer Summary of Global Indices & Oscillations Analog Year: The Midwest a battleground
10.5 ATMOSPHERIC AND OCEANIC VARIABILITY ASSOCIATED WITH GROWING SEASON DROUGHTS AND PLUVIALS ON THE CANADIAN PRAIRIES
 10.5 ATMOSPHERIC AND OCEANIC VARIABILITY ASSOCIATED WITH GROWING SEASON DROUGHTS AND PLUVIALS ON THE CANADIAN PRAIRIES Amir Shabbar*, Barrie Bonsal and Kit Szeto Environment Canada, Toronto, Ontario, Canada
ENSO Cycle: Recent Evolution, Current Status and Predictions. Update prepared by Climate Prediction Center / NCEP 25 February 2013
 ENSO Cycle: Recent Evolution, Current Status and Predictions Update prepared by Climate Prediction Center / NCEP 25 February 2013 Outline Overview Recent Evolution and Current Conditions Oceanic Niño Index
MET 3502 Synoptic Meteorology. Lecture 8: September 16, AIRMASSES, FRONTS and FRONTAL ANALYSIS (2)
") MET 3502 Synoptic Meteorology Lecture 8: September 16, 2010 AIRMASSES, FRONTS and FRONTAL ANALYSIS (2) Identifying a cold front on a surface weather map: 1. Surface front is located at the leading edge
MET 3502 Synoptic Meteorology Lecture 8: September 16, 2010 AIRMASSES, FRONTS and FRONTAL ANALYSIS (2) Identifying a cold front on a surface weather map: 1. Surface front is located at the leading edge
By: J Malherbe, R Kuschke
 2015-10-27 By: J Malherbe, R Kuschke Contents Summary...2 Overview of expected conditions over South Africa during the next few days...3 Significant weather events (27 October 2 November)...3 Conditions
Weather Atmospheric condition in one place during a limited period of time Climate Weather patterns that an area typically experiences over a long
 Weather Atmospheric condition in one place during a limited period of time Climate Weather patterns that an area typically experiences over a long period of time Many factors influence weather & climate
p = ρrt p = ρr d = T( q v ) dp dz = ρg
 dp dz = ρg") Chapter 1: Properties of the Atmosphere What are the major chemical components of the atmosphere? Atmospheric Layers and their major characteristics: Troposphere, Stratosphere Mesosphere, Thermosphere
Chapter 1: Properties of the Atmosphere What are the major chemical components of the atmosphere? Atmospheric Layers and their major characteristics: Troposphere, Stratosphere Mesosphere, Thermosphere