København, Denmark John Cappelen. Copenhagen page 1 of 32
|
|
|
- Melvyn Hodge
- 5 years ago
- Views:
Transcription


1 Precipitation (mm) Sunshine (hours) DMI Report Climatological Standard Normals - Denmark, The Faroe Islands and Greenland - Based on Data Published in DMI Reports 18-02, and John Cappelen 2 15,0 1 5,0 København, Denmark Copenhagen page 1 of 32
2 Colophon Serial title: DMI Report Title: Climatological Standard Normals - Denmark, The Faroe Islands and Greenland Subtitle: - Based on Data Published in DMI Reports 18-02, and Author(s): John Cappelen Other contributors: Responsible institution: Danish Meteorological Institute Language: English Keywords: Climatological standard normals, average , WMO, climate summary, monthly, annual, seasonal, period, period , stations, country-wise, air temperature, atmospheric air pressure, accumulated sunshine, accumulated precipitation, frost days, snow cover days, summer days, precipitation days, Denmark, The Faroe Islands, Greenland, DMI, historical climate data collection Url: ISSN: (online) Website: Copyright: Danish Meteorological Institute. It is allowed to copy and extract from the publication with a specification of the source material. Front Page: An example of a temperature-precipitation-sunshine figure for København, Denmark and maps showing the countries Denmark, The Faroe Islands and Greenland (The Kingdom of Denmark) from where the climatological standard normals presented in this report originate. page 2 of 32
3 Content Abstract... 4 Resumé Introduction Data overview Station Overview Data Dictionary Data files... 9 References Previous reports Appendix 1. Temperature, precipitation and sunshine normals. Graphics and tables : Five (5) station series, Denmark, temperature, precipitation, sunshine : Denmark country-wise, temperature, precipitation, sunshine : Denmark country-wise, temperature, precipitation, sunshine : Tórshavn, The Faroe Islands, temperature, precipitation, sunshine : Nine (9) stations, Greenland, temperature, precipitation page 3 of 32
4 Abstract 30 years climatological standard normals of various climate parameters, comprising calculations of air temperature, mean sea level atmospheric pressure and accumulated precipitation for 5 locations/country-wise values in Denmark, 1 at The Faroe Islands and 9 in Greenland based on data in published DMI Monthly Climate Data Collections, are presented in this report. Averages for country-wise values in Denmark are also presented. This report is a contribution to the collection of WMO climatological standard normals for as regards Denmark, The Faroe Islands and Greenland. Resumé Nærværende rapport præsenterer 30 års klimanormaler for forskellige klima-parametre omfattende lufttemperatur, lufttryk ved havets overflade og akkumuleret nedbør for 5 danske samt landstal, 1 færøsk og 9 grønlandske lokaliteter baseret på data i publicerede historiske klimadatasamlinger fra DMI. Gennemsnit for danske landstal indgår også. Denne rapport er et bidrag til WMO s indsamling af klimanormaler, hvad angår Danmark, Færøerne og Grønland. page 4 of 32
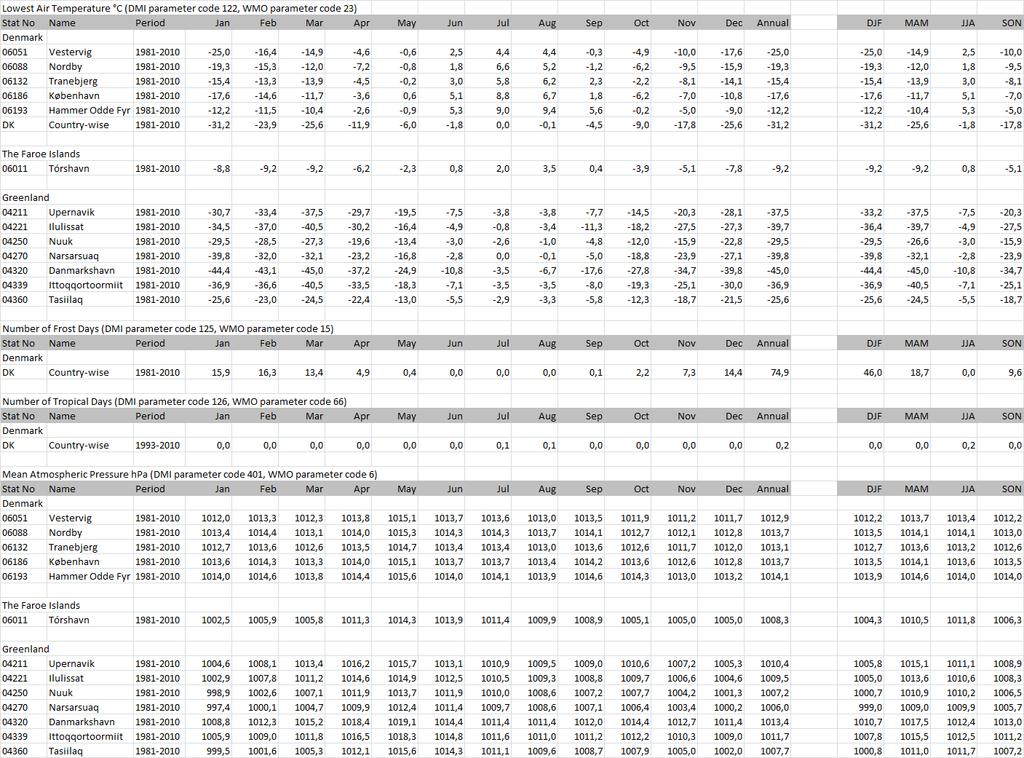
5 1. Introduction This report presents 30 years climatological standard normals of various climate parameters for five (5) locations plus country-wise values in Denmark, one (1) at The Faroe Islands and nine (9) in Greenland based on quality controlled data in the period published in DMI Monthly Climate Data Collections [1], [2] and [3]. Averages for country-wise values in Denmark are also presented. Monthly, annual and seasonal values are presented. The station data parameters include average air temperature, average of minimum and maximum air temperature, lowest and highest air temperature, average mean sea level atmospheric pressure, accumulated precipitation, highest 24- hour precipitation, number of days with snow and average cloud cover. Regarding country-wise data from Denmark number of frost-, summer-, tropical- and precipitation days (>= 0,1 mm) are added. The monthly, annual and seasonal values for every year necessary for the calculation are included in the data sets, following this report. In appendix temperature-precipitation-sunshine graphics and tables for the stations and the country-wise values can be seen. This report is a contribution based on the already published quality controlled DMI monthly climate data collections to the collection of WMO climatological standard normals for as regards Denmark, The Faroe Islands and Greenland. The report (pdf-format) and the matching data set can be downloaded from the publication part of DMI web pages ( page 5 of 32

6 2. Data overview 2.1 Station Overview Table 2.1. Primary stations used in this report. See maps below for the locations. The maps are from [1], [2] and [3], where the datasets are published as long monthly time series. Country Station number Station Latitude Longitude Stat height (above msl) DK Vestervig (air pressure from 6052) 5646N 0819E 18 3,6 DK Nordby (air pressure 6080, 6081 and 6096*) 5527N 0824E 4 8,9* DK Tranebjerg (air pressure from 6159) 5550N 1037E 16 15,8 DK Landbohøjskolen (Kbh) (air pressure 6180) 5541N 1233E 7 5,0 DK Hammer Odde Fyr 5518N 1446E 8 9,4 FO Tórshavn 6201N 0646W 54 55,9 GR Pituffik (air temperature and precipitation) 7632N 6842W 77 GR Upernavik 7247N 5608W GR Ilulissat 6914N 5104W 29 33,6 GR Nuuk 6411N 5144W 80 83,7 GR Narsarsuaq 6110N 4526W 34 31,0 GR Qaqortoq (air temperature and precipitation) 6043N 4603W 57 GR Danmarkshavn 7646N 1840W 11 12,0 GR Ittoqqortoormiit 7029N 2157W 70 71,5 GR Tasiilaq 6537N 3738W 54 55,9 * The atmospheric air pressure for the period 1987/ is an average of 06080, and The latitude, longitude, station height is the figures for 6088 Nordby. The barometer height is from Rømø/Juvre. Bar height (above msl) Please notice that Ivittuut is included in the Greenland map, despite it is not a part of this report. The average monthly air temperature series from Ivittuut (up to 1960) is adjusted to 4270 Narsarsuaq series (from 1961) in the data set in [2] and can be used as a joined long time series. More details can be seen in [1,2,3]. page 6 of 32


7 page 7 of 32
8 2.2 Data Dictionary Table 2.2. Elements/parameters presented in this report regarding station data. DMI WMO Element/Parameter Abbr. Method Unit code code Mean air temperature MeanT mean C Mean daily maximum air temperature MeanTmax mean C Highest air temperature Tmax max C Mean daily minimum air temperature MeanTmin mean C Lowest air temperature Tmin min C Mean atmospheric pressure (msl) MeanatmP mean hpa Acc. hours of bright sunshine (Campbell-Stokes)* Acc. sunshine sum hours Acc. hours of bright sunshine (Star)** Acc. sunshine sum hours Acc. precipitation Acc. precipitation sum mm Highest 24-hour precipitation P24hmax max mm 701 Number of snow cover days (> 50 % covered) Nday snow cover sum days *Sunshine data from a Campbell_stokes sunshine recorder are only present for Tórshavn More details in [2]. ** Sunshine data based on a Star sunshine recorder are only present for København [1]. Sunshine data from a Star sunshine recorder are present from Tórshavn only from September 2006 [2], and for that reason not presented in this report. There are no suitable sunshine data from Greenland for the calculation of climatological normals for the period. Available sunshine statistics from Greenland can be seen in [4]. Table 2.3. Elements/parameters presented in this report regarding Danish country-wise data. DMI WMO Element/Parameter Abbr. Method Unit code code Mean air temperature MeanT mean C Mean daily maximum air temperature MeanTmax mean C Highest air temperature Tmax max C Number of summer days (Tmax (112) > 25 C) Nday summer sum days Mean daily minimum air temperature MeanTmin mean C Lowest air temperature Tmin min C Number of frost days (Tmin (122) < 0 C) Nday summer sum days Number of tropical days (Tmin (122) > 20 C) Nday tropical sum days Acc. hours of bright sunshine (Star)* Acc. sunshine sum hours Acc. precipitation Acc. precipitation sum mm Highest 24-hour precipitation P24hmax max mm Number of precipitation days (acc.prec (601) >= 0.1 mm) Nday prec. >= 0.1 sum days 701 Number of snow cover days (> 50 % covered) Nday snow cover sum days *See more details about observations of sunshine data in Denmark in [1]. page 8 of 32
9 4. Data files Data are included in this report as one (1) Excel file, with nineteen (19) sheets: 1981_2010_normals_dk_gr_fo.xlsx All stations, country-wise values and the climatological standard normals (and for Danish country-wise as a supplement) for the countries Denmark, The Faroe Islands and Greenland and for months and seasons are presented. The stations/parameters (metadata) can be seen in table Additional metadata can be seen in [1], [2] and [3]. The sheets are: Denmark: DK_6051 Vestervig DK_6088 Nordby (Fanø) DK_6132 Tranebjerg (Samsø) DK_6186 København DK_6193 Hammer Odde Fyr (Bornholm) DK_country Country-wise DK_country Country-wise The Faroe Islands: FO_6011 Tórshavn Greenland: DK_4202 Pituffik (Thule AB) DK_4211 Upernavik DK_4221 Ilulissat DK_4250 Nuuk DK_4270 Narsarsuaq DK_4272 Qaqortoq DK_4320 Danmarkshavn DK_4339 Ittoqqortoormiit DK_4360 Tasiilaq Normals and average : DK_FO_GR_ normals DK_ average Notes: 1. The monthly, annual and seasonal values are shown. 2. The annual values are calculated on Jan-Dec. The seasonal values are calculated on Dec-Feb (DJF), Mar-May (MAM), Jun-Aug (JJA) and Sep-Nov (SON). 3. All missing monthly values are indicated with a null. 4. If a monthly value is missing, the corresponding annual and seasonal value is not calculated. The corresponding fields are indicated with a null. 5. Both the mean, maximum and minimum of the values for the period are calculated in the station sheets Pituffik and 4272 Qaqortoq only have average air temperatures and accumulated precipitation in the dataset Upernavik only have accumulated precipitation up to Dec Ilulissat only have accumulated precipitation up to Dec Snow cover has not been observed recently in Greenland. For that reason no snow cover normals for Greenland for the period are present in the dataset. page 9 of 32

10 page 10 of 32

11 page 11 of 32

12 page 12 of 32

13 page 13 of 32

14 page 14 of 32
15 References [1] John Cappelen (ed) (2018): Denmark DMI Historical Data Collection DMI Report 18-02, Copenhagen. [2] John Cappelen (ed) (2018): Greenland DMI Historical Data Collection DMI Report 18-04, Copenhagen. [3] John Cappelen (ed) (2018): The Faroe Islands DMI Historical Data Collection DMI Report 18-05, Copenhagen. [4] John Cappelen (ed) (2000): The Observed Climate of Greenland, with Climatological Standard Normals, DMI Technical Report 00-18, Copenhagen. Previous reports Previous reports from the Danish Meteorological Institute can be found on: page 15 of 32
16 Precipitation (mm) Sunshine (hours) Appendix 1. Temperature, precipitation and sunshine normals. Graphics and tables. : Five (5) station series, Denmark, temperature, precipitation, sunshine OBS! Sunshine only København Vestervig, Denmark 2 18,0 16,0 14,0 12,0 1 8,0 6,0 4,0 2, Vestervig, Denmark () Month Temperature ( C) Precipitation (mm) Sunshine (hours) jan 1,7 72,6 feb 1,5 52,9 mar 3,1 55,9 apr 6,7 38,4 may 10,9 45,9 jun 13,7 52,6 jul 16,1 51,4 aug 16,3 80,2 sep 13,2 85,3 oct 9,5 102,6 nov 5,5 84,2 dec 2,8 80,9 Year 8,4 802,8 page 16 of 32
17 Precipitation (mm) Sunshine (hours) 2 18,0 16,0 14,0 12,0 1 8,0 6,0 4,0 2,0 Nordby, Denmark Nordby, Denmark () Month Temperature ( C) Precipitation (mm) Sunshine (hours) jan 1,8 68,8 feb 1,6 54,9 mar 3,6 56,9 apr 7,4 36,1 may 11,8 45,3 jun 14,6 54,6 jul 17,0 63,0 aug 17,0 77,9 sep 13,9 88,3 oct 9,9 108,2 nov 5,8 86,6 dec 2,9 80,3 Year 8,9 820,8 page 17 of 32
18 Precipitation (mm) Sunshine (hours) 2 18,0 16,0 14,0 12,0 1 8,0 6,0 4,0 2,0 Tranebjerg, Denmark Tranebjerg, Denmark () Month Temperature ( C) Precipitation (mm) Sunshine (hours) jan 1,7 41,8 feb 1,4 30,8 mar 3,1 32,7 apr 7,0 31,2 may 11,5 40,8 jun 14,5 58,5 jul 17,0 54,8 aug 17,1 56,9 sep 13,8 54,6 oct 9,9 55,3 nov 5,8 45,9 dec 2,8 44,5 Year 8,8 552,6 page 18 of 32
19 Precipitation (mm) Sunshine (hours) 2 18,0 16,0 14,0 12,0 1 8,0 6,0 4,0 2,0 København, Denmark København, Denmark () Month Temperature ( C) Precipitation (mm) Sunshine (hours) jan 1,4 53,0 51,5 feb 1,4 36,9 68,1 mar 3,5 42,3 119,7 apr 7,7 35,8 180,9 may 12,5 47,2 230,2 jun 15,6 63,9 213,3 jul 18,1 60,9 228,1 aug 17,7 67,5 198,9 sep 13,9 61,0 141,9 oct 9,8 63,3 100,9 nov 5,5 56,4 55,3 dec 2,5 57,4 40,6 Year 9,1 645,7 1629,7 page 19 of 32
20 Precipitation (mm) Sunshine (hours) 2 18,0 16,0 14,0 12,0 1 8,0 6,0 4,0 2,0 Hammer Odde Fyr, Denmark Hammer Odde Fyr, Denmark () Month Temperature ( C) Precipitation (mm) Sunshine (hours) jan 1,7 50,7 feb 1,2 41,1 mar 2,6 37,7 apr 5,5 27,6 may 9,8 38,1 jun 14,0 44,2 jul 17,2 49,7 aug 17,4 59,3 sep 14,1 59,7 oct 10,3 60,4 nov 6,1 57,9 dec 3,1 55,4 Year 8,6 581,9 page 20 of 32
21 Precipitation (mm) Sunshine (hours) : Denmark country-wise, temperature, precipitation, sunshine Denmark 2 18,0 16,0 14,0 12,0 1 8,0 6,0 4,0 2, Denmark () Month Temperature ( C) Precipitation (mm) Sunshine (hours) jan 1,1 65,4 50,2 feb 1,0 47,7 70,2 mar 2,9 51,6 115,9 apr 6,7 37,3 171,2 may 11,2 48,5 223,5 jun 14,1 62,1 208,4 jul 16,6 63,1 216,6 aug 16,5 75,7 189,1 sep 13,1 74,4 133,8 oct 9,2 84,5 95,7 nov 5,1 69,5 56,4 dec 2,1 66,6 43,1 Year 8,3 746,2 1574,1 page 21 of 32
22 Precipitation (mm) Sunshine (hours) : Denmark country-wise, temperature, precipitation, sunshine Denmark ,0 16,0 14,0 12,0 1 8,0 6,0 4,0 2, Denmark ( ) Month Temperature ( C) Precipitation (mm) Sunshine (hours) jan 1,4 67,0 50,3 feb 1,1 42,8 60,7 mar 3,5 39,9 145,6 apr 7,7 30,3 210,7 may 11,3 58,9 237,1 jun 14,3 64,4 239,8 jul 17,4 73,2 242,1 aug 16,7 98,7 187,0 sep 13,7 73,4 150,8 oct 9,8 83,1 102,2 nov 6,3 77,0 51,5 dec 3,0 82,5 44,1 Year 8,9 791,5 1722,1 page 22 of 32
23 Precipitation (mm) Sunshine (hours) : Tórshavn, The Faroe Islands, temperature, precipitation, sunshine Tórshavn, The Faroe Islands 2 18,0 16,0 14,0 12,0 1 8,0 6,0 4,0 2, Tórshavn, The Faroe Islands () Month Temperature ( C) Precipitation (mm) Sunshine* (hours) jan 4,0 157,7 14,5 feb 3,6 115,2 36,7 mar 4,0 131,6 72,8 apr 5,2 89,5 108,6 may 7,0 63,3 137,8 jun 9,0 57,5 128,6 jul 10,7 74,3 103,6 aug 11,0 96,0 100,9 sep 9,6 119,5 82,7 oct 7,5 147,4 53,4 nov 5,5 139,3 21,1 dec 4,3 135,3 7,8 Year 6,8 1321,3 868,6 *sunshine page 23 of 32
24 Precipitation (mm) : Nine (9) stations, Greenland, temperature, precipitation OBS! In Greenland there are no recently registrations of sunshine hours. Coastal western Greenland 1 5,0-5, , ,0-3 Pituffik, Greenland ,0 9 75,0 6 45,0 3 15,0 Pituffik, Greenland () Month Temperature ( C) Precipitation (mm) Sunshine (hours) jan -24,7 6,5 feb -25,3 6,3 mar -24,3 5,9 apr -16,1 7,0 may -4,5 6,5 jun 2,8 8,6 jul 5,7 21,7 aug 4,2 20,6 sep -1,7 15,1 oct -9,6 14,2 nov -16,1 10,1 dec -20,5 9,9 Year -10,8 132,0 *No sunshine measurements at Pituffik page 24 of 32
25 Upernavik, Greenland 2 15,0 1 5,0-5, , ,0 Upernavik, Greenland () Month Temperature ( C) Precipitation (mm) Sunshine (hours) jan -18,4 feb -20,7 mar -19,9 apr -12,7 may -3,4 jun 2,8 jul 5,9 aug 5,3 sep 1,2 oct -4,0 nov -8,2 dec -12,6 Year -7,1 *No precipitation and sunshine measurements at Upernavik page 25 of 32
26 Ilulissat, Greenland 2 15,0 1 5,0-5, ,0-2 Ilulissat, Greenland () Month Temperature ( C) Precipitation (mm) Sunshine (hours) jan -13,9 feb -16,1 mar -15,8 apr -8,1 may 0,1 jun 5,6 jul 8,0 aug 6,7 sep 2,7 oct -3,4 nov -7,2 dec -9,9 Year -4,3 *No precipitation and sunshine measurements at Ilulissat page 26 of 32
27 Precipitation (mm) Nuuk, Greenland 2 15, , ,0 75,0 6-5,0 45, ,0 15,0-2 Nuuk, Greenland () Month Temperature ( C) Precipitation (mm) Sunshine (hours) jan -8,2 54,7 feb -9,1 51,1 mar -8,2 49,1 apr -3,6 45,6 may 0,8 58,5 jun 4,4 60,6 jul 6,8 81,3 aug 6,3 89,1 sep 3,7 90,2 oct -0,3 66,5 nov -3,4 75,2 dec -5,8 62,0 Year -1,4 781,6 *No sunshine measurements at Nuuk page 27 of 32
28 Precipitation (mm) Southern Greenland Narsarsuaq, Greenland 2 15, , ,0 75,0 6-5,0 45, ,0 15,0-2 Narsarsuaq, Greenland () Month Temperature ( C) Precipitation (mm) Sunshine (hours) jan -7,1 43,7 feb -7,3 45,7 mar -5,6 38,9 apr 0,3 45,6 may 5,4 41,7 jun 9,2 54,8 jul 10,8 59,2 aug 9,5 71,9 sep 5,9 76,7 oct 0,9 58,7 nov -3,1 64,5 dec -5,9 39,4 Year 1,0 650,7 *No sunshine measurements at Narsarsuaq page 28 of 32
29 Precipitation (mm) Qaqortoq, Greenland 2 15, , ,0 75,0 6-5,0 45, ,0 15,0-2 Qaqortoq, Greenland () Month Temperature ( C) Precipitation (mm) Sunshine (hours) jan -5,7 70,7 feb -5,9 68,8 mar -4,8 63,0 apr -0,2 66,5 may 3,4 67,2 jun 5,9 76,6 jul 7,6 92,2 aug 7,7 107,4 sep 5,6 104,3 oct 1,8 87,6 nov -1,6 92,7 dec -4,2 65,5 Year 0,8 986,5 *No sunshine measurements at Narsarsuaq page 29 of 32
30 Precipitation (mm) Coastal eastern Greenland Danmarkshavn, Greenland 15, ,0 5,0 9 75,0-5, ,0-15, ,0-25,0 Danmarkshavn, Greenland () Month Temperature ( C) Precipitation (mm) Sunshine (hours) jan -22,3 19,9 feb -22,7 19,4 mar -22,7 19,0 apr -16,1 14,0 may -6,5 5,9 jun 1,1 4,7 jul 4,1 16,9 aug 2,6 16,1 sep -3,6 14,6 oct -13,2 11,1 nov -18,3 15,4 dec -21,2 19,0 Year -11,5 178,1 *No sunshine measurements at Danmarkshavn page 30 of 32
31 Precipitation (mm) Ittoqqortoormiit, Greenland 2 15, , ,0 75,0 6-5,0 45, ,0 15,0-2 Ittoqqortoormiit, Greenland () Month Temperature ( C) Precipitation (mm) Sunshine (hours) jan -14,0 31,8 feb -14,4 44,2 mar -14,1 37,1 apr -9,2 23,9 may -2,4 15,6 jun 2,6 16,6 jul 5,7 26,1 aug 5,2 39,3 sep 1,1 49,7 oct -5,4 31,4 nov -10,1 33,8 dec -12,9 40,8 Year -5,6 387,5 *No sunshine measurements at Ittoqqortoormiit page 31 of 32
32 Precipitation (mm) Tasiilaq, Greenland 2 15, , ,0 75,0 6-5,0 45, ,0 15,0-2 Tasiilaq, Greenland () Month Temperature ( C) Precipitation (mm) Sunshine (hours) jan -6,8 105,1 feb -7,0 92,6 mar -6,9 86,0 apr -3,2 69,5 may 0,9 57,8 jun 4,5 35,9 jul 6,6 47,2 aug 6,5 66,3 sep 3,7 80,5 oct -0,4 71,3 nov -3,2 91,7 dec -5,5 89,0 Year -0,9 892,5 *No sunshine measurements at Tasiilaq page 32 of 32
Technical Report World Weather Records and Denmark, The Faroe Islands and Greenland
 World Weather Records 1991-2000 and 2001-2010 - Denmark, The Faroe Islands and Greenland John Cappelen Copenhagen 2014 http://www.dmi.dk/fileadmin/rapporter/tr/tr14-10 page 1 of 19 Colophon Serial title:
DMI Report Weather observations from Tórshavn, The Faroe Islands Observation data with description
 DMI Report 17-09 Weather observations from Tórshavn, The Faroe Islands 1953-2016 - Observation data with description John Cappelen Copenhagen 2017 http://www.dmi.dk/laer-om/generelt/dmi-publikationer/
Weather observations from Tórshavn, The Faroe Islands
 Weather observations from Tórshavn, The Faroe Islands 1953-2014 - Observation data with description John Cappelen Copenhagen 2015 http://www.dmi.dk/fileadmin/rapporter/tr/tr15-09 page 1 of 14 Colophon
DMI Report The Faroe Islands - DMI Historical Climate Data Collection
 DMI Report 17-05 The Faroe Islands - DMI Historical Climate Data Collection 1873-2016 John Cappelen (ed) Copenhagen 2017 http://www.dmi.dk/laer-om/generelt/dmi-publikationer/ page 1 of 37 Colophon Serial
DMI Report Denmark - DMI Historical Climate Data Collection
 1873 1883 1893 1903 1913 1923 1933 1943 1953 1963 1973 1983 1993 2003 2013 Temperature anomaly C DMI Report 17-02 Denmark - DMI Historical Climate Data Collection 1768-2016 John Cappelen (ed) 3 2 Denmark
John Cappelen (ed) Copenhagen page 1 of 41
 Copenhagen page 1 of 41") DMI Daily Climate Data Collection 1873-2010, Denmark, The Faroe Islands and Greenland - including Air Pressure Observations 1874-2010 (WASA Data Sets) John Cappelen (ed) Copenhagen 2011 www.dmi.dk/dmi/tr11-06
DMI Daily Climate Data Collection 1873-2010, Denmark, The Faroe Islands and Greenland - including Air Pressure Observations 1874-2010 (WASA Data Sets) John Cappelen (ed) Copenhagen 2011 www.dmi.dk/dmi/tr11-06
Technical Report DMI Monthly Climate Data Collection , Denmark, The Faroe Islands and Greenland
 DMI Monthly Climate Data Collection 1768-2009, Denmark, The Faroe Islands and Greenland John Cappelen (ed) Copenhagen 2010 www.dmi.dk/dmi/tr10-05 page 1 of 52 Colophon Serial title: Technical Report 10-05
Technical Report DMI SYNOP AWS Summit. Data status March Ellen Vaarby Laursen. SYNOP weather station Summit.
 10-09 DMI SYNOP AWS 04416 Summit. Data status March 2010. Ellen Vaarby Laursen SYNOP weather station 04416 Summit Picture Taken: 2007:06:20 16:16:11 Picture Taken: 2009:07:09 08:22:51 Copenhagen 2010 www.dmi.dk/dmi/tr
Road Weather Modelling System: Verification for Road Weather Season
 Road Weather Modelling System: Verification for 2009-2010 Road Weather Season Claus Petersen, Alexander Mahura, Bent Sass Copenhagen 2010 www.dmi.dk/dmi/tr10-12.pdf page 1 of 20 Colophon Serial title:
Danish Design Reference Year Grunnet Wang, Peter; Scharling, Mikael; Pagh Nielsen, Kristian; Kern-Hansen, Claus; Wittchen, Kim Bjarne
 Aalborg Universitet 2001 2010 Danish Design Reference Year Grunnet Wang, Peter; Scharling, Mikael; Pagh Nielsen, Kristian; Kern-Hansen, Claus; Wittchen, Kim Bjarne Publication date: 2013 Document Version
DANISH METEOROLOGICAL INSTITUTE MINISTRY OF TRANSPORT TECHNICAL REPORT 04-03
 DANISH METEOROLOGICAL INSTITUTE MINISTRY OF TRANSPORT TECHNICAL REPORT 04-03 DMI Daily Climate Data Collection 1873-2003, Denmark and Greenland Ellen Vaarby Laursen Weather and Climate Information Division
Sea Level data from 14 stations in Denmark
 Report 18-16 Sea Level data 1889 2017 from 14 stations in Denmark Mean, maximum and minimum values calculated on monthly and yearly basis including plots mean values Lonny Hansen Copenhagen 2018 www.dmi.dk
Road Weather Modelling System: Verification for Road Weather Season
 Road Weather Modelling System: Verification for 2007-2008 Road Weather Season Claus Petersen, Alexander Mahura, Bent Sass, Torben Pedersen Copenhagen 2008 www.dmi.dk/dmi/tr08-09 page 1 of 14 Colophon Serial
DMI Report Weather observations from Greenland Observation data with description
 DMI Report 17-08 Weather observations from Greenland 1958-2016 - Observation data with description John Cappelen (ed) Copenhagen 2017 http://www.dmi.dk/laer-om/generelt/dmi-publikationer/ page 1 of 31
DANISH METEOROLOGICAL INSTITUTE MINISTRY OF TRANSPORT TECHNICAL REPORT 02-25
 DANISH METEOROLOGICAL INSTITUTE MINISTRY OF TRANSPORT TECHNICAL REPORT 02-25 New hours of bright sunshine normals for Denmark, 1961-1990. Ellen Vaarby Laursen and Stig Rosenørn COPENHAGEN 2002 ISSN 0906-897X
Technical Report Road Weather Modelling System: Verification for Road Weather Season. Claus Petersen, Alexander Mahura, Bent Sass
 Technical Report 09-10 Road Weather Modelling System: Verification for 2008-2009 Road Weather Season Claus Petersen, Alexander Mahura, Bent Sass www.dmi.dk/dmi/tr09-10 Copenhagen 2009 page 1 of 20 Colophon
Technical Report DMI Daily Climate Data Collection , Denmark and Greenland. John Cappelen, Ellen Vaarby Laursen and Claus Kern-Hansen
 DMI Daily Climate Data Collection 1873-2004, Denmark and Greenland John Cappelen, Ellen Vaarby Laursen and Claus Kern-Hansen Copenhagen 2006 www.dmi.dk/dmi/tr05-04 page 1 of 36 Colophon Serial title: Technical
A Note on the Correctness of Precipitation in the Danish Climate Model
 A Note on the Correctness of Precipitation in the Danish Climate Model Shuting Yang Copenhagen 2005 www.dmi.dk/dmi/dkc05-05 page 1 of 10 Colophon Serial title: Danish Climate Centre Report 05-05 Title:
Climatography of the United States No
 Climate Division: AK 5 NWS Call Sign: ANC Month (1) Min (2) Month(1) Extremes Lowest (2) Temperature ( F) Lowest Month(1) Degree s (1) Base Temp 65 Heating Cooling 90 Number of s (3) Jan 22.2 9.3 15.8
Road Weather Modelling System: Verification for Road Weather Season
 Road Weather Modelling System: Verification for 2010-2011 Road Weather Season Claus Petersen, Alexander Mahura, Bent Sass Copenhagen 2011 www.dmi.dk/dmi/tr11-19.pdf page 1 of 28 Colophon Serial title:
Climatography of the United States No
 Month (1) Min (2) Month(1) Extremes Lowest (2) Temperature ( F) Lowest Month(1) Degree s (1) Base Temp 65 Heating Cooling 100 Number of s (3) Jan 63.9 39.3 51.6 86 1976 16 56.6 1986 20 1976 2 47.5 1973
Climatography of the United States No
 Temperature ( F) Month (1) Min (2) Month(1) Extremes Lowest (2) Lowest Month(1) Degree s (1) Base Temp 65 Heating Cooling 100 Number of s (3) Jan 32.8 21.7 27.3 62 1918 1 35.8 1983-24 1950 29 10.5 1979
Climatography of the United States No
 Climate Division: CA 4 NWS Call Sign: Month (1) Min (2) Month(1) Extremes Lowest (2) Temperature ( F) Lowest Month(1) Degree s (1) Base Temp 65 Heating Cooling 100 Number of s (3) Jan 55.6 39.3 47.5 77
Climatography of the United States No
 Climate Division: CA 1 NWS Call Sign: Month (1) Min (2) Month(1) Extremes Lowest (2) Temperature ( F) Lowest Month(1) Degree s (1) Base Temp 65 Heating Cooling 100 Number of s (3) Jan 57.9 38.9 48.4 85
Climatography of the United States No
 Climate Division: CA 5 NWS Call Sign: Month (1) Min (2) Month(1) Extremes Lowest (2) Temperature ( F) Lowest Month(1) Degree s (1) Base Temp 65 Heating Cooling 100 Number of s (3) Jan 56.6 36.5 46.6 81
Climatography of the United States No
 Climate Division: CA 5 NWS Call Sign: Month (1) Min (2) Month(1) Extremes Lowest (2) Temperature ( F) Lowest Month(1) Degree s (1) Base Temp 65 Heating Cooling 100 Number of s (3) Jan 44.8 25.4 35.1 72
Climatography of the United States No
 Climate Division: CA 4 NWS Call Sign: Month (1) Min (2) Month(1) Extremes Lowest (2) Temperature ( F) Lowest Month(1) Degree s (1) Base Temp 65 Heating Cooling 100 Number of s (3) Jan 49.4 37.5 43.5 73
Climatography of the United States No
 Climate Division: CA 6 NWS Call Sign: Month (1) Min (2) Month(1) Extremes Lowest (2) Temperature ( F) Lowest Month(1) Degree s (1) Base Temp 65 Heating Cooling 100 Number of s (3) Jan 69.4 46.6 58.0 92
Climatography of the United States No
 Climate Division: CA 4 NWS Call Sign: Month (1) Min (2) Month(1) Extremes Lowest (2) Temperature ( F) Lowest Month(1) Degree s (1) Base Temp 65 Heating Cooling 1 Number of s (3) Jan 58.5 38.8 48.7 79 1962
Climatography of the United States No
 Climate Division: CA 6 NWS Call Sign: Month (1) Min (2) Month(1) Extremes Lowest (2) Temperature ( F) Lowest Month(1) Degree s (1) Base Temp 65 Heating Cooling 1 Number of s (3) Jan 67.5 42. 54.8 92 1971
Climatography of the United States No
 Climate Division: CA 1 NWS Call Sign: Month (1) Min (2) Month(1) Extremes Lowest (2) Temperature ( F) Lowest Month(1) Degree s (1) Base Temp 65 Heating Cooling 1 Number of s (3) Jan 57.8 39.5 48.7 85 1962
Climatography of the United States No
 Climate Division: ND 8 NWS Call Sign: BIS Month (1) Min (2) Month(1) Extremes Lowest (2) Temperature ( F) Lowest Month(1) Degree s (1) Base Temp 65 Heating Cooling 100 Number of s (3) Jan 21.1 -.6 10.2
Climatography of the United States No
 Climate Division: TN 1 NWS Call Sign: Month (1) Min (2) Month(1) Extremes Lowest (2) Temperature ( F) Lowest Month(1) Degree s (1) Base Temp 65 Heating Cooling 100 Number of s (3) Jan 47.6 24.9 36.3 81
Climatography of the United States No
 Climate Division: CA 5 NWS Call Sign: FAT Month (1) Min (2) Month(1) Extremes Lowest (2) Temperature ( F) Lowest Month(1) Degree s (1) Base Temp 65 Heating Cooling 1 Number of s (3) Jan 53.6 38.4 46. 78
Climatography of the United States No
 Climate Division: CA 6 NWS Call Sign: 1L2 N Lon: 118 3W Month (1) Min (2) Month(1) Extremes Lowest (2) Temperature ( F) Lowest Month(1) Degree s (1) Base Temp 65 Heating Cooling 1 Number of s (3) Jan 63.7
Climatography of the United States No
 Climate Division: CA 5 NWS Call Sign: BFL Month (1) Min (2) Month(1) Extremes Lowest (2) Temperature ( F) Lowest Month(1) Degree s (1) Base Temp 65 Heating Cooling 1 Number of s (3) Jan 56.3 39.3 47.8
Atmospheric circulation analysis for seasonal forecasting
 Training Seminar on Application of Seasonal Forecast GPV Data to Seasonal Forecast Products 18 21 January 2011 Tokyo, Japan Atmospheric circulation analysis for seasonal forecasting Shotaro Tanaka Climate
GAMINGRE 8/1/ of 7
 FYE 09/30/92 JULY 92 0.00 254,550.00 0.00 0 0 0 0 0 0 0 0 0 254,550.00 0.00 0.00 0.00 0.00 254,550.00 AUG 10,616,710.31 5,299.95 845,656.83 84,565.68 61,084.86 23,480.82 339,734.73 135,893.89 67,946.95
Climatography of the United States No
 Climate Division: TN 3 NWS Call Sign: BNA Month (1) Min (2) Month(1) Extremes Lowest (2) Temperature ( F) Lowest Month(1) Degree s (1) Base Temp 65 Heating Cooling 100 Number of s (3) Jan 45.6 27.9 36.8
Climatography of the United States No
 Climate Division: CA 5 NWS Call Sign: Elevation: 6 Feet Lat: 37 Month (1) Min (2) Month(1) Extremes Lowest (2) Temperature ( F) Lowest Month(1) Degree s (1) Base Temp 65 Heating Cooling 1 Number of s (3)
Climatography of the United States No
 Climate Division: CA 4 NWS Call Sign: Elevation: 2 Feet Lat: 37 Month (1) Min (2) Month(1) Extremes Lowest (2) Temperature ( F) Lowest Month(1) Degree s (1) Base Temp 65 Heating Cooling 1 Number of s (3)
Climatography of the United States No
 Climate Division: CA 4 NWS Call Sign: Elevation: 13 Feet Lat: 36 Month (1) Min (2) Month(1) Extremes Lowest (2) Temperature ( F) Lowest Month(1) Degree s (1) Base Temp 65 Heating Cooling 1 Number of s
Climatography of the United States No
 Climate Division: CA 5 NWS Call Sign: Elevation: 1,14 Feet Lat: 36 Month (1) Min (2) Month(1) Extremes Lowest (2) Temperature ( F) Lowest Month(1) Degree s (1) Base Temp 65 Heating Cooling 1 Number of
CALCULATION OF SUNSHINE DURATION FROM GLOBAL RADIATION MEASUREMENTS IN DENMARK AND IN GREENLAND
 CALCULATION OF SUNSHINE DURATION FROM GLOBAL RADIATION MEASUREMENTS IN DENMARK AND IN GREENLAND Claus Nordstrøm (1) Maja Kjørup Nielsen (2) (1) cln@dmi.dk, Danish Meteorological Institute, Lyngbyvej 100,
DANISH METEOROLOGICAL INSTITUTE MINISTRY OF TRANSPORT TECHNICAL REPORT 98-14
 DANISH METEOROLOGICAL INSTITUTE MINISTRY OF TRANSPORT TECHNICAL REPORT 98-14 The Climate of The Faroe Islands - with Climatological Standard Normals, 1961-1990 John Cappelen and Ellen Vaarby Laursen COPENHAGEN
Climatography of the United States No
 Month (1) Min (2) Month(1) Extremes Lowest (2) Temperature ( F) Lowest Month(1) Degree s (1) Base Temp 65 Heating Cooling 100 Number of s (3) 42.6 24.2 33.4 79 1950 25 44.2 1974-16 1994 19 18.8 1977 977
control of. Quality. Laust. sholm Wang. Copenhagen. page 1 of 14
 Technical Report 11-16 Quality control of Greenlandic weather and climate data series 1958-2010 Supplement to Technical Report 11-15 Laust Boas and Peter Ridders sholm Wang Copenhagen 2011 page 1 of 14
Climatography of the United States No
 Climate Division: CA 6 NWS Call Sign: LAX Elevation: 1 Feet Lat: 33 Month (1) Min (2) Month(1) Extremes Lowest (2) Temperature ( F) Lowest Month(1) Degree s (1) Base Temp 65 Heating Cooling 1 Number of
Climatography of the United States No
 Climate Division: CA 6 NWS Call Sign: TOA Elevation: 11 Feet Lat: 33 2W Temperature ( F) Month (1) Min (2) Month(1) Extremes Lowest (2) Lowest Month(1) Degree s (1) Base Temp 65 Heating Cooling 1 Number
Climatography of the United States No
 Month (1) Min (2) Month(1) Extremes Lowest (2) Temperature ( F) Lowest Month(1) Degree s (1) Base Temp 65 Heating Cooling 100 Number of s (3) Jan 54.3 40.1 47.2 75 1998 17 53.0 1995 18 1949 11 41.7 1972
Climatography of the United States No
 No. 2 1971-2 Asheville, North Carolina 2881 COOP ID: 46646 Climate Division: CA 4 NWS Call Sign: 8W Month (1) Min (2) Month(1) Extremes Lowest (2) Temperature ( F) Lowest Month(1) Degree s (1) Base Temp
Climatography of the United States No
 No. 2 1971-2 Asheville, North Carolina 2881 COOP ID: 4792 Climate Division: CA 6 NWS Call Sign: Month (1) Min (2) Month(1) Extremes Lowest (2) Temperature ( F) Lowest Month(1) Degree s (1) Base Temp 65
Climatography of the United States No
 Climate Division: CA 6 NWS Call Sign: Month (1) Min (2) Month(1) Extremes Lowest (2) Temperature ( F) Lowest Month(1) Degree s (1) Base Temp 65 Heating Cooling 100 Number of s (3) Jan 51.5 35.0 43.3 80
Climatography of the United States No
 Climate Division: CA 5 NWS Call Sign: Month (1) Min (2) Month(1) Extremes Lowest (2) Temperature ( F) Lowest Month(1) Degree s (1) Base Temp 65 Heating Cooling 100 Number of s (3) 59.3 31.5 45.4 80 1976
Climatography of the United States No
 Climate Division: CA 7 NWS Call Sign: Month (1) Min (2) Month(1) Extremes Lowest (2) Temperature ( F) Lowest Month(1) Degree s (1) Base Temp 65 Heating Cooling 100 Number of s (3) 44.5 29.3 36.9 69 1951
Climatography of the United States No
 Climate Division: CA 2 NWS Call Sign: Month (1) Min (2) Month(1) Extremes Lowest (2) Temperature ( F) Lowest Month(1) Degree s (1) Base Temp 65 Heating Cooling 100 Number of s (3) 53.3 37.1 45.2 77 1962
Climatography of the United States No
 Climate Division: CA 2 NWS Call Sign: Month (1) Min (2) Month(1) Extremes Lowest (2) Temperature ( F) Lowest Month(1) Degree s (1) Base Temp 65 Heating Cooling 100 Number of s (3) 53.3 31.8 42.6 74+ 1975
Climatography of the United States No
 Climate Division: CA 2 NWS Call Sign: Month (1) Min (2) Month(1) Extremes Lowest (2) Temperature ( F) Lowest Month(1) Degree s (1) Base Temp 65 Heating Cooling 100 Number of s (3) 53.7 32.7 43.2 79 1962
Climatography of the United States No
 Climate Division: CA 6 NWS Call Sign: Month (1) Min (2) Month(1) Extremes Lowest (2) Temperature ( F) Lowest Month(1) Degree s (1) Base Temp 65 Heating Cooling 100 Number of s (3) 68.5 45.7 57.1 90 1971
Climatography of the United States No
 Climate Division: CA 7 NWS Call Sign: Month (1) Min (2) Month(1) Extremes Lowest (2) Temperature ( F) Lowest Month(1) Degree s (1) Base Temp 65 Heating Cooling 100 Number of s (3) 56.0 35.7 45.9 83 1975
Climatography of the United States No
 Climate Division: CA 7 NWS Call Sign: Month (1) Min (2) Month(1) Extremes Lowest (2) Temperature ( F) Lowest Month(1) Degree s (1) Base Temp 65 Heating Cooling 1 Number of s (3) 64.8 45.4 55.1 85 1971
Climatography of the United States No
 Climate Division: CA 7 NWS Call Sign: Month (1) Min (2) Month(1) Extremes Lowest (2) Temperature ( F) Lowest Month(1) Degree s (1) Base Temp 65 Heating Cooling 1 Number of s (3) 65.5 38.7 52.1 87 1962
Climatography of the United States No
 Climate Division: CA 7 NWS Call Sign: Month (1) Min (2) Month(1) Extremes Lowest (2) Temperature ( F) Lowest Month(1) Degree s (1) Base Temp 65 Heating Cooling 100 Number of s (3) 58.8 34.3 46.6 81+ 1948
Climatography of the United States No
 Climate Division: CA 7 NWS Call Sign: Month (1) Min (2) Month(1) Extremes Lowest (2) Temperature ( F) Lowest Month(1) Degree s (1) Base Temp 65 Heating Cooling 100 Number of s (3) 70.4 44.2 57.3 95 1971
Climatography of the United States No
 Climate Division: CA 1 NWS Call Sign: Month (1) Min (2) Month(1) Extremes Lowest (2) Temperature ( F) Lowest Month(1) Degree s (1) Base Temp 65 Heating Cooling 100 Number of s (3) Jan 52.4 35.4 43.9 69
Climatography of the United States No
 Climate Division: CA 4 NWS Call Sign: Month (1) Min (2) Month(1) Extremes Lowest (2) Temperature ( F) Lowest Month(1) Degree s (1) Base Temp 65 Heating Cooling 100 Number of s (3) Jan 61.9 42.0 52.0 89
Climatography of the United States No
 Climate Division: CA 2 NWS Call Sign: Month (1) Min (2) Month(1) Extremes Lowest (2) Temperature ( F) Lowest Month(1) Degree s (1) Base Temp 65 Heating Cooling 100 Number of s (3) Jan 55.6 38.8 47.2 81
Climatography of the United States No
 Climate Division: CA 2 NWS Call Sign: Month (1) Min (2) Month(1) Extremes Lowest (2) Temperature ( F) Lowest Month(1) Degree s (1) Base Temp 65 Heating Cooling 100 Number of s (3) Jan 53.5 37.6 45.6 78
Climatography of the United States No
 Climate Division: CA 6 NWS Call Sign: Month (1) Min (2) Month(1) Extremes Lowest (2) Temperature ( F) Lowest Month(1) Degree s (1) Base Temp 65 Heating Cooling 100 Number of s (3) Jan 66.1 38.3 52.2 91
Climatography of the United States No
 Climate Division: CA 1 NWS Call Sign: Month (1) Min (2) Month(1) Extremes Lowest (2) Temperature ( F) Lowest Month(1) Degree s (1) Base Temp 65 Heating Cooling 1 Number of s (3) Jan 56.2 4.7 48.5 79 1962
Climatography of the United States No
 Climate Division: CA 1 NWS Call Sign: Month (1) Min (2) Month(1) Extremes Lowest (2) Temperature ( F) Lowest Month(1) Degree s (1) Base Temp 65 Heating Cooling 100 Number of s (3) Jan 50.2 31.2 40.7 65+
Climatography of the United States No
 Climate Division: CA 4 NWS Call Sign: Month (1) Min (2) Month(1) Extremes Lowest (2) Temperature ( F) Lowest Month(1) Degree s (1) Base Temp 65 Heating Cooling 100 Number of s (3) Jan 61.4 33.1 47.3 82+
Climatography of the United States No
 No. 2 1971-2 Asheville, North Carolina 2881 COOP ID: 43417 Climate Division: CA 4 NWS Call Sign: N Lon: 121 Month (1) Min (2) Month(1) Extremes Lowest (2) Temperature ( F) Lowest Month(1) Degree s (1)
Climatography of the United States No
 No. 2 1971-2 Asheville, North Carolina 2881 COOP ID: 4795 Climate Division: CA 6 NWS Call Sign: SBA Month (1) Min (2) Month(1) Extremes Lowest (2) Temperature ( F) Lowest Month(1) Degree s (1) Base Temp
Climatography of the United States No
 Climate Division: CA 7 NWS Call Sign: Month (1) Min (2) Month(1) Extremes Lowest (2) Temperature ( F) Lowest Month(1) Degree s (1) Base Temp 65 Heating Cooling 100 Number of s (3) Jan 54.4 36.9 45.7 77+
Climatography of the United States No
 Climate Division: CA 4 NWS Call Sign: Month (1) Min (2) Month(1) Extremes Lowest (2) Temperature ( F) Lowest Month(1) Degree s (1) Base Temp 65 Heating Cooling 100 Number of s (3) Jan 56.4 43.6 50.0 77
2003 Water Year Wrap-Up and Look Ahead
 2003 Water Year Wrap-Up and Look Ahead Nolan Doesken Colorado Climate Center Prepared by Odie Bliss http://ccc.atmos.colostate.edu Colorado Average Annual Precipitation Map South Platte Average Precipitation
Technical Report Denmark - DMI Historical Climate Data Collection with Danish Abstracts
 Denmark - DMI Historical Climate Data Collection 1768-2014 -with Danish Abstracts John Cappelen (ed) C 10.0 Annual Mean Temperature, Denmark 1873-2014 Corrected values 9.5 9.0 8.5 8.0 7.5 7.0 6.5 6.0 5.5
Climatography of the United States No
 Climate Division: SC 7 NWS Call Sign: CHS Month (1) Min (2) Month(1) Extremes Lowest (2) Temperature ( F) Lowest Month(1) Degree s (1) Base Temp 65 Heating Cooling 100 Number of s (3) Jan 58.9 36.9 47.9
Climatography of the United States No
 No. 2 1971-2 Asheville, North Carolina 2881 COOP ID: 46175 Climate Division: CA 6 NWS Call Sign: 3L3 Elevation: 1 Feet Lat: 33 Month (1) Min (2) Month(1) Extremes Lowest (2) Temperature ( F) Lowest Month(1)
Climatography of the United States No
 No. 2 1971-2 Asheville, North Carolina 2881 COOP ID: 42713 Climate Division: CA 7 NWS Call Sign: Elevation: -3 Feet Lat: 32 Month (1) Min (2) Month(1) Extremes Lowest (2) Temperature ( F) Lowest Month(1)
Technical Report Hourly values of sea level observations from two stations in Denmark. Hornbæk and Gedser
 Hourly values of sea level observations from two stations in Denmark. Hornbæk 1890-2005 and Gedser 1891-2005 Lonny Hansen Copenhagen 2007 www.dmi.dk/dmi/tr07-09 page 1 of 12 Colophon Serial title: Technical
What Does It Take to Get Out of Drought?
 What Does It Take to Get Out of Drought? Nolan J. Doesken Colorado Climate Center Colorado State University http://ccc.atmos.colostate.edu Presented at the Insects, Diseases and Drought Workshop, May 19,
Technical Report Guide to Climate Data and Information from the Danish Meteorological Institute Updated May 2011
 Technical Report 11-07 Guide to Climate Data and Information from the Danish Meteorological Institute Updated May 2011 John Cappelen (ed) Copenhagen 2011 www.dmi.dk/dmi/tr10-07 page 1 of 56 Colophon Serial
Technical Report The Faroe Islands - DMI Historical Climate Data Collection with Danish Abstracts
 The Faroe Islands - DMI Historical Climate Data Collection 1873-2014 -with Danish Abstracts John Cappelen (ed) Copenhagen 2015 http://www.dmi.dk/fileadmin/rapporter/tr/tr15-05 page 1 of 43 Colophon Serial
Sierra Weather and Climate Update
 Sierra Weather and Climate Update 2014-15 Kelly Redmond Western Regional Climate Center Desert Research Institute Reno Nevada Yosemite Hydroclimate Workshop Yosemite Valley, 2015 October 8-9 Percent of
SPECIMEN. Date Morning/Afternoon. A Level Geography H481/01 Physical systems Sample Question Paper. Time allowed: 1 hour 30 minutes PMT
 Oxford Cambridge and RSA A Level Geography H481/01 Physical systems Sample Question Paper Date Morning/Afternoon Time allowed: 1 hour 30 minutes You must have: the Resource Booklet the OCR 12-page Answer
Hydro-meteorological Analysis of Langtang Khola Catchment, Nepal
 Hydro-meteorological Analysis of Langtang Khola Catchment, Nepal Tirtha R. Adhikari 1, Lochan P. Devkota 1, Suresh.C Pradhan 2, Pradeep K. Mool 3 1 Central Department of Hydrology and Meteorology Tribhuvan
The Climate of Bryan County
 The Climate of Bryan County Bryan County is part of the Crosstimbers throughout most of the county. The extreme eastern portions of Bryan County are part of the Cypress Swamp and Forest. Average annual
Seasonal Climate Watch April to August 2018
 Seasonal Climate Watch April to August 2018 Date issued: Mar 23, 2018 1. Overview The El Niño-Southern Oscillation (ENSO) is expected to weaken from a moderate La Niña phase to a neutral phase through
What is the difference between Weather and Climate?
 What is the difference between Weather and Climate? Objective Many people are confused about the difference between weather and climate. This makes understanding the difference between weather forecasts
Variability and trends in daily minimum and maximum temperatures and in diurnal temperature range in Lithuania, Latvia and Estonia
 Variability and trends in daily minimum and maximum temperatures and in diurnal temperature range in Lithuania, Latvia and Estonia Jaak Jaagus Dept. of Geography, University of Tartu Agrita Briede Dept.
CliGen (Climate Generator) Addressing the Deficiencies in the Generator and its Databases William J Rust, Fred Fox & Larry Wagner
 Addressing the Deficiencies in the Generator and its Databases William J Rust, Fred Fox & Larry Wagner") CliGen (Climate Generator) Addressing the Deficiencies in the Generator and its Databases William J Rust, Fred Fox & Larry Wagner United States Department of Agriculture, Agricultural Research Service
CliGen (Climate Generator) Addressing the Deficiencies in the Generator and its Databases William J Rust, Fred Fox & Larry Wagner United States Department of Agriculture, Agricultural Research Service
Colorado s 2003 Moisture Outlook
 Colorado s 2003 Moisture Outlook Nolan Doesken and Roger Pielke, Sr. Colorado Climate Center Prepared by Tara Green and Odie Bliss http://climate.atmos.colostate.edu How we got into this drought! Fort
Variability of Reference Evapotranspiration Across Nebraska
 Know how. Know now. EC733 Variability of Reference Evapotranspiration Across Nebraska Suat Irmak, Extension Soil and Water Resources and Irrigation Specialist Kari E. Skaggs, Research Associate, Biological
Seasonal Climate Watch June to October 2018
 Seasonal Climate Watch June to October 2018 Date issued: May 28, 2018 1. Overview The El Niño-Southern Oscillation (ENSO) has now moved into the neutral phase and is expected to rise towards an El Niño
Introduction. Observed Local Trends. Temperature Rainfall Tropical Cyclones. Projections for the Philippines. Temperature Rainfall
 PAGASA-DOST ntroduction Observed Local Trends Temperature Rainfall Tropical Cyclones Projections for the Philippines Temperature Rainfall Climate Change ssue ncreased use of fossil fuel Global Warming
Local Ctimatotogical Data Summary White Hall, Illinois
 SWS Miscellaneous Publication 98-5 STATE OF ILLINOIS DEPARTMENT OF ENERGY AND NATURAL RESOURCES Local Ctimatotogical Data Summary White Hall, Illinois 1901-1990 by Audrey A. Bryan and Wayne Armstrong Illinois
Relationship between atmospheric circulation indices and climate variability in Estonia
 BOREAL ENVIRONMENT RESEARCH 7: 463 469 ISSN 1239-695 Helsinki 23 December 22 22 Relationship between atmospheric circulation indices and climate variability in Estonia Oliver Tomingas Department of Geography,
Seasonal Climate Watch July to November 2018
 Seasonal Climate Watch July to November 2018 Date issued: Jun 25, 2018 1. Overview The El Niño-Southern Oscillation (ENSO) is now in a neutral phase and is expected to rise towards an El Niño phase through