Technical Report World Weather Records and Denmark, The Faroe Islands and Greenland
|
|
|
- Mitchell Burke
- 5 years ago
- Views:
Transcription
1 World Weather Records and Denmark, The Faroe Islands and Greenland John Cappelen Copenhagen page 1 of 19
2 Colophon Serial title: Technical Report Title: World Weather Records and Subtitle: - Denmark, The Faroe Islands and Greenland Author(s): John Cappelen Other contributors: Responsible institution: Danish Meteorological Institute Language: English Keywords: World Weather Records WWR, WMO, climate summary, yearly, annual, mean, period , period , clino and , air temperature, atmospheric pressure, accumulated precipitation, Denmark, The Faroe Islands, Greenland, DMI monthly climate data collection, Url: ISSN: Version: Website: Copyright: Danish Meteorological Institute. It is allowed to copy and extract from the publication with a specification of the source material. page 2 of 19
3 Content: Abstract... 4 Resumé Introduction Data overview Station Overview Data Dictionary Station History... 9 References Previous reports Appendix 1. Example of the tables World Weather Records and page 3 of 19
4 Abstract A number of climatological data series are published in this report. These are monthly-/annual values and decadal averages for the periods and plus 30 years clino averages for the periods and for 5 locations in Denmark, 1 at the Faroe Islands and 9 in Greenland. The data series is the Danish data contribution to a WMO publication World Weather Records Resumé Nærværende rapport præsenterer en række danske klimaserier. Det inkluderer måneds-/årsværdier og dekadegennemsnit for perioderne og samt 30 års clino gennemsnit for perioderne and for 5 danske, 1 færøsk og 9 grønlandske lokaliteter. Data serierne er det danske bidrag til WMO publikationen World Weather Records page 4 of 19
5 1. Introduction This report presents a number of climatological data series. These are monthly-/annual values and decadal averages for the periods and plus 30 years clino averages for the periods and for 5 locations in Denmark, 1 at the Faroe Islands and 9 in Greenland based on DMI Monthly Climate Data Collections [1], [2] and [3]. The data series is the Danish data contribution to a WMO publication World Weather Records/WWR The report (pdf-format) and the matching data set can be downloaded from the publication part of DMI web pages ( See also a DMI Technical Report presenting decadal climate summary for the same selected stations in Denmark, the Faroe Islands and Greenland [4], also based on DMI Monthly Climate Data Collection. The parameters included here are mean temperature, highest and lowest temperature and highest 24 hour precipitation. For the same stations also temperature rankings are presented. This decadal climate summary and the temperature ranking was the Danish contribution to the WMO report Decadal Global Climate Summary/DGCS page 5 of 19
 DK 06051 Vestervig (pressure from 6052) 5646N 0819E 18 3,6 DK 06088 Nordby (pressure 6080, 6081 and 6096)")
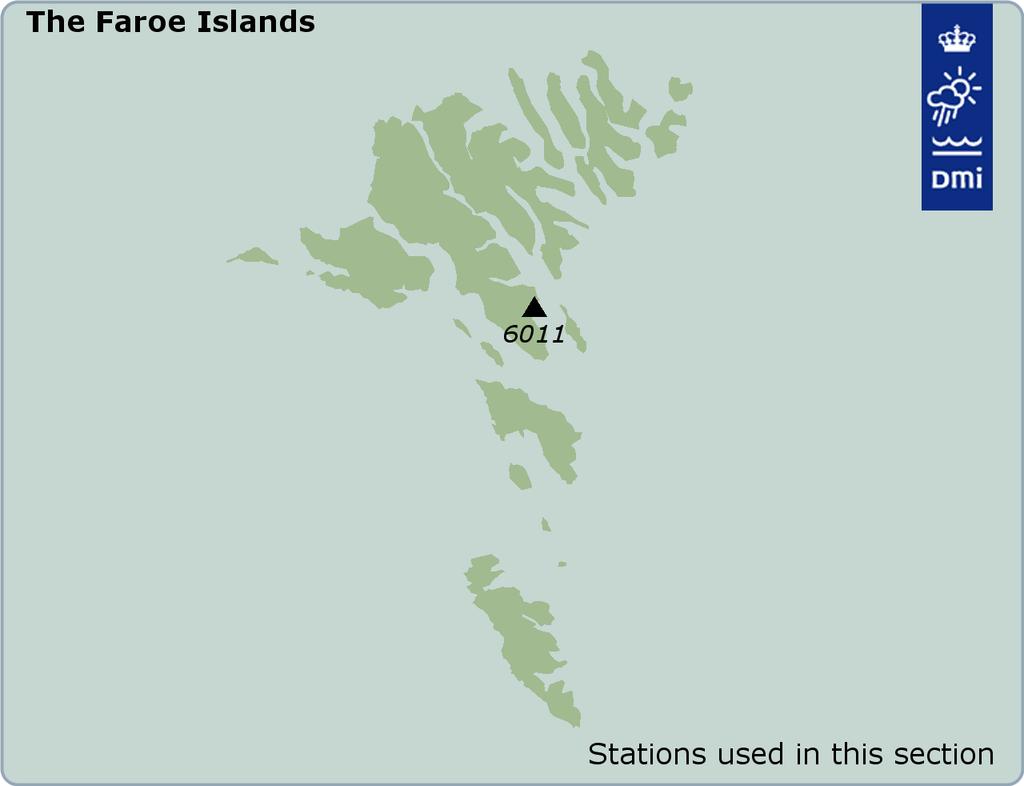
6 2. Data overview 2.1 Station Overview Country Station number Station Latitude Longitude Stat height (above msl) DK Vestervig (pressure from 6052) 5646N 0819E 18 3,6 DK Nordby (pressure 6080, 6081 and 6096) 5527N 0824E 4 8,9 DK Tranebjerg (pressure from 6159) 5550N 1073E 16 15,8 DK Landbohøjskolen (Kbh) (pressure 6180) 5541N 1233E 7 5,0 DK Hammer Odde Fyr 5518N 1446E 8 9,4 FR Tórshavn 6201N 0646E 54 55,9 GR Pituffik (only temperature) 7632N 6845W 77 GR Upernavik 7347N 5608W ,0 GR Ilulissat 6914N 5104W 29 34,0 GR Nuuk 6411N 5144W 80 83,7 GR Narsarsuaq 6110N 4525W 34 31,0 GR Qaqortoq (only temperature) 6043N 4603W 57 GR Danmarkshavn 7647N 1840W 11 12,0 GR Ittoqqortoormiit 7029N 2157W 70 71,5 GR Tasiilaq 6537N 3738W 54 55,9 Bar height (above msl) Table 1. Primary stations used in this report. See maps below for the locations. The maps are from [1], [2] and [3], where the source of the World Weather Records datasets are published as long monthly time series. Please notice that Ivittuut is included in the Greenland map, despite it is not a part of this report. The mean monthly temperature series from Ivittuut is adjusted to Narsarsuaq series in the data set [2] and can be used as a joined long time series Scoresbysund, located the same place as 4339 Ittoqqortoormiit and therefore not shown on the map, is also not a part of this report, but part of [2]. It is not adjusted to 4339! More details can be seen in [1,2,3] and chapter 3 Station History. page 6 of 19

7 page 7 of 19
8 2.2 Data Dictionary DMI No WWR No Element Unit Mean temperature C Mean of daily maximum temperature C Mean of daily minimum temperature C Mean atmospheric pressure hpa Accumulated precipitation mm Table 2. Elements used in this report. page 8 of 19
9 3. Station History By convention a time series is named after the most recent primary station delivering the data. Below is presented an overview back in time of the positions and relocations and starting and (if any) closing dates of the long station time series, which forms the backbone of the data sets included in this report [1], [2] and [3]. Also presented in the tables are any positions or relocations and starting and closing dates of other stations forming part of the series and therefore referred to in the description of the data series. More metadata on the series/stations may be found in [1,2,3,5]. Table 3. Station history from [1], [2] and [3]. The most recent primary stations are grey shaded. First year of data appearance is included for every station Vestervig from Vestervig 01-JUN JUN-1879 clima_man 32V Vestervig 01-JUL SEP-1883 clima_man 32V Vestervig 19-SEP AUG-1892 clima_man 32V Vestervig 17-AUG JUN-1924 clima_man 32V Vestervig 01-JUL APR-1937 clima_man 32V Vestervig 13-APR MAR-1946 clima_man 32V Vestervig 01-APR JAN-2000 clima_man 32V Vestervig 02-JAN APR-2011 precip_man 32V Vestervig 02-OCT-2002 snow_man 32V Vestervig 17-FEB-2000 clima_aut 32V Erslev 01-JUN JUN 1993 precip_man 32V Erslev 01-JUL APR-2011 precip_man 32V Bovbjerg Fyr 01-MAR AUG-1999 precip_man 32V Silstrup 22-MAR-2002 synop_dk 32V Vestervig 11-SEP-2003 synop_dk 32V Thyborøn 01-JAN FEB-1985 synop_dk 32V Thyborøn 07-FEB NOV-2000 synop_dk 32V Thyborøn 22-NOV-2000 synop_dk 32V FSN Aalborg 01-JAN-1953 synop_dk 32V Skagen Fyr 01-JAN DEC-2000 synop_dk 32V Skagen Fyr 14-DEC-2000 synop_dk 32V Hvide Sande 01-JAN NOV-2001 synop_dk 32V Hvide Sande 07-NOV-2001 synop_dk 32V FSN Karup 01-JAN-1953 synop_dk 32V Nordby from Nordby 01-SEP APR-1892 clima_man 32U Nordby 01-MAY NOV-1899 clima_man 32U Nordby 01-DEC FEB-1904 clima_man 32U Nordby 01-MAR FEB-1928 clima_man 32U Nordby 01-MAR APR-1936 clima_man 32U Nordby 05-APR DEC-1944 clima_man 32U Nordby 16-DEC NOV-1955 clima_man 32U Nordby 21-NOV AUG-1960 clima_man 32U Nordby 23-AUG SEP-1979 clima_man 32U Nordby 11-SEP JAN-1994 clima_man 32U Nordby 14-JAN FEB-1996 clima_man 32U Nordby 15-FEB JAN-2000 clima_man 32U Nordby 02-JAN JAN-2009 precip_man 32U Nordby 07-FEB-2000 clima_aut 32U Nordby 02-JAN OCT-2002 snow_man 32U Langli 01-JUL SEP-1999 precip_man 32U Langli 02-JUN DEC-2000 precip_man 32U Sønderho 01-JUN AUG-1999 precip_man 32U Sønderho 24-AUG APR-2009 precip_man 32U Esbjerg R/A V 04-JAN JUN-1985 precip_aut 32U Esbjerg R/A V 26-AUG JAN-1989 precip_aut 32U Esbjerg R/A V 16-JAN AUG-1990 precip_aut 32U Esbjerg R/A V 07-AUG _MAY-2012 precip_aut 32U page 9 of 19
10 25171 Esbjerg R/A V 24-MAY-2012 precip_aut 32U Hjerting 01-DEC JUN-1986 precip_man 32U Hjerting 10-JUN JAN-2007 precip_man 32U Nordby 23-JUL JUL-2007 synop_dk 32U Nordby 05-JUL-2007 synop_dk 32U Esbjerg Lufthavn 01-JAN MAR-1971 synop_dk 32U Esbjerg Lufthavn 01-APR SEP-1984 synop_dk 32U Esbjerg Lufthavn 01-OCT-1984 synop_dk 32U Vester Vedsted 06-MAY-1986 clima_aut 32U Blåvandshuk Fyr 01-JAN DEC-1971 synop_dk 32U Blåvandshuk Fyr 18-SEP-1980 synop_dk 32U Vester Vedsted 11-DEC-2003 synop_dk 32U Rømø/Juvre 02-MAY APR-2000 synop_dk 32U Rømø/Juvre 07-APR-2000 synop_dk 32U Hvide Sande 01-JAN NOV-2001 synop_dk 32V Hvide Sande 07-NOV-2001 synop_dk 32V Outrup 1-OCT NOV-2006 snow_man 32U Outrup 15-NOV OCT-2012 snow_man 32U Outrup 25-OCT-2012 snow_man 32U Tranebjerg from Tranebjerg 01-DEC FEB-1877 clima_man 32U Tranebjerg 01-MAR MAR-1884 clima_man 32U Tranebjerg 01-APR MAY-1918 clima_man 32U Tranebjerg 01-JUN APR-1950 clima_man 32U Tranebjerg 01-MAY OCT-1972 clima_man 32U Tranebjerg 01-NOV FEB-2000 clima_man 32U Tranebjerg 02-FEB FEB-2000 precip_man 32U Tranebjerg 15-FEB FEB-2000 clima_aut 32U Tranebjerg 01-MAR AUG 2003 clima_aut 32U Tranebjerg Øst 20-AUG-2003 clima_aut 32U Tranebjerg Øst 20-AUG-2003 synop_dk 32U Tranebjerg 01-MAR AUG-2001 precip_man 32U Tranebjerg Øst 02-AUG NOV-2009 precip_man 32U Tranebjerg Øst 18-NOV APR-2011 precip_man 32U Tranebjerg Øst 18-NOV SEP-2011 synop_dk 32U Tranebjerg Øst 26-SEP-2011 synop_dk 32U Tranebjerg Øst 01-OCT APR-2011 snow_man 32U Tranebjerg Øst 02-APR-2011 snow_man 32U Langør 01-JUN MAY-1880 precip_man 32U Langør 01-JUN MAY-1928 precip_man 32U Langør 01-JAN OCT-1946 precip_man 32U Langør 01-NOV DEC-1959 precip_man 32U Langør 01-JAN MAY-1977 precip_man 32U Langør 01-JUN FEB-1996 precip_man 32U Langør 01-MAR MAY-1997 precip_man 32U Ørnslund 01-JAN SEP-1881 precip_man 32U Ørnslund 01-OCT DEC-1958 precip_man 32U Brattingsborg 01-MAY DEC-1970 precip_man 32U Brattingsborg 01-JAN JUN-2004 precip_man 32U Blangstedgaard 01-JUL DEC-1982 clima_man 32U Røsnæs Fyr 01-JAN NOV-2001 synop_dk 32U Røsnæs Fyr 15-NOV-2001 synop_dk 32U Sletter Hage Fyr 15-MAY-2001 synop_dk 32V Odense Lufth. 01-JAN JUN-1975 synop_dk 32U Odense Lufth. 01-JUL-1975 synop_dk 32U Gniben 01-JAN JUL-1974 synop_dk 32V Gniben 01-AUG MAR-1979 synop_dk 32V Gniben 01-APR FEB-1983 synop_dk 32V Gniben 15-FEB-1983 synop_dk 32V Københavns Landbohøjskole from 1768 This station has been subject to urban change. Back in time the surroundings were rural whereas today the park of Landbohøjskolen with the synoptic station is surrounded by the city of Copenhagen. Observations in Copenhagen started 1751 in the tower Rundetårn, but the first 16 years the thermometer was situated inside a room in a little observatory near the top of the tower. In the beginning of 1767 the thermometer was situated outside the observatory facing north and from 1768 the observations were taken 4 times a day. Therefore the series presented in this report starts page 10 of 19
11 30380 Landbohøjskolen 01-JAN JUL-1997 clima_man 33U Landbohøjskolen 29-NOV JUN-1997 synop_dk 33U Landbohøjskolen 13-JUN-1997 synop_dk 33U Københavns Lufthavn 01-JAN JUN-1955 synop_dk 33U Københavns Lufthavn 01-JUL JUN-1959 synop_dk 33U Københavns Lufthavn 01-JUL JUL-1971 synop_dk 33U Københavns Lufthavn 14-JUL JUN-1983 synop_dk 33U Københavns Lufthavn 16-JUN-1983 synop_dk 33U Drogden Fyr 01-JAN-1961 synop_dk 33U Københavns Toldbod 01-JAN DEC-1949 fuess 33U Københavns Toldbod 01-JAN JUN-1976 fuess 33U Københavns Toldbod 01-JAN JUN-1997 fuess 33U Københavns Toldbod 01-MAY APR-2005 casella 33U Københavns Toldbod 20-FEB-2004 clima_aut 33U Botanisk Have 01-JAN APR-2011 precip_man 33U Botanisk Have 14-JAN NOV-2011 synop_dk 33U Botanisk Have 28-NOV JUL-2012 synop_dk 33U Botanisk Have 24-JUL-2012 synop_dk 33U Botanisk Have 01-OCT APR-2011 snow_man 33U Botanisk Have 02-APR-2011 snow_man 33U Rundetårn 01-JAN DEC-1817 clima_man 33U *) Gl. Botanisk Have 01-JAN DEC-1859 clima_man 33U *) The ground level of the tower is 7 m above MSL. The thermometer was situated app. 43 m above MSL Hammer Odde Fyr/Lighthouse from Sandvig 11-NOV AUG-1953 clima_man 33U Sandvig 01-SEP JUN-1966 clima_man 33U Sandvig 01-AUG NOV-1972 clima_man 33U Hammeren Fyr 01-JAN JUL-1962 clima_man 33U Hammer Odde Fyr 01-MAR JUN-1974 clima_man 33U Hammer Odde Fyr 01-JUL JUN-1987 clima_man 33U Christiansø Fyr 01-JAN MAR-2000 synop_dk 33U Klemensker 01-DEC DEC-2004 snow_man 33U Klemensker 02-DEC AUG-2010 snow_man 33U Østerlars 15-JAN MAY-2008 snow_man 33U Østerlars 21-MAY APR-2011 snow_man 33U Østerlars 02-APR-2011 snow_man 33U Hammer Odde Fyr 05-OCT AUG-2001 synop_dk 33U Hammer Odde Fyr 30-AUG-2001 synop_dk 33U Bornholms Lufthavn 01-JAN MAY-1977 synop_dk 33U Bornholms Lufthavn 01-JUN-1977 synop_dk 33U Dueodde N Fyr 01-JAN SEP-1962 synop_dk 33U Dueodde Fyr Syd 01-OCT JUN-1977 synop_dk 33U Tórshavn from Tórshavn skole 01-JAN DEC-1871 clima_man 29V Tórshavn skole 01-OCT JUL-1907 clima_man 29V Tórshavn skole 01-AUG MAR-1925 clima_man 29V Hoyvik 01-JUN DEC-1981 clima_man 29V Hoyvik 01-FEB MAR-1983 clima_man 29V Vagur 01-NOV NOV-1922 precip_man 29V Vagur 02-JUN OCT-2011 precip_man 29V Tórshavn 01-JAN JUN-1962 synop_dk 29V Tórshavn 01-JUL DEC-1992 synop_dk 29V Tórshavn 01-JAN-1993 synop_dk 29V Pituffik (Thule Air Base) from Dundas 01-JAN JUN-1981 synop_gr Dundas 02-NOV DEC-1981 synop_gr Dundas 01-MAR MAY-1982 synop_gr Dundas 01-JUL AUG-1983 synop_gr Pituffik *) 01-JAN NOV-2006 synop_gr *) From Nov 2006 the monthly data are obtained from Thule AB (Pituffik), personal communication. page 11 of 19
12 4211 Mittarfik Upernavik (Airport) from 1873 The station 4209 Upernavik AWS was an automatic station, which explains the lack of manually observations in the period, where 4210 Upernavik was closed Upernavik 01-SEP DEC-1960 clima_man *) *) 19 *) 4210 Upernavik 01-JAN JAN-1987 synop_gr Upernavik AWS 30-AUG SEP-1995 synop_gr Upernavik 08-SEP AUG-2004 synop_gr Mittarfik Upernavik 23-OCT-2000 synop_gr Pituffik 01-JAN NOV-2006 synop_gr Ilulissat 01-JAN SEP-1991 synop_gr Ilulissat 01-OCT AUG-1992 synop_gr Mittarfik Ilulissat 14-AUG-1991 synop_gr *) The number and positions of locations/relocations during the period are not certain Mittarfik Ilulissat (Airport) from 1807 (Danish name: Jakobshavn Lufthavn/Airport) Uummannaq 01-OCT-1829 *)? *) clima_man *) *) *) Upernavik 01-AUG-1807 *)? *) clima_man *) *) *) Ilulissat 01-NOV-1835 *)? *) clima_man *) *) *) Ilulissat 01-JUL FEB-1962 clima_man Qeqertarsuaq 01-AUG-1807 *)? *) clima_man *) *) *) 4212 Uummannaq 01-JAN AUG-1989 synop_gr Uummannaq Heli 15-JAN JUN-2006 synop_gr Ilulissat 01-JAN SEP-1991 synop_gr Ilulissat 01-OCT AUG-1992 synop_gr Qeqertarsuaq 01-JAN JUN-1980 synop_gr Qeqertarsuaq Heli 21-JAN-2004 synop_gr Mittarfik Ilulissat 01-JAN AUG-1991 metar Mittarfik Ilulissat 14-AUG-1991 metar Mittarfik Ilulissat 14-AUG-1991 synop_gr Aasiaat 01-JAN-1958 synop_gr *) The number, start, end and positions of locations/relocations during the period are not known or certain Nuuk (Danish name: Godthåb) from 1784 In the late 1990 s the manual precipitation gauge at 4250 Nuuk was replaced with an automatic rain gauge. This arrangement did not function satisfactory for climatic purposes at that time and therefore a supplementary manual gauge was started 2 February 1999 as station Nuuk. At this manual precipitation station Nuuk the precipitation was observed every day at 21 UTC for the previous 24 hours. The manual station was closed 1 September Qoornoq 01-JAN-1874 *)? *) clima_man *) *) *) Qoornoq 03-JAN DEC-1969 synop_gr Nuuk 01-SEP-1784 *)? *) clima_man *) *) *) Nuuk 01-JAN-1874 *) 31-DEC-1960 clima_man *) *) 20 *) 4250 Nuuk 01-JAN AUG-1991 synop_gr Nuuk 01-SEP-1991 synop_gr Nuuk 02-FEB SEP-2012 precip_man Mittarfik Ilulissat 14-AUG-1991 synop_gr Sisimiut 01-JAN JUN-2001 synop_gr Mittarfik Nuuk 01-AUG-1985 metar Mittarfik Nuuk 01-NOV-2000 synop_gr Mittarfik Narsarsuaq 01-JAN-1961 synop_gr *) The number, start, end and positions of locations/relocations during the period are not known or certain Ivittuut (Danish name: Ivigtut) from 1873 The parameter monthly mean temperature is adjusted to 4270 Mittarfik Narsarsuaq Ivittuut 01-JAN DEC-1966 clima_man *) *) 30 *) *) The number and positions of locations/relocations during the period are not certain. page 12 of 19
13 4270 Mittarfik Narsarsuaq (Airport) from 1961 A manual gauge was started in January 2009 as station Mittarfik Narsarsuaq. At this the precipitation is observed every day at 12 UTC for the previous 24 hours. The parameter monthly mean temperature can be joined with Ivittuut Mittarfik Narsarsuaq 01-JAN-1961 synop_gr Mittarfik Narsarsuaq 22-JAN-2009 precip_man Narsarsuaq Radiosonde 07-JUL-2011 synop_gr Qaqortoq (Danish name: Julianehåb) from Paamiut 01-AUG-1828 *)? *) clima_man *) *) *) Ivittuut 01-JAN DEC-1966 clima_man *) *) 30 *) Qaqortoq 01-OCT-1807 *)? *) clima_man *) *) *) Nanortalik 01-AUG-1883 *)? *) clima_man *) *) *) 4260 Paamiut 01-JAN SEP-1992 synop_gr Paamiut Heliport 22-SEP DEC-2007 synop_gr Mitt. Paamiut 07-DEC-2007 synop_gr Mitt. Narsarsuaq 01-JAN-1961 synop_gr Qaqortoq 01-JAN SEP-2003 synop_gr Qaqortoq 09-SEP-2003 synop_gr Qaqortoq Heliport 17-MAR-2004 synop_gr *) The number, start, end and positions of locations/relocations during the period are not known or certain Danmarkshavn from 1949 A manual measurement was started in January 2009 as station Danmarkshavn. At this the precipitation is observed every day at 12 UTC for the previous 24 hours Danmarkshavn 05-NOV DEC-1957 synop_gr Danmarkshavn 01-JAN-1958 synop_gr Danmarkshavn 01-JAN-2009 precip_man Scoresbysund (Greenland name: Ittoqqortoormiit) from Scoresbysund *) 01-NOV DEC-1946 clima_man Scoresbysund *) 01-JAN APR-1948 clima_man Scoresbysund *) 01-MAY OCT-1948 clima_man Scoresbysund *) 01-NOV SEP-1949 clima_man *) The relocations during the period are not certain Ittoqqortoormiit (Danish name: Scoresbysund. Previous: Illoqqortoormiut) from Uunarteq (Kap Tobin) 01-OCT DEC-1960 project Uunarteq (Kap Tobin) 01-OCT OCT-1980 synop_gr Uunarteq (Kap Tobin) 05-SEP JUN-1990 synop_gr Ittoqqortoormiit 01-NOV _AUG-2005 synop_gr Ittoqqortoormiit 17_AUG-2005 synop_gr Mittarfik Nerlerit Inaat 01-NOV-2000 synop_gr Tasiilaq (Danish name: Ammassalik. Previous name: Angmagssalik) from Tasiilaq 13-OCT SEP-1959 clima_man *) *) 50 *) 4360 Tasiilaq 01-JAN MAR-1982 synop_gr Tasiilaq 01-APR AUG-2005 synop_gr Tasiilaq 15-AUG-2005 synop_gr Mittarfik Kulusuk 28-NOV-2000 synop_gr *) The number and positions of locations/relocations during the period are not certain. page 13 of 19
14 4. Data files Data are included in this report as three (3) Excel files, one for each of the countries Denmark, The Faroe Islands and Greenland: dk_wwr.xlsx, fr_wwr.xlsx, gr_wwr.xlsx The format is: Station Metadata section: Field 1: Blank Field 2: WMO number Field 3: Record type 1= Station Metadata Record Field 4: Latitude N= Northern Field 5: Longitude E= Eastern, W= Western Field 6: Country Field 7: Station name Field 8: Height of station above sea level (meters) Field 9: Height of barometer above sea level (0.1 meters) Data records: Field 1: Blank Field 2: WMO number Field 3: Element code 3= Mean sea level pressure in 0.1 hpa 4= Mean daily air temperature in 0.1 C 5= Accumulated precipitation in 0.1 mm 6= Mean daily maximum temperature in 0,1 C 6= Mean daily minimum temperature in 0,1 C Field 4: Year Field 5: Rec type blank=monthly and Annual data 1=Decadal average (NB! Year = 2000 or 2010) 2=Clino ( or ) average (NB! Year = 2000 or 2010) Field 6: Jan Value for January Field 7: Feb Value for February Field 8: Mar Value for March Field 9: Apr Value for April Field 10: May Value for May Field 11: Jun Value for June Field 12: Jul Value for July Field 13: Aug Value for August Field 14: Sep Value for September Field 15: Oct Value for October Field 16: Nov Value for November Field 17: Dec Value for December Field 18: Annual Annual value Note: If a monthly value is missing, the yearly value is not calculated. The corresponding fields are left blank. Please also notice that: 1) 4202 Pituffik and 4272 Qaqortoq only have monthly mean temperatures in the dataset. 2) 4211 Upernavik only have accumulated precipitation up to The clino for accumulated precipitation are therefore only calculated on data ! 3) 4221 Ilulissat only have accumulated precipitation up to The clino for accumulated precipitation are therefore only calculated on data ! page 14 of 19
15 References [1] John Cappelen (ed) (2014): Denmark DMI Historical Data Collection with Danish Abstracts. DMI Technical Report 14-02, Copenhagen. [2] John Cappelen (ed) (2014): Greenland DMI Historical Data Collection with Danish Abstracts. DMI Technical Report 14-04, Copenhagen. [3] John Cappelen (ed) (2014): The Faroe Islands DMI Historical Data Collection with Danish Abstracts. DMI Technical Report 14-05, Copenhagen. [4] Cappelen, J. (2011) Decadal Climate Summary and Temperature Ranking Denmark, The Faroe Islands and Greenland. DMI Technical Report 11-14, Copenhagen. [5] Laursen, E. V. (2003): Metadata, Selected Climatological and Synoptic Stations, DMI Technical Report 03-24, Copenhagen. Previous reports Previous reports from the Danish Meteorological Institute can be found on: page 15 of 19
16 Appendix 1. Example of the tables World Weather Records and Hammer Odde Fyr, Denmark. Station Metadata section: Field 1: Blank Field 2: WMO number Field 3: Record type 1= Station Metadata Record Field 4: Latitude N= Northern Field 5: Longitude E= Eastern, W= Western Field 6: Country Field 7: Station name Field 8: Height of station above sea level (m) Field 9: Height of barometer above sea level (0.1 m) Data records: Field 1: Blank Field 2: WMO number Field 3: Element code 3= Mean sea level pressure in 0.1 hpa 4= Mean daily air temperature in 0.1 C 5= Accumulated precipitation in 0.1 mm 6= Mean daily maximum temperature in 0,1 C 6= Mean daily minimum temperature in 0,1 C Field 4: Year Field 5: Rec type blank=monthly and Annual data 1=Decadal average (NB! Year = 2000 or 2010) 2=Clino ( or ) average (NB! Year = 2000 or 2010) Field 6-18: Monthly/annual values Note: If a monthly value is missing, the yearly value is not calculated. The corresponding fields are left blank. page 16 of 19
17 WMO number Rec type Latitude Longitude Country Stat name Station H Barom H N 1446E Denmark Hammer Odde Fyr page 17 of 19
18 page 18 of 19
19 page 19 of 19
Technical Report DMI Monthly Climate Data Collection , Denmark, The Faroe Islands and Greenland
 DMI Monthly Climate Data Collection 1768-2009, Denmark, The Faroe Islands and Greenland John Cappelen (ed) Copenhagen 2010 www.dmi.dk/dmi/tr10-05 page 1 of 52 Colophon Serial title: Technical Report 10-05
København, Denmark John Cappelen. Copenhagen page 1 of 32
 Precipitation (mm) Sunshine (hours) DMI Report 18-19 Climatological Standard Normals - Denmark, The Faroe Islands and Greenland - Based on Data Published in DMI Reports 18-02, 18-04 and 18-05 John Cappelen
John Cappelen (ed) Copenhagen page 1 of 41
 Copenhagen page 1 of 41") DMI Daily Climate Data Collection 1873-2010, Denmark, The Faroe Islands and Greenland - including Air Pressure Observations 1874-2010 (WASA Data Sets) John Cappelen (ed) Copenhagen 2011 www.dmi.dk/dmi/tr11-06
DMI Daily Climate Data Collection 1873-2010, Denmark, The Faroe Islands and Greenland - including Air Pressure Observations 1874-2010 (WASA Data Sets) John Cappelen (ed) Copenhagen 2011 www.dmi.dk/dmi/tr11-06
DMI Report Weather observations from Tórshavn, The Faroe Islands Observation data with description
 DMI Report 17-09 Weather observations from Tórshavn, The Faroe Islands 1953-2016 - Observation data with description John Cappelen Copenhagen 2017 http://www.dmi.dk/laer-om/generelt/dmi-publikationer/
DANISH METEOROLOGICAL INSTITUTE MINISTRY OF TRANSPORT TECHNICAL REPORT 04-03
 DANISH METEOROLOGICAL INSTITUTE MINISTRY OF TRANSPORT TECHNICAL REPORT 04-03 DMI Daily Climate Data Collection 1873-2003, Denmark and Greenland Ellen Vaarby Laursen Weather and Climate Information Division
DMI Report Weather observations from Greenland Observation data with description
 DMI Report 17-08 Weather observations from Greenland 1958-2016 - Observation data with description John Cappelen (ed) Copenhagen 2017 http://www.dmi.dk/laer-om/generelt/dmi-publikationer/ page 1 of 31
Weather observations from Tórshavn, The Faroe Islands
 Weather observations from Tórshavn, The Faroe Islands 1953-2014 - Observation data with description John Cappelen Copenhagen 2015 http://www.dmi.dk/fileadmin/rapporter/tr/tr15-09 page 1 of 14 Colophon
Technical Report DMI Daily Climate Data Collection , Denmark and Greenland. John Cappelen, Ellen Vaarby Laursen and Claus Kern-Hansen
 DMI Daily Climate Data Collection 1873-2004, Denmark and Greenland John Cappelen, Ellen Vaarby Laursen and Claus Kern-Hansen Copenhagen 2006 www.dmi.dk/dmi/tr05-04 page 1 of 36 Colophon Serial title: Technical
DMI Report The Faroe Islands - DMI Historical Climate Data Collection
 DMI Report 17-05 The Faroe Islands - DMI Historical Climate Data Collection 1873-2016 John Cappelen (ed) Copenhagen 2017 http://www.dmi.dk/laer-om/generelt/dmi-publikationer/ page 1 of 37 Colophon Serial
DMI Report Denmark - DMI Historical Climate Data Collection
 1873 1883 1893 1903 1913 1923 1933 1943 1953 1963 1973 1983 1993 2003 2013 Temperature anomaly C DMI Report 17-02 Denmark - DMI Historical Climate Data Collection 1768-2016 John Cappelen (ed) 3 2 Denmark
Technical Report DMI SYNOP AWS Summit. Data status March Ellen Vaarby Laursen. SYNOP weather station Summit.
 10-09 DMI SYNOP AWS 04416 Summit. Data status March 2010. Ellen Vaarby Laursen SYNOP weather station 04416 Summit Picture Taken: 2007:06:20 16:16:11 Picture Taken: 2009:07:09 08:22:51 Copenhagen 2010 www.dmi.dk/dmi/tr
Danish Design Reference Year Grunnet Wang, Peter; Scharling, Mikael; Pagh Nielsen, Kristian; Kern-Hansen, Claus; Wittchen, Kim Bjarne
 Aalborg Universitet 2001 2010 Danish Design Reference Year Grunnet Wang, Peter; Scharling, Mikael; Pagh Nielsen, Kristian; Kern-Hansen, Claus; Wittchen, Kim Bjarne Publication date: 2013 Document Version
Road Weather Modelling System: Verification for Road Weather Season
 Road Weather Modelling System: Verification for 2009-2010 Road Weather Season Claus Petersen, Alexander Mahura, Bent Sass Copenhagen 2010 www.dmi.dk/dmi/tr10-12.pdf page 1 of 20 Colophon Serial title:
DANISH METEOROLOGICAL INSTITUTE MINISTRY OF TRANSPORT TECHNICAL REPORT 02-25
 DANISH METEOROLOGICAL INSTITUTE MINISTRY OF TRANSPORT TECHNICAL REPORT 02-25 New hours of bright sunshine normals for Denmark, 1961-1990. Ellen Vaarby Laursen and Stig Rosenørn COPENHAGEN 2002 ISSN 0906-897X
Technical Report Road Weather Modelling System: Verification for Road Weather Season. Claus Petersen, Alexander Mahura, Bent Sass
 Technical Report 09-10 Road Weather Modelling System: Verification for 2008-2009 Road Weather Season Claus Petersen, Alexander Mahura, Bent Sass www.dmi.dk/dmi/tr09-10 Copenhagen 2009 page 1 of 20 Colophon
Road Weather Modelling System: Verification for Road Weather Season
 Road Weather Modelling System: Verification for 2007-2008 Road Weather Season Claus Petersen, Alexander Mahura, Bent Sass, Torben Pedersen Copenhagen 2008 www.dmi.dk/dmi/tr08-09 page 1 of 14 Colophon Serial
Road Weather Modelling System: Verification for Road Weather Season
 Road Weather Modelling System: Verification for 2010-2011 Road Weather Season Claus Petersen, Alexander Mahura, Bent Sass Copenhagen 2011 www.dmi.dk/dmi/tr11-19.pdf page 1 of 28 Colophon Serial title:
Guidelines for the Submission of the World Weather Records 2011+
 Guidelines for the Submission of the World Weather Records 2011+ 2017 edition WEATHER CLIMATE WATER WMO-No. 1186 Guidelines for the Submission of the World Weather Records 2011+ 2017 edition WMO-No. 1186
WHEN IS IT EVER GOING TO RAIN? Table of Average Annual Rainfall and Rainfall For Selected Arizona Cities
 WHEN IS IT EVER GOING TO RAIN? Table of Average Annual Rainfall and 2001-2002 Rainfall For Selected Arizona Cities Phoenix Tucson Flagstaff Avg. 2001-2002 Avg. 2001-2002 Avg. 2001-2002 October 0.7 0.0
DANISH METEOROLOGICAL INSTITUTE MINISTRY OF TRANSPORT TECHNICAL REPORT 98-14
 DANISH METEOROLOGICAL INSTITUTE MINISTRY OF TRANSPORT TECHNICAL REPORT 98-14 The Climate of The Faroe Islands - with Climatological Standard Normals, 1961-1990 John Cappelen and Ellen Vaarby Laursen COPENHAGEN
Jackson County 2013 Weather Data
 Jackson County 2013 Weather Data 61 Years of Weather Data Recorded at the UF/IFAS Marianna North Florida Research and Education Center Doug Mayo Jackson County Extension Director 1952-2008 Rainfall Data
Sea Level data from 14 stations in Denmark
 Report 18-16 Sea Level data 1889 2017 from 14 stations in Denmark Mean, maximum and minimum values calculated on monthly and yearly basis including plots mean values Lonny Hansen Copenhagen 2018 www.dmi.dk
Climatography of the United States No
 Climate Division: AK 5 NWS Call Sign: ANC Month (1) Min (2) Month(1) Extremes Lowest (2) Temperature ( F) Lowest Month(1) Degree s (1) Base Temp 65 Heating Cooling 90 Number of s (3) Jan 22.2 9.3 15.8
Climatography of the United States No
 Month (1) Min (2) Month(1) Extremes Lowest (2) Temperature ( F) Lowest Month(1) Degree s (1) Base Temp 65 Heating Cooling 100 Number of s (3) Jan 63.9 39.3 51.6 86 1976 16 56.6 1986 20 1976 2 47.5 1973
Climatography of the United States No
 Temperature ( F) Month (1) Min (2) Month(1) Extremes Lowest (2) Lowest Month(1) Degree s (1) Base Temp 65 Heating Cooling 100 Number of s (3) Jan 32.8 21.7 27.3 62 1918 1 35.8 1983-24 1950 29 10.5 1979
Jackson County 2018 Weather Data 67 Years of Weather Data Recorded at the UF/IFAS Marianna North Florida Research and Education Center
 Jackson County 2018 Weather Data 67 Years of Weather Data Recorded at the UF/IFAS Marianna North Florida Research and Education Center Doug Mayo Jackson County Extension Director 1952-2008 Rainfall Data
Climatography of the United States No
 Climate Division: CA 4 NWS Call Sign: Month (1) Min (2) Month(1) Extremes Lowest (2) Temperature ( F) Lowest Month(1) Degree s (1) Base Temp 65 Heating Cooling 100 Number of s (3) Jan 55.6 39.3 47.5 77
Climatography of the United States No
 Climate Division: CA 5 NWS Call Sign: Month (1) Min (2) Month(1) Extremes Lowest (2) Temperature ( F) Lowest Month(1) Degree s (1) Base Temp 65 Heating Cooling 100 Number of s (3) Jan 56.6 36.5 46.6 81
Climatography of the United States No
 Climate Division: CA 1 NWS Call Sign: Month (1) Min (2) Month(1) Extremes Lowest (2) Temperature ( F) Lowest Month(1) Degree s (1) Base Temp 65 Heating Cooling 100 Number of s (3) Jan 57.9 38.9 48.4 85
Climatography of the United States No
 Climate Division: CA 5 NWS Call Sign: Month (1) Min (2) Month(1) Extremes Lowest (2) Temperature ( F) Lowest Month(1) Degree s (1) Base Temp 65 Heating Cooling 100 Number of s (3) Jan 44.8 25.4 35.1 72
Climatography of the United States No
 Climate Division: CA 4 NWS Call Sign: Month (1) Min (2) Month(1) Extremes Lowest (2) Temperature ( F) Lowest Month(1) Degree s (1) Base Temp 65 Heating Cooling 100 Number of s (3) Jan 49.4 37.5 43.5 73
Climatography of the United States No
 Climate Division: CA 6 NWS Call Sign: Month (1) Min (2) Month(1) Extremes Lowest (2) Temperature ( F) Lowest Month(1) Degree s (1) Base Temp 65 Heating Cooling 100 Number of s (3) Jan 69.4 46.6 58.0 92
Climatography of the United States No
 Climate Division: CA 4 NWS Call Sign: Month (1) Min (2) Month(1) Extremes Lowest (2) Temperature ( F) Lowest Month(1) Degree s (1) Base Temp 65 Heating Cooling 1 Number of s (3) Jan 58.5 38.8 48.7 79 1962
Climatography of the United States No
 Climate Division: CA 6 NWS Call Sign: Month (1) Min (2) Month(1) Extremes Lowest (2) Temperature ( F) Lowest Month(1) Degree s (1) Base Temp 65 Heating Cooling 1 Number of s (3) Jan 67.5 42. 54.8 92 1971
Climatography of the United States No
 Climate Division: CA 1 NWS Call Sign: Month (1) Min (2) Month(1) Extremes Lowest (2) Temperature ( F) Lowest Month(1) Degree s (1) Base Temp 65 Heating Cooling 1 Number of s (3) Jan 57.8 39.5 48.7 85 1962
Climatography of the United States No
 Climate Division: ND 8 NWS Call Sign: BIS Month (1) Min (2) Month(1) Extremes Lowest (2) Temperature ( F) Lowest Month(1) Degree s (1) Base Temp 65 Heating Cooling 100 Number of s (3) Jan 21.1 -.6 10.2
Climatography of the United States No
 Climate Division: TN 1 NWS Call Sign: Month (1) Min (2) Month(1) Extremes Lowest (2) Temperature ( F) Lowest Month(1) Degree s (1) Base Temp 65 Heating Cooling 100 Number of s (3) Jan 47.6 24.9 36.3 81
Climatography of the United States No
 Climate Division: CA 5 NWS Call Sign: FAT Month (1) Min (2) Month(1) Extremes Lowest (2) Temperature ( F) Lowest Month(1) Degree s (1) Base Temp 65 Heating Cooling 1 Number of s (3) Jan 53.6 38.4 46. 78
Climatography of the United States No
 Climate Division: CA 6 NWS Call Sign: 1L2 N Lon: 118 3W Month (1) Min (2) Month(1) Extremes Lowest (2) Temperature ( F) Lowest Month(1) Degree s (1) Base Temp 65 Heating Cooling 1 Number of s (3) Jan 63.7
Climatography of the United States No
 Climate Division: CA 5 NWS Call Sign: BFL Month (1) Min (2) Month(1) Extremes Lowest (2) Temperature ( F) Lowest Month(1) Degree s (1) Base Temp 65 Heating Cooling 1 Number of s (3) Jan 56.3 39.3 47.8
Variability and trends in daily minimum and maximum temperatures and in diurnal temperature range in Lithuania, Latvia and Estonia
 Variability and trends in daily minimum and maximum temperatures and in diurnal temperature range in Lithuania, Latvia and Estonia Jaak Jaagus Dept. of Geography, University of Tartu Agrita Briede Dept.
Climatography of the United States No
 Climate Division: TN 3 NWS Call Sign: BNA Month (1) Min (2) Month(1) Extremes Lowest (2) Temperature ( F) Lowest Month(1) Degree s (1) Base Temp 65 Heating Cooling 100 Number of s (3) Jan 45.6 27.9 36.8
Technical Report Hourly values of sea level observations from two stations in Denmark. Hornbæk and Gedser
 Hourly values of sea level observations from two stations in Denmark. Hornbæk 1890-2005 and Gedser 1891-2005 Lonny Hansen Copenhagen 2007 www.dmi.dk/dmi/tr07-09 page 1 of 12 Colophon Serial title: Technical
Climatography of the United States No
 Climate Division: CA 5 NWS Call Sign: Elevation: 6 Feet Lat: 37 Month (1) Min (2) Month(1) Extremes Lowest (2) Temperature ( F) Lowest Month(1) Degree s (1) Base Temp 65 Heating Cooling 1 Number of s (3)
Climatography of the United States No
 Climate Division: CA 4 NWS Call Sign: Elevation: 2 Feet Lat: 37 Month (1) Min (2) Month(1) Extremes Lowest (2) Temperature ( F) Lowest Month(1) Degree s (1) Base Temp 65 Heating Cooling 1 Number of s (3)
Climatography of the United States No
 Climate Division: CA 4 NWS Call Sign: Elevation: 13 Feet Lat: 36 Month (1) Min (2) Month(1) Extremes Lowest (2) Temperature ( F) Lowest Month(1) Degree s (1) Base Temp 65 Heating Cooling 1 Number of s
Climatography of the United States No
 Climate Division: CA 5 NWS Call Sign: Elevation: 1,14 Feet Lat: 36 Month (1) Min (2) Month(1) Extremes Lowest (2) Temperature ( F) Lowest Month(1) Degree s (1) Base Temp 65 Heating Cooling 1 Number of
Climatography of the United States No
 Month (1) Min (2) Month(1) Extremes Lowest (2) Temperature ( F) Lowest Month(1) Degree s (1) Base Temp 65 Heating Cooling 100 Number of s (3) 42.6 24.2 33.4 79 1950 25 44.2 1974-16 1994 19 18.8 1977 977
Climatography of the United States No
 Climate Division: CA 6 NWS Call Sign: LAX Elevation: 1 Feet Lat: 33 Month (1) Min (2) Month(1) Extremes Lowest (2) Temperature ( F) Lowest Month(1) Degree s (1) Base Temp 65 Heating Cooling 1 Number of
Climatography of the United States No
 Climate Division: CA 6 NWS Call Sign: TOA Elevation: 11 Feet Lat: 33 2W Temperature ( F) Month (1) Min (2) Month(1) Extremes Lowest (2) Lowest Month(1) Degree s (1) Base Temp 65 Heating Cooling 1 Number
Drought in Southeast Colorado
 Drought in Southeast Colorado Nolan Doesken and Roger Pielke, Sr. Colorado Climate Center Prepared by Tara Green and Odie Bliss http://climate.atmos.colostate.edu 1 Historical Perspective on Drought Tourism
Climatography of the United States No
 No. 2 1971-2 Asheville, North Carolina 2881 COOP ID: 46646 Climate Division: CA 4 NWS Call Sign: 8W Month (1) Min (2) Month(1) Extremes Lowest (2) Temperature ( F) Lowest Month(1) Degree s (1) Base Temp
Climatography of the United States No
 No. 2 1971-2 Asheville, North Carolina 2881 COOP ID: 4792 Climate Division: CA 6 NWS Call Sign: Month (1) Min (2) Month(1) Extremes Lowest (2) Temperature ( F) Lowest Month(1) Degree s (1) Base Temp 65
Climatography of the United States No
 Climate Division: CA 6 NWS Call Sign: Month (1) Min (2) Month(1) Extremes Lowest (2) Temperature ( F) Lowest Month(1) Degree s (1) Base Temp 65 Heating Cooling 100 Number of s (3) Jan 51.5 35.0 43.3 80
Climatography of the United States No
 Climate Division: CA 5 NWS Call Sign: Month (1) Min (2) Month(1) Extremes Lowest (2) Temperature ( F) Lowest Month(1) Degree s (1) Base Temp 65 Heating Cooling 100 Number of s (3) 59.3 31.5 45.4 80 1976
Climatography of the United States No
 Climate Division: CA 7 NWS Call Sign: Month (1) Min (2) Month(1) Extremes Lowest (2) Temperature ( F) Lowest Month(1) Degree s (1) Base Temp 65 Heating Cooling 100 Number of s (3) 44.5 29.3 36.9 69 1951
Climatography of the United States No
 Climate Division: CA 2 NWS Call Sign: Month (1) Min (2) Month(1) Extremes Lowest (2) Temperature ( F) Lowest Month(1) Degree s (1) Base Temp 65 Heating Cooling 100 Number of s (3) 53.3 37.1 45.2 77 1962
Climatography of the United States No
 Climate Division: CA 2 NWS Call Sign: Month (1) Min (2) Month(1) Extremes Lowest (2) Temperature ( F) Lowest Month(1) Degree s (1) Base Temp 65 Heating Cooling 100 Number of s (3) 53.3 31.8 42.6 74+ 1975
Climatography of the United States No
 Climate Division: CA 2 NWS Call Sign: Month (1) Min (2) Month(1) Extremes Lowest (2) Temperature ( F) Lowest Month(1) Degree s (1) Base Temp 65 Heating Cooling 100 Number of s (3) 53.7 32.7 43.2 79 1962
Climatography of the United States No
 Climate Division: CA 6 NWS Call Sign: Month (1) Min (2) Month(1) Extremes Lowest (2) Temperature ( F) Lowest Month(1) Degree s (1) Base Temp 65 Heating Cooling 100 Number of s (3) 68.5 45.7 57.1 90 1971
Climatography of the United States No
 Climate Division: CA 7 NWS Call Sign: Month (1) Min (2) Month(1) Extremes Lowest (2) Temperature ( F) Lowest Month(1) Degree s (1) Base Temp 65 Heating Cooling 100 Number of s (3) 56.0 35.7 45.9 83 1975
Climatography of the United States No
 Climate Division: CA 7 NWS Call Sign: Month (1) Min (2) Month(1) Extremes Lowest (2) Temperature ( F) Lowest Month(1) Degree s (1) Base Temp 65 Heating Cooling 1 Number of s (3) 64.8 45.4 55.1 85 1971
Climatography of the United States No
 Climate Division: CA 7 NWS Call Sign: Month (1) Min (2) Month(1) Extremes Lowest (2) Temperature ( F) Lowest Month(1) Degree s (1) Base Temp 65 Heating Cooling 1 Number of s (3) 65.5 38.7 52.1 87 1962
Climatography of the United States No
 Climate Division: CA 7 NWS Call Sign: Month (1) Min (2) Month(1) Extremes Lowest (2) Temperature ( F) Lowest Month(1) Degree s (1) Base Temp 65 Heating Cooling 100 Number of s (3) 58.8 34.3 46.6 81+ 1948
Climatography of the United States No
 Climate Division: CA 7 NWS Call Sign: Month (1) Min (2) Month(1) Extremes Lowest (2) Temperature ( F) Lowest Month(1) Degree s (1) Base Temp 65 Heating Cooling 100 Number of s (3) 70.4 44.2 57.3 95 1971
Climatography of the United States No
 Climate Division: CA 1 NWS Call Sign: Month (1) Min (2) Month(1) Extremes Lowest (2) Temperature ( F) Lowest Month(1) Degree s (1) Base Temp 65 Heating Cooling 100 Number of s (3) Jan 52.4 35.4 43.9 69
Climatography of the United States No
 Climate Division: CA 4 NWS Call Sign: Month (1) Min (2) Month(1) Extremes Lowest (2) Temperature ( F) Lowest Month(1) Degree s (1) Base Temp 65 Heating Cooling 100 Number of s (3) Jan 61.9 42.0 52.0 89
Climatography of the United States No
 Climate Division: CA 2 NWS Call Sign: Month (1) Min (2) Month(1) Extremes Lowest (2) Temperature ( F) Lowest Month(1) Degree s (1) Base Temp 65 Heating Cooling 100 Number of s (3) Jan 55.6 38.8 47.2 81
Climatography of the United States No
 Climate Division: CA 2 NWS Call Sign: Month (1) Min (2) Month(1) Extremes Lowest (2) Temperature ( F) Lowest Month(1) Degree s (1) Base Temp 65 Heating Cooling 100 Number of s (3) Jan 53.5 37.6 45.6 78
Climatography of the United States No
 Climate Division: CA 6 NWS Call Sign: Month (1) Min (2) Month(1) Extremes Lowest (2) Temperature ( F) Lowest Month(1) Degree s (1) Base Temp 65 Heating Cooling 100 Number of s (3) Jan 66.1 38.3 52.2 91
Climatography of the United States No
 Climate Division: CA 1 NWS Call Sign: Month (1) Min (2) Month(1) Extremes Lowest (2) Temperature ( F) Lowest Month(1) Degree s (1) Base Temp 65 Heating Cooling 1 Number of s (3) Jan 56.2 4.7 48.5 79 1962
Climatography of the United States No
 Climate Division: CA 1 NWS Call Sign: Month (1) Min (2) Month(1) Extremes Lowest (2) Temperature ( F) Lowest Month(1) Degree s (1) Base Temp 65 Heating Cooling 100 Number of s (3) Jan 50.2 31.2 40.7 65+
Climatography of the United States No
 Climate Division: CA 4 NWS Call Sign: Month (1) Min (2) Month(1) Extremes Lowest (2) Temperature ( F) Lowest Month(1) Degree s (1) Base Temp 65 Heating Cooling 100 Number of s (3) Jan 61.4 33.1 47.3 82+
Jackson County 2014 Weather Data
 Jackson County 2014 Weather Data 62 Years of Weather Data Recorded at the UF/IFAS Marianna North Florida Research and Education Center Doug Mayo Jackson County Extension Director 1952-2008 Rainfall Data
Climatography of the United States No
 No. 2 1971-2 Asheville, North Carolina 2881 COOP ID: 43417 Climate Division: CA 4 NWS Call Sign: N Lon: 121 Month (1) Min (2) Month(1) Extremes Lowest (2) Temperature ( F) Lowest Month(1) Degree s (1)
Climatography of the United States No
 Climate Division: CA 7 NWS Call Sign: Month (1) Min (2) Month(1) Extremes Lowest (2) Temperature ( F) Lowest Month(1) Degree s (1) Base Temp 65 Heating Cooling 100 Number of s (3) Jan 54.4 36.9 45.7 77+
Climatography of the United States No
 No. 2 1971-2 Asheville, North Carolina 2881 COOP ID: 4795 Climate Division: CA 6 NWS Call Sign: SBA Month (1) Min (2) Month(1) Extremes Lowest (2) Temperature ( F) Lowest Month(1) Degree s (1) Base Temp
Atmospheric circulation analysis for seasonal forecasting
 Training Seminar on Application of Seasonal Forecast GPV Data to Seasonal Forecast Products 18 21 January 2011 Tokyo, Japan Atmospheric circulation analysis for seasonal forecasting Shotaro Tanaka Climate
Scarborough Tide Gauge
 Tide Gauge Location OS: 504898E 488622N WGS84: Latitude: 54 16' 56.990"N Longitude: 00 23' 25.0279"W Instrument Valeport 740 (Druck Pressure Transducer) Benchmarks Benchmark Description TGBM = 4.18m above
Highlights of the 2006 Water Year in Colorado
 Highlights of the 2006 Water Year in Colorado Nolan Doesken, State Climatologist Atmospheric Science Department Colorado State University http://ccc.atmos.colostate.edu Presented to 61 st Annual Meeting
Climatography of the United States No
 Climate Division: SC 7 NWS Call Sign: CHS Month (1) Min (2) Month(1) Extremes Lowest (2) Temperature ( F) Lowest Month(1) Degree s (1) Base Temp 65 Heating Cooling 100 Number of s (3) Jan 58.9 36.9 47.9
Climatography of the United States No
 No. 2 1971-2 Asheville, North Carolina 2881 COOP ID: 46175 Climate Division: CA 6 NWS Call Sign: 3L3 Elevation: 1 Feet Lat: 33 Month (1) Min (2) Month(1) Extremes Lowest (2) Temperature ( F) Lowest Month(1)
Climatography of the United States No
 No. 2 1971-2 Asheville, North Carolina 2881 COOP ID: 42713 Climate Division: CA 7 NWS Call Sign: Elevation: -3 Feet Lat: 32 Month (1) Min (2) Month(1) Extremes Lowest (2) Temperature ( F) Lowest Month(1)
Drought Characterization. Examination of Extreme Precipitation Events
 Drought Characterization Examination of Extreme Precipitation Events Extreme Precipitation Events During the Drought For the drought years (1999-2005) daily precipitation data was analyzed to find extreme
GAMINGRE 8/1/ of 7
 FYE 09/30/92 JULY 92 0.00 254,550.00 0.00 0 0 0 0 0 0 0 0 0 254,550.00 0.00 0.00 0.00 0.00 254,550.00 AUG 10,616,710.31 5,299.95 845,656.83 84,565.68 61,084.86 23,480.82 339,734.73 135,893.89 67,946.95
Variability of Reference Evapotranspiration Across Nebraska
 Know how. Know now. EC733 Variability of Reference Evapotranspiration Across Nebraska Suat Irmak, Extension Soil and Water Resources and Irrigation Specialist Kari E. Skaggs, Research Associate, Biological
Climatography of the United States No
 Month (1) Min (2) Month(1) Extremes Lowest (2) Temperature ( F) Lowest Month(1) Degree s (1) Base Temp 65 Heating Cooling 100 Number of s (3) Jan 54.3 40.1 47.2 75 1998 17 53.0 1995 18 1949 11 41.7 1972
ANNUAL CLIMATE REPORT 2016 SRI LANKA
 ANNUAL CLIMATE REPORT 2016 SRI LANKA Foundation for Environment, Climate and Technology C/o Mahaweli Authority of Sri Lanka, Digana Village, Rajawella, Kandy, KY 20180, Sri Lanka Citation Lokuhetti, R.,
2003 Water Year Wrap-Up and Look Ahead
 2003 Water Year Wrap-Up and Look Ahead Nolan Doesken Colorado Climate Center Prepared by Odie Bliss http://ccc.atmos.colostate.edu Colorado Average Annual Precipitation Map South Platte Average Precipitation
Multivariate Regression Model Results
 Updated: August, 0 Page of Multivariate Regression Model Results 4 5 6 7 8 This exhibit provides the results of the load model forecast discussed in Schedule. Included is the forecast of short term system
Chiang Rai Province CC Threat overview AAS1109 Mekong ARCC
 Chiang Rai Province CC Threat overview AAS1109 Mekong ARCC This threat overview relies on projections of future climate change in the Mekong Basin for the period 2045-2069 compared to a baseline of 1980-2005.
Climatography of the United States No
 Climate Division: CA 4 NWS Call Sign: Month (1) Min (2) Month(1) Extremes Lowest (2) Temperature ( F) Lowest Month(1) Degree s (1) Base Temp 65 Heating Cooling 100 Number of s (3) Jan 56.4 43.6 50.0 77
Extending Greenland temperature records into the late eighteenth century
 JOURNAL OF GEOPHYSICAL RESEARCH, VOL. 111,, doi:10.1029/2005jd006810, 2006 Extending Greenland temperature records into the late eighteenth century B. M. Vinther, 1 K. K. Andersen, 1 P. D. Jones, 2 K.
Technical Report The Faroe Islands - DMI Historical Climate Data Collection with Danish Abstracts
 The Faroe Islands - DMI Historical Climate Data Collection 1873-2011 -with Danish Abstracts John Cappelen (ed) Copenhagen 2012 www.dmi.dk/dmi/tr12-05 page 1 of 34 Colophon Serial title: Technical Report
A Report on a Statistical Model to Forecast Seasonal Inflows to Cowichan Lake
 A Report on a Statistical Model to Forecast Seasonal Inflows to Cowichan Lake Prepared by: Allan Chapman, MSc, PGeo Hydrologist, Chapman Geoscience Ltd., and Former Head, BC River Forecast Centre Victoria
UWM Field Station meteorological data
 University of Wisconsin Milwaukee UWM Digital Commons Field Station Bulletins UWM Field Station Spring 992 UWM Field Station meteorological data James W. Popp University of Wisconsin - Milwaukee Follow
Technical Report The Faroe Islands - DMI Historical Climate Data Collection with Danish Abstracts
 The Faroe Islands - DMI Historical Climate Data Collection 1873-2014 -with Danish Abstracts John Cappelen (ed) Copenhagen 2015 http://www.dmi.dk/fileadmin/rapporter/tr/tr15-05 page 1 of 43 Colophon Serial
Causes of high PM 10 values measured in Denmark in 2006
 Causes of high PM 1 values measured in Denmark in 26 Peter Wåhlin and Finn Palmgren Department of Atmospheric Environment National Environmental Research Institute Århus University Denmark Prepared 2 October
Location. Datum. Survey. information. Etrometa. Step Gauge. Description. relative to Herne Bay is -2.72m. The site new level.
 Tide Gauge Location OS: 616895E 169377N WGS84: Latitude: 51 o 22.919196 N Longitude: 01 o 6.9335907 E Instrument Type Etrometa Step Gauge Benchmarks Benchmark TGBM = 5.524m above Ordnance Datum Newlyn
A Note on the Correctness of Precipitation in the Danish Climate Model
 A Note on the Correctness of Precipitation in the Danish Climate Model Shuting Yang Copenhagen 2005 www.dmi.dk/dmi/dkc05-05 page 1 of 10 Colophon Serial title: Danish Climate Centre Report 05-05 Title: