DMI Report Weather observations from Greenland Observation data with description
|
|
|
- Helena Nichols
- 6 years ago
- Views:
Transcription
 Copenhagen 2017 http://www.dmi.")
1 DMI Report Weather observations from Greenland Observation data with description John Cappelen (ed) Copenhagen page 1 of 31
2 Colophon Serial title: DMI Report Title: Weather observations from Greenland Subtitle: Observation data with description Author(s): John Cappelen (ed) Other contributors: Ellen Vaarby Laursen, Claus Kern-Hansen, Laust Boas, Peter Grunnet Wang, Bent Vraa Jørgensen, Lone Seir Carstensen Responsible institution: Danish Meteorological Institute Language: English Keywords: Greenland, weather observations, wind, temperature, cloud cover, air pressure, humidity, precipitation, depth of snow, , Greenland dataset, quality control URL: ISSN: (online) Version: 24 February 2017 Website: Copyright: Danish Meteorological Institute Application and publication of data is allowed with proper reference and acknowledgment Front page: Lake near Tasiilaq, August Photo: John Cappelen page 2 of 31
3 Content Abstract... 4 Resumé Introduction Description of the data Synoptic stations Manual precipitation stations Stations and data series Data format Data format Differences between old and new data format References Previous reports Appendix 1 Station details Appendix 2 Overview of data series page 3 of 31
4 Abstract The purpose of this report is to present DMI Greenlandic weather observations that are accessible to the public. Data series from 89 stations are attached as separated files. Resumé Formålet med denne rapport er at præsentere DMI grønlandske vejrobservationer som er tilgængelige for offentligheden. Dataserier fra 89 stationer er vedhæftede som individuelle filer. page 4 of 31
5 1. Introduction The Danish Meteorological Institute has previously published a series of DMI Technical Reports, the latest Technical Report [2], containing a description of Greenlandic weather observations from 1958 to Large parts of this dataset have primarily been used for research and educational purposes and as background for data analysis as in Greenland climatological standard normal (DMI Technical Report [1]). By publishing DMI Technical Report [3] the Greenlandic weather observation datasets in the period for the first time became accessible to the public. At the same time a comprehensive quality control was applied to the whole dataset and erroneous data were removed. This quality control was described in DMI Technical Report [4]. It must be stressed that the data series in question not at all have been tested for homogeneity nor homogenized. This new procedure introduced in DMI Technical Reports and has been followed by updates every year since, the latest DMI Technical Reports with data up to 2013 [5]. Because of a new data structure, that DMI introduced in 2014, the data from 2014 was processed in a new format and DMI Technical Reports with data up to 2013 then finished the old data format. The new data format was for the first time introduced in DMI Technical Reports [6]. The purpose of this DMI report is to update the Greenlandic weather observation datasets with quality controlled 2016 data in the new data format, but also include the old data format from A description of both data formats is included. It is up to the users of the data to compile the two data sets. The data series have variable length and characteristics depending on type of station, parameter and many other factors. 88 Greenlandic stations with up to 10 parameters are included in the old dataset. 47 stations with up to 17 parameters are included in the new dataset. A similar report with weather observations from Tórshavn, The Faroe Islands can be found in DMI Report [7]. page 5 of 31
6 2. Description of the data 2.1 Synoptic stations Synoptic stations in Greenland have been operated with different degrees of automation over time which has had consequences for the way parameters are observed and for the quality of data series. Furthermore, some stations in remote areas are unmanned, meaning that maintenance and calibration often are done with long intervals (at least a year). Time stamps All stations included in the dataset are synoptic stations except five manual precipitation stations, see section 2.2. Synoptic stations (or SYNOP-station) all over the world should at least follow a 3- hour interval (00, 03, 06, 09, 12, 15, 18 and 21 hours UTC). Since 1996, Greenland stations (not all from 1996) started with 1-hour observations (every whole hour UTC). Recently some stations also started with observations every 10 minutes, but this report only includes hourly observations. Synoptic stations always follow the same guidelines 1. In Appendix 2 it is indicated, which DMI Greenlandic observations are 3-hourly or 1-hourly. Parameters A synoptic station should observe as standard weather, cloud cover, visibility, snow cover, air temperature, relative humidity, wind, air pressure and precipitation. The selected parameters in the DMI Greenlandic datasets are given in table 1, 2, 3 and 4. Station identification The official WMO station identifiers describing synoptic stations in Greenland consist of 5 digits, always starting with 04. However, in the old data series the in front 0 is omitted, giving 4 digits i.e for Nuuk. In the new data format 00 is added to all station identifiers, so they consist of 6 digits i.e for Nuuk. 2.2 Manual precipitation stations There are five manual precipitation stations in Greenland still operating. Time stamps The five remaining manual precipitation stations observe 12 hours UTC, covering the previous 24 hours Nuuk observed 21 hours UTC. It was closed 1 September Parameters A manual precipitation station only measures daily accumulated precipitation (could cover more than 24 hours; i.e. 48, 72, 120 etc. if accumulated over several days). The parameters in the daily precipitation datasets are given in table 2 and 4. Station identification The national station identifiers describing manual precipitation stations in Greenland consist of 5 digits, always starting with 34. In the new data format 50 is added to the station identifiers, so they consist of 7 digits i.e for Sisimiut. 1 See more at page 6 of 31
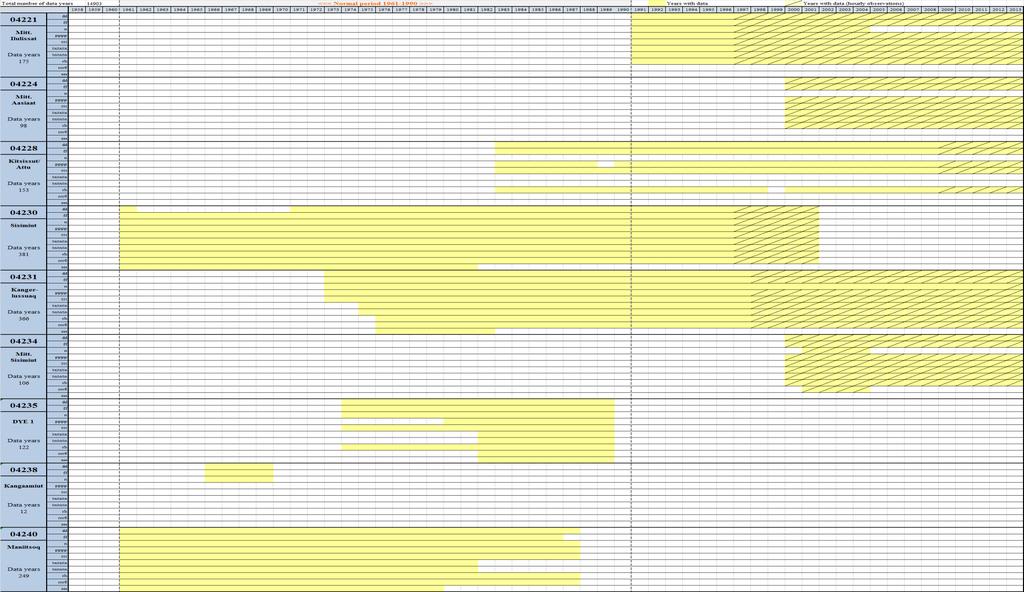
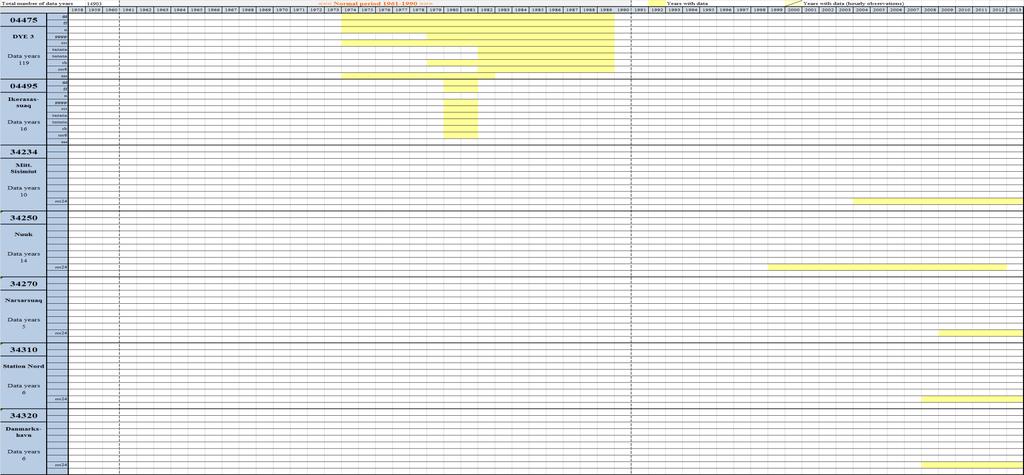
7 2.3 Stations and data series As seen in figure 1 and 2 the stations are scattered across Greenland, although most stations are located in the more populated southern Greenland. Furthermore, most stations are coastal or nearcoastal stations and only a few stations are located on the ice cap. The 89 stations and their coordinates are furthermore listed in appendix 1. The length of the data series varies significantly within and between stations depending on location and type of station. A complete visual overview of all old data series can be seen in appendix 2, where all 88 stations in this dataset are shown with data series length. One cell equals one data year. A data year is one year in one data series for one parameter, so the total number of data years is the length of all data series aggregated. The number of data years for each station is shown below the station name. The overall total number of data years for the whole dataset is shown in the left upper corner of the overview. Please notice that each cell represents one year of data regardless of the amount of data in this year. Hence data years do not necessarily correspond to a calendar year of data. The old data series are identical to the ones in DMI Technical Report [5]. Please notice, that compared to earlier published similar datasets, minor changes may be found. This can be related to the ongoing quality control of data. The new data series from 2014 have no similar visual overview. All stations still operating have ideally all data connected to the specific type of station with few exceptions (see table also 3, 4 and Appendix 1): V98 (Weather Station 1998); 8 stations) is an automatic station with hourly data (basically 10 min data) for all temperature parameters (101,112,113,122,123), relative humidity (201), all wind parameters (301,305,365,371; six stations), atmospheric air pressure (401), sunshine duration (504; six stations), radiation (550, six stations), precipitation (601,603,609; five stations) and cloud cover (801; six stations). Sampling continuously. SAVS (Semi-Automatic Weather Station; airports; 18 stations) is an semi-automatic station with hourly data for drybulb and mean temperature (101), 12 hours max./min. temperatures (113,123), relative humidity (201), atmospheric air pressure (401), all wind parameters (301,305, 365, 371), precipitation (603; one station) and cloud cover (801; ten stations). Sampling continuously. GIWS (Greenland Isolated Weather Station; 16 stations) is an automatic station with hourly data for drybulb temperature (101), relative humidity (201), wind speed and direction (301,365) and atmospheric air pressure (401). Sampling 10 minutes every hour. ARGOS (Worldwide tracking and environmental monitoring by satellite ARGOS; 1 station) is an automatic station with 3-hourly data for drybulb temperature (101), relative humidity (201), wind speed and direction (301,365) and atmospheric air pressure at station level. Sampling 10 minutes every hour. Hellman (Hellman rain gauge; 5 stations (+1 Kangerlussuaq) is a manual precipitation station with 24-hourly data of accumulated precipitation (601)/Kangerlussuaq (609) from 2016). page 7 of 31

8 Figure 1. Station positions, Greenland. The section marked is enlarged in figure 2 (graphics M. Scharling). More explanations can be seen in the figure 2 caption. page 8 of 31

9 Figure 2. Station positions, Southern Greenland. See figure 1 for a map of Greenland as a whole (graphics M. Scharling). The official WMO station identifier for Greenland consist of 5 digits 04xxx.On the map the station identifiers 04xxx are used. The national station identifiers describing manual precipitation stations in Greenland consist of 5 digits 34xxxx, also used on the map. These identifiers with five digits are used in the old data sets before 2014, where the in front 0 is omitted i.e for Nuuk. In the new data sets 00 is added to all station identifiers, so they consist of 6 digits i.e for Nuuk. Concerning the national station identifiers 50 is added to the station identifiers in the new data sets, so they consist of 7 digits i.e for Sisimiut. page 9 of 31
10 3. Data format The old data series are available as tabulator separated txt-files and are found in one ZIPcompressed file DMIRep17-08_old_dataformat_1958_2013.zip attached to this report. The ZIP-file contains 88 txt-files each representing all data from one station. Time stamps are given in UTC. Each parameter in the txt-files has a header, which is described in table 1 and 2. Parameter stat_no year month day hour dd ff n pppp Description Headers in synoptic data series-files 4 digit station number, all in the format 4xxx Year of observation Month of observation Day of observation Hour of observation (UTC) Mean wind direction over the 10-minute period preceding the observation. In 1 or 10- degree intervals. 0 applies to calms. 990 applies to variable wind directions Mean wind speed (0.1 m/s ) over the 10-minute period preceding the observation Cloud cover (octas; 0/8 clear sky -> 8/8 overcast). 9 apply to obscured sky, due to fog or heavy snow, and therefore no available observation Air pressure (0.1 hpa ) at mean sea level ttt Dry bulb temperature (0.1 C) txtxtx Absolute maximum temperature (0.1 C). Observation period depends on the interval of SYNOP time intervals, normally 12 hours at 6 and 18 hours UTC tntntn Absolute minimum temperature (0.1 C). Observation period depends on the interval of SYNOP time intervals, normally 12 hours at 6 and 18 hours UTC rh Relative humidity (%) 6, 12 or 24 hours accumulated precipitation (0.1 mm). -1 applies to more than 0 mm, rrr6 but less than 0.1 mm. Normally 6 and 18 hours UTC cover 12 hours; 0 and 12 hours UTC cover 6 hours. If there is only one observation every day it is expected to cover 24 hours sss Snow depth (cm). 997 applies to less than 0.5 cm. 998 applies to snow cover not continuous Table 1. Description of parameters in the synoptic data series (old data format). Resolution 1 to 24 hours. Parameters given in values (ff, pppp, ttt, txtxtx, tntntn, rrr6) are to be divided with 10 to obtain the actual value. Remember that in order to obtain i.e. daily acc. precipitation, you cannot just add precipitation using the observations at 0, 6, 12 and 18 hours UTC. The precipitation at 0 and 12 hours UTC cover 6 hours; precipitation at 6 and 18 hours UTC cover 12 hours and therefore the precipitation at 0 and 12 hours UTC are imbedded in the precipitation at 6 and 18 hours UTC. page 10 of 31
11 Parameter stat_no year month day hour rrr24 tr Description Headers in manual precipitation data series-files 5 digit station number, all in the format 34xxx Year of observation Month of observation Day of observation Hour of observation (UTC) 24 hours (or more) accumulated precipitation (0.1 mm). -1 applies to more than 0 mm, but less than 0.1 mm Period covered in rrr24 (hours). Could be more than 24 hours i.e. 48, 76 hours etc. Table 2. Description of parameters in the manual precipitation data series (old data format). Resolution 24 hours (or more indicated by tr). Parameter given in value (rrr24) are to be divided with 10 to obtain the actual value. page 11 of 31
12 4. Data format The new data series are available as csv-files (; separated) and are found in one ZIPcompressed file DMIRep17-08_new_dataformat_2014_2016.zip attached to this report. The ZIPfile contains 47 files each representing all data from one station. The time stamps are given in UTC time. Each parameter in the csv-files has a header, which is described in table 3 and 4. Parameter Station year month day Description Headers in synoptic data series-files 6 digit station number, all in the format 4xxx00 Year of observation Month of observation Day of observation hour (utc) Hour of observation (UTC) Mean air temperature ( C; 2 metres above ground). Mean of drybulb temperatures last 101 hour. If not available, drybulb temperature ( C); minute = 0. Time resolution 1 or 3 hours. 1 hour. V98, SAVS, GIWS. 3 hours; one station; ARGOS; Summit. 112 Absolute maximum temperature ( C; 2 metres above ground). Absolute maximum temperature last hour. V Absolute maximum temperature ( C; 2 metres above ground). Absolute maximum temperature last 12 hours. V98, SAVS. 122 Absolute minimum temperature ( C; 2 metres above ground). Absolute minimum temperature last hour. V Absolute minimum temperature ( C; 2 metres above ground). Absolute minimum temperature last 12 hours. V98, SAVS. Mean relative humidity (%). Mean of relative humidity last hour. If not available, relative 201 humidity; minute = 0. Time resolution 1 or 3 hours. 1 hour. V98, SAVS, GIWS. 3 hours; one station; ARGOS; Summit. Mean wind speed (m/s; 10 metres above ground) observed last 10 min; minute = Time resolution 1 or 3 hours. 1 hour. V98, SAVS, GIWS. 3 hours; one station; ARGOS; Summit. 305 Highest 3 sec. wind speed (m/s; 10 metres above ground) last hour. If not available, highest 3 sec. wind speed (m/s) observed last 10 min. V98, SAVS, GIWS. Mean wind direction (degrees; 10 metres above ground) observed last 10 min; minute 365 = 0. 0 applies to calms. Time resolution 1 or 3 hours. 1 hour. V98, SAVS, GIWS. 3 hours; one station; ARGOS; Summit. Mean wind direction (degrees; 10 metres above ground). Mean of wind direction last 371 hour. If not available, mean wind direction (degrees) observed last 10 min. 0 applies to calms. Time resolution 1 or 3 hours. 1 hour. V98, SAVS, GIWS. 3 hours; one station; ARGOS; Summit. 401 Air pressure (hpa) at mean sea level; minute = 0. V98, SAVS, GIWS. 504 Accumulated sunshine duration (hours) last hour. Six stations. V98; Aasiaat, Nuuk, Narsarsuaq Radiosonde, Tasiilaq, Illoqoortoormiit, Danmarkshavn.* 550 Mean incoming (global) radiation (W/m 2 ) last hour. Six stations. V98; Aasiaat, Nuuk, Narsarsuaq Radiosonde, Tasiilaq, Illoqoortoormiit, Danmarkshavn. 601 Accumulated precipitation (mm; about 3 metres above ground) last hour. V98. ** 603 Accumulated precipitation (mm; about 3 metres above ground) last 12 hours. V98. One station; Hellman; Kangerlussuaq.** 609 Accumulated precipitation (mm; about 3 metres above ground) last 24 hours. V98. One station; Hellman; Kangerlussuaq. ** page 12 of 31
13 801 Cloud cover (%); minute = 0. Observations of obscured sky are converted to overcast if possible using additional weather information, otherwise cloud cover is missing. Six stations. V98; Aasiaat, Nuuk, Qaqortoq, Tasiilaq, Illoqoortoormiit, Danmarkshavn. Ten stations; SAVS; Mitt. Ilulissat, Mitt. Aasiaat, Kangerlussuaq, Mitt. Sisimiut, Mitt. Maniitsoq, Mitt. Nuuk, Mitt. Paamiut, Mitt. Narsarsuaq, Mitt. Kulusuk, Mitt. Nerlerit Inaat. *** Table 3. Description of parameters in the synoptic data series (new data format). Resolution from 1 to 24 hours. All parameters given with one decimal except 201, 365, 371, 550 and 801. *Six V98 pyranometers have permanent problems with the calculation of sunshine duration: Aasiaat, Nuuk, Narsarsuaq Radiosonde, Danmarkshavn, Illoqoortoormiit, Tasiilaq. For that reason permanently excluded. ** Five Hellman manual stations observe 24-hours accumulated precipitation giving 24-hours daily values; parameter 601; Sisimiut, Narsarsuaq, Station Nord, Danmarkshavn and Illoqoortoormiit; see table 4. One SAVS station (Kangerlussuaq) has observed 12 hours accumulated precipitation which has been reported as 12 hours values 6 and 18 UTC; parameter 603.In 2016 Kangerlussuaq this practice changed to 24-hours accumulated precipitation giving 24-hours daily values; parameter 609. The V98 automatic rain gauges in Greenland can occasionally have technical problems: Aasiaat, Nuuk, Qaqortoq, Pr, Chr. Sund and Tasiilaq. For that reason the rain data are excluded in these periods. ***Eight SAVS ceilometers have permanent problems with cloud cover measurements (clear sky not reported): Mitt. Ilulissat, Mitt. Aasiaat, Mitt. Sisimiut, Mitt. Maniitsoq, Mitt. Nuuk, Mitt. Paamiut, Mitt. Narsarsuaq, Mitt. Nerlerit Inaat. For that reason permanently excluded. Parameter Station year month day 601 pc Headers in manual precipitation data series-files Description 7 digit station number, all in the format 34xxx50 Year of observation Month of observation Day of observation 24-hours (or more) accumulated precipitation (mm). Five stations; Hellman; Sisimiut, Narsarsuaq, Station Nord, Danmarkshavn, Illoqoortoormiit Period covered in 601 (hours). Could be more than 24 hours i.e. 48, 76 hours etc. Table 4. Description of parameters in the manual precipitation data series. Resolution 24 hours (or more indicated by pc). Parameter (601) given with one decimal. page 13 of 31
14 5. Differences between old and new data format In the table below differences between parameters in the old and new data format can be seen. See also table 1, 2, 3 and 4. Parameter Data description Data description ttt/101 Drybulb temperature (0.1 C) 2 m above ground. Observed minute = 0. Time resolution 1, 3 or more hours. Mean air temperature ( C; 2 m above ground). Mean of drybulb temperatures last hour. If not available, drybulb temperature ( C) observed minute = 0. Time resolution 1 or 3 hours. 1 hour. V98, SAVS, GIWS. 3 hours; one station; ARGOS; Summit. /112 NA Absolute maximum temperature ( C; 2 m above ground). Absolute maximum temperature last hour. V98. txtxtx/113 Absolute maximum temperature (0.1 C) 2 m above ground. Observation period depends on the interval of SYNOP time intervals, normally 12 hours at 6 and 18 hours UTC. Absolute maximum temperature ( C; 2 m above ground). Absolute maximum temperature last 12 hours. V98, SAVS. /122 NA Absolute minimum temperature ( C; 2 m above ground). Absolute minimum temperature last hour. V98. tntntn/123 Absolute minimum temperature (0.1 C) 2 m above ground. Observation period depends on the interval of SYNOP time intervals, normally 12 hours at 6 and 18 hours UTC. rh/201 Relative humidity (%). Observed minute = 0. Time resolution 1, 3 or more hours. ff/301 Mean wind speed (0.1 m/s) over the 10- minute period preceding the observation. Absolute minimum temperature ( C; 2 m above ground). Absolute minimum temperature last 12 hours. V98, SAVS. Mean relative humidity (%). Mean of relative humidity last hour. If not available, relative humidity observed minute = 0. Time resolution 1 or 3 hours. 1 hour. V98, SAVS, GIWS. 3 hours; one station; ARGOS; Summit. Mean wind speed (m/s; 10 m above ground) observed last 10 min.; minute = 0. Time resolution 1 or 3 hours. 1 hour. V98, SAVS, GIWS. 3 hours; one station; ARGOS; Summit. /305 NA Highest 3 sec. wind speed (m/s; 10 m above ground) last hour. If not available, highest 3 sec. wind speed (m/s) observed last 10 min. V98, SAVS, GIWS). dd/365 Mean wind direction (degrees) over the 10- minute period preceding the observation. In 1 or 10-degree intervals. 0 applies to calms. 990 applies to variable wind directions Mean wind direction (degrees; 10 m above ground) observed last 10 min.; minute = 0. 0 applies to calms. Time resolution 1 or 3 hours. 1 hour. V98, SAVS, GIWS. 3 hours; one station; ARGOS; Summit. /371 NA Mean wind direction (degrees; 10 m above ground). Mean of wind direction last hour. If not available, mean wind direction (degrees) observed last 10 min. 0 applies to calms. Time resolution 1 or 3 hours. 1 hour. V98, SAVS, GIWS. 3 hours; one station; ARGOS; Summit. pppp/401 Air pressure (0.1 hpa) at mean sea level. Time resolution 1, 3 or more hours. Air pressure (hpa) at mean sea level; minute = 0. V98, SAVS, GIWS. /504 NA Accumulated sunshine duration (hours) last hour. Six stations. V98; Aasiaat, Nuuk, Narsarsuaq Radiosonde, Tasiilaq, Illoqoortoormiit, Danmarkshavn.* /550 NA Mean incoming (global) radiation (W/m 2 ) last page 14 of 31
15 hour. Six stations. V98; Aasiaat, Nuuk, Narsarsuaq Radiosonde, Tasiilaq, Illoqoortoormiit, Danmarkshavn. /601 NA Accumulated precipitation (mm; about 3 m above ground) last hour. V98 ** rrr6***/603 rrr6***/609 rrr24/601 tr/pc 6, 12, 18 or 24*** hours accumulated precipitation (0.1 mm). -1 applies to more than 0 mm, but less than 0.1 mm. Normally 6 and 18 hours UTC cover 12 hours; 0 and 12 hours UTC cover 6 hours. If there is only one observation every day it is expected to cover 24 hours. 6, 12, 18 or 24*** hours accumulated precipitation (0.1 mm). -1 applies to more than 0 mm, but less than 0.1 mm. Normally 6 and 18 hours UTC cover 12 hours; 0 and 12 hours UTC cover 6 hours. If there is only one observation every day it is expected to cover 24 hours. 24 hours (or more) accumulated precipitation (0.1 mm). -1 applies to more than 0 mm, but less than 0.1 mm.**** Period covered in rrr24 (hours). Could be more than 24 hours i.e. 48, 76 hours etc.**** n/801 Cloud cover in octas (0/8 clear sky, 8/8 overcast). 9 apply to obscured sky, due to fog or heavy snow, and therefore no available observation.***** sss Snow depth (cm). 997 applies to less than 0.5 cm. 998 applies to snow cover not continuous.****** Accumulated precipitation (mm; about 3 m above ground) last 12 hours. V98**. One station; Hellman; Kangerlussuaq. Accumulated precipitation (mm; about 3 m above ground) last 24 hours. V98**. One station; Hellman; Kangerlussuaq. 24-hours (or more) accumulated precipitation (mm). Five stations; Hellman; Sisimiut, Narsarsuaq, Station Nord, Danmarkshavn, Ittoqqortoormiit**** Period covered in 601 (hours). Could be more than 24 hours i.e. 48, 76 hours etc. Five stations; Hellman; Sisimiut, Narsarsuaq, Station Nord, Danmarkshavn, Ittoqqortoormiit**** Cloud cover (%); minute = 0. Observations of obscured sky are converted to overcast if possible using additional weather information, otherwise cloud cover is missing. Six stations. V98; Aasiaat, Nuuk, Qaqortoq, Tasiilaq, Illoqoortoormiit, Danmarkshavn. Ten stations; SAVS; Mitt. Ilulissat, Mitt. Aasiaat, Kangerlussuaq, Mitt. Sisimiut, Mitt. Maniitsoq, Mitt. Nuuk, Mitt. Paamiut, Mitt. Narsarsuaq, Mitt. Kulusuk, Mitt. Nerlerit Inaat. ***** NA****** Table 5. Differences between the old and new data format. * Six V98 pyranometers have permanent problems with the calculation of sunshine duration: Aasiaat, Nuuk, Narsarsuaq Radiosonde, Danmarkshavn, Illoqoortoormiit, Tasiilaq. For that reason permanently excluded. ** The V98 automatic rain gauges in Greenland can occasionally have technical problems: Aasiaat, Nuuk, Qaqortoq, Pr, Chr. Sund and Tasiilaq. For that reason the rain data are excluded in these periods. *** When stations were manually operated back in time both 6 hours, 12, 18 and 24 hours acc. precipitation could occur in parameter rrr6. At automatic DMI stations normally accumulated precipitation at 6 and 18 hours UTC cover 12 hours in parameter rrr6; 0 and 12 hours UTC cover 6 hours in parameter rrr6. **** Five DMI stations have manually observed 24-hours accumulated precipitation, which in a special file can be seen as daily values (or covering more days indicated by pc); parameter 601; Sisimiut, Narsarsuaq, Station Nord, Danmarkshavn and Illoqoortoormiit. One other station also (from 2016) has manually 24-hours accumulated precipitation; parameter 609; Kangerlussuaq. ***** Eight SAVS ceilometers have permanent problems with cloud cover measurements (clear sky not reported): Mitt. Ilulissat, Mitt. Aasiaat, Mitt. Sisimiut, Mitt. Maniitsoq, Mitt. Nuuk, Mitt. Paamiut, Mitt. Narsarsuaq, Mitt. Nerlerit Inaat. For that reason permanently excluded. ****** Snow observations not a part of the observation plan in Greenland the last at least 10 years. Parameter not defined in the new data format. page 15 of 31
16 References [1] Cappelen, J., Jørgensen, B.V., Laursen, E.L., Stannius, L.S., Thomsen, R.S. (2001): The Observed Climate of Greenland, with Climatological Standard Normals, DMI Technical Report Danish Meteorological Institute. Copenhagen. [2] Carstensen, L.S., and Jørgensen, B.V. (2011): Weather and Climate Data from Greenland Dataset available for research and educational purposes. DMI Technical Report Danish Meteorological Institute. Copenhagen. [3] Boas, L. and Wang, P.G. (2011): Weather and climate data from Greenland Observation data with description. DMI Technical Report Danish Meteorological Institute. Copenhagen. [4] Boas, L. and Wang, P.G. (2011): Quality control of Greenlandic weather and climate data series supplement to TR DMI Technical Report Danish Meteorological Institute. Copenhagen. [5] Cappelen, J. (ed), (2014): Weather observations from Greenland Observation data with description. DMI Technical Rapport Danish Meteorological Institute. Copenhagen. [6] Cappelen, J. (ed), (2015): Weather observations from Greenland Observation data with description. DMI Technical Rapport Danish Meteorological Institute. Copenhagen. [7] Cappelen, J. (ed) (2017): Weather observations from Tórshavn Observation data with description. DMI Report Danish Meteorological Institute. Copenhagen. Previous reports Previous reports from the Danish Meteorological Institute can be found on: page 16 of 31
17 Appendix 1 Station details Owner: DMI: Danish Meteorological Institute. MIT: Mittarfeqarfiit (Greenland Airports) before GLV: Greenland Airport Authority. SLV: Denmark Airport Authority. USAF: US Air Force. GTO: Greenland s Technical Organization. LORAN: US Navigation system. Owner/type Time of operation Latitude N Longitude W Elevation start stop degrees minute degrees minute m.a.s Dundas DUNDAS RADIO Qaanaaq DMI Pituffik USAF Kitsissut DMI/GIWS Qaanaaq DMI Mitt. Qaanaaq MIT/SAVS Hall Land DMI Kitsissorsuit DMI/GIWS Upernavik AWS DMI Upernavik DMI Upernavik Mitt. Upernavik MIT/SAVS Uummannaq DMI Uummannaq Heli. MIT Mitt. Qaarsut DMI MIT/GIWS Qullitsat DMI/GIWS Nuussuaq Ilulissat DMI Qasigiannguit DMI Qasigiannguit Heli. MIT/SAVS Qeqertarsuaq DMI Qeqertarsuaq Heli. MIT/SAVS Aasiaat DMI/V Mitt. Ilulissat MIT/SAVS Mitt. Aasiaat MIT/SAVS Kitsissut/Attu DMI/GIWS Sisimiut DMI Kangerlussuaq DMI/SAVS Mitt. Sisimiut MIT/SAVS Dye 1 USAF Kangaamiut DMI page 17 of 31
18 Owner: DMI: Danish Meteorological Institute. MIT: Mittarfeqarfiit (Greenland Airports) before GLV: Greenland Airport Authority. SLV: Denmark Airport Authority. USAF: US Air Force. GTO: Greenland s Technical Organization. LORAN: US Navigation system. Owner/type Time of operation Latitude N Longitude W Elevation start stop degrees minute degrees minute m.a.s Maniitsoq DMI Mitt. Maniitsoq MIT/SAVS Sioralik DMI/GIWS Atammik DMI Qoornoq DMI Kapisillit DMI Nuuk DMI/V Kitsissut DMI Kangerluarsoruseq DMI Ukiivik DMI/GIWS Qeqertarsuatsiaat DMI Mitt. Nuuk MIT/SAVS Paamiut DMI Paamiut Heliport DMI Mitt. Paamiut MIT/SAVS Kangilinnguit DMI Arsuk DMI Narsalik DMI Nunarsuit DMI/GIWS Mitt. Narsarsuaq MIT/SAVS Narsarsuaq Radisonde DMI/V Qaqortoq DMI/V Qaqortoq Heliport MIT/SAVS Qassimiut DMI Narsaq DMI Narsaq Heliport MIT/SAVS Alluitsup PAA Helip. MIT Nanortalik DMI Nanortalik Heliport MIT/SAVS Angissoq DMI/GIWS Narsaq Kujalleq DMI page 18 of 31
19 Owner: DMI: Danish Meteorological Institute. MIT: Mittarfeqarfiit (Greenland Airports) before GLV: Greenland Airport Authority. SLV: Denmark Airport Authority. USAF: US Air Force. GTO: Greenland s Technical Organization. LORAN: US Navigation system. Owner/type Time of operation Latitude N Longitude W Elevation start stop degrees minute degrees minute m.a.s Kap Morris Jesup DMI/GIWS Kap Harald Moltke DMI Station Nord DMI Station Nord AWS DMI/GIWS Henrik Krøyer Holme DMI/GIWS Danmarkshavn DMI/V Daneborg DMI/GIWS Mestersvig SLV Ittoqqortoormiit DMI/V Uunarteq DMI Mitt. Nerlerit Inaat MIT/SAVS Jameson Land DMI Aputiteeq DMI Aputiteeq DMI/GIWS Aputiteeq DMI Tasiilaq DMI/V Mitt. Kulusuk MIT/SAVS DYE 4 USAF Orsuiagssuaq LORAN STATION Ikermit DMI/GIWS Timmiarmiut DMI/GTO (TELE) Ikermiuarsuk DMI Ikermiuarsuk DMI/GIWS Qulleq LORAN STATION Ikerasassuaq DMI/V Renland DMI Summit DMI Summit DMI/ARGOS page 19 of 31
20 Owner: DMI: Danish Meteorological Institute. MIT: Mittarfeqarfiit (Greenland Airports) before GLV: Greenland Airport Authority. SLV: Denmark Airport Authority. USAF: US Air Force. GTO: Greenland s Technical Organization. LORAN: US Navigation system. Owner/type Time of operation Latitude N Longitude W Elevation start stop degrees minute degrees minute m.a.s DYE 2 USAF DYE 3 USAF Ikerasassuaq DMI Mitt. Sisimiut DMI/Hellman Nuuk DMI/Hellman Narsarsuaq DMI/Hellman Station Nord DMI/Hellman Danmarkshavn DMI/Hellman Ittoqqortoormiit DMI/Hellman page 20 of 31
21 Appendix 2 Overview of data series page 21 of 31
22 page 22 of 31
23 page 23 of 31
24 page 24 of 31
25 page 25 of 31
26 page 26 of 31
27 page 27 of 31
28 page 28 of 31
29 page 29 of 31
30 page 30 of 31
31 page 31 of 31
Weather observations from Tórshavn, The Faroe Islands
 Weather observations from Tórshavn, The Faroe Islands 1953-2014 - Observation data with description John Cappelen Copenhagen 2015 http://www.dmi.dk/fileadmin/rapporter/tr/tr15-09 page 1 of 14 Colophon
DMI Report Weather observations from Tórshavn, The Faroe Islands Observation data with description
 DMI Report 17-09 Weather observations from Tórshavn, The Faroe Islands 1953-2016 - Observation data with description John Cappelen Copenhagen 2017 http://www.dmi.dk/laer-om/generelt/dmi-publikationer/
control of. Quality. Laust. sholm Wang. Copenhagen. page 1 of 14
 Technical Report 11-16 Quality control of Greenlandic weather and climate data series 1958-2010 Supplement to Technical Report 11-15 Laust Boas and Peter Ridders sholm Wang Copenhagen 2011 page 1 of 14
København, Denmark John Cappelen. Copenhagen page 1 of 32
 Precipitation (mm) Sunshine (hours) DMI Report 18-19 Climatological Standard Normals - Denmark, The Faroe Islands and Greenland - Based on Data Published in DMI Reports 18-02, 18-04 and 18-05 John Cappelen
Technical Report DMI SYNOP AWS Summit. Data status March Ellen Vaarby Laursen. SYNOP weather station Summit.
 10-09 DMI SYNOP AWS 04416 Summit. Data status March 2010. Ellen Vaarby Laursen SYNOP weather station 04416 Summit Picture Taken: 2007:06:20 16:16:11 Picture Taken: 2009:07:09 08:22:51 Copenhagen 2010 www.dmi.dk/dmi/tr
Technical Report World Weather Records and Denmark, The Faroe Islands and Greenland
 World Weather Records 1991-2000 and 2001-2010 - Denmark, The Faroe Islands and Greenland John Cappelen Copenhagen 2014 http://www.dmi.dk/fileadmin/rapporter/tr/tr14-10 page 1 of 19 Colophon Serial title:
Sea Level data from 14 stations in Denmark
 Report 18-16 Sea Level data 1889 2017 from 14 stations in Denmark Mean, maximum and minimum values calculated on monthly and yearly basis including plots mean values Lonny Hansen Copenhagen 2018 www.dmi.dk
Technical Report Hourly values of sea level observations from two stations in Denmark. Hornbæk and Gedser
 Hourly values of sea level observations from two stations in Denmark. Hornbæk 1890-2005 and Gedser 1891-2005 Lonny Hansen Copenhagen 2007 www.dmi.dk/dmi/tr07-09 page 1 of 12 Colophon Serial title: Technical
Table 1-2. TMY3 data header (line 2) 1-68 Data field name and units (abbreviation or mnemonic)
 1-68 Data field name and units (abbreviation or mnemonic)") 1.4 TMY3 Data Format The format for the TMY3 data is radically different from the TMY and TMY2 data.. The older TMY data sets used columnar or positional formats, presumably as a method of optimizing data
1.4 TMY3 Data Format The format for the TMY3 data is radically different from the TMY and TMY2 data.. The older TMY data sets used columnar or positional formats, presumably as a method of optimizing data
DMI Report Denmark - DMI Historical Climate Data Collection
 1873 1883 1893 1903 1913 1923 1933 1943 1953 1963 1973 1983 1993 2003 2013 Temperature anomaly C DMI Report 17-02 Denmark - DMI Historical Climate Data Collection 1768-2016 John Cappelen (ed) 3 2 Denmark
Road Weather Modelling System: Verification for Road Weather Season
 Road Weather Modelling System: Verification for 2009-2010 Road Weather Season Claus Petersen, Alexander Mahura, Bent Sass Copenhagen 2010 www.dmi.dk/dmi/tr10-12.pdf page 1 of 20 Colophon Serial title:
DMI Report The Faroe Islands - DMI Historical Climate Data Collection
 DMI Report 17-05 The Faroe Islands - DMI Historical Climate Data Collection 1873-2016 John Cappelen (ed) Copenhagen 2017 http://www.dmi.dk/laer-om/generelt/dmi-publikationer/ page 1 of 37 Colophon Serial
Plot manual. Synop of a landstation The basic form of the SYNOP bulletin for a landstation is: Plotmanual 1
 Plotmanual 1 Plot manual Introduction Meteorological bulletins are distributed worldwide and must be readable by persons have all nationalities and backgrounds. That is one of the reasons these bulletins
London Heathrow Field Site Metadata
 London Heathrow Field Site Metadata Field Site Information Name: Heathrow src_id (Station ID number): 708 Geographic Area: Greater London Latitude (decimal ): 51.479 Longitude (decimal ): -0.449 OS Grid
Technical Report Road Weather Modelling System: Verification for Road Weather Season. Claus Petersen, Alexander Mahura, Bent Sass
 Technical Report 09-10 Road Weather Modelling System: Verification for 2008-2009 Road Weather Season Claus Petersen, Alexander Mahura, Bent Sass www.dmi.dk/dmi/tr09-10 Copenhagen 2009 page 1 of 20 Colophon
Road Weather Modelling System: Verification for Road Weather Season
 Road Weather Modelling System: Verification for 2007-2008 Road Weather Season Claus Petersen, Alexander Mahura, Bent Sass, Torben Pedersen Copenhagen 2008 www.dmi.dk/dmi/tr08-09 page 1 of 14 Colophon Serial
Danish Design Reference Year Grunnet Wang, Peter; Scharling, Mikael; Pagh Nielsen, Kristian; Kern-Hansen, Claus; Wittchen, Kim Bjarne
 Aalborg Universitet 2001 2010 Danish Design Reference Year Grunnet Wang, Peter; Scharling, Mikael; Pagh Nielsen, Kristian; Kern-Hansen, Claus; Wittchen, Kim Bjarne Publication date: 2013 Document Version
John Cappelen (ed) Copenhagen page 1 of 41
 Copenhagen page 1 of 41") DMI Daily Climate Data Collection 1873-2010, Denmark, The Faroe Islands and Greenland - including Air Pressure Observations 1874-2010 (WASA Data Sets) John Cappelen (ed) Copenhagen 2011 www.dmi.dk/dmi/tr11-06
DMI Daily Climate Data Collection 1873-2010, Denmark, The Faroe Islands and Greenland - including Air Pressure Observations 1874-2010 (WASA Data Sets) John Cappelen (ed) Copenhagen 2011 www.dmi.dk/dmi/tr11-06
QualiMET 2.0. The new Quality Control System of Deutscher Wetterdienst
 QualiMET 2.0 The new Quality Control System of Deutscher Wetterdienst Reinhard Spengler Deutscher Wetterdienst Department Observing Networks and Data Quality Assurance of Meteorological Data Michendorfer
Polar Portal Season Report 2016
 Polar Portal Season Report 2016 Less ice both on land and at sea This year s report is the fourth since the Polar Portal was launched, and as an introduction, we have chosen to take a look at the trends
THE METEOROLOGICAL DATA QUALITY MANAGEMENT OF THE ROMANIAN NATIONAL SURFACE OBSERVATION NETWORK
 THE METEOROLOGICAL DATA QUALITY MANAGEMENT OF THE ROMANIAN NATIONAL SURFACE OBSERVATION NETWORK Ioan Ralita, Ancuta Manea, Doina Banciu National Meteorological Administration, Romania Ionel Dragomirescu
Road Weather Modelling System: Verification for Road Weather Season
 Road Weather Modelling System: Verification for 2010-2011 Road Weather Season Claus Petersen, Alexander Mahura, Bent Sass Copenhagen 2011 www.dmi.dk/dmi/tr11-19.pdf page 1 of 28 Colophon Serial title:
WORLD METEOROLOGICAL ORGANIZATION THE WMO TABLE DRIVEN CODES: THE 21 ST CENTURY UNIVERSAL OBSERVATION CODES
 WORLD METEOROLOGICAL ORGANIZATION THE WMO TABLE DRIVEN CODES: THE 21 ST CENTURY UNIVERSAL OBSERVATION CODES 1 THE WMO TABLE DRIVEN CODES: THE 21 ST CODES CENTURY UNIVERSAL OBSERVATION ABSTRACT The table
DANISH METEOROLOGICAL INSTITUTE MINISTRY OF TRANSPORT TECHNICAL REPORT 98-14
 DANISH METEOROLOGICAL INSTITUTE MINISTRY OF TRANSPORT TECHNICAL REPORT 98-14 The Climate of The Faroe Islands - with Climatological Standard Normals, 1961-1990 John Cappelen and Ellen Vaarby Laursen COPENHAGEN
Atmospheric and oceanic climate forcing of the exceptional Greenland ice sheet surface melt in summer 2012
 INTERNATIONAL JOURNAL OF CLIMATOLOGY Int. J. Climatol. (2013) Published online in Wiley Online Library (wileyonlinelibrary.com) DOI: 10.1002/joc.3743 Atmospheric and oceanic climate forcing of the exceptional
LOCAL CLIMATOLOGICAL DATA Monthly Summary July 2013
 Deg. Days Precip Ty Precip Wind Solar Hu- Adj. to Sea Level mid- ity Avg Res Res Peak Minute 1 fog 2 hvy fog 3 thunder 4 ice plt 5 hail 6 glaze 7 duststm 8 smk, hz 9 blw snw 1 2 3 4A 4B 5 6 7 8 9 12 14
Annex 1 to Recommendation 9 (JCOMM-III)
") Annex 1 to Recommendation 9 (JCOMM-III) AMENDMENTS TO THE MANUAL ON MARINE METEOROLOGICAL SERVICES (WMO-No. 558) AND GUIDE TO MARINE METEOROLOGICAL SERVICES (WMO-No. 471) LAYOUT FOR THE INNATIONAL MARITIME
Annex 1 to Recommendation 9 (JCOMM-III) AMENDMENTS TO THE MANUAL ON MARINE METEOROLOGICAL SERVICES (WMO-No. 558) AND GUIDE TO MARINE METEOROLOGICAL SERVICES (WMO-No. 471) LAYOUT FOR THE INNATIONAL MARITIME
Technical Report DMI Monthly Climate Data Collection , Denmark, The Faroe Islands and Greenland
 DMI Monthly Climate Data Collection 1768-2009, Denmark, The Faroe Islands and Greenland John Cappelen (ed) Copenhagen 2010 www.dmi.dk/dmi/tr10-05 page 1 of 52 Colophon Serial title: Technical Report 10-05
CALCULATION OF SUNSHINE DURATION FROM GLOBAL RADIATION MEASUREMENTS IN DENMARK AND IN GREENLAND
 CALCULATION OF SUNSHINE DURATION FROM GLOBAL RADIATION MEASUREMENTS IN DENMARK AND IN GREENLAND Claus Nordstrøm (1) Maja Kjørup Nielsen (2) (1) cln@dmi.dk, Danish Meteorological Institute, Lyngbyvej 100,
A Note on the Correctness of Precipitation in the Danish Climate Model
 A Note on the Correctness of Precipitation in the Danish Climate Model Shuting Yang Copenhagen 2005 www.dmi.dk/dmi/dkc05-05 page 1 of 10 Colophon Serial title: Danish Climate Centre Report 05-05 Title:
Practical help for compiling CLIMAT Reports
 Version: 23-Dec-2008 GLOBAL CLIMATE OBSERVING SYSTEM (GCOS) SECRETARIAT Practical help for compiling CLIMAT Reports This document is intended to give an overview for meteorological services and others
LOCAL CLIMATOLOGICAL DATA Monthly Summary September 2016
 Deg. Days Precip Ty Precip Wind Solar Hu- Adj. to Sea Level mid- ity Avg Res Res Peak 2 Minute 1 fog 2 hvy fog 3 thunder 4 ice plt 5 hail 6 glaze 7 duststm 8 smk, hz 9 blw snw 1 2 3 4A 4B 5 6 7 8 9 11
* * * Table (1) Table (2)
 Table (2)") A step Forward to Atomize the Sudan Meteorological Authority (SMA) Net work Y.S. Odan Surface Instruments Department Tel: 00249 912220246 E-mail yaseen@ersad.gov.sd Abstract AWS has been introduced to
A step Forward to Atomize the Sudan Meteorological Authority (SMA) Net work Y.S. Odan Surface Instruments Department Tel: 00249 912220246 E-mail yaseen@ersad.gov.sd Abstract AWS has been introduced to
MxVision WeatherSentry Web Services Content Guide
 MxVision WeatherSentry Web Services Content Guide July 2014 DTN 11400 Rupp Drive Minneapolis, MN 55337 00.1.952.890.0609 This document and the software it describes are copyrighted with all rights reserved.
Model Output Statistics (MOS)
") Model Output Statistics (MOS) Numerical Weather Prediction (NWP) models calculate the future state of the atmosphere at certain points of time (forecasts). The calculation of these forecasts is based on
Model Output Statistics (MOS) Numerical Weather Prediction (NWP) models calculate the future state of the atmosphere at certain points of time (forecasts). The calculation of these forecasts is based on
Application and verification of ECMWF products 2009
 Application and verification of ECMWF products 2009 Danish Meteorological Institute Author: Søren E. Olufsen, Deputy Director of Forecasting Services Department and Erik Hansen, forecaster M.Sc. 1. Summary
Plan for operational nowcasting system implementation in Pulkovo airport (St. Petersburg, Russia)
") Plan for operational nowcasting system implementation in Pulkovo airport (St. Petersburg, Russia) Pulkovo airport (St. Petersburg, Russia) is one of the biggest airports in the Russian Federation (150
Plan for operational nowcasting system implementation in Pulkovo airport (St. Petersburg, Russia) Pulkovo airport (St. Petersburg, Russia) is one of the biggest airports in the Russian Federation (150
4.5 Comparison of weather data from the Remote Automated Weather Station network and the North American Regional Reanalysis
 4.5 Comparison of weather data from the Remote Automated Weather Station network and the North American Regional Reanalysis Beth L. Hall and Timothy. J. Brown DRI, Reno, NV ABSTRACT. The North American
LOCAL CLIMATOLOGICAL DATA Monthly Summary November 2006
 Deg. Days Precip Ty Precip Wind Sun Hu- Adj. to Sea Level mid- ity Avg Res Res Peak Minute 1 fog 2 hvy fog 3 thunder 4 ice plt 5 hail 6 glaze 7 duststm 8 smk, hz 9 blw snw 1 2 3 4A 4B 5 6 7 8 9 12 14 15
National Report on Global Climate Observing Systems in Denmark, Greenland and the Faroe Islands 2008
 National Report on Global Climate Observing Systems in Denmark, Greenland and the Faroe Islands 2008 Status report to provide input to UNFCCC SBSTA on national GCOS activities Compiled by Claus Kern-Hansen,
Sustaining Arctic Observing Networks SAON
 Sustaining Arctic Observing Networks SAON Atmosphere Breakout Group Stockholm, Sweden November 12 14, 2007 Lisa Darby (NOAA) & Jussi Paatero (FMI) What role does the atmosphere play in the reduction of
Global NWP Index documentation
 Global NWP Index documentation The global index is calculated in two ways, against observations, and against model analyses. Observations are sparse in some parts of the world, and using full gridded analyses
National Climatic Data Center DATA DOCUMENTATION FOR DATA SET 6406 (DSI-6406) ASOS SURFACE 1-MINUTE, PAGE 2 DATA. July 12, 2006
 ASOS SURFACE 1-MINUTE, PAGE 2 DATA. July 12, 2006") DATA DOCUMENTATION FOR DATA SET 6406 (DSI-6406) ASOS SURFACE 1-MINUTE, PAGE 2 DATA July 12, 2006 151 Patton Ave. Asheville, NC 28801-5001 USA Table of Contents Topic Page Number 1. Abstract... 3 2. Element
DATA DOCUMENTATION FOR DATA SET 6406 (DSI-6406) ASOS SURFACE 1-MINUTE, PAGE 2 DATA July 12, 2006 151 Patton Ave. Asheville, NC 28801-5001 USA Table of Contents Topic Page Number 1. Abstract... 3 2. Element
IAMCO-YOPP. Italian Antarctic Meteo-Climatological Observatory at MZS, Victoria Land and at Concordia.
 IAMCO-YOPP Italian Antarctic Meteo-Climatological Observatory at MZS, Victoria Land and at Concordia http://www.climantartide.it Principal investigator Paolo Grigioni paolo.grigioni@enea.it ENEA Areas
AN INTERNATIONAL SOLAR IRRADIANCE DATA INGEST SYSTEM FOR FORECASTING SOLAR POWER AND AGRICULTURAL CROP YIELDS
 AN INTERNATIONAL SOLAR IRRADIANCE DATA INGEST SYSTEM FOR FORECASTING SOLAR POWER AND AGRICULTURAL CROP YIELDS James Hall JHTech PO Box 877 Divide, CO 80814 Email: jameshall@jhtech.com Jeffrey Hall JHTech
Annual accumulation for Greenland updated using ice core data developed during and analysis of daily coastal
 Click Here for Full Article JOURNAL OF GEOPHYSICAL RESEARCH, VOL. 114,, doi:10.1029/2008jd011208, 2009 Annual accumulation for Greenland updated using ice core data developed during 2000 2006 and analysis
Precipitation type detection Present Weather Sensor
 Precipitation type detection Present Weather Sensor Project no. 1289 Final report February 24 H. Bloemink MI/INSA/IO Contents 1 Introduction...3 2 Present weather determination...3 3 Experiment...4 3.1
Wind direction measures in degrees Occasion described with codes, when is calm or variable wind. Explanation
 Introduction The searching results explanations of meteorological data Depending on the parameter, the instrumental measuring or visual observation method is used for the meteorological observations. Instrumentally
On the Prediction of Road Conditions by a Combined Road Layer-Atmospheric
 TRANSPORTATION RESEARCH RECORD 1387 231 On the Prediction of Road Conditions by a Combined Road Layer-Atmospheric Model in Winter HENRIK VOLDBORG An effective forecasting system for slippery road warnings
Trevor Lee Director, Buildings. Grant Edwards PhD Department of Environment and Geography
 Weather Affects Building Performance Simulation v Monitoring real time solar and coincident weather data for building optimisation and energy management Trevor Lee Director, Buildings Grant Edwards PhD
Solar radiation and thermal performance of solar collectors for Denmark
 Downloaded from orbit.dtu.dk on: Feb 01, 2018 Solar radiation and thermal performance of solar collectors for Denmark Dragsted, Janne; Furbo, Simon Publication date: 2012 Document Version Publisher's PDF,
BUFR Table D - List of common sequences
 BUFR Table D - List of common sequences Category of sequences 3 00 BUFR table entries sequences 3 01 Location and identification sequences 3 02 Meteorological sequences common to surface data 3 03 Meteorological
Greenland ice sheet surface melt extent and trends:
 Journal of Glaciology, Vol. 57, No. 204, 2011 621 Greenland ice sheet surface melt extent and trends: 1960 2010 Sebastian H. MERNILD, 1 Thomas L. MOTE, 2 Glen E. LISTON 3 1 Climate, Ocean and Sea Ice Modeling
Quality assurance for sensors at the Deutscher Wetterdienst (DWD)
") Quality assurance for sensors at the Deutscher Wetterdienst (DWD) Quality assurance / maintenance / calibration Holger Dörschel, Dr Tilman Holfelder WMO International Conference on Automatic Weather Stations
Quality assurance for sensors at the Deutscher Wetterdienst (DWD) Quality assurance / maintenance / calibration Holger Dörschel, Dr Tilman Holfelder WMO International Conference on Automatic Weather Stations
Global reanalysis: Some lessons learned and future plans
 Global reanalysis: Some lessons learned and future plans Adrian Simmons and Sakari Uppala European Centre for Medium-Range Weather Forecasts With thanks to Per Kållberg and many other colleagues from ECMWF
Earth Networks ENcast 6- Day Hourly Lat- Lon Forecast Feed
 Earth Networks ENcast 6- Day Hourly Lat- Lon Forecast Feed Introduction: The Earth Networks ENcast 6- Day Hourly Lat- Lon Forecast Feed will provide you with a variety of hourly forecast variables up to
Technical Report DMI Daily Climate Data Collection , Denmark and Greenland. John Cappelen, Ellen Vaarby Laursen and Claus Kern-Hansen
 DMI Daily Climate Data Collection 1873-2004, Denmark and Greenland John Cappelen, Ellen Vaarby Laursen and Claus Kern-Hansen Copenhagen 2006 www.dmi.dk/dmi/tr05-04 page 1 of 36 Colophon Serial title: Technical
National Report on Global Climate Observing Systems (GCOS) in Denmark, Greenland and the Faroe Islands 2013
 in Denmark, Greenland and the Faroe Islands 2013") Danish Climate Centre Report 13-5 National Report on Global Climate Observing Systems (GCOS) in Denmark, Greenland and the Faroe Islands 213 Claus Kern-Hansen (ed) Copenhagen 213 Page 1 of 27 Colophon
Danish Climate Centre Report 13-5 National Report on Global Climate Observing Systems (GCOS) in Denmark, Greenland and the Faroe Islands 213 Claus Kern-Hansen (ed) Copenhagen 213 Page 1 of 27 Colophon
Comparative analysis of data collected by installed automated meteorological stations and manual data in Central Asia.
 Comparative analysis of data collected by installed automated meteorological stations and manual data in Central Asia. Merkushkin Aleksandr Uzhydromet 71 K. Makhsumov str., 100052 Tashkent, Uzbekistan
DANISH METEOROLOGICAL INSTITUTE MINISTRY OF TRANSPORT TECHNICAL REPORT 04-03
 DANISH METEOROLOGICAL INSTITUTE MINISTRY OF TRANSPORT TECHNICAL REPORT 04-03 DMI Daily Climate Data Collection 1873-2003, Denmark and Greenland Ellen Vaarby Laursen Weather and Climate Information Division
FEDERAL CLIMATE COMPLEX DATA DOCUMENTATION FOR INTEGRATED SURFACE DATA
 FEDERAL CLIMATE COMPLEX DATA DOCUMENTATION FOR INTEGRATED SURFACE DATA September 30, 2011 National Climatic Data Center Air Force Combat Climatology Center Fleet Numerical Meteorology and Oceanography
Global Surface Archives Documentation
 Global Surface Archives Documentation 1 July 2013 PO BOX 450211 GARLAND TX 75045 www.weathergraphics.com Global Surface Archives is a dataset containing hourly and special observations from official observation
Country Report for Japan (Submitted by Kenji Akaeda, Japan Meteorological Agency)
") Japan JMA/WMO Workshop on Quality Management in Surface, Climate and Upper-air Observations in RA II (Asia) Tokyo, Japan 27 30 July 2010 Doc. Japan (10.VII.2010) Country Report for Japan (Submitted by
Japan JMA/WMO Workshop on Quality Management in Surface, Climate and Upper-air Observations in RA II (Asia) Tokyo, Japan 27 30 July 2010 Doc. Japan (10.VII.2010) Country Report for Japan (Submitted by
Swedish Meteorological and Hydrological Institute
 Swedish Meteorological and Hydrological Institute Norrköping, Sweden 1. Summary of highlights HIRLAM at SMHI is run on a CRAY T3E with 272 PEs at the National Supercomputer Centre (NSC) organised together
A TEST OF THE PRECIPITATION AMOUNT AND INTENSITY MEASUREMENTS WITH THE OTT PLUVIO
 A TEST OF THE PRECIPITATION AMOUNT AND INTENSITY MEASUREMENTS WITH THE OTT PLUVIO Wiel M.F. Wauben, Instrumental Department, Royal Netherlands Meteorological Institute (KNMI) P.O. Box 201, 3730 AE De Bilt,
The Impact of Observational data on Numerical Weather Prediction. Hirokatsu Onoda Numerical Prediction Division, JMA
 The Impact of Observational data on Numerical Weather Prediction Hirokatsu Onoda Numerical Prediction Division, JMA Outline Data Analysis system of JMA in Global Spectral Model (GSM) and Meso-Scale Model
Seamless nowcasting. Open issues
 Federal Department of Home Affairs FDHA Federal Office of Meteorology and Climatology MeteoSwiss Seamless nowcasting INCA Open issues Pierre Eckert Matteo Buzzi, Marco Sassi, Guido della Bruna, Marco Gaia
Measurements of the angular distribution of diffuse irradiance
 Downloaded from orbit.dtu.dk on: Nov 02, 2018 Measurements of the angular distribution of diffuse irradiance Nielsen, Elsabet Nomonde Noma; Nielsen, Kristian Pagh ; Dragsted, Janne; Furbo, Simon Published
Page 1. Name:
 Name: 1) As the difference between the dewpoint temperature and the air temperature decreases, the probability of precipitation increases remains the same decreases 2) Which statement best explains why
Guidelines on Quality Control Procedures for Data from Automatic Weather Stations
 Guidelines on Quality Control Procedures for Data from Automatic Weather Stations Igor Zahumenský Slovak Hydrometeorological Institute SHMI, Jeséniova 17, 833 15 Bratislava, Slovakia Tel./Fax. +421 46
Climate & Earth System Science. Introduction to Meteorology & Climate. Chapter 05 SOME OBSERVING INSTRUMENTS. Instrument Enclosure.
 Climate & Earth System Science Introduction to Meteorology & Climate MAPH 10050 Peter Lynch Peter Lynch Meteorology & Climate Centre School of Mathematical Sciences University College Dublin Meteorology
Antarctic Automatic Weather Station Data for the calendar year 2000
 Antarctic Automatic Weather Station Data for the calendar year 2000 by Linda M. Keller George A. Weidner Charles R. Stearns Matthew T. Whittaker Robert E. Holmes Matthew A. Lazzara Space Science and Engineering
Implementation Guidance of Aeronautical Meteorological Observer Competency Standards
 Implementation Guidance of Aeronautical Meteorological Observer Competency Standards The following guidance is supplementary to the AMP competency Standards endorsed by Cg-16 in Geneva in May 2011. Please
Appendix. Atmosphere Investigation Data Work Sheet. Ozone Data Work Sheet. Atmospheric Haze Data Work Sheet. Clouds 7 Measurement Data Work Sheet
 Appendix Atmosphere Investigation Data Work Sheet Ozone Data Work Sheet Atmospheric Haze Data Work Sheet Clouds 7 Measurement Data Work Sheet GLOBE 2000 Appendix - 1 Atmosphere Atmosphere Investigation
Precipitation type from the Thies disdrometer
 Precipitation type from the Thies disdrometer Hannelore I. Bloemink 1, Eckhard Lanzinger 2 1 Royal Netherlands Meteorological Institute (KNMI) Instrumentation Division P.O. Box 201, 3730 AE De Bilt, The
AERODROME METEOROLOGICAL OBSERVATION AND FORECAST STUDY GROUP (AMOFSG)
") AMOFSG/9-SN No. 31 22/8/11 AERODROME METEOROLOGICAL OBSERVATION AND FORECAST STUDY GROUP (AMOFSG) NINTH MEETING Montréal, 26 to 30 September 2011 Agenda Item 5: Observing and forecasting at the aerodrome
AMOFSG/9-SN No. 31 22/8/11 AERODROME METEOROLOGICAL OBSERVATION AND FORECAST STUDY GROUP (AMOFSG) NINTH MEETING Montréal, 26 to 30 September 2011 Agenda Item 5: Observing and forecasting at the aerodrome
AERODROME METEOROLOGICAL OBSERVATION AND FORECAST STUDY GROUP (AMOFSG)
") AMOFSG/10-IP/4 21/5/13 AERODROME METEOROLOGICAL OBSERVATION AND FORECAST STUDY GROUP (AMOFSG) TENTH MEETING Montréal, 17 to 19 June 2013 Agenda Item 5: Aerodrome observations AUTOMATED CLOUD INFORMATION
AMOFSG/10-IP/4 21/5/13 AERODROME METEOROLOGICAL OBSERVATION AND FORECAST STUDY GROUP (AMOFSG) TENTH MEETING Montréal, 17 to 19 June 2013 Agenda Item 5: Aerodrome observations AUTOMATED CLOUD INFORMATION
CGMS Baseline. Sustained contributions to the Global Observing System. Endorsed by CGMS-46 in Bengaluru, June 2018
 CGMS Baseline Sustained contributions to the Global Observing System Best Practices for Achieving User Readiness for New Meteorological Satellites Endorsed by CGMS-46 in Bengaluru, June 2018 CGMS/DOC/18/1028862,
OBSERVE AND REPORT. Overview: Objectives: Targeted Alaska Grade Level Expectations: Vocabulary: Materials: Whole Picture:
 Overview: In this lesson, students are introduced to various methods of learning about weather and climate through an interactive multimedia file. Students awareness of weather is further heightened by
QUALITY MANAGEMENT IN SURFACE, CLIMATE AND UPPER-AIR OBSERVATIONS IN CHINA
 China JMA/WMO Workshop on Quality Management in Surface, Climate and Upper-air Observations in RA II (Asia) Tokyo, Japan 27-30 July 2010 Doc. Country (.VII.2010) QUALITY MANAGEMENT IN SURFACE, CLIMATE
EnergyPlus Weather File (EPW) Data Dictionary
 Data Dictionary") EnergyPlus Weather File (EPW) Data Dictionary The data dictionary for EnergyPlus Weather Data is shown below. Note that semi-colons do NOT terminate lines in the EnergyPlus Weather Data. It helps if you
EnergyPlus Weather File (EPW) Data Dictionary The data dictionary for EnergyPlus Weather Data is shown below. Note that semi-colons do NOT terminate lines in the EnergyPlus Weather Data. It helps if you
CHAPTER 13 WEATHER ANALYSIS AND FORECASTING MULTIPLE CHOICE QUESTIONS
 CHAPTER 13 WEATHER ANALYSIS AND FORECASTING MULTIPLE CHOICE QUESTIONS 1. The atmosphere is a continuous fluid that envelops the globe, so that weather observation, analysis, and forecasting require international
THE CLIMATE INFORMATION MODULE
 Climate Information and Prediction Services (CLIPS) -Curriculum- THE CLIMATE INFORMATION MODULE designed by Dipl.-Met. Peer Hechler Deutscher Wetterdienst P.O. Box 10 04 65 63004 Offenbach Germany THE
P1.34 MULTISEASONALVALIDATION OF GOES-BASED INSOLATION ESTIMATES. Jason A. Otkin*, Martha C. Anderson*, and John R. Mecikalski #
 P1.34 MULTISEASONALVALIDATION OF GOES-BASED INSOLATION ESTIMATES Jason A. Otkin*, Martha C. Anderson*, and John R. Mecikalski # *Cooperative Institute for Meteorological Satellite Studies, University of
Extracting Canadian Climate Data from Environment Canada dataset
 University of British Columbia Department of Statistics Technical Report #244 May 2009 Extracting Canadian Climate Data from Environment Canada dataset by Reza Hosseini 1 1 University of British Columbia
Chapter 12 Section 12.1 The causes of weather
 Chapter 12 Section 12.1 The causes of weather Main Idea: Air masses have different temperatures and amounts of moisture because of the uneven heating of earth's surface. What is Meteorology The study of
WeatherHawk Weather Station Protocol
 WeatherHawk Weather Station Protocol Purpose To log atmosphere data using a WeatherHawk TM weather station Overview A weather station is setup to measure and record atmospheric measurements at 15 minute
DANISH METEOROLOGICAL INSTITUTE MINISTRY OF TRANSPORT TECHNICAL REPORT 02-25
 DANISH METEOROLOGICAL INSTITUTE MINISTRY OF TRANSPORT TECHNICAL REPORT 02-25 New hours of bright sunshine normals for Denmark, 1961-1990. Ellen Vaarby Laursen and Stig Rosenørn COPENHAGEN 2002 ISSN 0906-897X
WxChallenge Model Output Page Tutorial
 WxChallenge Model Output Page Tutorial Brian Tang University at Albany - SUNY 9/25/12 http://www.atmos.albany.edu/facstaff/tang/forecast/ Clicking on square brings up graphic for the specified variable
Data Short description Parameters to be used for analysis SYNOP. Surface observations by ships, oil rigs and moored buoys
 3.2 Observational Data 3.2.1 Data used in the analysis Data Short description Parameters to be used for analysis SYNOP Surface observations at fixed stations over land P,, T, Rh SHIP BUOY TEMP PILOT Aircraft
Observations needed for verification of additional forecast products
 Observations needed for verification of additional forecast products Clive Wilson ( & Marion Mittermaier) 12th Workshop on Meteorological Operational Systems, ECMWF, 2-6 November 2009 Additional forecast
1 Introduction. Station Type No. Synoptic/GTS 17 Principal 172 Ordinary 546 Precipitation
 Use of Automatic Weather Stations in Ethiopia Dula Shanko National Meteorological Agency(NMA), Addis Ababa, Ethiopia Phone: +251116639662, Mob +251911208024 Fax +251116625292, Email: Du_shanko@yahoo.com
Recent Improvement of Integrated Observation Systems in JMA
 Recent Improvement of Integrated Observation Systems in JMA Mr Osamu Suzuki and Mr Yoshihiko Tahara Japan Meteorological Agency 1-3-4 Otemachi, Chiyoda-ku, Tokyo 100-8122, Japan Tel: +81-3-3212-8341, Fax:
2 nd Cryonet-Asia Worskshop Salekhard, Russian Federation (2-5 February 2016)
") WMO 2 nd Cryonet-Asia Worskshop Salekhard, Russian Federation (2-5 February 2016) WMO Rolling Review of Requirements (RRR) Etienne Charpentier Chief, WMO Observing Systems Division WMO; Name of Department
WMO 2 nd Cryonet-Asia Worskshop Salekhard, Russian Federation (2-5 February 2016) WMO Rolling Review of Requirements (RRR) Etienne Charpentier Chief, WMO Observing Systems Division WMO; Name of Department
EWGLAM/SRNWP National presentation from DMI
 EWGLAM/SRNWP 2013 National presentation from DMI Development of operational Harmonie at DMI Since Jan 2013 DMI updated HARMONIE-Denmark suite to CY37h1 with a 3h-RUC cycling and 57h forecast, 8 times a
138 ANALYSIS OF FREEZING RAIN PATTERNS IN THE SOUTH CENTRAL UNITED STATES: Jessica Blunden* STG, Inc., Asheville, North Carolina
 138 ANALYSIS OF FREEZING RAIN PATTERNS IN THE SOUTH CENTRAL UNITED STATES: 1979 2009 Jessica Blunden* STG, Inc., Asheville, North Carolina Derek S. Arndt NOAA National Climatic Data Center, Asheville,
WMO SPICE SITE COMMISSIONING PROTOCOL V3.1 (JUL, )
") WMO SPICE SITE COMMISSIONING PROTOCOL V3.1 (JUL, 23 2013) TABLE OF CONTENTS 1. ORGANIZATION OF THE DOCUMENT... 3 2. PURPOSE AND SCOPE... 3 3. CONFIGURATIONS AND ASSOCIATED COMMISSIONING REQUIREMENTS...
WMO SPICE SITE COMMISSIONING PROTOCOL V3.1 (JUL, 23 2013) TABLE OF CONTENTS 1. ORGANIZATION OF THE DOCUMENT... 3 2. PURPOSE AND SCOPE... 3 3. CONFIGURATIONS AND ASSOCIATED COMMISSIONING REQUIREMENTS...
Ground-based temperature and humidity profiling using microwave radiometer retrievals at Sydney Airport.
 Ground-based temperature and humidity profiling using microwave radiometer retrievals at Sydney Airport. Peter Ryan Bureau of Meteorology, Melbourne, Australia Peter.J.Ryan@bom.gov.au ABSTRACT The aim
CIMIS. California Irrigation Management Information System
 CIMIS California Irrigation Management Information System What is CIMIS? A network of over 130 fully automated weather stations that collect weather data throughout California and provide estimates of
Dr. Christopher M. Godfrey University of North Carolina at Asheville
 Surface and Upper-Air Observations Surface Observations Collect information for synoptic-scale weather Most surface observations are automated (e.g., Automated Surface Observing System) Also mesoscale