Director Corporate Services & Board Secretary
|
|
|
- Charlene Douglas
- 5 years ago
- Views:
Transcription
1 \ I newfoundland labrador _hydro a nalcor energy company Hydro Place. 00 Columbus Drive. P.O. Box 00. St. John's. NL Canada A K t f October, 0 The Board of Commissioners of Public Utilities Prince Charles Building 0 Torbay Road, P.O. Box 00 St. John's, Newfoundland & Labrador AA B Attention: Ms. Cheryl Blundon Director Corporate Services & Board Secretary Dear Ms. Blundon: Re: The Board's Investigation and Hearing into Supply Issues and Power Outages on the Island Interconnection System In accordance with the Board's Interim Report dated May, 0, wherein the Board required the filing of a report by today's date with respect to the above-noted matter, please find enclosed the original plus copies of Hydro's report entitled Progress Report on Load Forecasting Improvements. Should you have any questions, please contact the undersigned. Yours truly, NEWFOUNDLAND AND LABRADOR HYDRO Geof ey P. Young S ior Legal Counsel GPY/jc cc: Gerard Hayes Newfoundland Power Thomas Johnson Consumer Advocate Paul Coxworthy Stewart McKelvey Stirling Scales Danny Dumaresque ecc: Roberta Frampton Benefiel Grand Riverkeeper Labrador

2 Investigation and Hearing into Supply Issues and Power Outages on the Island Interconnected System A Report to the Board of Commissioners of Public Utilities Progress Report on Load Forecasting Improvements Newfoundland and Labrador Hydro October, 0
3 TABLE OF CONTENTS.0 INTRODUCTION....0 BACKGROUND....0 SYSTEM OPERATIONS SHORT-TERM FORECAST.... Nostradamus Improvements Status Update..... Ventyx Training/Workshop..... Implement and Test New Training Parameters and Procedures..... Database Changes.... Representation of System Losses.... Approach to Avalon and Island Forecasts....0 MEDIUM TERM OPERATING LOAD FORECAST.... Review of Winter 0/0 Weather Conditions.... Review of System Load during the Supply Disruption.... Newfoundland Power Peak Demand Forecast.... Customer Coincidence....0 LONG TERM PLANNING FORECAST.... Sensitivity Analysis in Load Forecasting.... Share of Residential Electric Heat.... Review of Historical Peak Weather Conditions....0 SUMMARY... Appendices: Appendix A Appendix B Appendix C Appendix D New Hydro Load Forecasting Model Definitions Comparison of 0 Weather Conditions to Historical Weather Customer Coincidence Factors Historical Winter Wind Chill Values i
4 .0 INTRODUCTION 0 0 On January, 0 the total system load on Newfoundland and Labrador Hydro s (Hydro) Island Interconnected System, and the available generation supply to meet this load, converged to a point where it was necessary to issue a request for conservation to the general public. As system load increased further going into the late afternoon of January, it became necessary for Hydro to request that Newfoundland Power initiate rotating outages, and these continued into January. The inability of Hydro to meet full system load was, in part, because of unavailability of sufficient generation supply. Several unplanned generation outages in the last half of December, 0, involving five different generating facilities, resulted in a supply deficit of approximately 0 MW. Hydro s internal review and investigation of the supply disruptions identified a number of actions to be taken to address the factors which caused this generation deficit. Many of these actions have been completed, and others are due for completion in advance of the 0/ winter season. Hydro has been providing regular update reports to the Board of Commissioners of Public Utilities (the Board) in relation to its generation winter readiness action planning. An additional factor which significantly influenced load in late December 0 and early January 0 was weather. The 0/ winter period was not the norm in that the winter peak demand occurred earlier than usual. Low temperatures experienced in the last half of December and into early January were more severe, and more sustained, than normal. In the course of its investigation, Hydro also reviewed its processes for forecasting peak system loads, as well as the processes and systems used to forecast system load growth and future generation and reserve requirements. With the help of external experts in these areas, Hydro identified a number of actions it would take to improve its forecasting processes. Additional recommendations made by Liberty Consulting in their April, 0 report to the Board were Newfoundland and Labrador Hydro Page
5 adopted by Hydro as well, and all actions were incorporated into Hydro s Integrated Outage Action Plan. In its Interim Report of May, 0, the Board indicated two priority actions it felt were required in relation to load forecasting and generation planning. This Report is in response to the Board s request that Hydro file a report by October, 0 in relation to the changes Hydro has made to its short-term forecasting process and its approach to the incorporation of sensitivity analyses in its supply forecasting and planning decisions. Newfoundland and Labrador Hydro Page
6 .0 BACKGROUND Hydro s forecasting processes were not found to be a contributing factor in the January 0 supply disruptions, however, reviews completed internally and by Ventyx, and the preliminary reports completed by the Liberty Group and the Public Utilities Board highlighted several recommendations with respect to improving Hydro s load forecasting processes. In response to these recommendations Hydro undertook reviews of its short term hourly, monthly and long term planning forecasting methodologies and their corresponding data sets. Hydro has three different load forecasts that it uses to plan and operate the power system: 0 System Operations Short-Term Forecast - has a time frame of seven days. The time step is hourly and the forecast is prepared six times a day. The System Operations forecast is used for generating unit scheduling and equipment outage approvals. Three forecasts are created, one for the Avalon Peninsula, one for the Hydro System, and one for the Interconnected Island System. Newfoundland Power generation is estimated by using the previous day s generation. 0 Medium-Term Operating Load Forecast - has a time horizon of five years. The time step is monthly and the forecast is prepared one to two times per year, usually in May and November. The Operating Load Forecast is used for budgeting and medium-term operational planning, such as equipment outage planning and hydrothermal optimization. The Operating Load Forecast includes a forecast of energy and peak demand requirements for Hydro s System with the forecast of requirements being customer driven. All loads (except Hydro s rural load) are supplied by the customers (including Newfoundland Power). Newfoundland Powers peak demand forecast methodology was developed in consultation with Hydro. Long-Term Planning Forecast - typically has a time horizon of 0 years. The time Newfoundland and Labrador Hydro Page
7 step for the long-term planning forecast is one year and the forecast is prepared annually. This forecast is used for assessing the long-term reliability of the Island Interconnected system and for planning resource requirements to meet reliability criteria. For long-term requirements, both Newfoundland Power and Hydro Rural Island Systems are simulated by Hydro, while industrial requirements are guided by information directly from the individual industrial customers. Newfoundland and Labrador Hydro Page
8 .0 SYSTEM OPERATIONS SHORT-TERM FORECAST 0 0 The Ventyx Nostradamus model is used for short term (one to seven days) load forecasting with an hourly time step. Nostradamus is a neural network algorithm which learns the pattern of load changes from weather variables, day of week, time of day, etc. by learning from historical data from training and then verification periods. The forecast is used by System Operations to assist in determination of generation reserves, unit commitment and scheduling, and equipment outage assessments. In late December 0 System Operations noted that Nostradamus was not accurately predicting the load, likely because of the low temperatures and high winds experienced at the time. This continued into early January 0. Because the forecasts are based on historic patterns of weather and load, the model can have difficulty predicting load during conditions outside of its learning dataset. For parts of most days the forecast was reasonable but there were occasional patterns that were inaccurate. In its review of the supply issues and power outages on the Island Interconnected System for the Public Utilities Board, Liberty made the following recommendations with which Newfoundland and Labrador Hydro concurred.. Hydro should complete the modifications or replacement of Nostradamus by December, 0 in order to enable improvements in the accuracy of short-term forecasts under extreme weather conditions.. By December, 0, Hydro should incorporate into its short-term forecasting process any significant load changes, from losses or otherwise, resulting from varying system configurations. Hydro s internal review concluded that factors related to load forecasting did not result in decisions that contributed to the supply disruptions or rotating outages. There was, however, a Newfoundland and Labrador Hydro Page
9 0 0 recommendation to improve short-term forecasting during cold weather. More accurate forecasting could improve Hydro s ability to manage and communicate during outages and emergencies by providing System Operations and Energy Control Centre Operators with more accurate estimates of expected peak loads. System Operations developed a work plan as part of Hydro s Integrated Action Plan (IAP) to address Hydro s identified actions and the recommendations from Liberty and the Public Utilities Board. The work plan involves the implementation of enhancements to the short term forecasting model to ensure a better correlation in extreme cold weather conditions and includes five main tasks: Hold training/workshop with Ventyx s Nostradamus application subject expert; Implement and test new training parameters and procedures; Make database changes required to implement the new version; Design and implement new island forecasts; and Move new software and model to the Production environment. The target date for completion of the work plan was October, 0. The schedule targeted to have all work essentially complete by late September so that some experience could be gained with the new model well in advance of the move from development to production. Difficulties with the Nostradamus software database, which required intervention by the vendor, delayed completion of some of the tasks and to date the newer version of the software and model have not been implemented on the Production environment. Implementation on the Production environment is expected to be completed before the final week of November. As part of its standard work plan, Hydro reviews the accuracy of the Nostradamus forecasts on a quarterly basis and does re-training of the model if required. For the winter of 0/0, the frequency of this review will be increased to monthly. Newfoundland and Labrador Hydro Page
10 0 0. Nostradamus Improvements Status Update.. Ventyx Training/Workshop A Ventyx representative held a workshop at Hydro s offices in June, 0. The objectives for the workshop were to: Train additional staff to be familiar with Nostradamus; Improve the load forecast to be able to plan generation and identify potential system demand shortages in advance; Provide better understanding of how the Nostradamus model works to allow ongoing improvements to the forecasts; Troubleshoot problems with communications between Nostradamus and other Energy Management System (EMS) databases; and Understand how to test forecast training with specific historic periods of unusual load (e.g. January 0). Seven employees from Hydro participated in the workshop. A new version of the Nostradamus model (Version.) was installed on Hydro s Development environment and the key features of the model were reviewed and demonstrated. The interactive nature of the workshop enabled some changes to be made to Hydro s model during the workshop. Recommendations by Ventyx to improve Hydro s implementation of Nostradamus included: Investigate cloud cover as a training parameter; Investigate a three-day moving-mean temperature as a training parameter to model the load effects of persisting hot or cold weather; Investigate a daylight training parameter (0 for dark, for light and a value between 0 and for dawn or dusk); Limit the training period to one to three years this differs from the the more, the better advice previously provided; Newfoundland and Labrador Hydro Page
11 0 0 Consider reducing the number of meteorological stations used; using more stations slows down training and execution of forecasts and may not add; Vary the verification period used during model training, as it too is used in deriving the model parameters; Put an emphasis on data quality (meteorological and demand) as poor data can have a significant effect on training and forecasts, especially with intraday forecasts; Replace demand data during major outages with forecast model values for that period; and Increase the frequency of forecasting today s load and consider getting multiple weather forecasts and observed data reports daily. During the workshop, Ventyx confirmed that Nostradamus has the following limitations that can reduce the accuracy of its load forecasting: Nostradamus cannot forecast load if meteorological conditions are different from those during the training period, and Nostradamus cannot forecast load growth. Both limitations stem from the nature of neural network models all forecasts are based on patterns derived during analysis of historic data. Since historic data comprises only actual load and prior weather conditions, Nostradamus may not accurately forecast load during unusual or infrequent weather conditions and will not reflect any growth in load. Recommended practices to account for these limitations have been developed which will now be used. Newfoundland and Labrador Hydro Page
12 0 0.. Implement and Test New Training Parameters and Procedures Since the workshop with Ventyx in June, significant effort has been expended to incorporate Ventyx s recommendations into Hydro s short term forecasting. To date, these changes have been made only on Hydro s Development environment. Comments on the individual recommendations are provided below. Investigate cloud cover as a training parameter. Cloud cover data are generally only available at major climate stations; on the Island it is only available for St. John s, Gander, Deer Lake and Port aux Basques. Previously, Hydro used nine stations on the island to represent weather conditions: those listed above plus St. Lawrence, Stephenville, Badger, Daniel s Harbour and St. Anthony. Because Ventyx also recommended reducing the number of stations used for forecasting, recent work has used only the stations where cloud cover data are available. Investigate a three-day moving-mean temperature as a training parameter. Some work was done on this parameter during the workshop but it was not found to improve the forecasting accuracy, so this recommendation was not given priority in the current exercise. This parameter will be investigated further once time allows. Investigate a daylight parameter. An actual data series has been developed for 0 through 0 which represents dark hours as 0, daylight hours as and dawn and dusk hours as values between 0 and based on sunrise and sunset hours. Since this parameter is known in advance, forecasts are not required. Limit the training period to one to three years. Previous guidance from Ventyx had been to use as much data as possible, back to the last significant change in the load, so Hydro was using data from April 00, when the Grand Falls Paper Mill closed. Recent training has been done using data since January 0. Newfoundland and Labrador Hydro Page
13 0 0 Consider reducing the number of meteorological stations used. This recommendation was discussed above. Vary the verification period used in training. Work on this recommendation has yet to be completed. Most recent training has used the period January 0 to May 0 for verification but this will change when the latter part of 0 is added into the training period. Put an emphasis on data quality (meteorological and demand). All temperature, wind speed and cloud cover data used in training has been closely examined to eliminate erroneous data and to fill in missing data. Preliminary checks have been done on the demand data, but additional screening may still be required. As well, the Nostradamus training process will help to identify errors in the demand data. Replace demand data during major outages with forecast model values for that period. Hydro s previous practices had been to replace load data from periods of major outages with data from the previous and/or subsequent day. Ventyx recommended, instead, using data from the Nostradamus forecast. This was done during the workshop for the January 0 supply disruption period as a training exercise but will need to be repeated for January 0 with the new Avalon and Island load definitions and for other outage periods, as required. It is somewhat of an iterative process as replacing the outage load with a more realistic value will improve subsequent training and forecasting. Use Nostradamus to forecast conforming (weather dependent) load only. This recommendation was part of Hydro s work plan prior to discussions with. It is discussed in a later section of this report. Increase the frequency of forecasting today s load. Previously the load forecasting model was run six times a day. The model on the Development environment is currently running in automatic mode every hour. Forecasts after AM differ only in the actual demand data used, Newfoundland and Labrador Hydro Page 0
14 0 0 as it is imported every hour. Currently the weather forecast is only obtained once per day, but the Request for Proposal recently issued to renew Hydro s weather forecasting services asks for costs for both once and twice per day. An additional weather forecast issued midday may improve the forecast of the supper hour peak. Forecasting Procedures As noted above, Nostradamus cannot forecast for load or weather that was not experienced in the training period, so Hydro is implementing new practices to account for these limitations. To assist System Operations and the Energy Control Centre in identifying when weather conditions are unusual for the time of year, plots of temperatures and wind speeds experienced during the current training period will be prepared. An example of this kind of plot can be seen in Figure below, for temperatures from 0 to 0 inclusive. Any forecast minimum temperature can be compared to the plot to gauge how well Nostradamus is likely to forecast the load. As seen on the plot, the temperatures in January 0 were clearly outside the range used for training, so Operators would know that Nostradamus would likely underestimate load. These plots will need to be revised every time the period used to train the Nostradamus model is modified. Prior to implementing the new model on the Production environment, Nostradamus will be trained using data from January 0 and 0 with the expected loads estimated by the forecast model, so if similar temperatures are experienced in 0, Nostradamus will be able to forecast the load with improved accuracy. Newfoundland and Labrador Hydro Page
15 Figure Nostradamus Training Period Temperature Distribution St. John's Maximum 0% % 0% % 0% Minimum Temperature, degrees C Jan Feb Mar Apr May Jun Jul Aug Sep Oct Nov Dec -0.0 Minimum January &, A process has been created for System Operations engineers to forecast industrial load outside of Nostradamus and have it added to the forecast prior to presentation. Using the same software tool, System Operations engineers will be able to input an offset for any hour(s) of the seven-day forecast graph to reflect any information, including meteorology, losses or load, that they feel will not be accurately represented in the Nostradamus model... Database Changes Prior versions of Nostradamus used Excel and Access to import data into Nostradamus and to create tables and plots of the load forecast. The newer Nostradamus versions do not allow the use of Access and provide some improved techniques for data input and output so that Excel macros are no longer required. Newfoundland and Labrador Hydro Page
16 These software changes have no effect on the accuracy of the forecast, but work was required to ensure that data was being routinely input to the model and that forecasts could be obtained in the appropriate format for use by System Operations personnel.. Representation of System Losses 0 0 In considering the transmission losses on the Island Interconnected System, the transmission and generation configuration is important. Geographically, the hydroelectric generation is located in Bay d Espoir and west. The Holyrood Thermal Generating Station (HTGS) is located on the Avalon Peninsula in the east. The largest load center on the Island Interconnected System is located on the Avalon Peninsula. Consequently, under normal operation at time of peak with the HTGS on line, in close proximity to the largest load center, total transmission losses are minimized. Under existing loads and normal dispatch total transmission system losses during peak load conditions will equal 0 to megawatts (MW). During the January, 0 events it was found that the system losses exceeded the expected level, by approximately 0 to 0 MW because the generation dispatch on the Island was not typical for the period. In essence, with the full capacity of the HTGS not available, additional generation capacity off the Avalon Peninsula was required to supply Avalon load. Increasing the current flow over the longer transmission path resulted in increase transmission system losses. To assist the Short-Term load forecast process with representation of transmission system losses, Hydro has initiated an analysis of the transmission system loss variation on the Island Interconnected System for off nominal generation dispatches. Newfoundland and Labrador Hydro Page
17 0 0 This analysis included the following steps: Develop a set of base case load flows using typical generation dispatches. Load flow cases with system loads ranging from 00 MW to peak loads in 0 MW steps have been developed to capture the operating range of the three units at Holyrood. Tabulate the base case total transmission system losses. For each load flow case (e.g., 00 MW system load) remove one unit at Holyrood from service and replace with alternate generation. The available generation includes the new Holyrood CT (0 MW), Hardwoods and Stephenville CTs (0 MW each) and the 0 MW interruptible contract with Corner Brook Pulp and Paper. Two alternate generation replacement scenarios were considered for impact on losses. Scenario A considered replacement of the lost Holyrood unit capacity with Holyrood and Hardwoods CTs first followed by off Avalon generation. Scenario B considered replacement of the lost Holyrood unit capacity with Hardwoods and Stephenville CTs and the 0 MW interruptible contract. Tabulate the total transmission system losses for the contingency cases. Calculate the incremental transmission system losses due to the generation contingency and replacement generation scenario by subtracting the base case transmission system losses from the contingency transmission system losses. Repeat the load flow analysis for loss of two units at Holyrood to determine the incremental transmission system losses for this contingency. Repeat the incremental transmission loss analysis for 0 kv transmission lines contingencies east of Bay d Espoir using the approach described above. Tabulate the incremental losses versus system load for each contingency in a matrix. The analysis to determine incremental transmission system losses is underway. To date the base case losses and the Holyrood generation contingency outage losses have been determined. The outcome provides the incremental transmission system losses for the contingencies. Table provides the draft matrix for use in short term load forecasting to Newfoundland and Labrador Hydro Page
18 account for generation contingencies. Work continues to develop the incremental transmission system loss matrix for the 0 kv transmission line contingencies. The work will be complete before the last week in November. As noted in Section.., the new offset will allow the System Operations engineers to adjust the load forecast to reflect the changes in losses resulting from the different generation dispatch. Newfoundland and Labrador Hydro Page
19 Gross Island 0 Hz Generation MW Typical HRD Units Table 0 Transmission System Losses Matrix - DRAFT Holyrood Generating Unit Contingencies Base Case Losses MW Loss One HRD Unit Incremental MW Loss Two HRD Units Incremental MW N/A.. N/A.. N/A.. N/A 0. N/A N/A Notes:. Loss values are based upon 0 peak load distribution.. All loss values are net of Holyrood Station Service.. Loss of one 0 MW Holyrood unit with capacity made up by the Holyrood CT at 0 MW and Hardwoods CT at 0 MW results in approximately MW decrease in total transmission system losses due to the Hardwoods CT being located at the load center (Scenario A).. Loss of one 0 MW Holyrood unit with capacity made up of the Hardwoods and Stephenville 0 MW CTs and the 0 MW Corner Brook interruptible contract leaves the Holyrood CT in reserve with increase in transmission system losses as noted (Scenario B).. Loss of 0 MW capacity for the loss of two Holyrood units requires the startup of all standby thermal generation and the 0 MW interruptible contract.. Approach to Avalon and Island Forecasts Following the supply disruptions in January, changes have been made to the way the Hydro load is reported. There will no longer be a distinction between System (Hydro) load and Island Newfoundland and Labrador Hydro Page
20 0 (including Newfoundland Power and Corner Brook Pulp and Paper) load. Avalon load will still be presented separately as it is required for assessing the commitment of generating units at the Holyrood Thermal Generating Station. Secondly, Ventyx confirmed Hydro s decision to use Nostradamus to forecast utility, or conforming, load only. Nostradamus cannot forecast industrial load as it is not a function of weather. Appendix A describes in more detail how loads will now be defined and how forecasts will be prepared. Changes in the Energy Management System were required to facilitate these forecast model changes. Nostradamus will be used to forecast utility load and a forecast of industrial load will be added to the Nostradamus results prior to presentation. Default values will be used for industrial load, but System Operations personnel will be able to overwrite the default values if one or more hours of one or more industrial loads are expected to be atypical. Offsets to the default load could be based on information from customers or observation of historical trends in data. Newfoundland and Labrador Hydro Page
21 .0 MEDIUM TERM OPERATING LOAD FORECAST 0 0 Hydro s Medium-Term monthly load forecast for the 0/0 winter period predicted monthly peak loads consistently lower that actual experienced. Considerable analysis has been completed to identify the reason for this discrepancy and identify actions to improve the forecast. The following sections explain the findings.. Review of Winter 0/0 Weather Conditions Owing to the significant share of electric space heating systems on the Island Interconnected System, weather plays a prominent role in the magnitude of system peak demands across the winter months. Coincident with this past winter was a series of high and record breaking system peak loads on the Island Interconnected System. Hydro s review of these events concludes that the prevailing weather conditions during the winter of 0/0 were a significant contributor to both the system peaks and higher loads for all winter months in general. The weather can be summarized as follows: With respect to daily heating load requirements, the weather was substantially colder than the previous four winters and colder than the historical 0 year averages for the months of December, February and March. Peak demand weather conditions for the mid-december through the end of the Christmas holiday period were significantly colder than had been experienced in the past years and had not been as severe since. The peak demand weather conditions in January were more severe than average historical and P0 (0 th percentile) weather conditions and occurred earlier in the month than normal. Peak load weather conditions in February were less onerous than average historical peak weather conditions but were colder than had been experienced in the previous three years. As measured by heating degree days for St. John s, Gander and Stephenville weather stations. As measured by wind chill for St. John s, Gander and Stephenville weather stations. Newfoundland and Labrador Hydro Page
22 0 Peak load weather conditions in March were colder than had been experienced since and were equivalent to between an average and P0 (0 th percentile) weather condition. System winter peaks have historically occurred anytime in the December through March period and should be expected to continue to do so. This information will be provided to System Operations with future forecasts. Graphical presentations from which these conclusions have been drawn are provided in Appendix B.. Review of System Load during the Supply Disruption As weather conditions during the January 0 supply disruptions were consistent with average long term peak load weather conditions, it was important to quantify the peak loads that would have materialized on the system had supply disruptions not occurred. Quantifying the normalized peak demand for the period can also establish if unusual load events had occurred. The tables below present the estimated peak loads for both the Island Interconnected and NL Hydro systems on an actual weather (Table ) and normalized weather (Table ) basis. Newfoundland and Labrador Hydro Page
23 Table - Customer and System Peak Demand Estimates for January, 0 (MW) Island Interconnected System NLHydro System Newfoundland Power (NP) Hydro Rural Industrial NLH Transmission Losses Holyrood Station Service System Total Notes:. Peak demand estimates are at actual weather conditions.. NP and Hydro Rural peak demands include Christmas season load.. Transmission losses reflect 0 loads and normal supply dispatch. Table - Weather Normalized Customer and System Peak Demand Estimates for January, 0 (MW) Island Interconnected System NLHydro System Newfoundland Power (NP) 0 Hydro Rural Industrial NLH Transmission Losses Holyrood Station Service System Total Notes:. Normalized peak demand estimates are at average historical peak weather conditions.. NP and Hydro Rural peak demands include Christmas season load.. Transmission losses reflect 0 loads and normal supply dispatch. In the context of the Island Interconnected System, the utility loads of Newfoundland Power and Hydro Rural are considered weather dependent whereas industrial loads are considered Newfoundland and Labrador Hydro Page 0
24 0 0 non-weather dependent, or non-conforming. The following conclusions are based on Hydro s assessment of peak loads during the supply disruptions: Predicted utility peak loads of Newfoundland Power and Hydro Rural for the outage period were higher than had been forecast. This is explained by the earlier than expected onset of cold weather. The higher load requirements of Newfoundland Power during the outage period were consistent with the prevailing weather conditions coinciding with seasonal Christmas loads. Seasonal Christmas loads are estimated to be in the order of 0 to 0 MW. Industrial loads were lower than forecast because of lower demand at the nickel processing facilities at Long Harbour. The difference between the forecast and the actual combined winter peak demand for Newfoundland Power and Hydro Rural, on a weather normalized basis and after accounting for seasonal Christmas load was less than. percent.. Newfoundland Power Peak Demand Forecast Newfoundland Power s peak demand forecast is a key input to Hydro s five year monthly and forthcoming winter peak demand forecasts. The Newfoundland Power forecast methodology is detailed in Newfoundland Power s response to PUB-NP-00. Stemming from the current review and in order to provide Hydro s System Operators with improved information on Newfoundland Power peaks for a given winter peak season, Newfoundland Power were requested to provide a range to their baseline winter peak demand forecast. The results of Newfoundland Power s assessment can be summarized as follows: Average or expected Newfoundland Power winter peak demand can vary by plus or minus. percent. Actual peak demand could vary upwards by 0 MW during extreme cold weather conditions and downward by MW during mild weather. The average winter peak for 0/ could be MW higher or lower than forecast. Newfoundland and Labrador Hydro Page
25 0 0 This information will be taken into consideration in Hydro s winter peak demand forecasts and will be communicated to all forecast users.. Customer Coincidence Customer class coincidence factors are used by Hydro in its monthly forecast to determine the contribution of each customer class s peak to the overall system peak. The customer class coincidence factors used in Hydro s monthly forecasts are based on historical data records maintained by Hydro and are provided in Appendix C. Hydro has reviewed these historical coincidence factors and has made the following observations: The coincidence factors for Newfoundland Power and Hydro Rural have increased since the decline of the island industrial load associated with paper mill and paper machine closures. Coincidence factors are expected to be affected by the forecasted increase in industrial load associated with nickel processing at Long Harbour. Based on these observations Hydro has concluded that higher coincidence factors should apply to the utility demand forecasts for determining its forthcoming winter peak demand forecast and coincidence factors should be reviewed once industrial loads increase. It should be noted that the change in coincidence will increase the winter peak demand forecast by less than 0 MW. Newfoundland and Labrador Hydro Page
26 0 0.0 LONG TERM PLANNING FORECAST. Sensitivity Analysis in Load Forecasting A recommendation for Hydro s longer term load forecasting is the adoption of sensitivity analysis with respect to its baseline load forecasts. This practice would allow Hydro to better understand the generation and supply impacts associated with uncertain and differing load futures. In the past, Hydro had prepared alternative load forecast scenarios but had not regularly prepared formal sensitivity analysis of its load forecast. As well, Hydro s load forecasts were prepared on the basis of average historical weather conditions. Note that while the primary focus of the current review was with respect to winter peak demand forecasts, the recommendation to complete sensitivity analysis applies to both demand and energy forecasts. In response to this recommendation to date, Hydro has reviewed the inputs of its long term load forecasting process and identified the following key variables for load forecast sensitivity analysis. Weather, including wind chill and heating degree days. Growth and saturation of electric heat market share. Growth in utility end use customers. Adoption rates of end-use energy efficient technologies. Large industrial load. With respect to system peak demand supply planning, Hydro incorporated sensitivity analysis with its application for the new CT at Holyrood and considered the impact of P0 (0 th percentile) wind chill conditions on system peak demand. For all subsequent long term system planning analysis cycles, Hydro shall complete sensitivity analyses of the aforementioned variables and will consider the impact of P0 (0 th percentile) wind chill conditions for system peak demand planning purposes. Newfoundland and Labrador Hydro Page
27 0 0. Share of Residential Electric Heat Excluding the large load additions associated with nickel processing at Long Harbour, longer term load growth on the Island Interconnected System is sourced to growth of the Newfoundland Power customer base, whose load is highly influenced by the market share of electric heat within the residential customer class. Hydro s load forecast models predict electric heat customers based on the penetration of electric heat in new residential customers as well as conversions to and from electric heat in existing residential customers. Hydro has long understood that peak demand forecast accuracy for the Island Interconnected System is dependent on maintaining current information on the many factors impacting the market share of electric heat and understanding the impacts that electric heat has on its system peaks. Hydro maintains this information by: Collecting and maintaining databases of retail customers and electric heat penetration and conversion activity. Collecting and maintaining databases of retail energy prices. Monitoring of changes in space heating technologies. Customer surveys. Monitoring of other Canadian utilities. The Ventyx review of Hydro s long term load forecasting model recommended that Hydro continue to refine its models with respect to predicting the penetration of electric heat and the conversions to electric heat. In addition, it recommended that Hydro further enhances its understanding of the impacts of electric heat on the system through continued surveying of the customer base in terms of both average use and saturation of this end use. With respect to predicting the penetration of electric heat and the conversions to electric heat, Hydro has made minor improvements in its forecasting models for completion of its next long Except in extended periods of time with low fossil fuel prices, virtually all general service customer additions have electric heat based space heating systems installed as a primary heat source. Newfoundland and Labrador Hydro Page
28 0 0 term planning analysis and, as in the past, will seek additional improvements with each annual update of its models. With respect to further enhancing its understanding of the impacts of electric heat on the system, Hydro will complete its review of Newfoundland Power s recent customer survey and determine the requirement for a future Hydro customer survey.. Review of Historical Peak Weather Conditions Owing to the high market share of electric space heating within the utility end-use customer base, the Island Interconnected System peaks have generally occurred (in and around} the coldest winter days. Hydro s long term peak demand forecast for the Newfoundland Power system relies on Hydro s historical record of Newfoundland Power s system peaks to define the appropriate peak demand weather conditions for long term planning purposes. As part of this review and given the increased market share of electric heat on the Island Interconnected System, Hydro has recalculated its peak demand weather condition based on the coldest winter weather condition for each of the last 0 years. Appendix D includes a table of these weather conditions. The following summarizes the impact of this refined data assumption: The 0- year average peak demand weather condition is calculated to be -. o C and is approximately one degree colder than the previous planning assumption. The impact on Island Interconnected peak demand based on the recalculated average peak demand weather condition is less than 0 MW. As measured by the R coefficient of determination. Newfoundland and Labrador Hydro Page
29 .0 SUMMARY 0 0 In response to recommendations from internal reports and recommendations from Ventyx, the Liberty Group and the Public Utilities following the January 0 supply disruptions, Hydro undertook reviews of its short term hourly, monthly and long term planning forecasting methodologies and has made the following improvements. Short term Implemented a new version of Nostradamus Software, added training parameters, modified training and verification periods and increased frequency of forecasting (currently only on the Development environment but shortly to be moved to the Production environment). Modified the short term load forecasting procedure to forecast only conforming loads in Nostradamus and add industrial load in a later step, and to allow adjustment for unusual losses or other system conditions. Developed a system of adjusting the short term load forecast if system losses are expected to be unusual because of generation dispatch. Medium term The winter peak demand forecast will now communicate information from sensitivity analyses that includes expected peak demand ranges at average weather conditions and predicted peak demands associated with colder than normal weather conditions. Baseline transmission loss forecasts will now reflect current and any planned changes to system configurations. The medium term operating load forecast prepared in the fall will now provide System Operations with a winter peak demand forecast on a total Island system basis. Newfoundland and Labrador Hydro Page
30 0 Long term Hydro will use the re-calibrated historical wind chill values for forecasting system peak demands. Hydro will continue to research and refine its understanding of the system impacts of electric space heating. Sensitivity analysis of longer term load to key variables will be assessed at each planning cycle including an assessment of P0 (0 th percentile) wind chill for peak load. The effects of all of these improvements will be monitored through the winter of 0/ and reviewed in the spring to ensure that the expected improvements in accuracy have been achieved. Newfoundland and Labrador Hydro Page
31 APPENDIX A NEW HYDRO LOAD FORECASTING MODEL DEFINITIONS
32 Ongoing reviews of Newfoundland and Labrador Hydro System Operations following the supply disruptions in January 0 have identified an opportunity for improvement in the way that the load forecasts are discussed and presented. Hydro will no longer distinguish between System generation and Island generation (including Newfoundland Power and Corner Brook Pulp and Paper load and generation) all native load, irrespective of which entity meets the load, will be included in all future forecasts. Nostradamus will forecast Utility Load then (outside Nostradamus) Hydro will Estimate Industrial Load based on historic use and forecasts provided by industrial customers add forecasted Utility Load from Nostradamus to get Total Load Forecast In presentation of the load forecast, Hydro will no longer make any adjustments to the Total Load forecast to add or subtract expected wind or other nonutility generation. Hydro is responsible for meeting the Total Load and will meet it using all resources under its control, including non-utility generators and available wind. Changes are being made in the Automatic Generation Control (AGC) and Energy Management System processes and procedures to facilitate this manner of operating and reporting.
33 AVALON LOAD MODEL: Total Avalon Load is the sum of: Hardwoods generation Western Avalon TL0 and TL Newfoundland Power Generation on Avalon Holyrood generation Fermeuse Wind Industrial Avalon Load is Vale and Praxair on TL0 Avalon Utility Load is Total Avalon Load minus Industrial Avalon Load. Nostradamus will forecast Avalon Utility Load. Hydro will add an estimate of Industrial Load at Vale and Praxair, based on customer forecasts and operating information, to the Nostradamus estimate of Avalon Utility Load to get the Total Avalon Load Forecast. This change in the way the Avalon forecast is presented will necessitate a change in the way the Holyrood unit commitment thresholds are defined. In the past, only Hydro generation and load was considered, now the thresholds are required to include the generation from Newfoundland Power and the Fermeuse wind farm in order for them to be meaningfully compared with the Avalon load forecast.
34 ISLAND LOAD MODEL: Total Island Load is the sum of: Hydro gen including hydro and thermal including Exploits, wind, Corner Brook Pulp and Paper Cogeneration Total NP generation Deer Lake Power Generation Industrial Island is Vale and Praxair on TL0 Corner Brook Pulp and Paper at Massey Drive and Deer Lake North Atlantic Refinery at Come-by-chance T and T Aur Resources at Buchans Island Utility Load is Total Island Load minus Industrial Island Load. Nostradamus will forecast Island Utility Load. The estimated Industrial Island Load will be added to the Nostradamus estimate of Island Utility Load to get the Total Island Load Forecast. The Industrial Island Load forecast will be based on forecasts and other operating information provided by the industrial customers and observation of recent use.
35 APPENDIX B Comparison of 0 Weather Conditions to Historical Weather

36 Heating Degree Days - Island Weighted to 00 Normals Jan Feb Mar Dec


37

38
39 APPENDIX C Customer Coincidence Factors
40 Customer Coincidence Factors (C.F.) for Island Interconnected System Annual Peak Newfoundland Power Hydro Rural Industrial Year DD-MM Time NCP COP C.F. NCP COP C.F. NCP COP C.F. -Jan :00,00.%.% 00.0% Dec :00,0.%.% 0.0% 00 -Dec :00.%.% 0 00.% 00 -Jan :00,,0.%.% 0 0.% 00 -Feb :00, 00.0%.0% 0 0.% 00 -Dec :00,.%.%.% 00 -Jan :00,,.% 0.%.% 00 0-Dec :00,,0.%.% 0.% 00 -Jan :00,,.% 0.% 0.% 00 -Dec :00,,.0% 0 0.%.% 00 -Jan 0:00,, 00.0%.%.0% 00 -Feb :00,0,.% 00.0%.% 0 -Dec 0:00,, 00.0% 0.%.% 0 -Jan :00,, 00.0%.%.% 0 -Dec :00,, 00.0%.% 0.% Notes:. NCP - Non-coincident Peak MW. COP - Coincident Peak MW
41 APPENDIX D Historical Winter Wind Chill Values
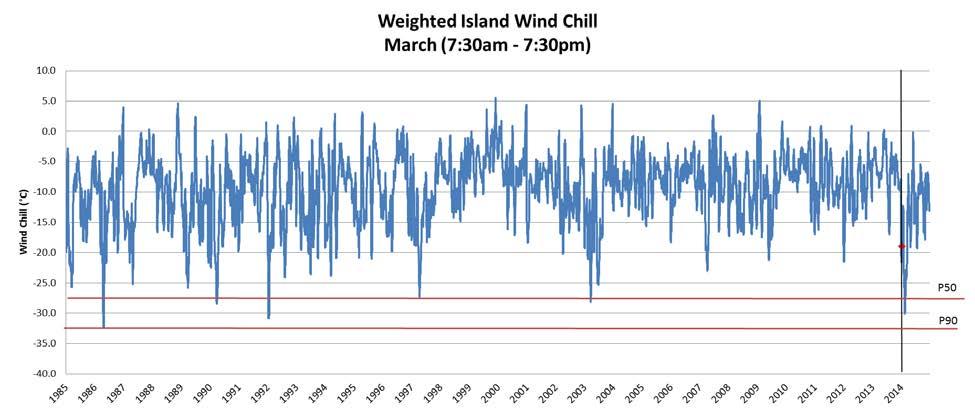
42 Historical Winter Wind Chill Values for the Island Interconnected System Winter of: Year of Occurance: Month Day Period Ending: Weighted Island Wind Chill ( o C Equivalent) December :0 -. March 0 :0 -. December 0:0 -. January :0 -.0 February : February : January :0 -. March :0-0. January 0 :0 -.0 February :0 -.0 January :0 -. January :0 -. March :0 -. January :0 -. January : February : February : January : February : February : February : January : January : January : January 0: February : February : March : January : March :0-0.0 P-0 -. P- -0. P-0 -. Notes:. Regional wind chills calculated from average 0 hour temperature and average hour wind speed ending between the hours of :0 AM and :0 PM.. Weighted Island wind chill calculated using 0 year end Newfoundland Power regional energy sales as weights.
Ms. Cheryl Blundon Director Corporate Services & Board Secretary
 Ai\I or newfoundland!abrader k hydro a nalcor energy company Hydro Place. 500 Columbus Drive. P.O. Box 12400. St. John's. NI. Canada Al 4K7 t. 709.737.1400 f. 709.737.1800 www.n1h.nl.ca May 13, 2015 The
Director Corporate Services & Board Secretary
 March, The Board of Commissioners of Public Utilities Prince Charles Building Torbay Road, P.O. Box 0 St. John s, NL AA B Attention: Ms. Cheryl Blundon Director Corporate Services & Board Secretary Dear
Load Forecasting at Newfoundland and Labrador Hydro Monthly Report: October 2015.
 \ I newfoundland labrador.hydro a nalcor energy company Hydro Place. 00 Columbus Drive. P.O. Box 00. St. John's. NI Canada AB ( t. 0..00 f. 0..00 www.nh.nl.ca November, 0 The Board of Commissioners of
Multivariate Regression Model Results
 Updated: August, 0 Page of Multivariate Regression Model Results 4 5 6 7 8 This exhibit provides the results of the load model forecast discussed in Schedule. Included is the forecast of short term system
2018 Annual Review of Availability Assessment Hours
 2018 Annual Review of Availability Assessment Hours Amber Motley Manager, Short Term Forecasting Clyde Loutan Principal, Renewable Energy Integration Karl Meeusen Senior Advisor, Infrastructure & Regulatory
Operations Report. Tag B. Short, Director South Region Operations. Entergy Regional State Committee (ERSC) February 14, 2018
 February 14, 2018") Operations Report Tag B. Short, Director South Region Operations Entergy Regional State Committee (ERSC) February 14, 2018 1 Winter Operations Highlights South Region Max Gen Event Regional Dispatch Transfer
Operations Report Tag B. Short, Director South Region Operations Entergy Regional State Committee (ERSC) February 14, 2018 1 Winter Operations Highlights South Region Max Gen Event Regional Dispatch Transfer
Defining Normal Weather for Energy and Peak Normalization
 Itron White Paper Energy Forecasting Defining Normal Weather for Energy and Peak Normalization J. Stuart McMenamin, Ph.D Managing Director, Itron Forecasting 2008, Itron Inc. All rights reserved. 1 Introduction
Outage Coordination and Business Practices
 Outage Coordination and Business Practices 1 2007 Objectives What drove the need for developing a planning/coordination process. Why outage planning/coordination is crucial and important. Determining what
Demand Estimation Sub-Committee. Seasonal Normal Review - Updated. 17 th December 2014
 Demand Estimation Sub-Committee Seasonal Normal Review - Updated 17 th December 2014 1 2 Introduction Seasonal Normal is the gas industry benchmark of what constitutes "typical" weather conditions, and
peak half-hourly Tasmania
 Forecasting long-term peak half-hourly electricity demand for Tasmania Dr Shu Fan B.S., M.S., Ph.D. Professor Rob J Hyndman B.Sc. (Hons), Ph.D., A.Stat. Business & Economic Forecasting Unit Report for
peak half-hourly New South Wales
 Forecasting long-term peak half-hourly electricity demand for New South Wales Dr Shu Fan B.S., M.S., Ph.D. Professor Rob J Hyndman B.Sc. (Hons), Ph.D., A.Stat. Business & Economic Forecasting Unit Report
NSP Electric - Minnesota Annual Report Peak Demand and Annual Electric Consumption Forecast
 Page 1 of 5 7610.0320 - Forecast Methodology NSP Electric - Minnesota Annual Report Peak Demand and Annual Electric Consumption Forecast OVERALL METHODOLOGICAL FRAMEWORK Xcel Energy prepared its forecast
PRELIMINARY DRAFT FOR DISCUSSION PURPOSES
 Memorandum To: David Thompson From: John Haapala CC: Dan McDonald Bob Montgomery Date: February 24, 2003 File #: 1003551 Re: Lake Wenatchee Historic Water Levels, Operation Model, and Flood Operation This
CAISO Participating Intermittent Resource Program for Wind Generation
 CAISO Participating Intermittent Resource Program for Wind Generation Jim Blatchford CAISO Account Manager Agenda CAISO Market Concepts Wind Availability in California How State Supports Intermittent Resources
Demand Forecasting Models
 E 2017 PSE Integrated Resource Plan Demand Forecasting Models This appendix describes the econometric models used in creating the demand forecasts for PSE s 2017 IRP analysis. Contents 1. ELECTRIC BILLED
FINAL REPORT EVALUATION REVIEW OF TVA'S LOAD FORECAST RISK
 Memorandum from the Office of the Inspector General Robert Irvin, WT 9C-K FINAL REPORT EVALUATION 2012-14507 REVIEW OF TVA'S LOAD FORECAST RISK As part of a series of reviews to evaluate the Tennessee
Monthly Long Range Weather Commentary Issued: APRIL 1, 2015 Steven A. Root, CCM, President/CEO
 Monthly Long Range Weather Commentary Issued: APRIL 1, 2015 Steven A. Root, CCM, President/CEO sroot@weatherbank.com FEBRUARY 2015 Climate Highlights The Month in Review The February contiguous U.S. temperature
TRANSMISSION BUSINESS LOAD FORECAST AND METHODOLOGY
 Filed: September, 00 EB-00-00 Tab Schedule Page of 0 TRANSMISSION BUSINESS LOAD FORECAST AND METHODOLOGY.0 INTRODUCTION 0 This exhibit discusses Hydro One Networks transmission system load forecast and
Introduction to Forecasting
 Introduction to Forecasting Introduction to Forecasting Predicting the future Not an exact science but instead consists of a set of statistical tools and techniques that are supported by human judgment
NASA Products to Enhance Energy Utility Load Forecasting
 NASA Products to Enhance Energy Utility Load Forecasting Erica Zell, Battelle zelle@battelle.org, Arlington, VA ESIP 2010 Summer Meeting, Knoxville, TN, July 20-23 Project Overview Funded by the NASA Applied
EVALUATION OF ALGORITHM PERFORMANCE 2012/13 GAS YEAR SCALING FACTOR AND WEATHER CORRECTION FACTOR
 EVALUATION OF ALGORITHM PERFORMANCE /3 GAS YEAR SCALING FACTOR AND WEATHER CORRECTION FACTOR. Background The annual gas year algorithm performance evaluation normally considers three sources of information
WEATHER NORMALIZATION METHODS AND ISSUES. Stuart McMenamin Mark Quan David Simons
 WEATHER NORMALIZATION METHODS AND ISSUES Stuart McMenamin Mark Quan David Simons Itron Forecasting Brown Bag September 17, 2013 Please Remember» Phones are Muted: In order to help this session run smoothly,
13 SHADOW FLICKER Introduction Methodology
 Table of contents 13 SHADOW FLICKER... 13-1 13.1 Introduction... 13-1 13.2 Methodology... 13-1 13.2.1 Factors Influencing Shadow Flicker Occurrence... 13-2 13.2.2 Shadow Flicker Analysis Methodology...
2001 ANNUAL REPORT on INTERBASIN TRANSFERS for RTP South and the Towns of Cary, Apex, and Morrisville
 2001 ANNUAL REPORT on INTERBASIN TRANSFERS for RTP South and the Towns of Cary, Apex, and Morrisville Prepared for: Town of Cary Town of Apex Town of Morrisville RTP South/Wake County Submitted to: North
STATISTICAL FORECASTING and SEASONALITY (M. E. Ippolito; )
") STATISTICAL FORECASTING and SEASONALITY (M. E. Ippolito; 10-6-13) PART I OVERVIEW The following discussion expands upon exponential smoothing and seasonality as presented in Chapter 11, Forecasting, in
STATISTICAL FORECASTING and SEASONALITY (M. E. Ippolito; 10-6-13) PART I OVERVIEW The following discussion expands upon exponential smoothing and seasonality as presented in Chapter 11, Forecasting, in
The North American Electric Reliability Corporation hereby submits Informational Filing of the North American Electric Reliability Corporation.
 !! January 19, 2016 VIA ELECTRONIC FILING Jim Crone Director, Energy Division Manitoba Innovation, Energy and Mines 1200-155 Carlton Street Winnipeg MB R3C 3H8 Re: North American Electric Reliability Corporation
Memo. I. Executive Summary. II. ALERT Data Source. III. General System-Wide Reporting Summary. Date: January 26, 2009 To: From: Subject:
 Memo Date: January 26, 2009 To: From: Subject: Kevin Stewart Markus Ritsch 2010 Annual Legacy ALERT Data Analysis Summary Report I. Executive Summary The Urban Drainage and Flood Control District (District)
Project No India Basin Shadow Study San Francisco, California, USA
 Project No. 432301 India Basin Shadow Study San Francisco, California, USA Numerical Modelling Studies 04 th June 2018 For Build Inc. Report Title: India Basin Shadow Study San Francisco, California, USA
Demand Forecasting Reporting Period: 4 th Dec th Mar 2018
 N A T I O N A L G R I D P A G E 1 O F 25 C O M M E R C I A L, E L E C T R I C I T Y C O M M E R C I A L O P E R A T I O N S Demand Forecasting Reporting Period: 4 th Dec 2017 11 th Mar 2018 EXECUTIVE SUMMARY
Four Basic Steps for Creating an Effective Demand Forecasting Process
 Four Basic Steps for Creating an Effective Demand Forecasting Process Presented by Eric Stellwagen President & Cofounder Business Forecast Systems, Inc. estellwagen@forecastpro.com Business Forecast Systems,
Determine the trend for time series data
 Extra Online Questions Determine the trend for time series data Covers AS 90641 (Statistics and Modelling 3.1) Scholarship Statistics and Modelling Chapter 1 Essent ial exam notes Time series 1. The value
Winter Season Resource Adequacy Analysis Status Report
 Winter Season Resource Adequacy Analysis Status Report Tom Falin Director Resource Adequacy Planning Markets & Reliability Committee October 26, 2017 Winter Risk Winter Season Resource Adequacy and Capacity
RTO Winter Resource Adequacy Assessment Status Report
 RTO Winter Resource Adequacy Assessment Status Report RAAS 03/31/2017 Background Analysis performed in response to Winter Season Resource Adequacy and Capacity Requirements problem statement. Per CP rules,
Demand Forecasting Reporting Period: 19 st Jun th Sep 2017
 N A T I O N A L G R I D P A G E 1 O F 21 C O M M E R C I A L, E L E C T R I C I T Y C O M M E R C I A L O P E R A T I O N S Demand Forecasting Reporting Period: 19 st Jun 2017 10 th Sep 2017 EXECUTIVE
Summary of Seasonal Normal Review Investigations. DESC 31 st March 2009
 Summary of Seasonal Normal Review Investigations DESC 31 st March 9 1 Introduction to the Seasonal Normal Review The relationship between weather and NDM demand is key to a number of critical processes
Monthly Long Range Weather Commentary Issued: February 15, 2015 Steven A. Root, CCM, President/CEO
 Monthly Long Range Weather Commentary Issued: February 15, 2015 Steven A. Root, CCM, President/CEO sroot@weatherbank.com JANUARY 2015 Climate Highlights The Month in Review During January, the average
Peterborough Distribution Inc Ashburnham Drive, PO Box 4125, Station Main Peterborough ON K9J 6Z5
 Peterborough Distribution Inc. 1867 Ashburnham Drive, PO Box 4125, Station Main Peterborough ON K9J 6Z5 November 15, 2017 Ontario Energy Board PO Box 2319 27 th Floor, 2300 Yonge St Toronto ON M4P 1E4
2018 FORECAST ACCURACY BENCHMARKING SURVEY AND ENERGY TRENDS. Mark Quan
 2018 FORECAST ACCURACY BENCHMARKING SURVEY AND ENERGY TRENDS Mark Quan Please Remember» Phones are Muted: In order to help this session run smoothly, your phones are muted.» Full Screen Mode: To make the
SOUTH AUSTRALIAN WIND STUDY REPORT SOUTH AUSTRALIAN ADVISORY FUNCTIONS
 SOUTH AUSTRALIAN WIND STUDY REPORT SOUTH AUSTRALIAN ADVISORY FUNCTIONS Published: October 2015 IMPORTANT NOTICE Purpose The purpose of this publication is to provide information about wind generation in
2019 Settlement Calendar for ASX Cash Market Products. ASX Settlement
 2019 Settlement Calendar for ASX Cash Market Products ASX Settlement Settlement Calendar for ASX Cash Market Products 1 ASX Settlement Pty Limited (ASX Settlement) operates a trade date plus two Business
Gorge Area Demand Forecast. Prepared for: Green Mountain Power Corporation 163 Acorn Lane Colchester, Vermont Prepared by:
 Exhibit Petitioners TGC-Supp-2 Gorge Area Demand Forecast Prepared for: Green Mountain Power Corporation 163 Acorn Lane Colchester, Vermont 05446 Prepared by: Itron, Inc. 20 Park Plaza, Suite 910 Boston,
Monthly Magnetic Bulletin
 BRITISH GEOLOGICAL SURVEY Ascension Island Observatory Monthly Magnetic Bulletin December 2008 08/12/AS Crown copyright; Ordnance Survey ASCENSION ISLAND OBSERVATORY MAGNETIC DATA 1. Introduction Ascension
DESC Technical Workgroup. CWV Optimisation Production Phase Results. 17 th November 2014
 DESC Technical Workgroup CWV Optimisation Production Phase Results 17 th November 2014 1 2 Contents CWV Optimisation Background Trial Phase Production Phase Explanation of Results Production Phase Results
Summary of Seasonal Normal Review Investigations CWV Review
 Summary of Seasonal Normal Review Investigations CWV Review DESC 31 st March 2009 1 Contents Stage 1: The Composite Weather Variable (CWV) An Introduction / background Understanding of calculation Stage
Report on System-Level Estimation of Demand Response Program Impact
 Report on System-Level Estimation of Demand Response Program Impact System & Resource Planning Department New York Independent System Operator April 2012 1 2 Introduction This report provides the details
Wind Resource Data Summary Cotal Area, Guam Data Summary and Transmittal for December 2011
 Wind Resource Data Summary Cotal Area, Guam Data Summary and Transmittal for December 2011 Prepared for: GHD Inc. 194 Hernan Cortez Avenue 2nd Floor, Ste. 203 Hagatna, Guam 96910 January 2012 DNV Renewables
FORECAST ACCURACY REPORT 2017 FOR THE 2016 NATIONAL ELECTRICITY FORECASTING REPORT
 FORECAST ACCURACY REPORT 2017 FOR THE 2016 NATIONAL ELECTRICITY FORECASTING REPORT Published: November 2017 Purpose The National Electricity Rules (Rules) require AEMO to report to the Reliability Panel
EBS IT Meeting July 2016
 EBS IT Meeting 18 19 July 2016 Conference Call Details Conference call: UK Numbers Tel: 0808 238 9819 or Tel: 0207 950 1251 Participant code: 4834 7876... Join online meeting https://meet.nationalgrid.com/antonio.delcastillozas/hq507d31
8.1 Attachment 1: Ambient Weather Conditions at Jervoise Bay, Cockburn Sound
 8.1 Attachment 1: Ambient Weather Conditions at Jervoise Bay, Cockburn Sound Cockburn Sound is 20km south of the Perth-Fremantle area and has two features that are unique along Perth s metropolitan coast
Project Appraisal Guidelines
 Project Appraisal Guidelines Unit 16.2 Expansion Factors for Short Period Traffic Counts August 2012 Project Appraisal Guidelines Unit 16.2 Expansion Factors for Short Period Traffic Counts Version Date
Implementation Status & Results Burkina Faso TRANSPORT SECTOR PROJECT (P074030)
") losure Authorized Public Disclosure Authorized Public Disclosure Authorized Public Disclosure Authorized Implementation Status & Results Burkina Faso TRANSPORT SECTOR PROJECT (P074030) Operation Name:
losure Authorized Public Disclosure Authorized Public Disclosure Authorized Public Disclosure Authorized Implementation Status & Results Burkina Faso TRANSPORT SECTOR PROJECT (P074030) Operation Name:
Into Avista s Electricity Forecasts. Presented by Randy Barcus Avista Chief Economist Itron s Energy Forecaster s Group Meeting
 Incorporating Global Warming Into Avista s Electricity Forecasts Presented by Randy Barcus Avista Chief Economist Itron s Energy Forecaster s Group Meeting May 1, 009 Las Vegas, Nevada Presentation Outline
Monthly Long Range Weather Commentary Issued: APRIL 18, 2017 Steven A. Root, CCM, Chief Analytics Officer, Sr. VP,
 Monthly Long Range Weather Commentary Issued: APRIL 18, 2017 Steven A. Root, CCM, Chief Analytics Officer, Sr. VP, sroot@weatherbank.com MARCH 2017 Climate Highlights The Month in Review The average contiguous
MONTE CARLO SIMULATION RISK ANALYSIS AND ITS APPLICATION IN MODELLING THE INCLEMENT WEATHER FOR PROGRAMMING CIVIL ENGINEERING PROJECTS
 MONTE CARLO SIMULATION RISK ANALYSIS AND ITS APPLICATION IN MODELLING THE INCLEMENT WEATHER FOR PROGRAMMING CIVIL ENGINEERING PROJECTS Pedram Daneshmand Associate Director Blue Visions Management (bluevisions)
Published by ASX Settlement Pty Limited A.B.N Settlement Calendar for ASX Cash Market Products
 Published by Pty Limited A.B.N. 49 008 504 532 2012 Calendar for Cash Market Products Calendar for Cash Market Products¹ Pty Limited ( ) operates a trade date plus three Business (T+3) settlement discipline
Chiang Rai Province CC Threat overview AAS1109 Mekong ARCC
 Chiang Rai Province CC Threat overview AAS1109 Mekong ARCC This threat overview relies on projections of future climate change in the Mekong Basin for the period 2045-2069 compared to a baseline of 1980-2005.
2017 Settlement Calendar for ASX Cash Market Products ASX SETTLEMENT
 2017 Settlement Calendar for ASX Cash Market Products ASX SETTLEMENT Settlement Calendar for ASX Cash Market Products 1 ASX Settlement Pty Limited (ASX Settlement) operates a trade date plus two Business
2015 Fall Conditions Report
 2015 Fall Conditions Report Prepared by: Hydrologic Forecast Centre Date: December 21 st, 2015 Table of Contents Table of Figures... ii EXECUTIVE SUMMARY... 1 BACKGROUND... 2 SUMMER AND FALL PRECIPITATION...
A Report on a Statistical Model to Forecast Seasonal Inflows to Cowichan Lake
 A Report on a Statistical Model to Forecast Seasonal Inflows to Cowichan Lake Prepared by: Allan Chapman, MSc, PGeo Hydrologist, Chapman Geoscience Ltd., and Former Head, BC River Forecast Centre Victoria
EIA411 May 1, A Report to the Office of Energy Emergency Operations Department of Energy Under EIA-411
 EIA411 May 1, 2006 A Report to the Office of Energy Emergency Operations Department of Energy Under EIA-411 All questions concerning this data should be directed to: Jason Speer Southwest Power Pool 415
Chapter 3. Regression-Based Models for Developing Commercial Demand Characteristics Investigation
 Chapter Regression-Based Models for Developing Commercial Demand Characteristics Investigation. Introduction Commercial area is another important area in terms of consume high electric energy in Japan.
Ontario Demand Forecast
 Ontario Demand Forecast DECEMBER 12, 2017 December 12, 2017 Public Page i Executive Summary The IESO is responsible for forecasting electricity demand in Ontario and for assessing whether transmission
CWV Review London Weather Station Move
 CWV Review London Weather Station Move 6th November 26 Demand Estimation Sub-Committee Background The current composite weather variables (CWVs) for North Thames (NT), Eastern (EA) and South Eastern (SE)
Produced by Canadian Ice Service of. 2 December Seasonal Outlook Gulf of St Lawrence and East Newfoundland Waters Winter
 Environment Canada Environnement Canada Produced by Canadian Ice Service of Environment Canada 2 December 2010 Seasonal Outlook Gulf of St Lawrence and East Newfoundland Waters Winter 2010-2011 2010 Canadian
Comparison of Particulate Monitoring Methods at Fort Air Partnership Monitoring Stations
 Comparison of Particulate Monitoring Methods at Fort Air Partnership Monitoring Stations Melanie Larsen Harry Benders RS Environmental (Tom Dann) March 13, 2014 Executive Summary Historically FAP has acquired
Statement of indicative wholesale water charges and charges scheme
 Statement of indicative wholesale water charges and charges scheme 2019-2020 South Staffs Water and Cambridge Water Indicative Wholesale Charges Scheme Since April 2017, eligible business customers have
Cost of Inflow Forecast Uncertainty for Day Ahead Hydropower Production Scheduling
 Cost of Inflow Forecast Uncertainty for Day Ahead Hydropower Production Scheduling HEPEX 10 th University Workshop June 25 th, 2014 NOAA Center for Weather and Climate Thomas D. Veselka and Les Poch Argonne
SYSTEM BRIEF DAILY SUMMARY
 SYSTEM BRIEF DAILY SUMMARY * ANNUAL MaxTemp NEL (MWH) Hr Ending Hr Ending LOAD (PEAK HOURS 7:00 AM TO 10:00 PM MON-SAT) ENERGY (MWH) INCREMENTAL COST DAY DATE Civic TOTAL MAXIMUM @Max MINIMUM @Min FACTOR
Design of a Weather-Normalization Forecasting Model
 Design of a Weather-Normalization Forecasting Model Final Briefing 09 May 2014 Sponsor: Northern Virginia Electric Cooperative Abram Gross Jedidiah Shirey Yafeng Peng OR-699 Agenda Background Problem Statement
Renewables and the Smart Grid. Trip Doggett President & CEO Electric Reliability Council of Texas
 Renewables and the Smart Grid Trip Doggett President & CEO Electric Reliability Council of Texas North American Interconnected Grids The ERCOT Region is one of 3 North American grid interconnections. The
Estimation of Energy Demand Taking into Account climate change in Southern Québec
 Estimation of Energy Demand Taking into Account climate change in Southern Québec Diane Chaumont Ouranos In collaboration with René Roy 1, Barbara Casati 2, Ramon de Elia 2, Marco Braun 2 IREQ 1, Ouranos
Three main areas of work:
 Task 2: Climate Information 1 Task 2: Climate Information Three main areas of work: Collect historical and projected weather and climate data Conduct storm surge and wave modeling, sea-level rise (SLR)
SYSTEM BRIEF DAILY SUMMARY
 SYSTEM BRIEF DAILY SUMMARY * ANNUAL MaxTemp NEL (MWH) Hr Ending Hr Ending LOAD (PEAK HOURS 7:00 AM TO 10:00 PM MON-SAT) ENERGY (MWH) INCREMENTAL COST DAY DATE Civic TOTAL MAXIMUM @Max MINIMUM @Min FACTOR
February 10, Mr. Jeff Smith, Chairman Imperial Valley Water Authority E County Road 1000 N Easton, IL Dear Chairman Smith:
 February 1, 1 Mr. Jeff Smith, Chairman Imperial Valley Water Authority 8 E County Road 1 N Easton, IL Dear Chairman Smith: The Illinois State Water Survey (ISWS), under contract to the Imperial Valley
SEPTEMBER 2013 REVIEW
 Monthly Long Range Weather Commentary Issued: October 21, 2013 Steven A. Root, CCM, President/CEO sroot@weatherbank.com SEPTEMBER 2013 REVIEW Climate Highlights The Month in Review The average temperature
Prepared by the North American Ice Service. 4 December Seasonal Outlook Great Lakes Winter
 Prepared by the North American Ice Service A collaboration of the Canadian Ice Service and the National/Naval Ice Center 4 December 2008 Seasonal Outlook Great Lakes Winter 2008-2009 - 1 - Table of contents
MISO September 15 Maximum Generation Event Overview. October 11, 2018
 MISO September 15 Maximum Generation Event Overview October 11, 2018 Purpose & Key Takeaways Purpose: Summarize operations during the September 15 South Region Maximum Generation Event Key Takeaways: MISO
Monthly Magnetic Bulletin
 BRITISH GEOLOGICAL SURVEY Port Stanley Observatory Monthly Magnetic Bulletin December 2007 07/12/PS Jason Islands a ar C West Falkland Kin gg eor ge B Port Salavador ay Weddell Island Mount Osborne So
Champaign-Urbana 1999 Annual Weather Summary
 Champaign-Urbana 1999 Annual Weather Summary ILLINOIS STATE WATER SURVEY 2204 Griffith Dr. Champaign, IL 61820 wxobsrvr@sws.uiuc.edu Maria Peters, Weather Observer A major snowstorm kicked off the new
Abram Gross Yafeng Peng Jedidiah Shirey
 Abram Gross Yafeng Peng Jedidiah Shirey Contents Context Problem Statement Method of Analysis Forecasting Model Way Forward Earned Value NOVEC Background (1 of 2) Northern Virginia Electric Cooperative
Draft Wholesale Power Price Forecasts
 Sixth & Electric Power Plan Draft Wholesale Power Price Forecasts Maury Galbraith Generating Resource Advisory Committee Meeting Portland, OR December 18, 28 Outline 1. Overall Perspective: Major AURORA
APPENDIX 7.4 Capacity Value of Wind Resources
 APPENDIX 7.4 Capacity Value of Wind Resources This page is intentionally left blank. Capacity Value of Wind Resources In analyzing wind resources, it is important to distinguish the difference between
WIND DATA REPORT FOR THE YAKUTAT JULY 2004 APRIL 2005
 WIND DATA REPORT FOR THE YAKUTAT JULY 2004 APRIL 2005 Prepared on July 12, 2005 For Bob Lynette 212 Jamestown Beach Lane Sequim WA 98382 By John Wade Wind Consultant LLC 2575 NE 32 nd Ave Portland OR 97212
March 5, British Columbia Utilities Commission 6 th Floor, 900 Howe Street Vancouver, BC V6Z 2N3
 Tom A. Loski Chief Regulatory Officer March 5, 2010 British Columbia Utilities Commission 6 th Floor, 900 Howe Street Vancouver, BC V6Z 2N3 16705 Fraser Highway Surrey, B.C. V4N 0E8 Tel: (604) 592-7464
CIMA Professional
 CIMA Professional 201819 Manchester Interactive Timetable Version 3.1 Information last updated 12/10/18 Please note: Information and dates in this timetable are subject to change. A better way of learning
CIMA Professional
 CIMA Professional 201819 Birmingham Interactive Timetable Version 3.1 Information last updated 12/10/18 Please note: Information and dates in this timetable are subject to change. A better way of learning
WIND DATA REPORT. Vinalhaven
 WIND DATA REPORT Vinalhaven July 1, 2004 September 30, 2004 Prepared for Fox Islands Electric Cooperative By Melissa L. Ray Anthony L. Rogers April 4, 2005 Renewable Energy Research Laboratory 160 Governors
AREP GAW. AQ Forecasting
 AQ Forecasting What Are We Forecasting Averaging Time (3 of 3) PM10 Daily Maximum Values, 2001 Santiago, Chile (MACAM stations) 300 Level 2 Pre-Emergency Level 1 Alert 200 Air Quality Standard 150 100
Monthly Magnetic Bulletin
 BRITISH GEOLOGICAL SURVEY Port Stanley Observatory Monthly Magnetic Bulletin July 2011 11/07/PS Jason Islands West Falkland King George Bay Queen Charlotte Bay Weddell Island Caracass Island Saunders Island
Evapo-transpiration Losses Produced by Irrigation in the Snake River Basin, Idaho
 Nov 7, 2007 DRAFT Evapo-transpiration Losses Produced by Irrigation in the Snake River Basin, Idaho Wendell Tangborn and Birbal Rana HyMet Inc. Vashon Island, WA Abstract An estimated 8 MAF (million acre-feet)
In the Matter of Emergency Regulation of the Level of
 INTERNATIONAL JOINT COMMISSION In the Matter of Emergency Regulation of the Level of Rainy Lake and of other Boundary Waters in the Rainy Lake Watershed. Supplementary Order to the Order Prescribing Method
Lecture Prepared By: Mohammad Kamrul Arefin Lecturer, School of Business, North South University
 Lecture 15 20 Prepared By: Mohammad Kamrul Arefin Lecturer, School of Business, North South University Modeling for Time Series Forecasting Forecasting is a necessary input to planning, whether in business,
Changing Hydrology under a Changing Climate for a Coastal Plain Watershed
 Changing Hydrology under a Changing Climate for a Coastal Plain Watershed David Bosch USDA-ARS, Tifton, GA Jeff Arnold ARS Temple, TX and Peter Allen Baylor University, TX SEWRU Objectives 1. Project changes
elgian energ imports are managed using forecasting software to increase overall network e 칁 cienc.
 Elia linemen install Ampacimon real time sensors that will communicate with the dynamic thermal ratings software to control energy import levels over this transmission line. OV RH AD TRAN MI ION D namic
Short-Term Demand Forecasting Methodology for Scheduling and Dispatch
 Short-Term Demand Forecasting Methodology for Scheduling and Dispatch V1.0 March 2018 Table of Contents 1 Introduction... 3 2 Historical Jurisdictional Demand Data... 3 3 EMS Demand Forecast... 4 3.1 Manual
peak half-hourly South Australia
 Forecasting long-term peak half-hourly electricity demand for South Australia Dr Shu Fan B.S., M.S., Ph.D. Professor Rob J Hyndman B.Sc. (Hons), Ph.D., A.Stat. Business & Economic Forecasting Unit Report
WIND DATA REPORT. Vinalhaven
 WIND DATA REPORT Vinalhaven April 1, 2004 June 30, 2004 Prepared for Fox Islands Electric Cooperative By Melissa L. Ray Anthony L. Rogers April 4, 2005 Renewable Energy Research Laboratory 160 Governors
Energy and demand projections
 Chapter 2: Energy and demand projections 2.1 Overview 2.2 Customer consultation 2.3 Demand forecast outlook 2.4 Zone forecasts 2.5 Daily and annual load profiles 2 Energy and demand projections Key highlights
Bringing Renewables to the Grid. John Dumas Director Wholesale Market Operations ERCOT
 Bringing Renewables to the Grid John Dumas Director Wholesale Market Operations ERCOT 2011 Summer Seminar August 2, 2011 Quick Overview of ERCOT The ERCOT Market covers ~85% of Texas overall power usage
The Climate of Murray County
 The Climate of Murray County Murray County is part of the Crosstimbers. This region is a transition between prairies and the mountains of southeastern Oklahoma. Average annual precipitation ranges from