Demand Forecasting Reporting Period: 19 st Jun th Sep 2017
|
|
|
- Jordan Lynch
- 5 years ago
- Views:
Transcription
1 N A T I O N A L G R I D P A G E 1 O F 21 C O M M E R C I A L, E L E C T R I C I T Y C O M M E R C I A L O P E R A T I O N S Demand Forecasting Reporting Period: 19 st Jun th Sep 2017 EXECUTIVE SUMMARY This report provides an overview of national demand, solar and wind forecast errors during the period between the 19 th of June 2017 and the 10 th of September 2017, and the work currently underway by National Grid to reduce these errors. The magnitude of these errors is discussed at the different lead times of within day, day ahead, 2-14days ahead, and 2-52 weeks ahead. INTRODUCTION Under section 4H of the Transmission Licence, National Grid is obliged to publish a quarterly report describing our demand, wind and solar generation forecasts from within-day to 52 weeks ahead. We are also required to describe the actions that we have taken that have affected forecast errors and an analysis of the causes and future actions to reduce these errors. This quarterly report contains an overview of the differences between national demand, wind and solar forecasts and their outturns with different lead-in times during the reporting period 19 th of June to 10 th September Some key demand outturns of the reporting period are given in the table below Key Numbers Date Half hour Peak demand 35.4 GW 6 th Sep Overnight minimum 16.7 GW 02 nd Jul Daytime minimum 20.3 GW 02 nd Jul Maximum PV Output 8.3 GW 17 th Jul The overnight minimum demand was the second lowest ever observed, and the maximum PV output was the second highest ever observed. At the end of the period, installed generation capacities for wind and solar generation reached 28.6GW. This is 1.1GW higher than reached at the end of the previous quarter th June th September
2 Generation Type Metered Wind Embedded Wind Embedded Solar Total Wind & Solar Capacity 10.9 GW 5.3 GW 12.4 GW 28.6 GW This report mainly focuses on the national electricity demand (national demand/indo equivalent) forecasts and its major components: Embedded PV generation Metered- and embedded wind generation Weather forecast input data Furthermore, work to improve forecasts is highlighted. Special attention is paid to incentivised forecasts, made one, two and seven days ahead. DEMAND FORECAST ERRORS We produce forecasts at multiple time horizons, from within day up to five years ahead. Overall we would typically produce over 100 forecasts for the peak demand on a particular day over the preceding five years. In this report special attention is paid to forecasts made one, two and seven days beforehand. These forecasts are subject to OFGEM s demand forecasting incentive scheme. Forecasts at greater than 14 days ahead are based on seasonal average weather, while those from within day to 13 days ahead use the latest available weather forecasts. It should be noted that most weather forecast models run from 0 to 6 days ahead, and that the accuracy of weather forecasts declines significantly from 7 to 13 days ahead. The table below shows the mean absolute error by cardinal points and by forecast lead-time. The forecast range stretches from in-day forecasts to 13 days ahead. With forecast lead-time increasing (i.e. a forecast projecting further into the future), the errors grow. The smallest errors are found the in the night, closest to real time. Daytime errors are larger and increase more with increasing forecast lead time. 2

3 The major components of demand forecast and hence demand forecast errors are explained in detail in Appendix 1 Sources of demand forecast error. The graphs below show how the mean absolute error in the cardinal point forecasts changes with forecast horizon from 0 to 13 days ahead. The data is broken into forecasts for the daytime, evening and overnight cardinal points. The data shows that the errors increase at greater time horizons, and that daytime errors are significantly higher than those for late evening and overnight when solar generation is not an issue. 3
4 I N C EN T I VI SED D EM AN D F O R EC AST S This section of the report shows a comparison between the previous quarter (Qtr-1 2 ) and the current quarter (Qtr-2 3 ) for the incentivised demand forecasts, i.e. day ahead, 2 day ahead and 7 day ahead. Since the beginning of the incentive year, we are improving the accuracy of our forecast and have reduced our mean absolute errors for each forecast horizon. The graph below depicts quarterly MAE for each of the timescales. 2 Qtr-1 1 st April th June Qtr-2 1 st July th Sept
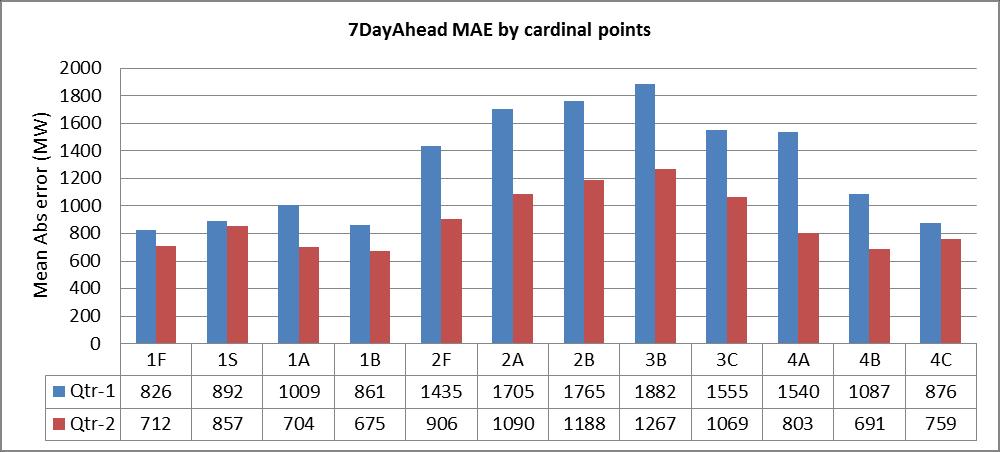
5 5
6 The below graph depicts count of number of errors above 1000MW since 1 st April It should be noted that the data for September 4 only covers 10 days. 4 Sept-17 data is up to end of reporting period 10 th Sept 17 6
7 2-52 WEEKS AHEAD DEMAND FORECASTS The graph below shows our 2-52 weeks ahead peak national demand forecasts published in June 2016 on the BMRS website for the reporting period 19 th June 10 th September 17. These forecasts are based on seasonal average weather. The below graph compares our forecasts with both weather corrected demands and actual demands. For the reporting period as a whole, the average mean absolute error was 1.1 GW, compared to 1.3 GW during previous quarter. The maximum error of actual demand was 3.7 GW compared to 5.0 GW during the previous quarter. The maximum error on the weather corrected basis was 3.7 GW compared to 3.3 during previous quarter. 7
 5 and the installed solar generation capacity.")
8 EMBEDDED PV During the previous quarter, solar generation capacity increased from 12.0GW in June 17 to 12.4GW in Sept 17. The graph below depicts the daily maximum national solar generation output (based on the Sheffield solar PV live data) 5 and the installed solar generation capacity. D ESC R IPT IO N O F SO L AR G ENER AT IO N AND F O R EC AST ER R O R S Our solar generation forecasts, as published on BMRS and the Data Explorer section of the National Grid website, arise from an internal PV generation forecasting model, based on a number of parameters:- Estimated capacities, Weather forecasts from our weather provider and Empirically derived models connecting radiation and national generation using data from our collaboration with Sheffield Solar. Our weather forecasts extend from the current day out to 14 days ahead, and so our solar generation forecasts have the same time horizon. Beyond this, we use seasonal nor mal weather. The figure below gives an illustration of our mean absolute solar generation forecast error for daylight hours, against lead time of the forecast in days ahead (DA). The error is measured against the national generation estimated from our Sheffield Solar NIA project. Some further details on the trends are given in the analysis section
9 Mean abs PV Error (MW) 13DA MW 12DA MW 11DA MW 10DA MW 9DA MW 8DA MW 7DA MW 6DA MW 5DA MW 4DA MW 3DA MW 2DA MW DA MW It can be observed that our mean absolute PV error has reduced slightly over almost all forecast time horizons, from Q1 to Q2, although still remains at a sizeable level. Further discussion of this is given below. AC T IO NS AF F EC T ING SO L AR G ENER AT IO N F O R EC AST S AND ER R O R S During the period 19 th June 10 th Sept, a number of actions were been taken to optimise the solar generation forecast:- Increased number of weather forecasting stations o After some preliminary work earlier in the year, we increased the number of weather forecasting stations that our solar PV forecasting system uses from 28 to 53 on the 28 th June. Updated PV generation models o As part of our regular PV model reviews, we refreshed the PV generation models leading to immediate improvements in mean absolute error.. These improvements generally reduce with time until the next refresh. Following the improved radiation forecasts that we began receiving on the 5 th May, the whole of this Quarter had radiation forecasts based on an improved radiation forecasting methodology. This is one of the prime reasons for our improved PV forecasting during this period.. 9

10 ANAL YSIS O F T HE C AUS ES O F SO L AR G ENER AT IO N F O R E C AST ER R O R S & F UT UR E AC T IO NS As a number of parameters feed into the forecast of solar generation, errors in each of these contribute to the discrepancy with the actual real generation. However, as error in capacity or outturn can only be estimated theoretically (as there are no standard benchmarks or metering available to National Grid), we take the estimates of capacity and outturn as exact, and break our forecast error down into just two components Model Error and Weather Error:- Error = P (weather forecast) Observed Outturn = (P (weather actual) - Observation) + (P (weather forecast) P (weather actual)) = Model Error + Weather Error where P is the function being used to convert weather data into solar generation data. The radiation forecast is the main weather variable used from our weather forecasts. The figure below illustrates the values of mean absolute radiation forecast error seen during the periods 19 th June 10 th Sept. The figure is plotted for daylight hours only (the figure in the June17 report showed the error over all hours of the day) : We know from sensitivity analysis of our internal models, that an error of 50kJ/m2 in radiation is equivalent to around a 150MW error in our national PV forecast. 10
11 Using this scaling to cross compare the values in the above figure to those in the figure of mean absolute PV error, shows that radiation or weather error is again clearly the dominant source of our overall solar PV forecast error. Further discussion on this point can be found in the previous report. Our NIA project with our weather forecast provider, which aims to improve our radiation forecast accuracy, in this frontline area of meteorology, is ongoing. During the summer, we embarked on a new NIA project with the Alan Turing Institute. This project looked at potential improvements to our wind and solar PV forecast models. The solar PV work produced an innovative new model relating solar radiation to solar PV power. From our ongoing Reading University NIA project, we also received and coded another model connecting the same quantities. Both of these newly proposed models are being run in parallel testing, and we anticipate implementing improvements to the radiance to power mapping operationally during the next quarter. 11
12 WIND FORECASTS The key input to our forecasts is the wind speed forecast. The graph below shows the mean absolute error in wind speed forecast in m/s at different time horizons. As an indication of the impact of the errors, in the mid part of a wind power curve, between around 5 and 15 m/s, a 1 m/s error in wind speed forecast equates to around a 10% error in wind power forecast for the generator. Mean abs wind speed error (m/s) 13DA m/s 12DA m/s 11DA m/s 10DA m/s 9DA m/s 8DA m/s 7DA m/s 6DA m/s 5DA m/s 4DA m/s 3DA m/s 2DA m/s DA m/s In Day m/s The wind incentive measures our performance in forecasting the wind power that is available, and does not require us to forecast the actual wind output after the control room have taken action (BOA s) on wind farms to manage constraints, or other system issues in real time. We cannot forecast the latter. In order to report our performance, the forecasts for each individual wind farm for each half hour are recorded. For the half hour where a BOA is taken on that farm, the unit is discounted for the calculation of corrected forecast, corrected outturn and corrected installed capacity. The percentage error for the forecast for that half hour is then calculated from the corrected values, and a daily average then calculated which is used in the formulae described in the incentive to calculate the outcome for that day. In terms of overall performance, the graphs below show the comparison of the corrected forecast and actual wind generation for the period 19th June until 10 September, as well as the daily average percentage error used to calculate the outcome of the incentive. 12
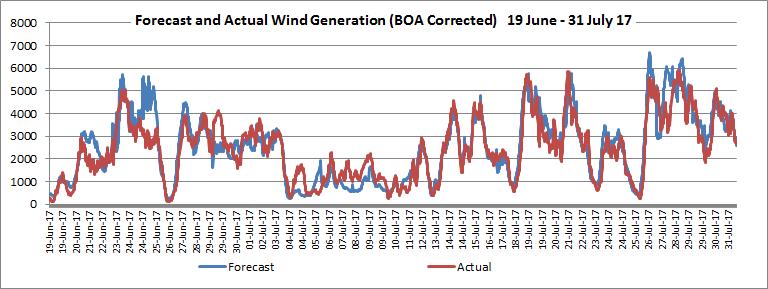
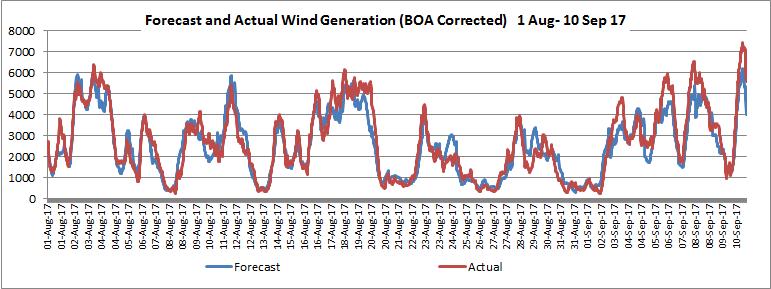
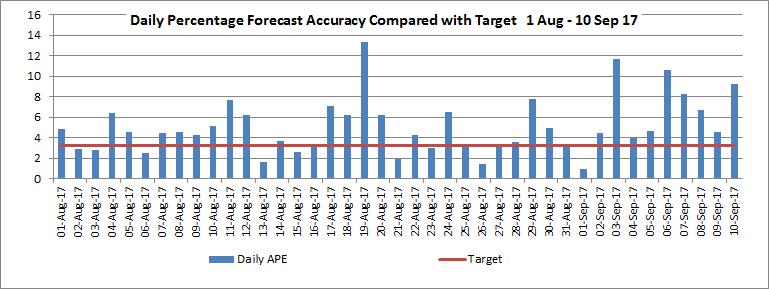
13 13
14 The other component of the incentive is the bias incentive. In this component, for the objective is to have as many wind power over-forecasts as under-forecasts, with a break-even target of 60:40 and a floor of 70:30. There is also a separate term in the incentive that says if any two individual forecast times are 70% biased then we hit the floor. For the wind incentive, this means if any two out of 48 half hourly forecasts are 70% biased then we hit the floor. This equates to 9 out of 31 forecasts in a month being one side of zero and 22 being the other side. In June the forecasts overall were 57.08% biased and so we hit the floor as more than one individual forecast time exceeded the 70% biased. In July, the overall bias was 46.98%. In August, the overall bias was 50.67%. In July and August, only one individual forecast time exceeded the 70% bias. W IND G ENER AT IO N MO D E L L ING Efforts to review and improve models for larger wind farms are continuing. We have also been working with the Turing Institute to prototype the interpolation of wind speed forecasts to unforecast locations and prototype more advanced wind power forecast models. 14
15 WEATHER ANALYSIS The graphs below show the mean absolute errors in the forecasts that we receive for our key weather parameters over the 0 to 13 day ahead forecast horizons. Temperature is measured in C, with 1 C equating to a demand forecast error of the order of 500 MW. Solar radiation is measured in kj/m 2, with 50 kj/m 2 approximating to an error of 150 MW in our PV forecasts Wind speed is measured in m/s, with 1 m/s in the range 5 15 m/s corresponding to an error in generation forecast for the wind farm of around 10% of capacity Each graph shows the mean absolute weather forecast error for this quarter, as well as a comparison to the same error for the previous quarter. 250 Mean absolute error in forecasted radiation from in-day to D D0 D+1 D+2 D+3 D+4 D+5 D+6 D+7 D+8 D+9 D+10 D+11 D+12 D Jun - 10 Sep Apr - 18 Jun Mean absolute error in forecasted wind speed from in-day to D In Day D+1 D+2 D+3 D+4 D+5 D+6 D+7 D+8 D+9 D+10 D+11 D+12 D Jun - 10 Sep Apr - 18 Jun
16 2 Mean absolute error in forecasted temperature from in-day to D In Day D+1 D+2 D+3 D+4 D+5 D+6 D+7 D+8 D+9 D+10 D+11 D+12 D Jun - 10 Sep Apr - 18 Jun 2017 For further wind and solar radiation error data, please also refer to the PV forecasting and wind forecasting sections of this report. With increasing forecast lead-time, weather forecast errors become larger. Beyond a forecasting horizon of around 6-7days, it can be seen that the maximum error values are maintained for radiation and windspeed forecasts, and there had been limited forecasting skill. This observation is typical for all weather forecasting providers. The forecast on average no longer benefits from the current knowledge of the state of the atmosphere. Given that these two parameters are the main drivers of our renewable generation forecasts, this presents a limiting factor to the accuracy of our long term renewable generation forecasts, and also places limits on our 7day-ahead demand forecasts. This is then especially challenging as capacity increases. The effect of weather errors are of course not in general independent, although for renewable generation where one variable is usually the driving factor, this proves correct in practise. For demand forecast errors, there is in general more coupling (eg one weather error can cancel or magnify the effect of another). Discussion and illustration of this point was described in the report for the previous quarter. Immediately before this quarter, we arranged with our weather provider to receive two of our weather forecasts earlier in the day. The consequence of this was that we were able to take advantage of a weather forecast with more up to date data for our D+2 deman d forecast. This will have fed through into improved accuracy for this particular demand incentive. 16
17 WORK TO IMPROVE FORECASTS An authoritative discussion of the work which we are undertaking to improve our forecasting accuracy was been given in the last quarterly report. In summary, this listed 5 projects with external projects, funded by the NIA scheme, as well as internal development work. The projects with external partners have been focussed on the key factors which drive our solar power and wind power forecasting errors. Progress in these areas has been mentioned within earlier sections, but for completion, highlights of these include:- - Increased number of weather forecasting locations for solar power forecasts - Updated PV generation models Some anticipated future outputs within the next quarter include:- - Potential implementation of a new solar power model as provided by the Reading University NIA - Potential implementation of a new solar power model as provided by the Turing Institute - Potential implementation of a new wind power model as provided by Turing Institute, and an interpolation algorithm to provide wind forecasts at un-forecast locations. - Noise reduction and smoothing of our radiation forecasts. - Potential implementation of new embedded, non weather-dependentgeneration forecast models. These cover for example biomass and landfill gas-driven power generation, as well as 5 other sources, equating to around ¾ of the capacity of metered embedded generation. - Refreshing our wind generation forecast models. We are also engaged in a number of internal projects, including a strategic review of the Energy Forecasting system as well in talks with potential future research partners. CONCLUSIONS A detailed analysis is presented, describing the errors and sources of errors in National Grid s demand, solar and wind generation forecasts for the period 19 th June 2017 to 10 th September In addition, the work that is being done to improve these forecasts is described. Some highlights during this reporting period were that we experienced the second lowest ever overnight demand, as well as the second highest ever PV generation. For almost all cardinal points, our demand forecast errors reduced compared to the previous quarter, as per historic trends during the late summer period. For our wind generation forecast, we remained within the unbiased bounds in July & August. Work continues on our internal projects and with our NIA-funded collaborations to improve our forecasting accuracies further. 17
18 APPENDIX 1 SOURCES OF DEMAND FORECAST ERROR Forecast error is made up of many independent, but interacting components. On some days small errors due to several different components can result in a large overall error, while on ot her days two very large errors can cancel out leaving a net very accurate forecast. The components of error are: Error in basic underlying demand level cannot be directly quantified on a day to day basis Error in time data some components such as day of week do not have any errors while other components such as the number of schools on holiday each week will have an error that cannot be quantified Error in time models eg our representation of how day of week affects demand, or how the number of schools on holiday affects demand cannot be separately quantified Error in weather forecast data difference between forecast and actual observed weather at weather stations can be measured, and our weather models can be used to estimate the impact of these errors on our demand forecasts Error in weather models the error in how well we model the effects of weather on demand cannot be independently measured and so cannot be quantified Error in wind and PV capacity our embedded wind and solar models assume a capacity of generation, and its geographical location. National Grid has limited data on such installations; some are notified to us while data on others has to be gathered from publically available data sources. This data will not be exhaustive and so is a significant source of error, particularly in areas of rapid growth. For PV installations there can be some months delay between installations going live and data being available to indicate the existence of the installation. As such installations are built without public subsidy, registered capacity data will be increasingly difficult to obtain. The error in capacities is significant and cannot be quantified. Error in solar radiation forecasts the solar radiation forecasts are a key input to our forecasts for PV generation, and can be a significant source of errors. One source of error is in the solar radiation forecast we receive for a specific weather station location. The error can be quantified by comparing forecast and measured solar radiation at the location. The second error is in how representative the weather station is of the surrounding area. It is possible for a cloud to be correctly forecast over the weather station, but for the majority of the surrounding area to be in sunshine. We currently receive solar radiation forecasts for 53 locations round the country, where a 100 cm 2 radiation sensor at each weather site is assumed to be representative of an average area of 8840 km 2. The error this introduces cannot be quantified. Error in PV models we use models to convert forecast solar radiation into forecast PV generation in MW. There will be an error due to the accuracy of these models. This error can be estimated using the output of a Network Innovation Allowance funded project run by National Grid in collaboration with the Sheffield Solar team of Sheffield University. This team take around 1200 real time data feeds from domestic PV installations and use complex algorithms to extrapolate the output to an estimate for the total national output from all 900,000 or so PV installations in the UK. There is an estimated 5-10% error in the value of PV generation. We can compare the estimated national PV generation with the 18
19 Unmodelled behavioural effects value that our models would have forecast given the outturn solar radiation and so estimate the error associated with the PV models. Error in wind speed forecasts we currently receive wind speed forecasts for around 100 locations in the country. Some of these are weather station locations where an outturn measurement is available, allowing us to quantify the error at these locations, but other forecasts are for sites near large wind farms where outturn data may not be available. We can however estimate the error from those points that we can measure. Error in embedded wind generation models we use models to convert the nearest available wind speed forecast into a generation forecast for embedded wind farms that we are aware of. As we do not have any metering from these embedded wind farms we cannot measure this error, although we can estimate it is likely to be broadly similar to the errors in our national metered wind generation forecast. Error due to system frequency deviation from 50 Hz our models assume the system is operating at 50 Hz. In reality is it possible for the average frequency over a half hour settlement period to vary from 50 Hz, typically by up to 0.1 Hz once a week. This introduces a change in demand from that forecast for 50 Hz. The change is in the range MW for a 0.1 Hz deviation, and can be estimated based on frequency measurements. Error due to transmission losses our demand forecasts are for National Demand, which includes transmission losses. We assume typical losses in our forecasts, however it is possible for operational issues on the day to require an abnormal system configuration which could result in higher than normal losses. It is possible for a difference of over 500 MW in transmission losses in consecutive days for the same settlement period. This error can be quantified from Settlement Metering values for generation and demand that are available via Elexon from at Day + 5. The separate components of the demand forecast, and associated error, are represented visually in the illustration below. Forecast Error Components Special Events Solar PV Emb Wind Weather Time Based Basic Level Error Actual Error Quantifiable Unquantifiable Wind Models Weather F/C Data Weather Models Time - Models Time - Data Basic Level Wind Capacity PV Capacity System Frequency PV F/C Radiation PV Model Wind Speed Special Events Metering / Overrides Transmission Losses 19


20 APPENDIX 2 BREAKDOWN OF LARGE INDIVIDUAL ERRORS Day Ahead largest forecasting errors 2Days Ahead largest forecasting errors 20

21 7Days Ahead largest forecasting errors 21
Demand Forecasting Reporting Period: 1 st Apr th Jun 17
 N A T I O N A L G R I D P A G E 1 O F 3 C O M M E R C I A L, E L E C T R I C I T Y C O M M E R C I A L O P E R A T I O N S Demand Forecasting Reporting Period: 1 st Apr 17 18 th Jun 17 EXECUTIVE SUMMARY
Demand Forecasting Reporting Period: 4 th Dec th Mar 2018
 N A T I O N A L G R I D P A G E 1 O F 25 C O M M E R C I A L, E L E C T R I C I T Y C O M M E R C I A L O P E R A T I O N S Demand Forecasting Reporting Period: 4 th Dec 2017 11 th Mar 2018 EXECUTIVE SUMMARY
peak half-hourly Tasmania
 Forecasting long-term peak half-hourly electricity demand for Tasmania Dr Shu Fan B.S., M.S., Ph.D. Professor Rob J Hyndman B.Sc. (Hons), Ph.D., A.Stat. Business & Economic Forecasting Unit Report for
peak half-hourly New South Wales
 Forecasting long-term peak half-hourly electricity demand for New South Wales Dr Shu Fan B.S., M.S., Ph.D. Professor Rob J Hyndman B.Sc. (Hons), Ph.D., A.Stat. Business & Economic Forecasting Unit Report
Average Cold Spell Methodology
 Average Cold Spell Methodology Introduction This document is being written under Special Condition 4L.12 (Financial incentives on EMR) of National Grid Electricity Transmission plc s Electricity Transmission
2018 Annual Review of Availability Assessment Hours
 2018 Annual Review of Availability Assessment Hours Amber Motley Manager, Short Term Forecasting Clyde Loutan Principal, Renewable Energy Integration Karl Meeusen Senior Advisor, Infrastructure & Regulatory
SOLAR POWER FORECASTING BASED ON NUMERICAL WEATHER PREDICTION, SATELLITE DATA, AND POWER MEASUREMENTS
 BASED ON NUMERICAL WEATHER PREDICTION, SATELLITE DATA, AND POWER MEASUREMENTS Detlev Heinemann, Elke Lorenz Energy Meteorology Group, Institute of Physics, Oldenburg University Workshop on Forecasting,
MISO September 15 Maximum Generation Event Overview. October 11, 2018
 MISO September 15 Maximum Generation Event Overview October 11, 2018 Purpose & Key Takeaways Purpose: Summarize operations during the September 15 South Region Maximum Generation Event Key Takeaways: MISO
Operations Report. Tag B. Short, Director South Region Operations. Entergy Regional State Committee (ERSC) February 14, 2018
 February 14, 2018") Operations Report Tag B. Short, Director South Region Operations Entergy Regional State Committee (ERSC) February 14, 2018 1 Winter Operations Highlights South Region Max Gen Event Regional Dispatch Transfer
Operations Report Tag B. Short, Director South Region Operations Entergy Regional State Committee (ERSC) February 14, 2018 1 Winter Operations Highlights South Region Max Gen Event Regional Dispatch Transfer
Laboratory Exercise #7 - Introduction to Atmospheric Science: The Seasons and Daily Weather
 Laboratory Exercise #7 - Introduction to Atmospheric Science: The Seasons and Daily Weather page - Section A - Introduction: This lab consists of questions dealing with atmospheric science. We beginning
Summary of Seasonal Normal Review Investigations. DESC 31 st March 2009
 Summary of Seasonal Normal Review Investigations DESC 31 st March 9 1 Introduction to the Seasonal Normal Review The relationship between weather and NDM demand is key to a number of critical processes
Integration of Behind-the-Meter PV Fleet Forecasts into Utility Grid System Operations
 Integration of Behind-the-Meter PV Fleet Forecasts into Utility Grid System Operations Adam Kankiewicz and Elynn Wu Clean Power Research ICEM Conference June 23, 2015 Copyright 2015 Clean Power Research,
Model Output Statistics (MOS)
") Model Output Statistics (MOS) Numerical Weather Prediction (NWP) models calculate the future state of the atmosphere at certain points of time (forecasts). The calculation of these forecasts is based on
Model Output Statistics (MOS) Numerical Weather Prediction (NWP) models calculate the future state of the atmosphere at certain points of time (forecasts). The calculation of these forecasts is based on
Multivariate Regression Model Results
 Updated: August, 0 Page of Multivariate Regression Model Results 4 5 6 7 8 This exhibit provides the results of the load model forecast discussed in Schedule. Included is the forecast of short term system
CAISO Participating Intermittent Resource Program for Wind Generation
 CAISO Participating Intermittent Resource Program for Wind Generation Jim Blatchford CAISO Account Manager Agenda CAISO Market Concepts Wind Availability in California How State Supports Intermittent Resources
SOUTH AUSTRALIAN WIND STUDY REPORT SOUTH AUSTRALIAN ADVISORY FUNCTIONS
 SOUTH AUSTRALIAN WIND STUDY REPORT SOUTH AUSTRALIAN ADVISORY FUNCTIONS Published: October 2015 IMPORTANT NOTICE Purpose The purpose of this publication is to provide information about wind generation in
2008 Growing Season. Niagara Region
 28 Growing Season Niagara Region Weather INnovations Staff November 14, 28 Overview The start of the 28 growing season looked promising. After an extremely dry 27 growing season, soil moisture levels had
Application and verification of ECMWF products 2012
 Application and verification of ECMWF products 2012 Instituto Português do Mar e da Atmosfera, I.P. (IPMA) 1. Summary of major highlights ECMWF products are used as the main source of data for operational
Agricultural Science Climatology Semester 2, Anne Green / Richard Thompson
 Agricultural Science Climatology Semester 2, 2006 Anne Green / Richard Thompson http://www.physics.usyd.edu.au/ag/agschome.htm Course Coordinator: Mike Wheatland Course Goals Evaluate & interpret information,
POWER SYSTEM OPERATING PROCEDURE LOAD FORECASTING
 POWER SYSTEM OPERATING PROCEDURE LOAD FORECASTING PREPARED BY: PROCEDURE TYPE: DOCUMENT REFERENCE: FINAL APPROVER: Systems Capability System Operating Procedure SO_OP_3710 Christian Schaefer DOC. VERSION:
SYSTEM OPERATIONS. Dr. Frank A. Monforte
 SYSTEM OPERATIONS FORECASTING Dr. Frank A. Monforte Itron s Forecasting Brown Bag Seminar September 13, 2011 PLEASE REMEMBER» In order to help this session run smoothly, your phones are muted.» To make
DESC Technical Workgroup. CWV Optimisation Production Phase Results. 17 th November 2014
 DESC Technical Workgroup CWV Optimisation Production Phase Results 17 th November 2014 1 2 Contents CWV Optimisation Background Trial Phase Production Phase Explanation of Results Production Phase Results
Central Ohio Air Quality End of Season Report. 111 Liberty Street, Suite 100 Columbus, OH Mid-Ohio Regional Planning Commission
 217 218 Central Ohio Air Quality End of Season Report 111 Liberty Street, Suite 1 9189-2834 1 Highest AQI Days 122 Nov. 217 Oct. 218 July 13 Columbus- Maple Canyon Dr. 11 July 14 London 11 May 25 New Albany
Methodology and Data Sources for Agriculture and Forestry s Interpolated Data ( )
") Methodology and Data Sources for Agriculture and Forestry s Interpolated Data (1961-2016) Disclaimer: This data is provided as is with no warranties neither expressed nor implied. As a user of the data
Methodology and Data Sources for Agriculture and Forestry s Interpolated Data (1961-2016) Disclaimer: This data is provided as is with no warranties neither expressed nor implied. As a user of the data
WIND INTEGRATION IN ELECTRICITY GRIDS WORK PACKAGE 3: SIMULATION USING HISTORICAL WIND DATA
 WIND INTEGRATION IN ELECTRICITY GRIDS WORK PACKAGE 3: SIMULATION USING PREPARED BY: Strategy and Economics DATE: 18 January 2012 FINAL Australian Energy Market Operator Ltd ABN 94 072 010 327 www.aemo.com.au
Overcoming solar distribution network challenges. Michelle Spillar Head of Renewables, Met Office
 Overcoming solar distribution network challenges Michelle Spillar Head of Renewables, Met Office Solar Performance Mapping and Operational Yield Forecasting Supported by Innovate UK The thing is that Project
Demand Estimation Sub-Committee. Seasonal Normal Review - Updated. 17 th December 2014
 Demand Estimation Sub-Committee Seasonal Normal Review - Updated 17 th December 2014 1 2 Introduction Seasonal Normal is the gas industry benchmark of what constitutes "typical" weather conditions, and
OFFSHORE INTEGRATION STUDY. Analysis, benchmark and mitigation of storm and ramping risks from offshore wind power in Belgium 05/02/2018
 OFFSHORE INTEGRATION STUDY Analysis, benchmark and mitigation of storm and ramping risks from offshore wind power in Belgium 05/02/2018 This study has been developed in close collaboration with 1 TABLE
SMART GRID FORECASTING
 SMART GRID FORECASTING AND FINANCIAL ANALYTICS Itron Forecasting Brown Bag December 11, 2012 PLEASE REMEMBER» Phones are Muted: In order to help this session run smoothly, your phones are muted.» Full
AN INTERNATIONAL SOLAR IRRADIANCE DATA INGEST SYSTEM FOR FORECASTING SOLAR POWER AND AGRICULTURAL CROP YIELDS
 AN INTERNATIONAL SOLAR IRRADIANCE DATA INGEST SYSTEM FOR FORECASTING SOLAR POWER AND AGRICULTURAL CROP YIELDS James Hall JHTech PO Box 877 Divide, CO 80814 Email: jameshall@jhtech.com Jeffrey Hall JHTech
Importance of Numerical Weather Prediction in Variable Renewable Energy Forecast
 Importance of Numerical Weather Prediction in Variable Renewable Energy Forecast Dr. Abhijit Basu (Integrated Research & Action for Development) Arideep Halder (Thinkthrough Consulting Pvt. Ltd.) September
CIMA Professional 2018
 CIMA Professional 2018 Interactive Timetable Version 16.25 Information last updated 06/08/18 Please note: Information and dates in this timetable are subject to change. A better way of learning that s
Speedwell High Resolution WRF Forecasts. Application
 Speedwell High Resolution WRF Forecasts Speedwell weather are providers of high quality weather data and forecasts for many markets. Historically we have provided forecasts which use a statistical bias
IBHS Roof Aging Program Data and Condition Summary for 2015
 IBHS Roof Aging Program Data and Condition Summary for 2015 Ian M. Giammanco Tanya M. Brown-Giammanco 1 Executive Summary In 2013, the Insurance Institute for Business & Home Safety (IBHS) began a long-term
Investigating Solar Power in Different Weather Conditions.
 Investigating Solar Power in Different Weather Conditions. Pam Dugdale, Cronton 6 th Form College. Introduction Advertisements for photovoltaic (PV) solar panels are everywhere, with those selling these
CIMA Professional 2018
 CIMA Professional 2018 Newcastle Interactive Timetable Version 10.20 Information last updated 12/06/18 Please note: Information and dates in this timetable are subject to change. A better way of learning
CIMA Professional
 CIMA Professional 201819 Birmingham Interactive Timetable Version 3.1 Information last updated 12/10/18 Please note: Information and dates in this timetable are subject to change. A better way of learning
WIND DATA REPORT. Vinalhaven
 WIND DATA REPORT Vinalhaven July 1, 2004 September 30, 2004 Prepared for Fox Islands Electric Cooperative By Melissa L. Ray Anthony L. Rogers April 4, 2005 Renewable Energy Research Laboratory 160 Governors
CIMA Professional
 CIMA Professional 201819 Manchester Interactive Timetable Version 3.1 Information last updated 12/10/18 Please note: Information and dates in this timetable are subject to change. A better way of learning
This wind energy forecasting capability relies on an automated, desktop PC-based system which uses the Eta forecast model as the primary input.
 A Simple Method of Forecasting Wind Energy Production at a Complex Terrain Site: An Experiment in Forecasting Using Historical Data Lubitz, W. David and White, Bruce R. Department of Mechanical & Aeronautical
Laboratory Exercise #7 - Introduction to Atmospheric Science: The Seasons
 Laboratory Exercise #7 - Introduction to Atmospheric Science: The Seasons page - 1 Section A - Introduction: This lab consists of both computer-based and noncomputer-based questions dealing with atmospheric
CARLOS F. M. COIMBRA (PI) HUGO T. C. PEDRO (CO-PI)
 HUGO T. C. PEDRO (CO-PI)") HIGH-FIDELITY SOLAR POWER FORECASTING SYSTEMS FOR THE 392 MW IVANPAH SOLAR PLANT (CSP) AND THE 250 MW CALIFORNIA VALLEY SOLAR RANCH (PV) PROJECT CEC EPC-14-008 CARLOS F. M. COIMBRA (PI) HUGO T. C. PEDRO
HIGH-FIDELITY SOLAR POWER FORECASTING SYSTEMS FOR THE 392 MW IVANPAH SOLAR PLANT (CSP) AND THE 250 MW CALIFORNIA VALLEY SOLAR RANCH (PV) PROJECT CEC EPC-14-008 CARLOS F. M. COIMBRA (PI) HUGO T. C. PEDRO
Country scale solar irradiance forecasting for PV power trading
 Country scale solar irradiance forecasting for PV power trading The benefits of the nighttime satellite-based forecast Sylvain Cros, Laurent Huet, Etienne Buessler, Mathieu Turpin European power exchange
POWER SYSTEM OPERATING PROCEDURE LOAD FORECASTING
 POWER SYSTEM OPERATING PROCEDURE LOAD FORECASTING PREPARED BY: PROCEDURE TYPE: DOCUMENT REFERENCE: FINAL APPROVER: Systems Capability System Operating Procedure SO_OP_3710 Mark Stedwell DOC. VERSION: 19
EVALUATION OF ALGORITHM PERFORMANCE 2012/13 GAS YEAR SCALING FACTOR AND WEATHER CORRECTION FACTOR
 EVALUATION OF ALGORITHM PERFORMANCE /3 GAS YEAR SCALING FACTOR AND WEATHER CORRECTION FACTOR. Background The annual gas year algorithm performance evaluation normally considers three sources of information
Application and verification of ECMWF products 2017
 Application and verification of ECMWF products 2017 Slovenian Environment Agency ARSO; A. Hrabar, J. Jerman, V. Hladnik 1. Summary of major highlights We started to validate some ECMWF parameters and other
DRIVING ROI. The Business Case for Advanced Weather Solutions for the Energy Market
 DRIVING ROI The Business Case for Advanced Weather Solutions for the Energy Market Table of Contents Energy Trading Challenges 3 Skill 4 Speed 5 Precision 6 Key ROI Findings 7 About The Weather Company
MORPH forecast for carrot flies
 MORPH forecast for carrot flies Purpose: to measure and collect temperature data for the carrot fly forecast model in MORPH and investigate the possibilities to use MORPH in Denmark to forecast optimal
The document was not produced by the CAISO and therefore does not necessarily reflect its views or opinion.
 Version No. 1.0 Version Date 2/25/2008 Externally-authored document cover sheet Effective Date: 4/03/2008 The purpose of this cover sheet is to provide attribution and background information for documents
peak half-hourly South Australia
 Forecasting long-term peak half-hourly electricity demand for South Australia Dr Shu Fan B.S., M.S., Ph.D. Professor Rob J Hyndman B.Sc. (Hons), Ph.D., A.Stat. Business & Economic Forecasting Unit Report
EBS IT Meeting July 2016
 EBS IT Meeting 18 19 July 2016 Conference Call Details Conference call: UK Numbers Tel: 0808 238 9819 or Tel: 0207 950 1251 Participant code: 4834 7876... Join online meeting https://meet.nationalgrid.com/antonio.delcastillozas/hq507d31
NOAA s Capabilities in Wind Energy
 NCAR-Xcel-NOAA Meeting May 11-12, 2010 Boulder, CO NOAA s Capabilities in Wind Energy Melinda Marquis, Ph.D. NOAA Earth System Research Laboratory Outline NOAA has a potential role in improving wind forecasting
Alberto Troccoli, Head of Weather and Energy Research Unit, CSIRO, Australia ICCS 2013 Jamaica, 5 December 2013 (remotely, unfortunately)
") 013 Alberto Troccoli, Head of Weather and Energy Research Unit, CSIRO, Australia ICCS 013 Jamaica, 5 December 013 (remotely, unfortunately) Historical and projected changes in World primary energy demand
013 Alberto Troccoli, Head of Weather and Energy Research Unit, CSIRO, Australia ICCS 013 Jamaica, 5 December 013 (remotely, unfortunately) Historical and projected changes in World primary energy demand
Project Appraisal Guidelines
 Project Appraisal Guidelines Unit 16.2 Expansion Factors for Short Period Traffic Counts August 2012 Project Appraisal Guidelines Unit 16.2 Expansion Factors for Short Period Traffic Counts Version Date
Integration of WindSim s Forecasting Module into an Existing Multi-Asset Forecasting Framework
 Chad Ringley Manager of Atmospheric Modeling Integration of WindSim s Forecasting Module into an Existing Multi-Asset Forecasting Framework 26 JUNE 2014 2014 WINDSIM USER S MEETING TONSBERG, NORWAY SAFE
Gorge Area Demand Forecast. Prepared for: Green Mountain Power Corporation 163 Acorn Lane Colchester, Vermont Prepared by:
 Exhibit Petitioners TGC-Supp-2 Gorge Area Demand Forecast Prepared for: Green Mountain Power Corporation 163 Acorn Lane Colchester, Vermont 05446 Prepared by: Itron, Inc. 20 Park Plaza, Suite 910 Boston,
Prince Edward County Appellation 2015 Growing Season Summary
 Overview Prince Edward County Appellation 215 Growing Season Summary The 215 growing season in the Prince Edward County appellation ended with above normal heat units. Daytime temperatures typically averaged
California Independent System Operator (CAISO) Challenges and Solutions
 Challenges and Solutions") California Independent System Operator (CAISO) Challenges and Solutions Presented by Brian Cummins Manager, Energy Management Systems - CAISO California ISO by the numbers 65,225 MW of power plant capacity
California Independent System Operator (CAISO) Challenges and Solutions Presented by Brian Cummins Manager, Energy Management Systems - CAISO California ISO by the numbers 65,225 MW of power plant capacity
NASA Products to Enhance Energy Utility Load Forecasting
 NASA Products to Enhance Energy Utility Load Forecasting Erica Zell, Battelle zelle@battelle.org, Arlington, VA ESIP 2010 Summer Meeting, Knoxville, TN, July 20-23 Project Overview Funded by the NASA Applied
Monthly Long Range Weather Commentary Issued: APRIL 1, 2015 Steven A. Root, CCM, President/CEO
 Monthly Long Range Weather Commentary Issued: APRIL 1, 2015 Steven A. Root, CCM, President/CEO sroot@weatherbank.com FEBRUARY 2015 Climate Highlights The Month in Review The February contiguous U.S. temperature
WEATHER NORMALIZATION METHODS AND ISSUES. Stuart McMenamin Mark Quan David Simons
 WEATHER NORMALIZATION METHODS AND ISSUES Stuart McMenamin Mark Quan David Simons Itron Forecasting Brown Bag September 17, 2013 Please Remember» Phones are Muted: In order to help this session run smoothly,
Climate services in support of the energy transformation
 services in support of the energy transformation EGU 11 April 2018, Vienna, Austria Climate Alberto Troccoli, Sylvie Parey, and the C3S ECEM team O u t l i n e Background of the C3S European Climatic Energy
Management of the GB System Overnight
 Management of the GB System Overnight Place your chosen image here. The four corners must just cover the arrow tips. For covers, the three pictures should be the same size and in a straight line. Sam Matthews
Renewables and the Smart Grid. Trip Doggett President & CEO Electric Reliability Council of Texas
 Renewables and the Smart Grid Trip Doggett President & CEO Electric Reliability Council of Texas North American Interconnected Grids The ERCOT Region is one of 3 North American grid interconnections. The
GDP forecast errors Satish Ranchhod
 GDP forecast errors Satish Ranchhod Editor s note This paper looks more closely at our forecasts of growth in Gross Domestic Product (GDP). It considers two different measures of GDP, production and expenditure,
Energy Forecasting Customers: Analysing end users requirements Dec 3rd, 2013 Carlos Alberto Castaño, PhD Head of R&D
 IT Solutions for Renewables Energy Forecasting Customers: Analysing end users requirements Dec 3rd, 2013 Carlos Alberto Castaño, PhD Head of R&D carlos.castano@gnarum.com I. Who we are II. Customers Profiles
JOINT BRIEFING TO THE MEMBERS. El Niño 2018/19 Likelihood and potential impact
 JOINT BRIEFING TO THE MEMBERS El Niño 2018/19 Likelihood and potential impact CURRENT EL NIÑO OUTLOOK (SEPTEMBER 2018) CPC/IRI ENSO Forecast from September. Red bars denote probability of an El Nino developing
2012 Growing Season. Niagara Report. Wayne Heinen
 2012 Growing Season Niagara Report Wayne Heinen Overview The 2012 growing season was a phenomenal one for grapes. Vines entered bud break in good shape following a mild winter. The spring of 2012 was similar
Global Flood Awareness System GloFAS
 Global Flood Awareness System GloFAS Ervin Zsoter with the help of the whole EFAS/GloFAS team Ervin.Zsoter@ecmwf.int 1 Reading, 8-9 May 2018 What is GloFAS? Global-scale ensemble-based flood forecasting
FORECAST OF ENSEMBLE POWER PRODUCTION BY GRID-CONNECTED PV SYSTEMS
 FORECAST OF ENSEMBLE POWER PRODUCTION BY GRID-CONNECTED PV SYSTEMS Elke Lorenz*, Detlev Heinemann*, Hashini Wickramarathne*, Hans Georg Beyer +, Stefan Bofinger * University of Oldenburg, Institute of
Climate Variables for Energy: WP2
 Climate Variables for Energy: WP2 Phil Jones CRU, UEA, Norwich, UK Within ECEM, WP2 provides climate data for numerous variables to feed into WP3, where ESCIIs will be used to produce energy-relevant series
The Kentucky Mesonet: Entering a New Phase
 The Kentucky Mesonet: Entering a New Phase Stuart A. Foster State Climatologist Kentucky Climate Center Western Kentucky University KCJEA Winter Conference Lexington, Kentucky February 9, 2017 Kentucky
Balancing Europe s wind power output through spatial deployment informed by weather regimes
 photo: Bernhard Mühr, www.wolkenatlas.de Balancing Europe s wind power output through spatial deployment informed by weather regimes Christian M. Grams 1,*, Remo Beerli 1**, Stefan Pfenninger 2, Iain Staffell
Short-Term Demand Forecasting Methodology for Scheduling and Dispatch
 Short-Term Demand Forecasting Methodology for Scheduling and Dispatch V1.0 March 2018 Table of Contents 1 Introduction... 3 2 Historical Jurisdictional Demand Data... 3 3 EMS Demand Forecast... 4 3.1 Manual
Summary of Seasonal Normal Review Investigations CWV Review
 Summary of Seasonal Normal Review Investigations CWV Review DESC 31 st March 2009 1 Contents Stage 1: The Composite Weather Variable (CWV) An Introduction / background Understanding of calculation Stage
CITY OF MESQUITE Quarterly Investment Report Overview Quarter Ending June 30, 2018
 CITY OF MESQUITE Quarterly Investment Report Overview Quarter Ending June 30, 2018 Investment objectives are safety, liquidity, yield and public trust. Portfolio objective is to meet or exceed the average
Convective-scale NWP for Singapore
 Convective-scale NWP for Singapore Hans Huang and the weather modelling and prediction section MSS, Singapore Dale Barker and the SINGV team Met Office, Exeter, UK ECMWF Symposium on Dynamical Meteorology
Wind power and management of the electric system. EWEA Wind Power Forecasting 2015 Leuven, BELGIUM - 02/10/2015
 Wind power and management of the electric system EWEA Wind Power Forecasting 2015 Leuven, BELGIUM - 02/10/2015 HOW WIND ENERGY IS TAKEN INTO ACCOUNT WHEN MANAGING ELECTRICITY TRANSMISSION SYSTEM IN FRANCE?
UPDATE OF REGIONAL WEATHER AND SMOKE HAZE FOR MAY 2015
 UPDATE OF REGIONAL WEATHER AND SMOKE HAZE FOR MAY 2015 1. Review of Regional Weather Conditions in April 2015 1.1 Inter-Monsoon conditions prevailed over the ASEAN region in April 2015. The gradual northward
Seasonal Climate Watch June to October 2018
 Seasonal Climate Watch June to October 2018 Date issued: May 28, 2018 1. Overview The El Niño-Southern Oscillation (ENSO) has now moved into the neutral phase and is expected to rise towards an El Niño
Needs for Flexibility Caused by the Variability and Uncertainty in Wind and Solar Generation in 2020, 2030 and 2050 Scenarios
 Downloaded from orbit.dtu.dk on: Jan 12, 2019 Needs for Flexibility Caused by the Variability and Uncertainty in Wind and Solar Generation in 2020, 2030 and 2050 Scenarios Koivisto, Matti Juhani; Sørensen,
Belgian Wind Forecasting Phase 1
 Phase 1 Users Group 09/02/2012 Pieter-Jan Marsboom v12.02.09 1 Overview 1. Context & Drivers 2. Forecast & Upscaling Model 3. Forecast Service 4. Wind Forecast Tool 5. Wind Forecast Quality 6. Challenges
Report on System-Level Estimation of Demand Response Program Impact
 Report on System-Level Estimation of Demand Response Program Impact System & Resource Planning Department New York Independent System Operator April 2012 1 2 Introduction This report provides the details
13 August Dear Shareholders UPDATE. I am writing to update shareholders on the profit impact of the recent poor harvest and associated matters.
 13 August 2014 Dear Shareholders UPDATE I am writing to update shareholders on the profit impact of the recent poor harvest and associated matters. 2014 Profit Due principally to the lower than average
Application and verification of ECMWF products 2008
 Application and verification of ECMWF products 2008 RHMS of Serbia 1. Summary of major highlights ECMWF products are operationally used in Hydrometeorological Service of Serbia from the beginning of 2003.
Climate Services in Practice UK Perspective
 Climate Services in Practice UK Perspective Chris Hewitt ICCS, Columbia University, October 2011 Overview Perspectives on: Why have a climate service? What is a climate service? UK activities Examples
Chapter 3. Materials and Methods
 Chapter 3 Materials and Methods CHAPTER3 MATERIALS AND METHODS The present study aims to identify the role of climatic factors in the dispersal of air pollutants released into the atmosphere at some important
Probabilistic forecasting of solar radiation
 Probabilistic forecasting of solar radiation Dr Adrian Grantham School of Information Technology and Mathematical Sciences School of Engineering 7 September 2017 Acknowledgements Funding: Collaborators:
Operational Monsoon Monitoring at NCEP
 Operational Monsoon Monitoring at NCEP Wassila M. Thiaw Climate Prediction Center National Centers for Environmental Predictions Operational Monsoon Monitoring at NCEP Wassila M. Thiaw Climate Prediction
LAB 2: Earth Sun Relations
 LAB 2: Earth Sun Relations Name School The amount of solar energy striking the Earth s atmosphere is not uniform; distances, angles and seasons play a dominant role on this distribution of radiation. Needless
CITY OF MESQUITE Quarterly Investment Report Overview Quarter Ending September 30, 2018
 CITY OF MESQUITE Quarterly Investment Report Overview Quarter Ending September 30, 2018 Investment objectives are safety, liquidity, yield and public trust. Portfolio objective is to meet or exceed the
SuperPack North America
 SuperPack North America Speedwell SuperPack makes available an unprecedented range of quality historical weather data, and weather data feeds for a single annual fee. SuperPack dramatically simplifies
About Nnergix +2, More than 2,5 GW forecasted. Forecasting in 5 countries. 4 predictive technologies. More than power facilities
 About Nnergix +2,5 5 4 +20.000 More than 2,5 GW forecasted Forecasting in 5 countries 4 predictive technologies More than 20.000 power facilities Nnergix s Timeline 2012 First Solar Photovoltaic energy
2010 Growing Season. Prince Edward County Report
 2010 Growing Season Prince Edward County Report WIN Staff November 10, 2010 Overview It is always remarkable how each growing season is unique as a result of yearly variations in weather. Changes occur
= observed volume on day l for bin j = base volume in jth bin, and = residual error, assumed independent with mean zero.
 QB research September 4, 06 Page -Minute Bin Volume Forecast Model Overview In response to strong client demand, Quantitative Brokers (QB) has developed a new algorithm called Closer that specifically
WIND DATA REPORT. Vinalhaven
 WIND DATA REPORT Vinalhaven April 1, 2004 June 30, 2004 Prepared for Fox Islands Electric Cooperative By Melissa L. Ray Anthony L. Rogers April 4, 2005 Renewable Energy Research Laboratory 160 Governors
Ontario Demand Forecast
 Ontario Demand Forecast DECEMBER 12, 2017 December 12, 2017 Public Page i Executive Summary The IESO is responsible for forecasting electricity demand in Ontario and for assessing whether transmission
Land Data Assimilation at NCEP NLDAS Project Overview, ECMWF HEPEX 2004
 Dag.Lohmann@noaa.gov, Land Data Assimilation at NCEP NLDAS Project Overview, ECMWF HEPEX 2004 Land Data Assimilation at NCEP: Strategic Lessons Learned from the North American Land Data Assimilation System
Application and verification of ECMWF products 2017
 Application and verification of ECMWF products 2017 Finnish Meteorological Institute compiled by Weather and Safety Centre with help of several experts 1. Summary of major highlights FMI s forecasts are
13 SHADOW FLICKER Introduction Methodology
 Table of contents 13 SHADOW FLICKER... 13-1 13.1 Introduction... 13-1 13.2 Methodology... 13-1 13.2.1 Factors Influencing Shadow Flicker Occurrence... 13-2 13.2.2 Shadow Flicker Analysis Methodology...