EI Nino Induced Ocean Eddies in the Gulf of Alaska
|
|
|
- Peter Hawkins
- 5 years ago
- Views:
Transcription


1 EI Nino Induced Ocean Eddies in the Gulf of Alaska Arne Melsom, Harley E. Hurlburt, E. Joseph Metzger, Steven D. Meyers and James J. O'Brien Center for Ocean-Atmospheric Prediction Studies The Florida State University Tallahassee, FL Submitted to Science August, 1995 ReJX>rt 954


2 EI Nino Induced Ocean Eddies in the Gulf of Alaska Arne Melsom, Harley E. Hurlburt, E. Joseph Metzger, Steven D. Meyers and James J. O'Brien- 1 Abstract Observations reveal substantial eddy activity in the Gulf of Alaska, with the Sitka. eddy being a frequently observed anticyclonic feature near 57 N. A unique high-resolution numerical model that accurately reproduces eddy formation, size, and lifetime is able to duplicate the observations. The decadal simulation allows examination of interannual variations in the eddy activity. Interannual variability in the upper ocean coastal circulation in the Gulf of Alaska is due to the El Nino/Southern Oscillation phenomenon in the tropical Pacific. El Nino events destabilize the Alaska Current, creating multiple strong anticyclonic eddies along the coast. These eddies then slowly propagate into the Gulf of Alaska and live for years. El Viejo (La Nina) events generally suppress eddy formation. This high latitude El Nino phenomena must have a major effect on local fisheries. The continental slope of the northeast Pacific is a major habitat for a number of commercially harvested fish such as salmon, halibut and herring (1). It has been suggested that year-to-year changes in fish stock recruitment and return migration routes of certain species in the Gulf of Alaska are affected by low frequency ocean variability. A theory which has been advocated in several recent studies is that this variability may be attributed to EI Nino/Southern Oscillation (ENSO) events which trigger propagating coastal Kelvin waves and also cause changes in the general atmospheric circulation (2, 3). A number of observational programs have been performed (4, 5), as well as several numerical model simulations (6, 7). 1 A. Melsom, Department of Geophysics, University of Oslo, P. O. Box 1022, Blindern, N-0315 Oslo, Norway. H.E. Hurlburt and E.J. Metzger, Naval Research Laboratory, Stennis Space Center, MS, ,VSA. S.D. Meyers and J.J. O'Brien, Center for Ocean-Atmospheric Prediction Studies, The Florida State University, Tallahassee, FL , USA. }.

3 High resolution numerical models of the ocean circulation allow study of mesoscale (,.,.,,100 km) motion. Recent technological advances in computinghave made it possible to apply these models to global and basin-scale domains. The effects of remote tropical events on mid-latitude mesoscale circulation through Kelvin wave teleconnections are now accurately represented. Moreover, the local response to the atmospheric circulation is well-described. These new high resolution global and basin-scale models realistically simulate the temporal and spatial variability of mesoscale circulation features. This class of numerical models is an important tool, since the limited quantity of in situ observations is a general, reoccurring problem for examination of ocean circulation on the mesoscale. Major features of the Navy Layered Ocean Model include isopycnal layers, nonlinear primitive equations, free surface and a semi-implicit time scheme (8,9,10). We present results based on a simulation of the ocean circulation in the northern and tropical Pacific Ocean, from 200S to 62 N. The model consists of six isopycnallayers and has a resolution of 1/8 x 45/256 (latitude x longitude) which is approximately 13 km in the Alaska. Gyre region. The model was spun up to a statistical equilibrium using the Hellerman and Rosenstein (HR) monthly mean wind stress climatology (11). Subsequently, the model was forced for a 14 year period ( ) starting January 1, 1981 with daily 1000 mb winds from the European Centre for Medium-Range Weather Forecasts (ECMWF) (10). The ECMWF mean was replaced by the annual mean from HR. Previous numerical simulations of the Gulf of Alaska. circulation used climatological or monthly winds, the present simulation incorporates a more accurate description of the temporal variability of the wind forcing. We restrict our study to a subdomain in the eastern Gulf of Alaska. bounded by 46 N to the south and 145 W to the west. We mostly discuss the results obtained for the two uppermost layers since these contain the essential dynamics of the upper ocean circulation. The model accurately reproduces much of the observed variability in the region of interest, as illustrated by model comparisons with coastal stations. The results in Fig. 1 exemplify this good agreement and validates the numerical representation of the annual and interannual variability. The dominance of ENSO events in the interannual variability along the coast of the Gulf of Alaska. is apparent in Fig. lb. This variability has a strong effect on the local circulation. 2

4 A coastal current, corresponding to the Alaska Current, is observed in the simulation results. This current is strongest during winter, when the How is northward. In spring the current weakens, moves slightly offshore, and breaks into eddies. During summer its direction is frequently southward. A similar seasonal cycle is found in observational data (12), where it is attributed to a shift in the atmospheric circulation from a surface pressure low in winter to a summer high (13). The transport and the vertical velocity shear associated with the coastal current reach maximum values in December or January. At this time, the current starts to meander. The alongshore wavelength and offshore amplitude of the meanders are typically 200 km and 40 km, respectively. However, the amplitude may become -100 kin, after which the current usually breaks into eddies. The meandering is observed in both of the layers under consideration. Generally, the horizontal pressure gradient is significantly larger in layer 1 than in layer 2. Hence, the motion in the meanders is strongly baroclinic and the accompanying vertical velocity shear is significant. As the meanders break up, anticyclonic and cyclonic eddies are formed by baroclinic instability. The anticyclonic eddies are generally larger than the cyclonic eddies. The cyclonic eddies dissipate quite rapidly, whereas the anticyclonic eddies sometimes survive for well over a year. Typically, the stronger anticyclonic eddies are generated during winter. The eddies are seen to propagate slowly southwestward (i.e., offshore), with an estimated propagation speed of cm/s, or 200 kin/year. However, the direction of propagation may temporarily be reversed, possibly due to the local wind forcing. Following conventional theory for baroclinic instability, the wavelength of the most rapidly growing disturbance is a function of the buoyancy, layer thickness and latitude (14). In the coastal regions of the Gulf of Alaska this scale varies from 50 kin to 75 kin for upwelling and downwelling perturbations, respectively. Thus" downwelling instabilities are well resolved, whereas the description of unstable disturbances in the upwelling situation is less precise. Upwelling perturbations stabilize the How and do not yield eddies. Additionally, the generation of cyclonic eddies may be artificially suppressed due to their relatively small horizontal extent, since horizontal gradients are dampened by a Laplacian friction which selectively dampens small scales. (This is necessary for numerical stability). 3
.")
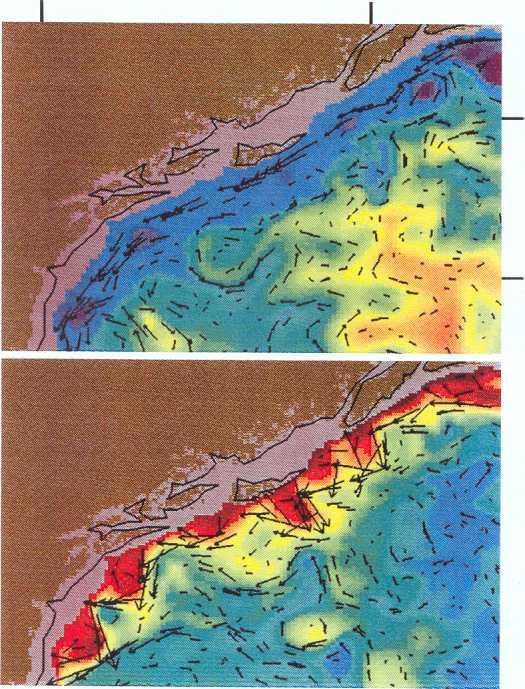
5 In an extensive examination of oceanographic data collected during in the Gulf of Alaska, Tabata (15) concluded that "baroclinic eddies occur frequently in this region. Among these is the recurring, well developed, anticyclonic eddy situated within a few hundred kilometers of Sitka", now commonly called the Sitka eddy (13). The diameter of the Sitka eddy is observed to be 200 km km, with a vertical isopycnal deflection of 20 m m. Furthermore, the initial location of the Sitka eddy is 150 kin km off the coast of Baranof ISland, and it can persist for 10 to 17 months, drifting southwestward. All of these aspects of the Sitka eddy are reproduced qualitatively and quantitatively by the numerical model (diameter 150 km km, isopycnal deflection of up to 100 m, initial location 200 km off Baranof IS., persisting for longer than one year). Tabata (15) indicates that one or more anticyclonic eddies exist off Sitka during most years, if not every year. A Sitka eddy was definitely present in 1958, 1960, 1961 and The data also give some evidence of the Sitka eddy in 1954, 1956, 1959, 1962 and For many years the data are insufficient to draw any conclusion. The numerical model produces at least one anticyclonic eddy off Sitka in six of the nine eddy generation seasons. In 1984, the circulation in the region is dominated by the lasting effect of the strong eddy that was generated the year before; and although the isopycnal interfaces do not clearly indicate the presence of an eddy in the winter and spring of 1985, the circulation in the region is distinctly anticyclonic. The 1989 season follows an EI Viejo event and eddies are not generated. (EI Viejo means cold SST anomalies in the tropical Pacific and is the opposite phase from EI Nino.) During the model run, there are several years that are classified as EI Nino years in the tropical Pacific. The largest EI Nino event in recent history occurred during the 1982/83 boreal (northern) winter. Between 1981 and 1991 there is only one recognized EI Viejo event - during the 1988/89 boreal winter. Figure 2 shows the deflection of the interface between the second and third layer in the model during an EI Nino and an EI Viejo. This depiction indicates an ENSO influence on eddy generation in the Gulf of Alaska. Furthermore, keeping in mind that the mean depth of the upper two layers is, m in coastal regions, the ENSO effect is substantial in this area. Extreme events in the tropical Pacific Ocean affects both the atmospheric and oceanic 4
 or due to changes in the local atmospheric forcing.")
6 circulation. It is impossible to conclude from Fig. 2 alone whether the changes that are seen in the area are due to remote forcing in the ocean through a coastal Kelvin wave teleconnection (16) or due to changes in the local atmospheric forcing. Both forcings are present in the model dynamics and it is difficult to separate their independent effects. However, coastal Kelvin waves are clearly observed in the model to propagate from the equatorial Pacific into the Gulf of Alaska.. Their arrival in the Gulf is immediately antecedent to the disruption of the Alaska. Current and the formation of eddies. Previous studies have hypothesized that the interannual variability in the Gulf of Alaska. may be affected by ENSO events in the tropical Pacific Ocean (2, 3). Although such a link is not discussed by Tabata, the observations of the Sitka. eddy indicate interannual variability, yielding clues to any relationship with the tropical ocean. In his study, Tabata refers to the possible presence of the Sitka. eddy with various degrees of certainty ("a hint of it", "a suggestion of it", "definite indication" and so on). Though the various degrees of certainty in the observational information may be attributed to the sparsity of available data, it is likely this reflects the interannual variability of the mesoscale ocean circulation off Sitka. as well. If the Sitka. eddy is weak, it will be correspondingly hard to detect in the observational data. As can be seen from Fig. 3, the simulation results contain a significant amount of mesoscale variability in this region. In the datasets that are surveyed by Tabata (15), the spring of 1958, the summers of 1960 and 1961, and the spring of 1977 are the times when the Sitka. eddy was undoubtedly present. Both 1957/58 and 1976/77 were seasons with an EI Nino event in the tropical Pacific Ocean. This corresponds well to the results of the numerical simulation: the 1982/83 El Nino was the largest in the 20th century and appears to have produced eddies in the Gulf of Alaska.. On the other hand, the 1986/87 EI Nino, which was of moderate size, does not spawn a large number of eddies in the Gulf of Alaska. in the numerical model, so the evidence is inconclusive. The lack of a significant ENSO response in 1986/87 may be due to inadequate ECMWF winds over the equatorial Pacific during this time. Repression of eddy activity following EI Viejo tropical events is supported by the measurements off Sitka.. There are two such events reviewed in Tabata (15), which occur in 1955/56 and 1956/57 EI Viejo events. In the spring and summer of 1956 and 1957, Tabata concludes that the Sitka. eddy is either 5


7 weak or non-existent. Following the 1988/89 EI Viejo tropical event, the eddy activity in the Gulf of Alaska is strongly suppressed in the numerical model. Both the observational data and the model result suggest that the interannual variability in the Gulf of Alaska is correlated with EI Nino and EI Viejo events in the tropical Pacific Ocean. The long-term effect of such events in the North Pacific Ocean circulation was recently reported based on results from another version of the present numerical model (17). There it was demonstrated that the 1982/83 El Nino triggered planetary waves that crossed the North Pacific basin and caused a partial northward re-routing of the Kuroshio Extension in This paper demonstrates that the high-latitude ocean also responds strongly to ENSO events, having memory over thousands of kilometers and many years. The discovery of remotely forced interannual changes in upper ocean circulation heralds a new era in. understanding the behavior of the upper ocean on short-term climate scales. How these oceanic changes effect marine life or local weather patterns is not fully understood. REFERENCES 1. R. K. Reed, R. D. Muench, J. D. Schumacher, Deep-Sea Res. 27, 509 (1980). 2. R. K. Reed, Deep-Sea Res. 31, 169 (1984). 3. P. F. Cummins, J. Phys. Oceanogr. 19, 1649 (1989). 4. P. K. Heim, M. A. Johnson, J. J. O'Brien, J: Geophys. Res. 97C,17,765 (1992). I 5. P. F. Cummins and L. A. Mysak, J. Phys. Oceanogr. 18, 1261 (1988). 6. W. J. Emery and K. Hamilton, J. Geophys. Res. 90C, 857 (1985). 7. L. A. Mysak, in EI Nino north: Nino effects in the eastern subarctic Pacific Ocean, W. S. Wooster, Ed. (Univ. of Washington Sea Grant Publ., 1985) p H.E. Hurlburt and J.O. Thompson, J. Phys. Oceanogr. 10, 1611, (1980). 9. A. J. Wallcraft, NOARL Report no 35, Naval Res. Lab., Stennis Space Center, MS, 21'pp (1991). 10. H.E. Hurlburt, A.J. Wallcraft, W.J. Schmitz, Jr., P.J. Hogan and E.J. Metzger, J. Geophys. Res., (in press), (1995). 11. S. Hellerman and M. Rosenstein, J. Phys. Oceanogr. 13, 1093 (1983). 6
. 17. G. A. Jacobs, H. E. Hurlburt, J. C. Kindle, E. J. Metzger, J. L. Mitchell, W. J. Teague, A. J. Wallcraft, Nature, 370, 360 (1994).")
8 12. G. S. E. Lagerloef, R. D. Muench, J. D. Schumacher, J. Phys. Oceanogr. 11,627 (1981). 13. T. C. Royer, Deep Sea Res. 22, 403 (1975). 14. E. A. Eady, Tenus 1, 33 (1949) S. Tabata, J. Phys. Oceanogr., 12, 1260 (1982). 16. D.B. Chelton and R.E. Davis, J. Phys. Oceanogr., 12, 757 (1982). 17. G. A. Jacobs, H. E. Hurlburt, J. C. Kindle, E. J. Metzger, J. L. Mitchell, W. J. Teague, A. J. Wallcraft, Nature, 370, 360 (1994). 18. Financial supported is provided by SERDP and by the Norwegian Science Council (Norges Forskningsrad). The Physical Oceanography Branch of the Office of Naval Research provides the base support for Center for Ocean-Atmosphere Prediction Studies. Thanks for D. Muller for many helpful discussions. 7
 > Q).")
 Anomaly of absolute sea level.")
9 A ~ 201 -, >- "'(ij 10 E 0 c: «0 "'Q5 > Q) -J -10 co Q) (/) -20 ~ ~ t\j ~I ij Ē0- >- "'(ij E 0 c «"'Q) > Q)..J cu Q) (/) YEAR Figure 1: A comparison of sea level observed at Sitka, Alaska with sea level in the ocean model. Thick line is from the IGOSS station at Sitka, AK. Thin line is model results. (A) Anomaly of absolute sea level. (B) After removal of the annual sinusoid obtained through a least-squares fit. The anomaly was filtered with a one year boxcar filter. 8


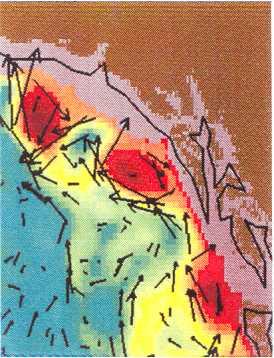
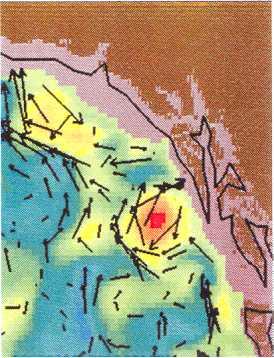
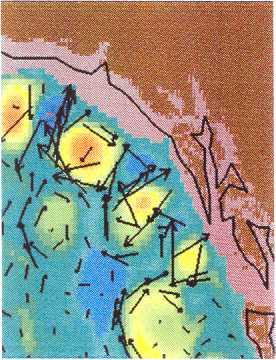
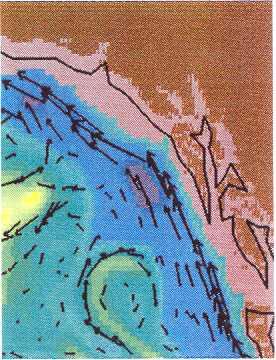
10 Figure 2: ENSO signal in the Gulf of Alaska. from the simulation. The ocean circulation in the Gulf of Alaska following the 1982/83 El Nino in the tropical Pacific Ocean is shown on the left-hand side. The situation following the 1988/89 EI Viejo event (La Nina) is displayed to the right. Both depictiqns show the situation on February 13 (1983 and 1989). The colors indicate the deviation of the thickness of the two upper layers from the seasonal mean. Yellow and red colors show downwelled regions; blue and purple colors correspond to upwelled; and green colors indicate values close to the mean. The arrows depict the direction and strength of the currents. Figure 3: Interannual mesoscale variability. The ocean circulation that results from the numerical simulation is depicted for the same day (February 28) of 4 different years. Here, (a), (b), (c) and (d) correspond to 1983, 1986, 1988 and 1989, respectively. Note that (a) and (c) follow EI Nino events in the tropical Pacific Ocean, whereas (d) follows a EI Viejo event. The anticy- Ionic circulation that is observed in (d) is a remnant of the eddies that were generated the year before. The color coding is the same as in Figure 2. 9
11

12
North Pacific Climate Overview N. Bond (UW/JISAO), J. Overland (NOAA/PMEL) Contact: Last updated: August 2009
, J. Overland (NOAA/PMEL) Contact: Last updated: August 2009") North Pacific Climate Overview N. Bond (UW/JISAO), J. Overland (NOAA/PMEL) Contact: Nicholas.Bond@noaa.gov Last updated: August 2009 Summary. The North Pacific atmosphere-ocean system from fall 2008 through
North Pacific Climate Overview N. Bond (UW/JISAO), J. Overland (NOAA/PMEL) Contact: Nicholas.Bond@noaa.gov Last updated: August 2009 Summary. The North Pacific atmosphere-ocean system from fall 2008 through
Pacific HYCOM. E. Joseph Metzger, Harley E. Hurlburt, Alan J. Wallcraft, Luis Zamudio and Patrick J. Hogan
 Pacific HYCOM E. Joseph Metzger, Harley E. Hurlburt, Alan J. Wallcraft, Luis Zamudio and Patrick J. Hogan Naval Research Laboratory, Stennis Space Center, MS Center for Ocean-Atmospheric Prediction Studies,
North Pacific Climate Overview N. Bond (UW/JISAO), J. Overland (NOAA/PMEL) Contact: Last updated: September 2008
, J. Overland (NOAA/PMEL) Contact: Last updated: September 2008") North Pacific Climate Overview N. Bond (UW/JISAO), J. Overland (NOAA/PMEL) Contact: Nicholas.Bond@noaa.gov Last updated: September 2008 Summary. The North Pacific atmosphere-ocean system from fall 2007
North Pacific Climate Overview N. Bond (UW/JISAO), J. Overland (NOAA/PMEL) Contact: Nicholas.Bond@noaa.gov Last updated: September 2008 Summary. The North Pacific atmosphere-ocean system from fall 2007
Ocean cycles and climate ENSO, PDO, AMO, AO
 Ocean cycles and climate ENSO, PDO, AMO, AO 3 2.5 2 enso-index 1.5 1 0.5 0-0.5-1 enso 3.4 -index - 1996 to 1999-1.5 1996 1997 1998 1999 Bob Tisdale Bob Tisdale Bob Tisdale ENSO mechanisms animation http://esminfo.prenhall.com/science/geoanimations/animations/26_ninonina.html
The North Atlantic Oscillation: Climatic Significance and Environmental Impact
 1 The North Atlantic Oscillation: Climatic Significance and Environmental Impact James W. Hurrell National Center for Atmospheric Research Climate and Global Dynamics Division, Climate Analysis Section
An Introduction to Coupled Models of the Atmosphere Ocean System
 An Introduction to Coupled Models of the Atmosphere Ocean System Jonathon S. Wright jswright@tsinghua.edu.cn Atmosphere Ocean Coupling 1. Important to climate on a wide range of time scales Diurnal to
The Planetary Circulation System
 12 The Planetary Circulation System Learning Goals After studying this chapter, students should be able to: 1. describe and account for the global patterns of pressure, wind patterns and ocean currents
Propagation of wind and buoyancy forced density anomalies in the North Pacific: Dependence on ocean model resolution
 Ocean Modelling 16 (2007) 277 284 Short Communication Propagation of wind and buoyancy forced density anomalies in the North Pacific: Dependence on ocean model resolution LuAnne Thompson *, Jordan Dawe
Wind: Global Systems Chapter 10
 Wind: Global Systems Chapter 10 General Circulation of the Atmosphere General circulation of the atmosphere describes average wind patterns and is useful for understanding climate Over the earth, incoming
2013 ATLANTIC HURRICANE SEASON OUTLOOK. June RMS Cat Response
 2013 ATLANTIC HURRICANE SEASON OUTLOOK June 2013 - RMS Cat Response Season Outlook At the start of the 2013 Atlantic hurricane season, which officially runs from June 1 to November 30, seasonal forecasts
Winds and Global Circulation
 Winds and Global Circulation Atmospheric Pressure Winds Global Wind and Pressure Patterns Oceans and Ocean Currents El Nino How is Energy Transported to its escape zones? Both atmospheric and ocean transport
PRMS WHITE PAPER 2014 NORTH ATLANTIC HURRICANE SEASON OUTLOOK. June RMS Event Response
 PRMS WHITE PAPER 2014 NORTH ATLANTIC HURRICANE SEASON OUTLOOK June 2014 - RMS Event Response 2014 SEASON OUTLOOK The 2013 North Atlantic hurricane season saw the fewest hurricanes in the Atlantic Basin
11/24/09 OCN/ATM/ESS The Pacific Decadal Oscillation. What is the PDO? Causes of PDO Skepticism Other variability associated with PDO
 11/24/09 OCN/ATM/ESS 587.. The Pacific Decadal Oscillation What is the PDO? Causes of PDO Skepticism Other variability associated with PDO The Pacific Decadal Oscillation (PDO). (+) ( ) EOF 1 of SST (+)
Cold air outbreak over the Kuroshio Extension Region
 Cold air outbreak over the Kuroshio Extension Region Jensen, T. G. 1, T. Campbell 1, T. A. Smith 1, R. J. Small 2 and R. Allard 1 1 Naval Research Laboratory, 2 Jacobs Engineering NRL, Code 7320, Stennis
lecture 11 El Niño/Southern Oscillation (ENSO) Part II
 Part II") lecture 11 El Niño/Southern Oscillation (ENSO) Part II SYSTEM MEMORY: OCEANIC WAVE PROPAGATION ASYMMETRY BETWEEN THE ATMOSPHERE AND OCEAN The atmosphere and ocean are not symmetrical in their responses
lecture 11 El Niño/Southern Oscillation (ENSO) Part II SYSTEM MEMORY: OCEANIC WAVE PROPAGATION ASYMMETRY BETWEEN THE ATMOSPHERE AND OCEAN The atmosphere and ocean are not symmetrical in their responses
Characteristics of Sea Surface Circulation and Eddy Field in the South China Sea Revealed by Satellite Altimetric Data
 Journal of Oceanography, Vol. 56, pp. 331 to 344, 2000 Characteristics of Sea Surface Circulation and Eddy Field in the South China Sea Revealed by Satellite Altimetric Data AKIHIKO MORIMOTO 1 *, KOICHI
CHAPTER 9 ATMOSPHERE S PLANETARY CIRCULATION MULTIPLE CHOICE QUESTIONS
 CHAPTER 9 ATMOSPHERE S PLANETARY CIRCULATION MULTIPLE CHOICE QUESTIONS 1. Viewed from above in the Northern Hemisphere, surface winds about a subtropical high blow a. clockwise and inward. b. counterclockwise.
KUALA LUMPUR MONSOON ACTIVITY CENT
 T KUALA LUMPUR MONSOON ACTIVITY CENT 2 ALAYSIAN METEOROLOGICAL http://www.met.gov.my DEPARTMENT MINISTRY OF SCIENCE. TECHNOLOGY AND INNOVATIO Introduction Atmospheric and oceanic conditions over the tropical
THE INFLUENCE OF CLIMATE TELECONNECTIONS ON WINTER TEMPERATURES IN WESTERN NEW YORK INTRODUCTION
 Middle States Geographer, 2014, 47: 60-67 THE INFLUENCE OF CLIMATE TELECONNECTIONS ON WINTER TEMPERATURES IN WESTERN NEW YORK Frederick J. Bloom and Stephen J. Vermette Department of Geography and Planning
Analysis of Fall Transition Season (Sept-Early Dec) Why has the weather been so violent?
 Why has the weather been so violent?") WEATHER TOPICS Analysis of Fall Transition Season (Sept-Early Dec) 2009 Why has the weather been so violent? As can be seen by the following forecast map, the Fall Transition and early Winter Season of
WEATHER TOPICS Analysis of Fall Transition Season (Sept-Early Dec) 2009 Why has the weather been so violent? As can be seen by the following forecast map, the Fall Transition and early Winter Season of
ESCI 344 Tropical Meteorology Lesson 7 Temperature, Clouds, and Rain
 ESCI 344 Tropical Meteorology Lesson 7 Temperature, Clouds, and Rain References: Forecaster s Guide to Tropical Meteorology (updated), Ramage Tropical Climatology, McGregor and Nieuwolt Climate and Weather
Please be ready for today by:
 Please be ready for today by: 1. HW out for a stamp 2. Paper and pencil/pen for notes 3. Be ready to discuss what you know about El Nino after you view the video clip What is El Nino? El Nino Basics El
UC Irvine Faculty Publications
 UC Irvine Faculty Publications Title A linear relationship between ENSO intensity and tropical instability wave activity in the eastern Pacific Ocean Permalink https://escholarship.org/uc/item/5w9602dn
An upper to mid level circulation (Low) in the NW Caribbean is
 in the NW Caribbean is") WEEKLY WEATHER OUTLOOK BELIZE, CENTRAL AMERICA PERIOD: Monday-Monday, Oct. 1 October 8, 2012 DATE ISSUED: Monday, Oct 1, 2012 6:00 am RFrutos EcoSolutions & Services SYNOPSIS: An upper to mid level circulation
WEEKLY WEATHER OUTLOOK BELIZE, CENTRAL AMERICA PERIOD: Monday-Monday, Oct. 1 October 8, 2012 DATE ISSUED: Monday, Oct 1, 2012 6:00 am RFrutos EcoSolutions & Services SYNOPSIS: An upper to mid level circulation
East-west SST contrast over the tropical oceans and the post El Niño western North Pacific summer monsoon
 GEOPHYSICAL RESEARCH LETTERS, VOL. 32, L15706, doi:10.1029/2005gl023010, 2005 East-west SST contrast over the tropical oceans and the post El Niño western North Pacific summer monsoon Toru Terao Faculty
NOTES AND CORRESPONDENCE. Wind Stress Drag Coefficient over the Global Ocean*
 5856 J O U R N A L O F C L I M A T E VOLUME 20 NOTES AND CORRESPONDENCE Wind Stress Drag Coefficient over the Global Ocean* A. BIROL KARA, ALAN J. WALLCRAFT, E. JOSEPH METZGER, AND HARLEY E. HURLBURT Oceanography
Delayed Response of the Extratropical Northern Atmosphere to ENSO: A Revisit *
 Delayed Response of the Extratropical Northern Atmosphere to ENSO: A Revisit * Ruping Mo Pacific Storm Prediction Centre, Environment Canada, Vancouver, BC, Canada Corresponding author s address: Ruping
El Niño Update Impacts on Florida
 Current Issues in Emergency Management (CIEM) Sessions 1 &2 October 12 th and 26 th, 2006 Florida Division of Emergency Management Tallahassee, Florida El Niño Update Impacts on Florida Bart Hagemeyer
NOTES AND CORRESPONDENCE. El Niño Southern Oscillation and North Atlantic Oscillation Control of Climate in Puerto Rico
 2713 NOTES AND CORRESPONDENCE El Niño Southern Oscillation and North Atlantic Oscillation Control of Climate in Puerto Rico BJÖRN A. MALMGREN Department of Earth Sciences, University of Göteborg, Goteborg,
ENSO Cycle: Recent Evolution, Current Status and Predictions. Update prepared by Climate Prediction Center / NCEP 23 April 2012
 ENSO Cycle: Recent Evolution, Current Status and Predictions Update prepared by Climate Prediction Center / NCEP 23 April 2012 Outline Overview Recent Evolution and Current Conditions Oceanic Niño Index
Ocean Boundary Currents Guiding Question: How do western boundary currents influence climate and ocean productivity?
 Name: Date: TEACHER VERSION: Suggested Student Responses Included Ocean Boundary Currents Guiding Question: How do western boundary currents influence climate and ocean productivity? Introduction The circulation
JP1.7 A NEAR-ANNUAL COUPLED OCEAN-ATMOSPHERE MODE IN THE EQUATORIAL PACIFIC OCEAN
 JP1.7 A NEAR-ANNUAL COUPLED OCEAN-ATMOSPHERE MODE IN THE EQUATORIAL PACIFIC OCEAN Soon-Il An 1, Fei-Fei Jin 1, Jong-Seong Kug 2, In-Sik Kang 2 1 School of Ocean and Earth Science and Technology, University
Depth Distribution of the Subtropical Gyre in the North Pacific
 Journal of Oceanography, Vol. 58, pp. 525 to 529, 2002 Short Contribution Depth Distribution of the Subtropical Gyre in the North Pacific TANGDONG QU* International Pacific Research Center, SOEST, University
Coastal Ocean Circulation Experiment off Senegal (COCES)
") DISTRIBUTION STATEMENT A. Approved for public release; distribution is unlimited. Coastal Ocean Circulation Experiment off Senegal (COCES) Pierre-Marie Poulain Istituto Nazionale di Oceanografia e di Geofisica
DISTRIBUTION STATEMENT A. Approved for public release; distribution is unlimited. Coastal Ocean Circulation Experiment off Senegal (COCES) Pierre-Marie Poulain Istituto Nazionale di Oceanografia e di Geofisica
Why the Atlantic was surprisingly quiet in 2013
 1 Why the Atlantic was surprisingly quiet in 2013 by William Gray and Phil Klotzbach Preliminary Draft - March 2014 (Final draft by early June) ABSTRACT This paper discusses the causes of the unusual dearth
Introduction of climate monitoring and analysis products for one-month forecast
 Introduction of climate monitoring and analysis products for one-month forecast TCC Training Seminar on One-month Forecast on 13 November 2018 10:30 11:00 1 Typical flow of making one-month forecast Observed
 Page 1 of 5 Home research global climate enso effects Research Effects of El Niño on world weather Precipitation Temperature Tropical Cyclones El Niño affects the weather in large parts of the world. The
1. The figure shows sea surface height (SSH) anomaly at 24 S (southern hemisphere), from a satellite altimeter.
 anomaly at 24 S (southern hemisphere), from a satellite altimeter.") SIO 210 Problem Set 3 November 16, 2015 1. The figure shows sea surface height (SSH) anomaly at 24 S (southern hemisphere), from a satellite altimeter. (a) What is the name of this type of data display?_hovmöller
SIO 210 Problem Set 3 November 16, 2015 1. The figure shows sea surface height (SSH) anomaly at 24 S (southern hemisphere), from a satellite altimeter. (a) What is the name of this type of data display?_hovmöller
Climate Variability Studies in the Ocean
 Climate Variability Studies in the Ocean Topic 1. Long-term variations of vertical profiles of nutrients in the western North Pacific Topic 2. Biogeochemical processes related to ocean carbon cycling:
ENSO Cycle: Recent Evolution, Current Status and Predictions. Update prepared by Climate Prediction Center / NCEP 11 November 2013
 ENSO Cycle: Recent Evolution, Current Status and Predictions Update prepared by Climate Prediction Center / NCEP 11 November 2013 Outline Overview Recent Evolution and Current Conditions Oceanic Niño Index
Assessment of the Impact of El Niño-Southern Oscillation (ENSO) Events on Rainfall Amount in South-Western Nigeria
 Events on Rainfall Amount in South-Western Nigeria") 2016 Pearl Research Journals Journal of Physical Science and Environmental Studies Vol. 2 (2), pp. 23-29, August, 2016 ISSN 2467-8775 Full Length Research Paper http://pearlresearchjournals.org/journals/jpses/index.html
2016 Pearl Research Journals Journal of Physical Science and Environmental Studies Vol. 2 (2), pp. 23-29, August, 2016 ISSN 2467-8775 Full Length Research Paper http://pearlresearchjournals.org/journals/jpses/index.html
Lecture 28. El Nino Southern Oscillation (ENSO) part 5
 part 5") Lecture 28 El Nino Southern Oscillation (ENSO) part 5 Understanding the phenomenon Until the 60s the data was so scant that it seemed reasonable to consider El Nino as an occasional departure from normal
Lecture 28 El Nino Southern Oscillation (ENSO) part 5 Understanding the phenomenon Until the 60s the data was so scant that it seemed reasonable to consider El Nino as an occasional departure from normal
Extratropical planetary wave propagation characteristics from the ATSR global Sea Surface Temperature record.
 Extratropical planetary wave propagation characteristics from the ATSR global Sea Surface Temperature record. Katherine L. Hill, Ian S. Robinson, Paolo Cipollini Southampton Oceanography Centre European
Mid-season Storm Surge Update: December, 2013
 December 17, 2012 Ambleside Beach (Photograph by: Mark van Manen, PNG) Mid-season Storm Surge Update: December, 2013 Mid-season discussion of tidal and climate conditions affecting extreme water levels
The feature of atmospheric circulation in the extremely warm winter 2006/2007
 The feature of atmospheric circulation in the extremely warm winter 2006/2007 Hiroshi Hasegawa 1, Yayoi Harada 1, Hiroshi Nakamigawa 1, Atsushi Goto 1 1 Climate Prediction Division, Japan Meteorological
Oceanography Quiz 2. Multiple Choice Identify the choice that best completes the statement or answers the question.
 Oceanography Quiz 2 Multiple Choice Identify the choice that best completes the statement or answers the question. 1. The highest and lowest tides are known as the spring tides. When do these occur? a.
1/12 Pacific HYCOM: The End Of A Long Simulation
 1/12 Pacific HYCOM: The End Of A Long Simulation E. Joseph Metzger,, Harley E. Hurlburt and Alan J. Wallcraft Naval Research Laboratory, Stennis Space Center, MS HYCOM NOPP GODAE Meeting 27-29 29 October
MAURITIUS METEOROLOGICAL SERVICES
 MAURITIUS METEOROLOGICAL SERVICES CLIMATE NOVEMBER 2018 Introduction Climatologically speaking, November is a relatively dry month for Mauritius with a long term monthly mean rainfall of 78 mm. However,
Evaluating a Genesis Potential Index with Community Climate System Model Version 3 (CCSM3) By: Kieran Bhatia
 By: Kieran Bhatia") Evaluating a Genesis Potential Index with Community Climate System Model Version 3 (CCSM3) By: Kieran Bhatia I. Introduction To assess the impact of large-scale environmental conditions on tropical cyclone
Evaluating a Genesis Potential Index with Community Climate System Model Version 3 (CCSM3) By: Kieran Bhatia I. Introduction To assess the impact of large-scale environmental conditions on tropical cyclone
APPENDIX B PHYSICAL BASELINE STUDY: NORTHEAST BAFFIN BAY 1
 APPENDIX B PHYSICAL BASELINE STUDY: NORTHEAST BAFFIN BAY 1 1 By David B. Fissel, Mar Martínez de Saavedra Álvarez, and Randy C. Kerr, ASL Environmental Sciences Inc. (Feb. 2012) West Greenland Seismic
A New Mapping Method for Sparse Observations of Propagating Features
 A New Mapping Method for Sparse Observations of Propagating Features Using Complex Empirical Orthogonal Function Analysis for spatial and temporal interpolation with applications to satellite data (appears
ENSO Cycle: Recent Evolution, Current Status and Predictions. Update prepared by Climate Prediction Center / NCEP 25 February 2013
 ENSO Cycle: Recent Evolution, Current Status and Predictions Update prepared by Climate Prediction Center / NCEP 25 February 2013 Outline Overview Recent Evolution and Current Conditions Oceanic Niño Index
Trends in Climate Teleconnections and Effects on the Midwest
 Trends in Climate Teleconnections and Effects on the Midwest Don Wuebbles Zachary Zobel Department of Atmospheric Sciences University of Illinois, Urbana November 11, 2015 Date Name of Meeting 1 Arctic
ENSO: Recent Evolution, Current Status and Predictions. Update prepared by: Climate Prediction Center / NCEP 30 October 2017
 ENSO: Recent Evolution, Current Status and Predictions Update prepared by: Climate Prediction Center / NCEP 30 October 2017 Outline Summary Recent Evolution and Current Conditions Oceanic Niño Index (ONI)
ATMOSPHERIC MODELLING. GEOG/ENST 3331 Lecture 9 Ahrens: Chapter 13; A&B: Chapters 12 and 13
 ATMOSPHERIC MODELLING GEOG/ENST 3331 Lecture 9 Ahrens: Chapter 13; A&B: Chapters 12 and 13 Agenda for February 3 Assignment 3: Due on Friday Lecture Outline Numerical modelling Long-range forecasts Oscillations
Chapter outline. Reference 12/13/2016
 Chapter 2. observation CC EST 5103 Climate Change Science Rezaul Karim Environmental Science & Technology Jessore University of science & Technology Chapter outline Temperature in the instrumental record
A Synthesis of Results from the Norwegian ESSAS (N-ESSAS) Project
 Project") A Synthesis of Results from the Norwegian ESSAS (N-ESSAS) Project Ken Drinkwater Institute of Marine Research Bergen, Norway ken.drinkwater@imr.no ESSAS has several formally recognized national research
A Synthesis of Results from the Norwegian ESSAS (N-ESSAS) Project Ken Drinkwater Institute of Marine Research Bergen, Norway ken.drinkwater@imr.no ESSAS has several formally recognized national research
THE BC SHELF ROMS MODEL
 THE BC SHELF ROMS MODEL Diane Masson & Isaac Fine, Institute of Ocean Sciences The Canadian west coast perspective (filling the gap ) AVISO, Eddy Kinetic Energy (cm 2 s -2 ) In this talk Model set-up and
ENSO: Recent Evolution, Current Status and Predictions. Update prepared by: Climate Prediction Center / NCEP 9 November 2015
 ENSO: Recent Evolution, Current Status and Predictions Update prepared by: Climate Prediction Center / NCEP 9 November 2015 Outline Summary Recent Evolution and Current Conditions Oceanic Niño Index (ONI)
Bifurcation of the Pacific North Equatorial Current in a wind-driven model: response to climatological winds
 Ocean Dynamics (2011) 61:1329 1344 DOI 10.1007/s10236-011-0427-2 Bifurcation of the Pacific North Equatorial Current in a wind-driven model: response to climatological winds Tommy G. Jensen Received: 23
Lecture 1. Amplitude of the seasonal cycle in temperature
 Lecture 6 Lecture 1 Ocean circulation Forcing and large-scale features Amplitude of the seasonal cycle in temperature 1 Atmosphere and ocean heat transport Trenberth and Caron (2001) False-colour satellite
The biological importance of the major ocean currents
 The biological importance of the major ocean currents Squid and the western boundary currents Illex illecebrosus, the short-finned squid Squid use the Gulf Stream to facilitate their migration. The center
ENSO Cycle: Recent Evolution, Current Status and Predictions. Update prepared by Climate Prediction Center / NCEP 5 August 2013
 ENSO Cycle: Recent Evolution, Current Status and Predictions Update prepared by Climate Prediction Center / NCEP 5 August 2013 Outline Overview Recent Evolution and Current Conditions Oceanic Niño Index
Lecture 8: Natural Climate Variability
 Lecture 8: Natural Climate Variability Extratropics: PNA, NAO, AM (aka. AO), SAM Tropics: MJO Coupled A-O Variability: ENSO Decadal Variability: PDO, AMO Unforced vs. Forced Variability We often distinguish
Lab 12: El Nino Southern Oscillation
 Name: Date: OCN 104: Our Dynamic Ocean Lab 12: El Nino Southern Oscillation Part 1: Observations of the tropical Pacific Ocean during a normal year The National Oceanographic and Atmospheric Administration
Weather & Ocean Currents
 Weather & Ocean Currents Earth is heated unevenly Causes: Earth is round Earth is tilted on an axis Earth s orbit is eliptical Effects: Convection = vertical circular currents caused by temperature differences
Changes in Southern Hemisphere rainfall, circulation and weather systems
 19th International Congress on Modelling and Simulation, Perth, Australia, 12 16 December 2011 http://mssanz.org.au/modsim2011 Changes in Southern Hemisphere rainfall, circulation and weather systems Frederiksen,
1. Introduction. 2. Verification of the 2010 forecasts. Research Brief 2011/ February 2011
 Research Brief 2011/01 Verification of Forecasts of Tropical Cyclone Activity over the Western North Pacific and Number of Tropical Cyclones Making Landfall in South China and the Korea and Japan region
Name: Date: Hour: Comparing the Effects of El Nino & La Nina on the Midwest (E4.2c)
") Purpose: Comparing the Effects of El Nino & La Nina on the Midwest (E4.2c) To compare the effects of El Nino and La Nina on the Midwest United States. Background Knowledge: The El Nino-Southern Oscillation
Purpose: Comparing the Effects of El Nino & La Nina on the Midwest (E4.2c) To compare the effects of El Nino and La Nina on the Midwest United States. Background Knowledge: The El Nino-Southern Oscillation
Introduction of products for Climate System Monitoring
 Introduction of products for Climate System Monitoring 1 Typical flow of making one month forecast Textbook P.66 Observed data Atmospheric and Oceanic conditions Analysis Numerical model Ensemble forecast
NOTES AND CORRESPONDENCE. Effect of Sea Surface Temperature Wind Stress Coupling on Baroclinic Instability in the Ocean
 1092 J O U R N A L O F P H Y S I C A L O C E A N O G R A P H Y VOLUME 37 NOTES AND CORRESPONDENCE Effect of Sea Surface Temperature Wind Stress Coupling on Baroclinic Instability in the Ocean MICHAEL A.
The ENSO s Effect on Eastern China Rainfall in the Following Early Summer
 ADVANCES IN ATMOSPHERIC SCIENCES, VOL. 26, NO. 2, 2009, 333 342 The ENSO s Effect on Eastern China Rainfall in the Following Early Summer LIN Zhongda ( ) andluriyu( F ) Center for Monsoon System Research,
Percentage of normal rainfall for August 2017 Departure from average air temperature for August 2017
 New Zealand Climate Update No 219, August 2017 Current climate August 2017 Overall, mean sea level pressure was lower than normal over and to the west of New Zealand during August while higher than normal
THE PACIFIC DECADAL OSCILLATION (PDO)
") THE PACIFIC DECADAL OSCILLATION (PDO) The Pacific Decadal Oscillation (PDO) refers to cyclical variations in sea surface temperatures in the Pacific Ocean. A detailed summary of the PDO is given in D Aleo
THE PACIFIC DECADAL OSCILLATION (PDO) The Pacific Decadal Oscillation (PDO) refers to cyclical variations in sea surface temperatures in the Pacific Ocean. A detailed summary of the PDO is given in D Aleo
Exploring Climate Patterns Embedded in Global Climate Change Datasets
 Exploring Climate Patterns Embedded in Global Climate Change Datasets James Bothwell, May Yuan Department of Geography University of Oklahoma Norman, OK 73019 jamesdbothwell@yahoo.com, myuan@ou.edu Exploring
Air-Sea Coupling in an Eastern Boundary Current Region
 Air-Sea Coupling in an Eastern Boundary Current Region Eric D. Skyllingstad CEOAS, Oregon State University Roger M. Samelson D. B. Chelton, A. Kurapov CEOAS, Oregon State University N. Perlin RSMAS, University
Climate impact on interannual variability of Weddell Sea Bottom Water
 Climate impact on interannual variability of Weddell Sea Bottom Water Darren C. McKee, LDEO/CU Connecting the Tropics to the Polar Regions Mini-conference at LDEO 06/02/14 Outline Overview of Weddell
2015: A YEAR IN REVIEW F.S. ANSLOW
 2015: A YEAR IN REVIEW F.S. ANSLOW 1 INTRODUCTION Recently, three of the major centres for global climate monitoring determined with high confidence that 2015 was the warmest year on record, globally.
3. Midlatitude Storm Tracks and the North Atlantic Oscillation
 3. Midlatitude Storm Tracks and the North Atlantic Oscillation Copyright 2006 Emily Shuckburgh, University of Cambridge. Not to be quoted or reproduced without permission. EFS 3/1 Review of key results
Forecasting. Theory Types Examples
 Forecasting Theory Types Examples How Good Are Week Out Weather Forecasts? For forecasts greater than nine days out, weather forecasters do WORSE than the climate average forecast. Why is there predictability
2/15/2012. Earth System Science II EES 717 Spring 2012
 Earth System Science II EES 717 Spring 2012 1. The Earth Interior Mantle Convection & Plate Tectonics 2. The Atmosphere - Climate Models, Climate Change and Feedback Processes 3. The Oceans Circulation;
John Steffen and Mark A. Bourassa
 John Steffen and Mark A. Bourassa Funding by NASA Climate Data Records and NASA Ocean Vector Winds Science Team Florida State University Changes in surface winds due to SST gradients are poorly modeled
Climate Variability. Andy Hoell - Earth and Environmental Systems II 13 April 2011
 Climate Variability Andy Hoell - andrew_hoell@uml.edu Earth and Environmental Systems II 13 April 2011 The Earth System Earth is made of several components that individually change throughout time, interact
ENSO Cycle: Recent Evolution, Current Status and Predictions. Update prepared by Climate Prediction Center / NCEP 15 July 2013
 ENSO Cycle: Recent Evolution, Current Status and Predictions Update prepared by Climate Prediction Center / NCEP 15 July 2013 Outline Overview Recent Evolution and Current Conditions Oceanic Niño Index
Climate Forecast Applications Network (CFAN)
") Forecast of 2018 Atlantic Hurricane Activity April 5, 2018 Summary CFAN s inaugural April seasonal forecast for Atlantic tropical cyclone activity is based on systematic interactions among ENSO, stratospheric
Forecast of 2018 Atlantic Hurricane Activity April 5, 2018 Summary CFAN s inaugural April seasonal forecast for Atlantic tropical cyclone activity is based on systematic interactions among ENSO, stratospheric
Modeling the Formation and Offshore Transport of Dense Water from High-Latitude Coastal Polynyas
 Modeling the Formation and Offshore Transport of Dense Water from High-Latitude Coastal Polynyas David C. Chapman Woods Hole Oceanographic Institution Woods Hole, MA 02543 phone: (508) 289-2792 fax: (508)
Role of the Indian Ocean SST anomalies in the coupling of the Atmosphere and Ocean
 Role of the Indian Ocean SST anomalies in the coupling of the Atmosphere and Ocean C.Perigaud (*),J.D.Neelin (UCLA) and J. McCreary (IPRC) (* CALTECH/Jet Propulsion Laboratory, Pasadena, CA91109; 818-354-8203;
Climate Outlook through 2100 South Florida Ecological Services Office Vero Beach, FL September 9, 2014
 Climate Outlook through 2100 South Florida Ecological Services Office Vero Beach, FL September 9, 2014 Short Term Drought Map: Short-term (
ENSO Cycle: Recent Evolution, Current Status and Predictions. Update prepared by Climate Prediction Center / NCEP 24 September 2012
 ENSO Cycle: Recent Evolution, Current Status and Predictions Update prepared by Climate Prediction Center / NCEP 24 September 2012 Outline Overview Recent Evolution and Current Conditions Oceanic Niño
New Zealand Climate Update No 223, January 2018 Current climate December 2017
 New Zealand Climate Update No 223, January 2018 Current climate December 2017 December 2017 was characterised by higher than normal sea level pressure over New Zealand and the surrounding seas. This pressure
Impacts of Climate Change on Autumn North Atlantic Wave Climate
 Impacts of Climate Change on Autumn North Atlantic Wave Climate Will Perrie, Lanli Guo, Zhenxia Long, Bash Toulany Fisheries and Oceans Canada, Bedford Institute of Oceanography, Dartmouth, NS Abstract
Environmental changes
 Environmental changes What are the fishery, environmental, and trophic effects in historical data? Can we use short-term predictions from multiple regression models? Two kind of predictions: What happens
Eurasian Snow Cover Variability and Links with Stratosphere-Troposphere Coupling and Their Potential Use in Seasonal to Decadal Climate Predictions
 US National Oceanic and Atmospheric Administration Climate Test Bed Joint Seminar Series NCEP, Camp Springs, Maryland, 22 June 2011 Eurasian Snow Cover Variability and Links with Stratosphere-Troposphere
ATSR SST Observations of the Tropical Pacific Compared with TOPEX/Poseidon Sea Level Anomaly
 ATSR SST Observations of the Tropical Pacific Compared with TOPEX/Poseidon Sea Level Anomaly J.P.Angell and S.P.Lawrence Earth Observation Science Group, Dept. Physics and Astronomy, Space Research Centre,
El Niño Seasonal Weather Impacts from the OLR Event Perspective
 Science and Technology Infusion Climate Bulletin NOAA s National Weather Service 41 st NOAA Annual Climate Diagnostics and Prediction Workshop Orono, ME, 3-6 October 2016 2015-16 El Niño Seasonal Weather
Primary Factors Contributing to Japan's Extremely Hot Summer of 2010
 temperature anomalies by its standard deviation for JJA 2010 Primary Factors Contributing to Japan's Extremely Hot Summer of 2010 Nobuyuki Kayaba Climate Prediction Division,Japan Meteorological Agancy
Mozambique. General Climate. UNDP Climate Change Country Profiles. C. McSweeney 1, M. New 1,2 and G. Lizcano 1
 UNDP Climate Change Country Profiles Mozambique C. McSweeney 1, M. New 1,2 and G. Lizcano 1 1. School of Geography and Environment, University of Oxford. 2.Tyndall Centre for Climate Change Research http://country-profiles.geog.ox.ac.uk
Weather and Climate Summary and Forecast January 2018 Report
 Weather and Climate Summary and Forecast January 2018 Report Gregory V. Jones Linfield College January 5, 2018 Summary: A persistent ridge of high pressure over the west in December produced strong inversions
Transient/Eddy Flux. Transient and Eddy. Flux Components. Lecture 7: Disturbance (Outline) Why transients/eddies matter to zonal and time means?
 Why transients/eddies matter to zonal and time means?") Lecture 7: Disturbance (Outline) Transients and Eddies Climate Roles Mid-Latitude Cyclones Tropical Hurricanes Mid-Ocean Eddies (From Weather & Climate) Flux Components (1) (2) (3) Three components contribute
Lecture 7: Disturbance (Outline) Transients and Eddies Climate Roles Mid-Latitude Cyclones Tropical Hurricanes Mid-Ocean Eddies (From Weather & Climate) Flux Components (1) (2) (3) Three components contribute
Introduction to Meteorology & Climate. Climate & Earth System Science. Atmosphere Ocean Interactions. A: Structure of the Ocean.
 Climate & Earth System Science Introduction to Meteorology & Climate MAPH 10050 Peter Lynch Peter Lynch Meteorology & Climate Centre School of Mathematical Sciences University College Dublin Meteorology