Raman Albedo and Deep-UV Resonance Raman Signatures of Explosives
|
|
|
- Lee Hawkins
- 5 years ago
- Views:
Transcription
1 Raman Albedo and Deep-UV Resonance Raman Signatures of Explosives Balakishore Yellampalle and Brian Lemoff WVHTC Foundation, 1000 Technology Drive, Suite 1000, Fairmont, WV, USA ABSTRACT Deep-ultraviolet resonance Raman spectroscopy (DUVRRS) is a promising approach to stand-off detection of explosive traces due to large Raman cross-section and background free signatures. In order to design an effective sensor, one must be able to estimate the signal level of the DUVRRS signature for solid-phase explosive residues. The conventional approach to signal estimation uses scattering cross-sections and molar absorptivity, measured on solutions of explosives dissolved in an optically-transparent solvent. Only recently have researchers started to measure solid-state cross-sections. For most solid-phase explosives and explosive mixtures, neither the DUV Raman scattering cross sections nor the optical absorption coefficient are known, and they are very difficult to separately measure. Therefore, for a typical solid explosive mixture, it is difficult to accurately estimate Raman signal strength using conventional approaches. To address this issue, we have developed a technique to measure the Raman scattering strength of optically-thick (opaque) materials, or Raman Albedo, defined as the total power of Raman-scattered light per unit frequency per unit solid angle divided by the incident power of the excitation source. We have measured Raman Albedo signatures for a wide range of solid explosives at four different DUV excitation wavelengths. These results will be presented, and we will describe the use of Raman Albedo measurements in the design and current construction of a novel stand-off explosive sensor, based on dual-excitation-wavelength DUVRRS. Keywords: Raman Albedo, Deep Ultraviolet, Resonance Raman Spectroscopy, Multiple Excitation Wavelengths, Explosive Detection. 1. INTRODUCTION Standoff trace detection is a challenging problem [1,2] and has become increasingly important due to threats from terrorist bombings and improvised explosive devices. Because of several unknown background materials and the minute quantities involved, it is important to know the strengths of explosive signatures while designing a stand-off detection instrument. Deep-ultraviolet resonance Raman spectroscopy (DUVRRS) is a promising approach for stand-off detection of explosive traces due to: 1) resonant enhancement of Raman cross-section [3], and 2) λ -4 cross-section increase [4], thus providing good selectivity and sensitivity. An added advantage of DUV excitation is that Raman signatures are free from fluorescence [5] and solar background. Although visible and IR wavelength excitation show deeper sample penetration in thick explosive materials, the DUV resonance Raman enhancement allows for higher signal levels in very thin, trace explosive samples. An important calculation for the development of a DUVRRS stand-off analytical instrument is the estimation of number of Raman signal photons for a given excitation scenario. This estimation forms a very useful basis for iterative optimization and for exploration of any trade-offs during the design of a stand-off analytical instrument. An estimation of Raman signal counts can be made using the solid-state Raman cross-section, the number of molecules involved, the laser penetration depth and the self-absorption coefficient. However, almost all known explosive Raman cross-section measurements were performed by dissolving the explosive analyte in a nearly transparent reference that is in liquid phase [6], which is less useful than a more accurate solid-state cross-section. University of Pittsburgh has only recently measured the solid-state cross-section of a few explosives [7], and it is not known for a large fraction of explosives. Another problem that arises is the estimation of number of molecules involved in the Raman scattering process, which depends on penetration properties of the excitation laser. For many solid-phase explosives, the laser penetration and
2 Raman self-absorption, which have strong frequency dependence in DUV, are not readily known. Therefore, for a typical solid explosive analyte, it is hard to accurately predict Raman signal strength due to uncertainty in the selfabsorption, laser penetration, and/or solid-state Raman scattering cross-section information. Therefore, it is desirable to have a simpler approach for the signal estimation needed for analytical instrumentation design. In addition to signal estimation, intensity-calibrated Raman spectra measured at several excitation wavelengths in the DUV are useful as signatures for developing analytical instruments based on multiple excitation wavelengths [8] or for optimizing wavelength choice for DUVRRS instruments. In the DUV region, the Raman intensity depends on excitation wavelength in a complex way, forming unique wavelength dependent signatures for different compounds. This is because resonance Raman cross-sections and the absorption of both the excitation and scattered light, which determine Raman intensity, vary strongly with excitation wavelength. We have measured these wavelength dependent signatures, using intensity calibrated Raman spectra, for a variety of solid explosives at four DUV excitation wavelengths. 2.1 Definition 2. RAMAN ALBEDO We have developed a technique for intensity calibration of Raman spectra of various solid optically-thick explosives and show that it is possible to calibrate the spectra in a detection-system-independent manner while simultaneously accounting for all the bulk properties like self-absorption and penetration depth. This measure is named Raman Albedo, akin to linear diffuse bulk reflectivity, or Albedo, of a surface. Since this method accounts for bulk properties, the accuracy of a Raman Albedo measurement depends upon the surface preparation and other bulk properties like granularity and packing fraction of the grains of the solid explosive analyte used in the measurements. If the goal of the measurements is signal estimation for particular real world conditions, the sample preparation should be representative of those conditions. We define Raman Albedo, A(ν), as the total power of Raman-scattered light per unit frequency per unit solid angle divided by the incident power of the excitation source. Raman Albedo is expressed in units of fraction/steradian/cm -1. We also define the Raman Band Albedo, A B, as the Raman Albedo, A(ν), integrated over a Raman band centered at ν B. Raman Band Albedo has units of fraction/steradian. Note that these definitions are independent of the measurement approach and only dependent on the sample properties and the excitation wavelength. For the measurement of Raman Albedo, two independent intensity calibration approaches were used, one based on known Raman scattering intensities of acetonitrile (ACN) and a second based on measured laser scattering from a Teflon surface. The two techniques agreed closely within our experimental error. The measured Raman Albedo can also be extended for explosives that exhibit time dependent spectra (for example due to sample degradation or photolysis [9]). 2.2 Measurement setup Figure 1 shows the experimental setup for measuring intensity-calibrated Raman spectra. The setup used a frequency doubled FRED Ar ion laser that could be tuned to one of four different frequency doubled Ar + wavelengths in the deep UV. The laser was polarized parallel to the optical table and the DUV was separated from the fundamental using a Pellin-Broca prism. The UV laser beam was directed towards a sample using a mirror and without any additional focusing optics. The excitation spot on the sample was imaged on to the spectrometer slit with a demagnification of approximately three. The collection optics consisted of a single lens, located in between the illumination spot and the entrance slit of the spectrometer. A DUV polarizer, oriented parallel to the laser, was placed before the slit in order to remove any polarization effects arising from the optics in the spectrometer. A long pass edge filter was used during measurement of Raman spectra. For some excitations, the edge filter was used at a steep angle (~ 40 degrees). At this angle the filter transmission was strongly dependent on the polarization of the light. The polarizer also ensured that the calibration is not affected by this dependence. Back reflection geometry was used to measure Raman spectra because this geometry is preferred for standoff detection of explosives. Our scattered light collection system had a 9-mm depth of focus, much longer than the liquid ACN reference length (1-mm) or solid sample illumination depth. This ensured that the collection efficiency was independent of the reference or sample length. In the measurements, explosive samples were positioned at the same location as the ACN reference sample volume. Solid explosive samples were prepared by packing the explosive powder in the depression of a metal ring whose axis was oriented at 45 o to the horizontal, to prevent the solid sample powder from

3 falling out. Due to the sample tilt, the laser excitation spot illuminated a region 1.4 mm in length along the optical axis of the collection lens. This illumination depth was much smaller than the depth of focus of the collection system. Figure 1: Top view of the experimental setup for measurement of Raman scattering spectra of explosive materials. 2.3 Calibration approach using ACN reference The first calibration approach is based on using ACN as an external reference. In this approach, the total scattered power per unit solid angle per unit laser power for the 918-cm -1 reference band of ACN is first calculated for the 1-mm long reference sample: This calculation uses the known Raman scattering cross-section for the reference band [10], known molecular number density, and refractive indices of the ACN and cuvette. Note that B ref has the same units as Raman Band Albedo and is an equivalent quantity, except that it applies to Raman scattering from a thin transparent liquid reference sample rather than an optically thick surface. Next, the Raman spectrum of the 1-mm ACN reference is measured, and the total CCD counts, C ref, corresponding to the 918-cm -1 reference band is determined for an acquisition time ref, and an excitation laser power P ref. The final step of the calibration procedure is to measure the wavelength dependence of the detection system. Using a calibrated Deuterium lamp located at the sample/reference position, the relative detection efficiency, ( ), is determined by dividing the spectrum measured by the CCD by the known lamp spectrum and then normalizing to a value of 1 at = 918 cm -1. This function accounts for the wavelength dependence of the Raman filter, polarizer, and spectrometer relative to the reference frequency. Once the detection system is calibrated using this method, Raman Albedo can be measured for solid-phase explosive samples. The experimental setup is identical while the explosive sample spectrum is measured. Raman Albedo of the sample is calculated as follows: ( ) ( ) ( ) ( ) ( ) (1.1) The measured sample spectrum, ( ), is measured in CCD counts per unit frequency. The ratio of acquisition times,, and laser powers,, account for different exposure times and excitation laser powers of the sample and

4 reference measurements. Using this calibrated spectrum of the explosive sample, Raman Band Albedo of individual bands can be calculated by integrating the contribution to Raman Albedo values arising from each band. 2.4 Calibration approach using Teflon scattering The second independent calibration approach for the measurement of Raman Albedo is based on scattering measurements from a Teflon sample located at the sample/reference position. In this approach, we measure the laser power (due to diffuse reflectivity) at the spectrometer slit coming from a registered spot on a Teflon surface and use this measurement as a reference. As shown in Figure 2 (a), a Teflon substrate was placed at the sample location and its laser return,, was measured using a power meter before the spectrometer-slit. This measurement can be used to calculate the total scattered laser power, from the Teflon substrate. In addition to measuring, we also measured the corresponding laser return spectrum, ( ) using the setup shown in Figure 2(b), and used it to determine the integrated count, arising from the laser scatter. ( ) Figure 2: Experimental approach for measurement of Raman Albedo using characterized laser return from Teflon surface. Once calibrated in this way, we placed a Rayleigh rejection filter before the slit, similar to Figure 1, and measured the Raman spectrum, ( ), of an explosive sample. The laser power and exposure time corresponding to this measurement were and respectively. From these measurements and the characterized spectrometer, polarizer and filter efficiencies, the Raman Albedo of the explosive sample calibrated in units of frac/ steradian /cm -1 can be calculated in a manner similar to the ACN reference method. 3.1 Calibration and repeatability 3. RESULTS Calibration was performed on fourteen different explosives using the above two methods. The samples in our experiments are stationary, similar to a typical stand-off detection scenario. Some experimental results obtained using 238 nm excitations are shown in Figure 3. Of all the explosives measured, Ammonium Perchlorate had the highest and TNT had one of the lowest Raman Albedos. The calibrations from both ACN and Teflon approaches, are shown as blue and green lines respectively in Figure 3. The agreement between the two methods was within an experimental error of less than 20%. The ACN based calibration was very repeatable with a variation of less than 5%. The reason for this variation was difference of the sample position relative to reference or sample-to-sample variation (surface quality such as granularity and packing fraction). The repeatability was verified by preparing a number of samples of the same materials and calibrating them in the above mentioned approach. Further, to verify that the calibration is independent of the detection system, we varied the sample and reference position (which changes the overall collection efficiency of the detection system) and found a similar degree of repeatability. For the spectra measured with 238-nm excitation shown in Figure 3, the laser power was ~18 mw and the total exposure time,, varied from 30 sec (for Ammonium Perchlorate) to 450 sec (for TNT). In all our experiments, ( )
5 was obtained by summing spectra measured sequentially from multiple, identical, time exposures. For example Ammonium Perchlorate was obtained in three exposures of 10 seconds each. While the purpose for multiple exposures was to filter any cosmic ray peaks during long exposure events; it also served to identify any nonlinear dosage (defined as excitation intensity exposure time) dependence of the measured spectra. The four explosives in Figure 3 showed almost linear dose dependence, with a total variation between the spectra from identical first and the third time exposure to be less than 4%. However, several explosive spectra showed greater deviation from linear dependence on dosage. St Dev: 4.9% Figure 3: (a) Typical Raman Albedo spectra. Blue plots are based on ACN calibration approach and green are using Teflon approach. The two approaches typically match within an experimental error of 20%. (b) Repeatability of Raman Albedo measurement using ACN approach to sample positioning, sample preparation, and laser power measurement. 3.2 Explosive Raman Albedo Raman Albedo was characterized at a total of four wavelengths (229 nm, 238 nm, 244 nm, and 248 nm) for fourteen solid explosives. A list of measured explosives appears in Table 1. Ammonium Perchlorate Table 1: List of measured explosives HMX TNT Semtex A1 C4 Black Powder Watergel Dyno-AP PETN ANFO Potassium Perchlorate Urea Nitrate Ammonium Nitrate RDX Raman Albedos of the measured explosives are shown below in Figure 4
6
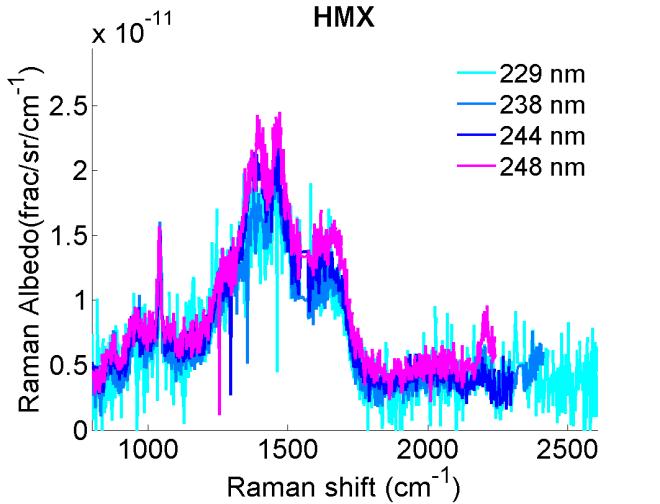
7
8 Figure 4: Raman Albedo measurements of solid optically thick explosives at 4 excitation wavelengths It is important to note that the observed dependence on excitation wavelength of the measured Raman Band Albedo of pure nitrates is not easily explained using known solution-phase Raman cross-section measurements and molar absorptivity. For example, from the known solution-phase Raman cross-sections and molar absorptivities of ammonium nitrate, the Raman Albedo is expected to increase with decreasing wavelength in the range between 229 nm and 248 nm. However, our Raman Albedo measurements show an opposite trend. This suggests that time-dependent phenomena (e.g. sample degradation or photolysis) or more complex solid-state phenomena could be responsible. 3.3 Sample degradation and Raman Albedo Several explosives strongly absorb DUV radiation, resulting in photo-degradation, which results in decreasing Raman signal with time. In addition, certain explosives, like nitrates, exhibit chemical changes due to light absorption [9]. In our experiments, we measured three successive Raman spectra with equal exposures times and laser excitation intensities. From the three measurements, we calculated fractional variation of Raman Band Albedo (maximum minimum band albedo divided by mean band albedo). As an example at 244 nm, most explosives with the exception of ANFO (95%), AN (22%), Black Powder (33%), SEMTEX (52%) and Watergel (38%) showed a variation of less than 15% for their most prominent Raman band. Exact variations were dependent on the exposure dose, Despite such intensity variations, the measured Raman spectra closely represent spectra in a typical detection scenario. Hence, they are useful as real signatures and in calculation of signal strength from a sensor operating in a similar detection scenario. As a first order approximation, the dose dependence was approximated to ( ) ( ), allowing us to extrapolate the Raman Band Albedo of a fresh sample,. Here, is the dose constant, which was determined using a linear fit to the time-dependent data. The approximation is valid in the limit of small dose. 3.4 Estimation of Raman Signal Photons The Raman band albedo presented in Table 2 can be used for signal estimation during the design of an analytical instrument. Using the measured band Albedo ( ) of explosives, detected power in a given band can be estimated for a given laser power ( ) and overall detection efficiency ( ) as ( ). Here and are the collection lens diameter and standoff distance to the target, respectively. As an example, assume a 20-mw laser power illuminating a spot covered with an optically-thick explosive film at a stand-off distance of 50 feet. A sensor with a detection efficiency of 17% and a collection lens aperture of 2 inches, results in 380 counts/sec for PETN and 171 counts/sec for TNT at 244 nm excitation wavelength.
9 Table 2: Raman Band Albedo ( ) of prominent bands of explosives. Substances marked with * showed less than 10% deviation from linear dose dependence in our experiment ( mj/ m 2 ). Material Band shift cm nm 238 nm 244 nm 248 nm frac/sr ANFO AN AmPerchlorate* BlackPowder C4* DynoAP* PETN PotPerchlorate* SEMTEX TNT* UN* Watergel DISCUSSION We have introduced the concept of Raman Albedo for solid explosives and presented two calibration methods. The first method uses the known Raman cross-section of an ACN reference and the second method measures the laser light diffusely reflected from a Teflon target. Raman Albedo measurements based on both the methods agree well within our experimental error. We have measured Raman albedos of fourteen, optically thick solid explosives at four different deep-uv wavelengths. The results show a rich variation of Raman Band Albedo with wavelength. This suggests that a DUVRRS technique that uses multiple excitation wavelengths has a rich set of signatures that may offer higher selectivity than a single-excitation-wavelength technique. These Raman Albedo measurements are useful in estimating the signal strength when designing a potential stand-off explosive sensor based on deep-ultraviolet resonance Raman spectroscopy. 5. ACKNOWLEDGEMENT This work was funded by the Department of Homeland Security Science and Technology Directorate under contract number HSHQDC-09-C and the Office of Naval Research under contract number N C The authors wish to acknowledge the technical contributions of William McCormick, Mikhail Sluch, Robert Ice, and Robert Martin, and many helpful discussions with Prof. Sanford Asher. REFERENCES [1] Moore, D. Sensing and Imaging: An International Journal 2007, 8, [2] Moore, and D. Scharff, R. Analytical and Bioanalytical Chemistry 2009, 393, [3] Asher, S. Analytical Chemistry 1993, 65, [4] Asher, S. In Ultraviolet raman spectrometry, Chalmers, J., and Griffiths, P., Eds., John Wiley & Sons, 2002, Vol. 1, pp [5] Asher, S., Johnson, C. Science 1984, 225, 311. [6] Tuschel, D.; Mikhonin, A.; Lemoff, B.; Asher, S. "Deep UV Resonance Raman Excitation Enables Explosives Detection", Applied Spectroscopy 2010, 64, [7] L. Wang and S.A. Asher, Refractive-Index Matching Avoids Local Field Corrections and Scattering Bias in Solid- State Na2SO4 Ultraviolet Raman Cross-Section Measurements, Applied Spectroscopy, 2012, 66, [8] Yellampelle, B; Sluch, M; Asher, S; Lemoff B; Multiple-excitation-wavelength resonance-raman explosives detection, SPIE Defense, Security, and Sensing, [9] S.A. Asher, D.D. Tuschel, T.A. Vargson, L. Wang and S. J. Geib, Solid State and Solution Nitrate Photochemistry: Photochemical Evolution of the Solid State Lattice, J. Phys. Chem. A, 2011, 115, [10] J. M. Dudik, C. R. Johnson, and S. A. Asher, "Wavelength Dependence of the Preresonance Raman Cross Sections of CH3CN, SO42-, ClO4- and NO3-", J. Chem. Phys. 1985, 82,
Underwater Raman Sensor for Detecting High Explosives and Homemade Explosives (HMEs)
") Underwater Raman Sensor for Detecting High Explosives and Homemade Explosives (HMEs) Shiv K. Sharma* Hawaii Institute of Geophysics & Planetology, University of Hawaii (UH) at Manoa, Honolulu, Hawaii,
Underwater Raman Sensor for Detecting High Explosives and Homemade Explosives (HMEs) Shiv K. Sharma* Hawaii Institute of Geophysics & Planetology, University of Hawaii (UH) at Manoa, Honolulu, Hawaii,
Resonance Raman measurements utilizing a deep UV source
 Resonance Raman measurements utilizing a deep UV source Adam Willitsford a, C. Todd Chadwick b, Hans Hallen b, and C. Russell Philbrick a a The Pennsylvania State University, Department of Electrical Engineering,
Application of IR Raman Spectroscopy
 Application of IR Raman Spectroscopy 3 IR regions Structure and Functional Group Absorption IR Reflection IR Photoacoustic IR IR Emission Micro 10-1 Mid-IR Mid-IR absorption Samples Placed in cell (salt)
Dependence of Raman and Resonance Raman Intensities on Sample Self-Absorption
 Dependence of Raman and Resonance Raman Intensities on Sample Self-Absorption Zhenmin Hong, Sanford A. Asher* Department of Chemistry, University of Pittsburgh, 219 Parkman Ave., Pittsburgh, PA 15260 USA
Reference literature. (See: CHEM 2470 notes, Module 8 Textbook 6th ed., Chapters )
") September 17, 2018 Reference literature (See: CHEM 2470 notes, Module 8 Textbook 6th ed., Chapters 13-14 ) Reference.: https://slideplayer.com/slide/8354408/ Spectroscopy Usual Wavelength Type of Quantum
September 17, 2018 Reference literature (See: CHEM 2470 notes, Module 8 Textbook 6th ed., Chapters 13-14 ) Reference.: https://slideplayer.com/slide/8354408/ Spectroscopy Usual Wavelength Type of Quantum
CHEM*3440. Photon Energy Units. Spectrum of Electromagnetic Radiation. Chemical Instrumentation. Spectroscopic Experimental Concept.
 Spectrum of Electromagnetic Radiation Electromagnetic radiation is light. Different energy light interacts with different motions in molecules. CHEM*344 Chemical Instrumentation Topic 7 Spectrometry Radiofrequency
AS 101: Day Lab #2 Summer Spectroscopy
 Spectroscopy Goals To see light dispersed into its constituent colors To study how temperature, light intensity, and light color are related To see spectral lines from different elements in emission and
Spectroscopy. Page 1 of 8 L.Pillay (2012)
") Spectroscopy Electromagnetic radiation is widely used in analytical chemistry. The identification and quantification of samples using electromagnetic radiation (light) is called spectroscopy. Light has
Spectroscopy Electromagnetic radiation is widely used in analytical chemistry. The identification and quantification of samples using electromagnetic radiation (light) is called spectroscopy. Light has
9/28/10. Visible and Ultraviolet Molecular Spectroscopy - (S-H-C Chapters 13-14) Valence Electronic Structure. n σ* transitions
 Valence Electronic Structure. n σ* transitions") Visible and Ultraviolet Molecular Spectroscopy - (S-H-C Chapters 13-14) Electromagnetic Spectrum - Molecular transitions Widely used in chemistry. Perhaps the most widely used in Biological Chemistry.
Visible and Ultraviolet Molecular Spectroscopy - (S-H-C Chapters 13-14) Electromagnetic Spectrum - Molecular transitions Widely used in chemistry. Perhaps the most widely used in Biological Chemistry.
Spectrophotometry. Introduction
 Spectrophotometry Spectrophotometry is a method to measure how much a chemical substance absorbs light by measuring the intensity of light as a beam of light passes through sample solution. The basic principle
This article appeared in a journal published by Elsevier. The attached copy is furnished to the author for internal non-commercial research and
 This article appeared in a journal published by Elsevier. The attached copy is furnished to the author for internal non-commercial research and education use, including for instruction at the authors institution
Remote Raman & Fluorescence Capabilities for Chemical Detection at University of Hawaii
 Remote Raman & Fluorescence Capabilities for Chemical Detection at University of Hawaii Anupam Misra Shiv Sharma HIGP, SOEST, Univ. of Hawaii * Daytime Operation * Long Detection Range (no sample collection)
Standoff Raman Detection of Explosive Materials Using a Small Raman Spectroscopy System
 Standoff Raman Detection of Explosive Materials Using a Small Raman Spectroscopy System Naseer M. Hadi 2, Mohammad R. Mohammad 1 and Haider G. Abdulzahraa 1* 1 Applied Science Department, University of
Design and Development of a Smartphone Based Visible Spectrophotometer for Analytical Applications
 Design and Development of a Smartphone Based Visible Spectrophotometer for Analytical Applications Bedanta Kr. Deka, D. Thakuria, H. Bora and S. Banerjee # Department of Physicis, B. Borooah College, Ulubari,
Model Answer (Paper code: AR-7112) M. Sc. (Physics) IV Semester Paper I: Laser Physics and Spectroscopy
 M. Sc. (Physics) IV Semester Paper I: Laser Physics and Spectroscopy") Model Answer (Paper code: AR-7112) M. Sc. (Physics) IV Semester Paper I: Laser Physics and Spectroscopy Section I Q1. Answer (i) (b) (ii) (d) (iii) (c) (iv) (c) (v) (a) (vi) (b) (vii) (b) (viii) (a) (ix)
Model Answer (Paper code: AR-7112) M. Sc. (Physics) IV Semester Paper I: Laser Physics and Spectroscopy Section I Q1. Answer (i) (b) (ii) (d) (iii) (c) (iv) (c) (v) (a) (vi) (b) (vii) (b) (viii) (a) (ix)
Single Emitter Detection with Fluorescence and Extinction Spectroscopy
 Single Emitter Detection with Fluorescence and Extinction Spectroscopy Michael Krall Elements of Nanophotonics Associated Seminar Recent Progress in Nanooptics & Photonics May 07, 2009 Outline Single molecule
Refractive-Index Matching Avoids Local Field Corrections and Scattering Bias in Solid-State Na 2 SO 4 Ultraviolet Raman Cross- Section Measurements
 Refractive-Index Matching Avoids Local Field Corrections and Scattering Bias in Solid-State Na 2 SO 4 Ultraviolet Raman Cross- Section Measurements LULING WANG and SANFORD A. ASHER* Department of Chemistry,
Because light behaves like a wave, we can describe it in one of two ways by its wavelength or by its frequency.
 Light We can use different terms to describe light: Color Wavelength Frequency Light is composed of electromagnetic waves that travel through some medium. The properties of the medium determine how light
Advanced Spectroscopy Laboratory
 Advanced Spectroscopy Laboratory - Raman Spectroscopy - Emission Spectroscopy - Absorption Spectroscopy - Raman Microscopy - Hyperspectral Imaging Spectroscopy FERGIELAB TM Raman Spectroscopy Absorption
Electromagnetic spectra
 Properties of Light Waves, particles and EM spectrum Interaction with matter Absorption Reflection, refraction and scattering Polarization and diffraction Reading foci: pp 175-185, 191-199 not responsible
CHAPTER 7 SUMMARY OF THE PRESENT WORK AND SUGGESTIONS FOR FUTURE WORK
 161 CHAPTER 7 SUMMARY OF THE PRESENT WORK AND SUGGESTIONS FOR FUTURE WORK 7.1 SUMMARY OF THE PRESENT WORK Nonlinear optical materials are required in a wide range of important applications, such as optical
UV RESONANCE RAMAN INVESTIGATION OF EXPLOSIVES UV PHOTOCHEMISTRY. Katie L. Gares. B.S. Chemistry, Frostburg State University, 2011
 UV RESONANCE RAMAN INVESTIGATION OF EXPLOSIVES UV PHOTOCHEMISTRY by Katie L. Gares B.S. Chemistry, Frostburg State University, 2011 Submitted to the Graduate Faculty of the Kenneth P. Dietrich School of
Vibrational Spectroscopies. C-874 University of Delaware
 Vibrational Spectroscopies C-874 University of Delaware Vibrational Spectroscopies..everything that living things do can be understood in terms of the jigglings and wigglings of atoms.. R. P. Feymann Vibrational
An Introduction to Ultraviolet-Visible Molecular Spectrometry (Chapter 13)
") An Introduction to Ultraviolet-Visible Molecular Spectrometry (Chapter 13) Beer s Law: A = -log T = -logp 0 / P = e x b x C See Table 13-1 for terms. In measuring absorbance or transmittance, one should
An Introduction to Ultraviolet-Visible Molecular Spectrometry (Chapter 13) Beer s Law: A = -log T = -logp 0 / P = e x b x C See Table 13-1 for terms. In measuring absorbance or transmittance, one should
SWOrRD. For direct detection of specific materials in a complex environment
 SWOrRD For direct detection of specific materials in a complex environment SWOrRD Swept Wavelength Optical resonant Raman Detector RAMAN EFFECT Raman scattering or the Raman effect ( /rɑːmən/) is the inelastic
DAY LABORATORY EXERCISE: SPECTROSCOPY
 AS101 - Day Laboratory: Spectroscopy Page 1 DAY LABORATORY EXERCISE: SPECTROSCOPY Goals: To see light dispersed into its constituent colors To study how temperature, light intensity, and light color are
Chapter 17: Fundamentals of Spectrophotometry
 Chapter 17: Fundamentals of Spectrophotometry Spectroscopy: the science that deals with interactions of matter with electromagnetic radiation or other forms energy acoustic waves, beams of particles such
HYPER-RAYLEIGH SCATTERING AND SURFACE-ENHANCED RAMAN SCATTERING STUDIES OF PLATINUM NANOPARTICLE SUSPENSIONS
 www.arpapress.com/volumes/vol19issue1/ijrras_19_1_06.pdf HYPER-RAYLEIGH SCATTERING AND SURFACE-ENHANCED RAMAN SCATTERING STUDIES OF PLATINUM NANOPARTICLE SUSPENSIONS M. Eslamifar Physics Department, BehbahanKhatamAl-Anbia
Skoog Chapter 6 Introduction to Spectrometric Methods
 Skoog Chapter 6 Introduction to Spectrometric Methods General Properties of Electromagnetic Radiation (EM) Wave Properties of EM Quantum Mechanical Properties of EM Quantitative Aspects of Spectrochemical
Visualization of Xe and Sn Atoms Generated from Laser-Produced Plasma for EUV Light Source
 3rd International EUVL Symposium NOVEMBER 1-4, 2004 Miyazaki, Japan Visualization of Xe and Sn Atoms Generated from Laser-Produced Plasma for EUV Light Source H. Tanaka, A. Matsumoto, K. Akinaga, A. Takahashi
Chapter 13 An Introduction to Ultraviolet/Visible Molecular Absorption Spectrometry
 Chapter 13 An Introduction to Ultraviolet/Visible Molecular Absorption Spectrometry 13A Measurement Of Transmittance and Absorbance Absorption measurements based upon ultraviolet and visible radiation
The Fundamentals of Spectroscopy: Theory BUILDING BETTER SCIENCE AGILENT AND YOU
 The Fundamentals of Spectroscopy: Theory BUILDING BETTER SCIENCE AGILENT AND YOU 1 Agilent is committed to the educational community and is willing to provide access to company-owned material. This slide
Visualizing the bi-directional electron transfer in a Schottky junction consisted of single CdS nanoparticles and a planar gold film
 Electronic Supplementary Material (ESI) for Chemical Science. This journal is The Royal Society of Chemistry 2017 Electronic Supplementary Information Visualizing the bi-directional electron transfer in
Beer's Law and Data Analysis *
 OpenStax-CNX module: m15131 1 Beer's Law and Data Analysis * Mary McHale This work is produced by OpenStax-CNX and licensed under the Creative Commons Attribution License 2.0 1 Beer's Law and Data Analysis
Chapter 17: Fundamentals of Spectrophotometry
 Chapter 17: Fundamentals of Spectrophotometry Spectroscopy: the science that deals with interactions of matter with electromagnetic radiation or other forms energy acoustic waves, beams of particles such
LABORATORY OF ELEMENTARY BIOPHYSICS
 LABORATORY OF ELEMENTARY BIOPHYSICS Experimental exercises for III year of the First cycle studies Field: Applications of physics in biology and medicine Specialization: Molecular Biophysics Fluorescence
Secondary Ion Mass Spectrometry (SIMS)
") CHEM53200: Lecture 10 Secondary Ion Mass Spectrometry (SIMS) Major reference: Surface Analysis Edited by J. C. Vickerman (1997). 1 Primary particles may be: Secondary particles can be e s, neutral species
CHEM53200: Lecture 10 Secondary Ion Mass Spectrometry (SIMS) Major reference: Surface Analysis Edited by J. C. Vickerman (1997). 1 Primary particles may be: Secondary particles can be e s, neutral species
Astronomy. Optics and Telescopes
 Astronomy A. Dayle Hancock adhancock@wm.edu Small 239 Office hours: MTWR 10-11am Optics and Telescopes - Refraction, lenses and refracting telescopes - Mirrors and reflecting telescopes - Diffraction limit,
Application of Raman Spectroscopy for Noninvasive Detection of Target Compounds. Kyung-Min Lee
 Application of Raman Spectroscopy for Noninvasive Detection of Target Compounds Kyung-Min Lee Office of the Texas State Chemist, Texas AgriLife Research January 24, 2012 OTSC Seminar OFFICE OF THE TEXAS
Supporting Information
 Supporting Information Three-dimensional frameworks of cubic (NH 4 ) 5 Ga 4 SbS 10, (NH 4 ) 4 Ga 4 SbS 9 (OH) H 2 O, and (NH 4 ) 3 Ga 4 SbS 9 (OH 2 ) 2H 2 O. Joshua L. Mertz, Nan Ding, and Mercouri G.
Effects of Temperature and Concentration on the Rate of Photo-bleaching of Erythrosine in Water
 Supporting Information for: Effects of Temperature and Concentration on the Rate of Photo-bleaching of Erythrosine in Water Joshua K. G. Karlsson, Owen J. Woodford, Roza Al-Aqar and Anthony Harriman* Molecular
Course Details. Analytical Techniques Based on Optical Spectroscopy. Course Details. Textbook. SCCH 211: Analytical Chemistry I
 SCCH 211: Analytical Chemistry I Analytical Techniques Based on Optical Spectroscopy Course Details September 22 October 10 September 22 November 7 November 17 December 1 Topic Period Introduction to Spectrometric
Science Drivers. Spectroscopic Sensors. In Situ Sensors. Development of autonomous and remote platforms
 Science Drivers In Situ Sensors Spectroscopic Sensors Development of autonomous and remote platforms ROVs, AUVs Cabled observatories Desire to analyze targets with discrete stability regions in the deep
IDRaman reader and IDRaman mini: Raster Orbital Scanning (ROS)
") IDRaman reader and IDRaman mini: Raster Orbital Scanning (ROS) Tightly focused beam may give noisy signals or miss the Raman active target completely leading to false negatives from unidentified samples
IDRaman reader and IDRaman mini: Raster Orbital Scanning (ROS) Tightly focused beam may give noisy signals or miss the Raman active target completely leading to false negatives from unidentified samples
Photoluminescence and Raman Spectroscopy on truncated Nano Pyramids
 Photoluminescence and Raman Spectroscopy on truncated Nano Pyramids Physics of low Dimensions, FFF042 Josefin Voigt & Stefano Scaramuzza 10.12.2013, Lund University 1 Introduction In this project truncated
Introduction to Electromagnetic Radiation and Radiative Transfer
 Introduction to Electromagnetic Radiation and Radiative Transfer Temperature Dice Results Visible light, infrared (IR), ultraviolet (UV), X-rays, γ-rays, microwaves, and radio are all forms of electromagnetic
R O Y G B V. Spin States. Outer Shell Electrons. Molecular Rotations. Inner Shell Electrons. Molecular Vibrations. Nuclear Transitions
 Spin States Molecular Rotations Molecular Vibrations Outer Shell Electrons Inner Shell Electrons Nuclear Transitions NMR EPR Microwave Absorption Spectroscopy Infrared Absorption Spectroscopy UV-vis Absorption,
Questions on Instrumental Methods of Analysis
 Questions on Instrumental Methods of Analysis 1. Which one of the following techniques can be used for the detection in a liquid chromatograph? a. Ultraviolet absorbance or refractive index measurement.
Snowy Range Instruments
 Snowy Range Instruments Cary 81 2000 W Hg Arc JY U-1000 5 W Ar + Laser DL Solution 852 200 mw SnRI CBEx 785 100 mw What is Raman Spectroscopy? Raman spectroscopy is a form of molecular spectroscopy. It
Atomic Absorption Spectroscopy and Atomic Emission Spectroscopy
 Atomic Absorption Spectroscopy and Atomic Emission Spectroscopy A. Evaluation of Analytical Parameters in Atomic Absorption Spectroscopy Objective The single feature that contributes most to making atomic
Standoff Spectroscopy of Surface Adsorbed Chemicals
 Article Subscriber access provided by OAK RIDGE NATIONAL LAB Standoff Spectroscopy of Surface Adsorbed Chemicals C. W. Van Neste, L. R. Senesac, and T. Thundat Anal. Chem., 2009, 81 (5), 1952-1956 DOI:
Applications of Terahertz Radiation (T-ray) Yao-Chang Lee, National Synchrotron Research Radiation Center
 Yao-Chang Lee, National Synchrotron Research Radiation Center") Applications of Terahertz Radiation (T-ray) Yao-Chang Lee, yclee@nsrrc.org.tw National Synchrotron Research Radiation Center Outline Terahertz radiation (THz) or T-ray The Interaction between T-ray and
Applications of Terahertz Radiation (T-ray) Yao-Chang Lee, yclee@nsrrc.org.tw National Synchrotron Research Radiation Center Outline Terahertz radiation (THz) or T-ray The Interaction between T-ray and
CHEM6416 Theory of Molecular Spectroscopy 2013Jan Spectroscopy frequency dependence of the interaction of light with matter
 CHEM6416 Theory of Molecular Spectroscopy 2013Jan22 1 1. Spectroscopy frequency dependence of the interaction of light with matter 1.1. Absorption (excitation), emission, diffraction, scattering, refraction
Rotational Raman Spectra of Diatomic Molecules
 Rotational Raman Spectra of Diatomic Molecules Week of March 15, 2010 Modern Physics Laboratory (Physics 6180/7180) The University of Toledo Instructor: Randy Ellingson Chandrasekhra Venkata Raman 1888-1970
Nanosphere Lithography
 Nanosphere Lithography Derec Ciafre 1, Lingyun Miao 2, and Keita Oka 1 1 Institute of Optics / 2 ECE Dept. University of Rochester Abstract Nanosphere Lithography is quickly emerging as an efficient, low
The design of an integrated XPS/Raman spectroscopy instrument for co-incident analysis
 The design of an integrated XPS/Raman spectroscopy instrument for co-incident analysis Tim Nunney The world leader in serving science 2 XPS Surface Analysis XPS +... UV Photoelectron Spectroscopy UPS He(I)
PAPER No. 12: ORGANIC SPECTROSCOPY MODULE No. 7: Instrumentation for IR spectroscopy
 KNOW MORE Web links https://en.wikipedia.org/wiki/infrared_ http://hiq.lindegas.com/en/analytical_methods/infrared_/non_dispersive_infrared.html http://blamp.sites.truman.edu/files/2012/11/322-ir-and-ftir.pdf
Wavelength Frequency Measurements
 Wavelength Frequency Measurements Frequency: - unit to be measured most accurately in physics - frequency counters + frequency combs (gear wheels) - clocks for time-frequency Wavelength: - no longer fashionable
05 - Scintillation detectors
 05 - Scintillation detectors Jaroslav Adam Czech Technical University in Prague Version 2 Jaroslav Adam (CTU, Prague) DPD_05, Scintillation detectors Version 2 1 / 39 Scintillation detector principles
Characterisation of vibrational modes of adsorbed species
 17.7.5 Characterisation of vibrational modes of adsorbed species Infrared spectroscopy (IR) See Ch.10. Infrared vibrational spectra originate in transitions between discrete vibrational energy levels of
What is spectroscopy?
 Absorption Spectrum What is spectroscopy? Studying the properties of matter through its interaction with different frequency components of the electromagnetic spectrum. With light, you aren t looking directly
GENERAL PHARMACOPOEIA MONOGRAPH
 MINISTRY OF HEALTH OF THE RUSSIAN FEDERATION GENERAL PHARMACOPOEIA MONOGRAPH Spectrophotometry in the ultraviolet GPM.1.2.1.1.0003.15 and visible spectral regions Replaces the SPRF X GPM, SPRF XI GPM,
Experiment AM3b: Raman scattering in transparent solids and liquids
 Physics 6180: Graduate Physics Laboratory Experiment AM3b: Raman scattering in transparent solids and liquids Objectives: To learn the essentials of inelastic light scattering, particularly Raman scattering
Chem Homework Set Answers
 Chem 310 th 4 Homework Set Answers 1. Cyclohexanone has a strong infrared absorption peak at a wavelength of 5.86 µm. (a) Convert the wavelength to wavenumber.!6!1 8* = 1/8 = (1/5.86 µm)(1 µm/10 m)(1 m/100
Spectroscopy: Introduction. Required reading Chapter 18 (pages ) Chapter 20 (pages )
 Chapter 20 (pages )") Spectroscopy: Introduction Required reading Chapter 18 (pages 378-397) Chapter 20 (pages 424-449) Spectrophotometry is any procedure that uses light to measure chemical concentrations Properties of Light
Spectroscopy: Introduction Required reading Chapter 18 (pages 378-397) Chapter 20 (pages 424-449) Spectrophotometry is any procedure that uses light to measure chemical concentrations Properties of Light
Ultraviolet-Visible and Infrared Spectrophotometry
 Ultraviolet-Visible and Infrared Spectrophotometry Ahmad Aqel Ifseisi Assistant Professor of Analytical Chemistry College of Science, Department of Chemistry King Saud University P.O. Box 2455 Riyadh 11451
Chapter 1 Applications of Luminescence to Fingerprints and Trace Explosives Detection
 Chapter 1 Applications of Luminescence to Fingerprints and Trace Explosives Detection Prof. Ismail Mekkaoui Alaoui Department of Physics, Faculty of Sciences Semlalia Cadi Ayyad University BP. 2390 Marrakech
Chemistry 524--Final Exam--Keiderling May 4, :30 -?? pm SES
 Chemistry 524--Final Exam--Keiderling May 4, 2011 3:30 -?? pm -- 4286 SES Please answer all questions in the answer book provided. Calculators, rulers, pens and pencils are permitted. No open books or
Preview from Notesale.co.uk Page 1 of 38
 F UNDAMENTALS OF PHOTONICS Module 1.1 Nature and Properties of Light Linda J. Vandergriff Director of Photonics System Engineering Science Applications International Corporation McLean, Virginia Light
Raman and stimulated Raman spectroscopy of chlorinated hydrocarbons
 Department of Chemistry Physical Chemistry Göteborg University KEN140 Spektroskopi Raman and stimulated Raman spectroscopy of chlorinated hydrocarbons WARNING! The laser gives a pulsed very energetic and
Fresnel Equations cont.
 Lecture 11 Chapter 4 Fresnel quations cont. Total internal reflection and evanescent waves Optical properties of metals Familiar aspects of the interaction of light and matter Fresnel quations: phases
高等食品分析 (Advanced Food Analysis) I. SPECTROSCOPIC METHODS *Instrumental methods: 1. Spectroscopic methods (spectroscopy): a) Electromagnetic radiation
 I. SPECTROSCOPIC METHODS *Instrumental methods: 1. Spectroscopic methods (spectroscopy): a) Electromagnetic radiation") *Instrumental methods: 1. Spectroscopic methods (spectroscopy): a) Electromagnetic radiation (EMR): γ-ray emission X-Ray absorption, emission, fluorescence and diffraction Vacuum ultraviolet (UV) absorption
*Instrumental methods: 1. Spectroscopic methods (spectroscopy): a) Electromagnetic radiation (EMR): γ-ray emission X-Ray absorption, emission, fluorescence and diffraction Vacuum ultraviolet (UV) absorption
LIDAR. Natali Kuzkova Ph.D. seminar February 24, 2015
 LIDAR Natali Kuzkova Ph.D. seminar February 24, 2015 What is LIDAR? Lidar (Light Detection And Ranging) is an optical remote sensing technology that measures distance by illuminating a target with a laser
UV Degradation of Polycarbonate
 Utah State University DigitalCommons@USU Senior Theses and Projects Materials Physics 5-2017 UV Degradation of Polycarbonate Katie Gamaunt Utah State University Follow this and additional works at: https://digitalcommons.usu.edu/mp_seniorthesesprojects
ARC SPECTRUM OF IRON /COPPER / BRASS
 ARC PECTRUM OF IRON /COPPER / BRA Aim : To determine the wavelength of prominent lines in the emission spectrum of iron/ copper/ brass. Apparatus : Constant deviation spectrometer, dc voltage source, metal
Supporting Information s for
 Supporting Information s for # Self-assembling of DNA-templated Au Nanoparticles into Nanowires and their enhanced SERS and Catalytic Applications Subrata Kundu* and M. Jayachandran Electrochemical Materials
The investigation of the photokinetics of a platinum organoamine complex using the Cary 50/60
 The investigation of the photokinetics of a platinum organoamine complex using the Cary 50/60 Application Note Chemical Author Jeffrey J. Comerford, PhD. Agilent Technologies, Inc. Mulgrave, Victoria 3170,
Optical Systems Program of Studies Version 1.0 April 2012
 Optical Systems Program of Studies Version 1.0 April 2012 Standard1 Essential Understand Optical experimental methodology, data analysis, interpretation, and presentation strategies Essential Understandings:
Diffraction Gratings, Atomic Spectra. Prof. Shawhan (substituting for Prof. Hall) November 14, 2016
 November 14, 2016") Diffraction Gratings, Atomic Spectra Prof. Shawhan (substituting for Prof. Hall) November 14, 2016 1 Increase number of slits: 2 Visual Comparisons 3 4 8 2 Diffraction Grating Note: despite the name, this
Diffraction Gratings, Atomic Spectra Prof. Shawhan (substituting for Prof. Hall) November 14, 2016 1 Increase number of slits: 2 Visual Comparisons 3 4 8 2 Diffraction Grating Note: despite the name, this
Laboratory #29: Spectrometer
 INDIANA UNIVERSITY, DEPARTMENT OF PHYSICS, P309 LABORATORY Laboratory #29: Spectrometer Goal: Learn to adjust an optical spectrometer, use a transmission grating to measure known spectral lines of mercury,
Basics of UV-Visible Spectroscopy *
 OpenStax-CNX module: m34525 1 Basics of UV-Visible Spectroscopy * Brittany L. Oliva-Chatelain Andrew R. Barron This work is produced by OpenStax-CNX and licensed under the Creative Commons Attribution
JRE Group of Institutions ASSIGNMENT # 1 Special Theory of Relativity
 ASSIGNMENT # 1 Special Theory of Relativity 1. What was the objective of conducting the Michelson-Morley experiment? Describe the experiment. How is the negative result of the experiment interpreted? 2.
Taking Fingerprints of Stars, Galaxies, and Other Stuff. The Bohr Atom. The Bohr Atom Model of Hydrogen atom. Bohr Atom. Bohr Atom
 Periodic Table of Elements Taking Fingerprints of Stars, Galaxies, and Other Stuff Absorption and Emission from Atoms, Ions, and Molecules Universe is mostly (97%) Hydrogen and Helium (H and He) The ONLY
Complete the following. Clearly mark your answers. YOU MUST SHOW YOUR WORK TO RECEIVE CREDIT.
 CHEM 322 Name Exam 3 Spring 2013 Complete the following. Clearly mark your answers. YOU MUST SHOW YOUR WORK TO RECEIVE CREDIT. Warm-up (3 points each). 1. In Raman Spectroscopy, molecules are promoted
Study of absorption and re-emission processes in a ternary liquid scintillation system *
 CPC(HEP & NP), 2010, 34(11): 1724 1728 Chinese Physics C Vol. 34, No. 11, Nov., 2010 Study of absorption and re-emission processes in a ternary liquid scintillation system * XIAO Hua-Lin( ) 1;1) LI Xiao-Bo(
X-ray induced singlet oxygen generation by. nanoparticle-photosensitizer conjugates for. photodynamic therapy: determination of singlet
 X-ray induced singlet oxygen generation by nanoparticle-photosensitizer conjugates for photodynamic therapy: determination of singlet oxygen quantum yield Sandhya Clement 1, Wei Deng 1, Elizabeth Camilleri
Spectroscopy Problem Set February 22, 2018
 Spectroscopy Problem Set February, 018 4 3 5 1 6 7 8 1. In the diagram above which of the following represent vibrational relaxations? 1. Which of the following represent an absorbance? 3. Which of following
Visible-light Driven Plasmonic Photocatalyst Helical Chiral TiO 2 Nanofibers
 Visible-light Driven Plasmonic Photocatalyst Ag/AgCl @ Helical Chiral TiO 2 Nanofibers Dawei Wang, Yi Li*, Gianluca Li Puma, Chao Wang, Peifang Wang, Wenlong Zhang, and Qing Wang Fig. S1. The reactor of
1) Introduction 2) Photo electric effect 3) Dual nature of matter 4) Bohr s atom model 5) LASERS
 Introduction 2) Photo electric effect 3) Dual nature of matter 4) Bohr s atom model 5) LASERS") 1) Introduction 2) Photo electric effect 3) Dual nature of matter 4) Bohr s atom model 5) LASERS 1. Introduction Types of electron emission, Dunnington s method, different types of spectra, Fraunhoffer
1) Introduction 2) Photo electric effect 3) Dual nature of matter 4) Bohr s atom model 5) LASERS 1. Introduction Types of electron emission, Dunnington s method, different types of spectra, Fraunhoffer
Spectroscopy Meditsiiniline keemia/medical chemistry LOKT Spectroscopy
 Meditsiiniline keemia/medical chemistry LOKT.00.009 Spectroscopy 04.09.12 http://tera.chem.ut.ee/~koit/arstpr/spe_en.pdf 1 ntroduction Spectroscopy is a general term for methods that investigate interactions
Fourier Transform Infrared. Spectrometry
 Fourier Transform Infrared. Spectrometry Second Editio n PETER R. GRIFFITH S JAMES A. de HASETH PREFACE x v CHAPTER 1 INTRODUCTION TO VIBRATIONAL SPECTROSCOPY 1 1.1. Introduction 1 1.2. Molecular Vibrations
10/2/2008. hc λ. νλ =c. proportional to frequency. Energy is inversely proportional to wavelength And is directly proportional to wavenumber
 CH217 Fundamentals of Analytical Chemistry Module Leader: Dr. Alison Willows Electromagnetic spectrum Properties of electromagnetic radiation Many properties of electromagnetic radiation can be described
Optics and Spectroscopy
 Introduction to Optics and Spectroscopy beyond the diffraction limit Chi Chen 陳祺 Research Center for Applied Science, Academia Sinica 2015Apr09 1 Light and Optics 2 Light as Wave Application 3 Electromagnetic
Sensitive Detection and Identification of Isovanillin Aerosol Particles at the pg/cm 3 Mass Concentration Level Using Raman Spectroscopy*
 Sensitive Detection and Identification of Isovanillin Aerosol Particles at the pg/cm 3 Mass Concentration Level Using Raman Spectroscopy* R. L. Aggarwal 1, S. Di Cecca, L. W. Farrar, Shabshelowitz, A.,
PC Laboratory Raman Spectroscopy
 PC Laboratory Raman Spectroscopy Schedule: Week of September 5-9: Student presentations Week of September 19-23:Student experiments Learning goals: (1) Hands-on experience with setting up a spectrometer.
Wavelength λ Velocity v. Electric Field Strength Amplitude A. Time t or Distance x time for 1 λ to pass fixed point. # of λ passing per s ν= 1 p
 Introduction to Spectroscopy (Chapter 6) Electromagnetic radiation (wave) description: Wavelength λ Velocity v Electric Field Strength 0 Amplitude A Time t or Distance x Period p Frequency ν time for 1
Ch 313 FINAL EXAM OUTLINE Spring 2010
 Ch 313 FINAL EXAM OUTLINE Spring 2010 NOTE: Use this outline at your own risk sometimes a topic is omitted that you are still responsible for. It is meant to be a study aid and is not meant to be a replacement
MOLEBIO LAB #4: Using a Spectrophotometer
 Introduction: Spectrophotometry MOLEBIO LAB #4: Using a Spectrophotometer Many kinds of molecules interact with or absorb specific types of radiant energy in a predictable fashion. For example, when while
1901 Application of Spectrophotometry
 1901 Application of Spectrophotometry Chemical Analysis Problem: 1 Application of Spectroscopy Organic Compounds Organic compounds with single bonds absorb in the UV region because electrons from single
SPECTROSCOPIC STUDY OF LUMINESCENCE PATTERNS IN DIAMOND BY ANNA MANI. Received August 21, 1944 (Communicated by Sir C. V. Raman, Kt., F.R.S., N.L.
 SPECTROSCOPIC STUDY OF LUMINESCENCE PATTERNS IN DIAMOND BY ANNA MANI (From the Department of Physics, Indian Institute of Science, Bangalore) Received August 21, 1944 (Communicated by Sir C. V. Raman,