THE LOW-LUMINOSITY END OF THE RADIUS LUMINOSITY RELATIONSHIP FOR ACTIVE GALACTIC NUCLEI
|
|
|
- Elfrieda Murphy
- 5 years ago
- Views:
Transcription
1 C The American Astronomical Society. All rights reserved. Printed in the U.S.A. doi: / x/767/2/149 THE LOW-LUMINOSITY END OF THE RADIUS LUMINOSITY RELATIONSHIP FOR ACTIVE GALACTIC NUCLEI Misty C. Bentz 1, Kelly D. Denney 2,16, Catherine J. Grier 3, Aaron J. Barth 4, Bradley M. Peterson 3,5, Marianne Vestergaard 2,6, Vardha N. Bennert 7, Gabriela Canalizo 8, Gisella De Rosa 3, Alexei V. Filippenko 9, Elinor L. Gates 10, Jenny E. Greene 11, Weidong Li 9,17, Matthew A. Malkan 12, Richard W. Pogge 3,5, Daniel Stern 13, Tommaso Treu 14, and Jong-Hak Woo 15 1 Department of Physics and Astronomy, Georgia State University, Atlanta, GA 30303, USA; bentz@chara.gsu.edu 2 Dark Cosmology Center, Niels Bohr Institute, Juliane Maries Vej 30, DK-2100 Copenhagen Ø, Denmark 3 Department of Astronomy, The Ohio State University, 140 West 18th Avenue, Columbus, OH 43210, USA 4 Department of Physics and Astronomy, 4129 Frederick Reines Hall, University of California, Irvine, CA 92697, USA 5 Center for Cosmology and AstroParticle Physics, The Ohio State University, 191 West Woodruff Avenue, Columbus, OH 43210, USA 6 Steward Observatory, University of Arizona, 933 N Cherry Avenue, Tucson, AZ 85721, USA 7 Physics Department, California Polytechnic State University, San Luis Obispo, CA 93407, USA 8 Department of Physics and Astronomy, University of California, Riverside, CA 92521, USA 9 Department of Astronomy, University of California, Berkeley, CA 94720, USA 10 University of California Observatories/Lick Observatory, P.O. Box 85, Mount Hamilton, CA 95140, USA 11 Department of Astrophysical Sciences, Princeton University, Peyton Hall - Ivy Lane, Princeton, NJ 08544, USA 12 Department of Physics and Astronomy, University of California, Los Angeles, CA 90095, USA 13 Jet Propulsion Laboratory, California Institute of Technology, 4800 Oak Grove Drive, Pasadena, CA 91109, USA 14 Department of Physics, University of California, Santa Barbara, CA 93106, USA 15 Astronomy Program, Department of Physics and Astronomy, Seoul National University, Seoul, Republic of Korea Received 2012 December 19; accepted 2013 March 6; published 2013 April 5 ABSTRACT We present an updated and revised analysis of the relationship between the Hβ broad-line region (BLR) radius and the luminosity of the active galactic nucleus (AGN). Specifically, we have carried out two-dimensional surface brightness decompositions of the host galaxies of nine new AGNs imaged with the Hubble Space Telescope Wide Field Camera 3. The surface brightness decompositions allow us to create AGN-free images of the galaxies, from which we measure the starlight contribution to the optical luminosity measured through the ground-based spectroscopic aperture. We also incorporate 20 new reverberation-mapping measurements of the Hβ time lag, which is assumed to yield the average Hβ BLR radius. The final sample includes 41 AGNs covering four orders of magnitude in luminosity. The additions and updates incorporated here primarily affect the low-luminosity end of the R BLR L relationship. The best fit to the relationship using a Bayesian analysis finds a slope of α = , consistent with previous work and with simple photoionization arguments. Only two AGNs appear to be outliers from the relationship, but both of them have monitoring light curves that raise doubt regarding the accuracy of their reported time lags. The scatter around the relationship is found to be 0.19 ± 0.02 dex, but would be decreased to 0.13 dex by the removal of these two suspect measurements. A large fraction of the remaining scatter in the relationship is likely due to the inaccurate distances to the AGN host galaxies. Our results help support the possibility that the R BLR L relationship could potentially be used to turn the BLRs of AGNs into standardizable candles. This would allow the cosmological expansion of the universe to be probed by a separate population of objects, and over a larger range of redshifts. Key words: galaxies: active galaxies: nuclei galaxies: photometry galaxies: Seyfert 1. INTRODUCTION The ability to determine black hole masses is a crucial step toward understanding the link between galaxies and their black holes, as well as the details of the black hole environment. To date, dynamical methods have resulted in measurements of some 50 black hole masses. However, these methods require that the gravitational influence of the black hole on the stars or gas be spatially resolved, effectively limiting the reach of current dynamical methods to galaxies no further than 150 Mpc for even the most massive black holes (see G ültekin et al. 2009). Active galactic nuclei (AGNs), in contrast, are some of the most luminous objects in the universe, and are thus capable of providing us with the leverage needed to probe the growth and 16 Marie Curie Fellow. 17 Deceased 2011 December 12. evolution of black holes at any significant cosmological distance. However, AGNs are also so rare that even the nearest are generally too distant for current instruments to spatially resolve the radius of influence of the black hole and provide a local calibration for their masses. Instead, the most successful technique for measuring black hole masses in AGNs is reverberation mapping (Blandford & McKee 1982). Reverberation mapping requires high-quality spectrophotometric monitoring of an AGN over an extended period of time. The line-emitting regions that give rise to the characteristic AGN spectral signatures are photoionized by the hot accretion disk around the black hole. The continuum flux (which arises from the accretion disk or very close to it) varies with time, and these variations are echoed later by changes in the flux of the broad emission lines. The delay time between the continuum variations and the broad-line variations can be measured by cross correlation of the light curves and gives the light-travel time across the broadline region (BLR), or the radius of the BLR when multiplied by 1
2 the speed of light. In effect, reverberation mapping substitutes high temporal resolution for high spatial resolution, allowing us to probe regions of gas that are only 0.01 pc in extent (comparable to the inner region of the Oort Cloud in our own solar system; Brown et al. 2004) in the centers of arbitrarily distant galaxies. Combining the BLR radius with the mean velocity of the BLR gas, as measured from the Doppler broadening of the emission lines, and assumptions or indirect estimates of the virial coefficient gives a direct constraint on the black hole mass via the virial theorem. The validity of reverberation masses has been upheld by several independent lines of evidence. A subset of objects in the reverberation sample have measurements for several different emission lines throughout the ultraviolet and optical portions of their spectra, and the multiple emission lines show a virial behavior (e.g., Peterson & Wandel 1999, 2000; Kollatschny 2003; 2010). Two AGNs in the current reverberation sample NGC 3227 and NGC 4151 are sufficiently close that dynamical modeling has successfully determined their black hole masses, and both the stellar dynamical masses (Davies et al. 2006; Onken et al. 2007) and gas dynamical masses (Hicks & Malkan 2008) agree with the reverberation-based masses within the uncertainties. Furthermore, a fully general Bayesian modeling code has recently been developed to analyze reverberation-mapping data sets and place limits on the black hole mass and the BLR geometry and dynamics (Pancoast et al. 2011). When applied to the reverberation-mapping data for Arp 151 (Brewer et al. 2011) and Mrk 50 (Pancoast et al. 2012), the method recovers a black hole mass that is essentially the same value as that determined from the reverberation method outlined above, for standard assumptions of the virial coefficient ( 2009b; Barth et al. 2011). Reverberation mapping has yielded black hole masses for 50 AGNs thus far (Peterson et al. 2004; 2009b). The BLR radius luminosity correlation (R BLR L α ) derived from this reverberation sample is the basis for all secondary techniques used to estimate black hole masses in distant AGNs (e.g., Laor 1998; Wandel et al. 1999; McLure & Jarvis 2002; Vestergaard & Peterson 2006). The power of the R BLR L relationship comes from the simplicity of using it to quickly estimate M BH for large samples of objects, even at high redshift, with only a single spectrum per object. This simplicity has led to the R BLR L relationship being heavily utilized in the literature. A small sampling of studies that have utilized the R BLR L relationship in the last few years includes investigations of M BH in the most distant quasars (e.g., Willott et al. 2010; Mortlock et al. 2011), black hole mass functions and Eddington ratio distributions through cosmic history (e.g., Greene & Ho 2007b; Vestergaard et al. 2008; Vestergaard & Osmer 2009; Kelly et al. 2009; Schulze & Wisotzki 2010), cosmic evolution of black holes and their host galaxies (e.g., Woo et al. 2008; Merloni et al. 2010; Bennert et al. 2010), the nature of narrow-line Seyfert 1 galaxies (e.g., Mathur et al. 2012; Papadakis et al. 2010), duty cycles of quasars (e.g., Shankar et al. 2009), accretion properties of various types of AGNs (e.g., Wang et al. 2009; Cao 2010; Trump et al. 2011), studies of relativistic jets and the jet disk connection (e.g., Sambruna et al. 2006; Tavecchio et al. 2007; Ghisellini & Tavecchio 2010), studies of black holes in dwarf and low-mass galaxies (e.g., Greene &Ho 2007a; Dong et al. 2007; Thornton et al. 2008), and studies of optical transients (e.g., Drake et al. 2011). Because of the utility of the R BLR L relationship, much work has gone into removing biases and noise from the reverberation database. Previous determinations of the R BLR L relationship used luminosity measurements from ground-based spectra and found the slope to be α 0.7 (Kaspietal. 2000, 2005). To achieve the low level of uncertainties in the flux calibration necessary for reverberation mapping, a large (e.g., ) spectroscopic aperture is typically employed. Therefore, for all the nearby objects with reverberation masses, a substantial fraction of the observed luminosity is actually the result of the host-galaxy starlight and not the AGN itself. The entire lowluminosity end of the R BLR L relationship was overestimated in L, in effect, artificially steepening the slope. (2006b) analyzed Hubble Space Telescope (HST) Advanced Camera for Surveys (ACS) images of the nearest reverberation-mapped AGNs and their host galaxies taken through the F550M medium-band V filter. The flux contribution of starlight through the ground-based spectroscopic monitoring aperture was measured from each image, and the reverberationmapping luminosities were corrected accordingly. The resultant R BLR L relationship was found, as expected, to have a much flatter slope (α = 0.52 ± 0.04 compared to α = 0.67 ± 0.05), consistent with simple photoionization expectations. Consequently, all of the remaining objects in the reverberationmapped sample were imaged with ACS in a similar manner with the intent of properly accounting for the starlight in each object, even when that contribution was assumed to be small. While the slope of the relationship did not change much (α = 0.52±0.06; 2009a), the scatter in the relationship was reduced from 40% to 35%. The scarcity of measurements anchoring the low-luminosity end, in particular, then became apparent. In the meantime, much effort has gone into replacing noisy and poorly sampled reverberation data sets and increasing the overall range of BLR radii probed. The past several years in particular have seen a huge amount of effort invested in reverberation-mapping experiments that preferentially target AGNs with relatively low luminosities. The Lick AGN Monitoring Project (LAMP) campaign targeted low-luminosity AGNs to more fully populate the low-luminosity end of the R BLR L relationship and succeeded in measuring Hβ BLR radii for eight new AGNs ( 2009b). Multiple recent campaigns at MDM Observatory have mainly focused on replacing poorly sampled or noisy reverberation data sets with high signal-tonoise ratio (S/N), high temporal cadence spectroscopy (Denney et al. 2010; Grier et al. 2012) to allow better constraints on the BLR structure and kinematics. Given the number of updates, improvements, and additions to the reverberation database, we undertook a full recalibration of the R BLR L relationship in an effort to provide a more accurately calibrated relationship for the community to use when estimating black hole masses in AGNs. In particular, our new calibration is more accurate at the low-luminosity end where L and sub-l galaxies tend to reside. We assume a standard ΛCDM cosmology of H 0 = 72 km s 1 Mpc 1, Ω M = 0.3, Ω Λ = 0.7 throughout this work. 2. NEW Hβ BLR MEASUREMENTS Recent reverberation-mapping campaigns have focused mainly on the low-luminosity end of the R BLR L relationship and provide several new Hβ BLR measurements to the reverberation sample. The measurements come in three separate flavors: (1) replacement measurements for targets of previous reverberation campaigns for which the light curves were noisy or undersampled and led to poor or biased determinations of the Hβ BLR radius, (2) additional measurements for targets of previous 2
3 reverberation campaigns that already have accurate Hβ time-lag measurements, and (3) Hβ BLR measurements for new objects that have not been previously examined with reverberation mapping. We provide a brief summary of each of the monitoring programs with the new results that we incorporate here. The interested reader should refer to the original manuscripts reporting the Hβ BLR measurements for more details. MDM C was the subject of a 2005 monitoring campaign at MDM Observatory that resulted in an additional Hβ radius and luminosity measurement for this object (Dietrich et al. 2012). MDM Denney et al. (2010) describe the results of a 2007 monitoring program at MDM and other observatories that had a goal of obtaining high-quality, densely sampled light curves to search for velocity-resolved time lags in the emission lines. Hβ BLR measurements were derived for six AGNs through this program, three of which were replacements for poor-quality data sets, and two of which were additional measurements for AGNs with other reliable measurements. The final object, Mrk 290, was new. Mrk 290 was also included in the 2008 LAMP sample of AGNs (see below) but did not exhibit strong variations during that campaign. The inclusion of Mrk 290 in the LAMP sample led to it being included in the HST Cycle 17 imaging campaign that we describe below, from which we are able to derive the starlight correction to the luminosity. LAMP The 2008 LAMP campaign targeted AGNs with estimated black hole masses in the range M 0. Measurements of the Hβ BLR radius were determined for eight new objects, and an additional measurement of the Hβ BLR radius in the well-studied AGN NGC 5548 was also determined ( 2009b). NGC 5548 was the only galaxy in the LAMP sample with the appropriate HST imaging to allow a host-galaxy starlight correction. In the next sections we detail the HST Cycle 17 imaging program through which we obtained the necessary images for the remainder of the LAMP sample, the host-galaxy surface brightness modeling of those images, and the derived starlight corrections to the ground-based spectroscopic monochromatic luminosities at 5100 Å. MDM Additional measurements of Hβ radii were determined for four AGNs in the reverberation sample during a campaign at MDM and other observatories (Grier et al. 2012; B. M. Peterson et al., in preparation). Two other AGNs, Mrk 6 and Mrk 1501, were new targets and reliable Hβ radii were determined for them. Unfortunately, there is no suitable HST imaging from which to measure the starlight correction to the spectroscopic luminosity. We are therefore unable to include them in this analysis of the R BLR L relationship. The addition of nine new AGNs to the reverberation sample along with 11 replacement or additional data sets for previously monitored AGNs allows us to revisit the calibration of the R BLR L relationship, and in particular to examine the form of the relationship at the lower luminosity end. We include in this analysis all reverberation data sets for which (1) there is a reliable time lag measured for the Hβ emission line, and (2) there is medium V-band (F547M or F550M) HST imaging available so the host-galaxy contribution to the rest-frame 5100 Å flux can be determined and removed. Other archival HST images are available for some of the objects not included here, but these images are not suitable for our analysis for one of three reasons: (1) they were taken with a different filter and therefore include emission lines from the galaxy and/or the narrowline region, both of which would have to be corrected, and they would require assumptions about the unknown underlying stellar populations in the galaxy, and/or (2) the exposures are too shallow to accurately constrain the host-galaxy surface brightness profiles, or (3) the images are heavily saturated in the nucleus, with strong bleeding and a loss of information at the galaxy center. We do not include reverberation measurements of other Balmer lines in this analysis because previous work (Kaspi et al. 2000; 2009b) has shown that there are differences in the mean time lags determined for different Balmer lines, most likely caused by radiative-transfer effects in the BLR clouds. We are left with the sample of 41 AGNs that are listed in Table HST OBSERVATIONS AND DATA REDUCTION Nine AGNs with new Hβ time lags were imaged during Cycle 17 (GO-11662, PI: Bentz) with the Wide Field Camera 3 (WFC3) UVIS channel through the F547M (Str ömgren y) filter (λ c = 5447 Å and Δλ = 650 Å). This imaging setup allowed us to probe the continuum flux from the AGN and the host galaxy while avoiding strong emission lines. One orbit was dedicated to each object, and each orbit was divided into two sets of exposures separated by a dithering maneuver to improve the sampling of the WFC3 point-spread function (PSF) and facilitate in the rejection of cosmic rays and detector artifacts (such as transient warm pixels). To maximize the dynamic range of the final images, each set of three exposures was graduated in time, with exposure times of approximately 30 s, 300 s, and 690 s. We did not dither during an exposure sequence to ensure that all three images were taken at the same position. Most of our targets were compact enough to fit on a single chip of the UVIS channel, but for NGC 6814 we employed a larger dithering maneuver to ensure that there was no loss of information because of the gap between the chips. Details of the HST observations are given in Table 2. We were able to correct for saturation in the long exposures by making use of the linear nature of charge-coupled devices. Saturated pixels in the nucleus of each galaxy were identified in each image by consulting the data quality frames from the HST pipeline. These saturated pixels were clipped from the image and replaced by the same pixels from a shallower, unsaturated exposure, but scaled up by the exposure-time ratio. Cosmic rays were cleaned with the Laplacian cosmic ray identification package L. A. Cosmic (van Dokkum 2001). All of the frames for a single object were then combined with the multidrizzle task to create a distortion-free image of each AGN host galaxy. The final combined, drizzled images are shown in Figure 1 with the ground-based spectroscopic monitoring apertures overlaid. It can easily be seen that the host galaxy of each AGN contributes a significant amount of light within the monitoring aperture. 4. GALAXY SURFACE BRIGHTNESS DECOMPOSITIONS An important component of calibrating the R BLR L relationship is properly correcting the L measurements for the contribution from host-galaxy starlight. The method we employed here is similar to that described by (2006b, 2009a), where the analysis of 32 galaxies in our sample is reported; it relies on using the software program Galfit (Peng et al. 2002) to model the surface brightness profiles of the host-galaxy images. Galfit is a nonlinear least-squares two-dimensional image-fitting algorithm. We used the latest version of Galfit (Version 3) which allows for the modeling of spiral arms, rings, and irregular shapes (see Peng et al for a full description and various examples). 3
4 Table 1 Object List Object α J2000 δ J2000 z D a L A b B Alternate (hr min sec) ( 111 ) (Mpc) (mag) Name Mrk PG PG PG Fairall Mrk NGC 863 3C Mrk 1506 Ark Mrk 1095 Mrk PG Mrk PG NGC ± Mrk NGC SBS A Arp Mrk 40 NGC ± Mrk NGC ± NGC ± Mrk NGC Mrk 766 PG C 273 PG Mrk 771 & Ton 1542 NGC ± Mrk 1330 NGC PG Mrk PG NGC PG Mrk PG Mrk PG Mrk 876 PG Mrk 877 PG C NGC Mrk PG II Zw 136 & Mrk 1513 NGC Mrk 1514 Notes. a Distances were estimated from the redshifts of the AGNs except for five cases: NGC 3227, NGC 3783, NGC 4051, NGC 4151, and NGC The distances and uncertainties for the last four of these objects are from an average of distance moduli to neighboring galaxies in the Tully et al. (2008) study of the local velocity anomaly, with distance uncertainties estimated at 20%. The distance to NGC 3227 is based on the SBF method (Tonry et al. 2001) for NGC 3226, with which NGC 3227 is currently interacting. Additional details are given in the text. b Values are from the Schlafly & Finkbeiner (2011) recalibration of the Schlegel et al. (1998) dust map. For the surface brightness decomposition of each of the nine where Σ e is the pixel surface brightness at the effective radius new HST host-galaxy images in this work, we employed a tilted r e.the S érsic index, n, has a value of 1 for an exponential plane for the background sky flux and a TinyTim (Krist 1993) disk, 4 for a de Vaucouleurs (1948) profile, and 0.5 for a model for the unresolved AGN. TinyTim models were generated Gaussian. Bulge and bar components were modeled by allowing for each specific AGN by creating a model at the specific the S érsic index to vary with no constraints while disks were detector position of each of the pointings and combining these modeled by holding the S érsic index fixed at a value of 1. models through multidrizzle in the same way that the AGN Fits that resulted in bulge S érsic indices outside of the range images were combined. Host-galaxy bulges, disks, and bars were considered unphysical and therefore unacceptable. were allfitwith S érsic (1968) profiles of the basic form In these cases, we required multiple PSF models in the center Σ(r) = Σ e exp κ of the galaxy, offset by fractions of a pixel, to keep the S érsic index of the bulge from running up the maximum value allowed 1/n r by Galfit, n = 20. A high S ersic index has a very peaky 1, (1) r e shape with strong wings, and can mimic a PSF+sky model. 4

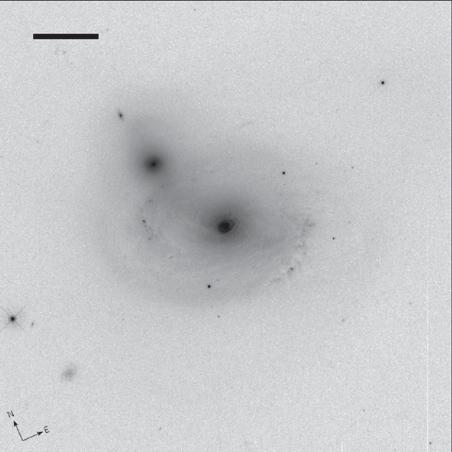
5 Figure 1. HST WFC3 F547M images of the AGN host galaxies, displayed with an inverted logarithmic stretch. The black rectangles show the geometry and orientation of each ground-based spectroscopic monitoring aperture. The size of the region displayed is , except for NGC 6814 which is displayed in a box. For all images, north is up and east is to the left. Object Mrk 142 SBS A Arp 151 Mrk 1310 Table 2 HST Observation Log Date Observed (yyyy-mm-dd) Total Exposure Time (s) Roll Angle ( EofN) A runaway S érsic index in our galaxy fitting is likely because of the well-known PSF mismatch that can occur between TinyTim models and WFC3 images due to spacecraft breathing and/or jitter, but could potentially be caused by any marginally resolved nuclear flux from hot gas or star clusters. We assume here that the cause is PSF mismatch and ascribe all of the flux in these multiple PSF models (which we assume are modeling a single physical component) to the AGN itself, and we describe various Mrk tests of the validity of this assumption below. Mrk Galfit allows for surface brightness decompositions that NGC can be as simple or complicated as the user may wish. The Mrk 290 NGC ultimate goal of the surface brightness modeling in this project was to accurately remove the AGN PSF, thereby creating an


, with the ellipticity of the galaxy displayed below. AGN-free image of each host galaxy from which the starlight contribution could be measured.")
6 Figure 2. Image (top left), models (middle), and residuals (right) for Mrk 142. The upper panels display the simple models and their residuals, and the bottom panels display the optimal models and their residuals. The scale of the black bar in the top left panel is 10 arcsec and the compass in the bottom corner of the panel shows the directions north and east. The galaxy image and models are displayed with an inverted logarithmic stretch, and the residuals are displayed with an inverted linear stretch centered around zero counts. The bottom left panel shows the one-dimensional surface brightness of the galaxy (data points), the best-fit model (solid line), and each of the individual best-fit model components (PSF = dotted line, all others = dashed lines), with the ellipticity of the galaxy displayed below. AGN-free image of each host galaxy from which the starlight contribution could be measured. (2009a) assume uncertainties of 0.1 mag in the measured host-galaxy flux based in the range of acceptable models that could be found to fit an image. Here, we investigate the uncertainty in the best-fit models by carrying out two independent sets of surface brightness decompositions for each of the host-galaxy images in this study. The first set of models, which we will refer to as the optimal models, include multiple surface brightness components and make use of power-law rotation to model spiral arms, Fourier modes to account for bending of the ellipse modeling the light distribution and other asymmetric flux distributions, and truncation functions to allow for the modeling of rings. These models, which are shown in the bottom panels of Figures 2 10, are the best representations for the actual two-dimensional surface brightness distributions of the host galaxies. The second set of models, which we refer to as simple models, do not make use of power-law rotations, Fourier modes, or truncation functions. The simple models typically require a factor of three fewer free parameters than the optimal models and they are computationally much faster to run and to converge, but they less accurately represent the two-dimensional surface brightness profiles of the AGN host galaxies, as can be seen in the top panels of Figures Conversely, the optimal models do a good job of reproducing the relative flux in each pixel in the images, but the importance of this, other than being aesthetically pleasing, is not clear and the physical interpretation of each model component is not straightforward to determine. Tables 3 11 give the parameters determined for the optimal and simple fits for each of the nine galaxies fit here. The formats of the tables are as follows: Column 1 gives the note for the type of fit described ( optimal or simple ); Column 2 gives the component number of the fit, generally in order of increasing angular size and increasing angular offset from the center of the galaxy; and Column 3 gives the description for the type of model component (or components in the case of a PSF model and tilted plane sky model). The remaining columns describe the various parameters of each model, with Column 11 listing any notes relevant to the models. We give a brief description of the remaining columns below, but the interested reader is referred to Peng et al. (2010) for further details of the models and their parameters employed by Galfit. For the PSF models, Columns 4 and 5 are the angular offsets in arcseconds from the center of the galaxy (defined as the location of the AGN PSF) in the x and y directions, respectively. Column 6 is the integrated magnitude of the PSF model. For the sky models, Column 8 gives the average value of the sky background level in counts at the geometric center of the image, and Columns 9 and 10 give the flux gradients in the x and y directions, respectively. Sérsic models are listed with Columns 4 and 5 as the angular offsets in arcseconds from the center of the galaxy in the x and y directions, respectively. Column 6 gives the integrated 6


7 Figure 3. Same as Figure 2, but for SBS A. Figure 4. Same as Figure 2, but for Arp 151. The O shapes in the images are reflections in the optics from a nearby bright object. 7


8 Figure 5. Same as Figure 2, but for Mrk Figure 6. Same as Figure 2, but for Mrk


.")


9 Figure 7. Same as Figure 2, but for NGC 4253 (Mrk 766). Figure 8. Same as Figure 2, but for NGC


10 Figure 9. Same as Figure 2, but for Mrk 290. The small jump in surface brightness at 9 11 is due to the bright field star in the image. Figure 10. Same as Figure 2, but for NGC
11 Table 3 Surface Brightness Decomposition Mrk 142 Fit No. PSF+sky Δx ( 11 ) Δy ( 11 ) a dsky dsky m stmag... Sky (counts) dx (10 4 counts) dy (10 4 counts) Note sersic Δx ( 11 ) Δy ( 11 ) m stmag r e ( 11 ) n b/a P.A. (deg) power r in ( 11 ) r out ( 11 ) θ rot (deg) α θ incl (deg) θ sky (deg) fourier mode: a m, φ (deg) mode: a m, φ (deg) mode: a m, φ (deg) (1) (2) (3) (4) (5) (6) (7) (8) (9) (10) (11) Optimal 1, 2 PSF+sky sersic [1.0] power fourier... 1: : : fourier... 5: sersic fourier... 1: : : fourier... 5: sersic [1.0] power fourier... 1: : : fourier... 5: sersic [1.0] power fourier... 1: : : fourier... 5: merit χ 2 = N dof = N free = 81 χ 2 ν = Simple 1, 2 PSF+sky sersic bar? 4 sersic bar? 5 sersic [1.0] disk merit χ 2 = N dof = N free = 26 χ 2 ν = Notes. Values in square brackets were held fixed during the surface brightness model fitting. a The STmag magnitude system is based on the absolute physical flux per unit wavelength. magnitude of the S érsic component and Column 7 lists the effective radius in arcseconds. Column 8 gives the S érsic index, which was held fixed at a value of 1.0 for exponential-disk components. Columns 9 and 10 are the axis ratio and the position angle of the major axis in the image. Note that images were fit at the orientation obtained during the observation, and the position angles listed would need to be corrected for the roll angle of the spacecraft to determine their orientation relative to north. For the optimal fits, the Sérsic models were modified by power-law rotation, Fourier modes, and/or radial truncation functions. In the case of the truncation functions, where portions of the underlying model are removed, the S érsic profile is listed as sersic3 and we report the surface brightness at the break radius (Σ b ) and the break radius (r b ) itself in Columns 6 and 7, rather than the integrated magnitude and effective radius. Power-law rotations of a S érsic profile are denoted by power in Column 3. Columns 5 and 6 list the inner and outer radii of rotation in arcseconds. Column 7 gives the rotation angle between the inner and outer radii and Column 8 is the power-law slope, denoted as α. Columns 9 and 10 are the lineof-sight inclination angle of the disk, θ incl (with θ incl = 0 being equivalent to face-on), and the position angle of the rotation in the plane of the sky, θ sky. Fourier-mode modifications to Sérsic profiles are denoted by Fourier in Column 3. Beginning with Columns 5 and 6, and continuing through Column 10, are the modes (e.g., m = 1 or m = 3) and their amplitudes a m and phase angles (φ), where the phase angle is the relative angle between the Fourier mode and the position angle of the major axis of the parent S érsic profile. To avoid degeneracy with the axis-ratio parameter for the Sérsic profiles, we did not make use of the m = 2 Fourier mode. Truncation functions were generally used to model rings in the galaxies and are denoted as radial in Column 3. Both inner and outer truncations were used, with each denoted appropriately. Columns 4 and 5 give the angular offsets of the center of the truncation function from the center of the parent Sérsic profile in the x and y directions, respectively. Column 7 gives the break radius of the truncation function, defined to be the radius at which the truncation function has a value of 99% of the flux of the untruncated S érsic model at that same radius. Column 8 lists the softening length, Δr soft, where r break ± Δr soft ( + for outer truncations, for inner truncations) gives the radius at which the flux drops to 1% of the untruncated S érsic model flux. Columns 9 and 10 give the axis ratio and position angle of the truncation function. Finally, the last row of each fit gives the figures of merit for that particular surface brightness decomposition: χ 2 ; the number of degrees of freedom, N dof ; the number of free parameters in the models, N free ; and the reduced χ 2 2, χ ν. In addition, to test the suitability of our choice of using multiple TinyTim PSFs offset by fractions of a pixel to better model the AGN PSF in several objects, we carried out surface brightness decompositions using a variety of different PSF models. These included a very high S/N WFC3 image of the white dwarf EGGR 102, a bright field star from the image of Mrk 290 (one of our targets), a fainter star in the field around EGGR 102, and Moffat (1969) fits to each of these stars. We also investigated the effect of convolving the image and the PSF model with a narrow Gaussian to ensure Nyquist sampling (e.g., Kim et al. 2008). In each of these tests, we only allowed a single component to model the AGN PSF and we compare the results of the test to the results obtained using the fitting procedures 11
12 Table 4 Surface Brightness Decomposition SBS A Fit No. PSF+sky Δx ( 11 ) Δy ( 11 ) a dsky dsky m stmag... Sky (counts) dx (10 4 counts) dy (10 4 counts) Note sersic Δx ( 11 ) Δy ( 11 ) m stmag r e ( 11 ) n b/a P.A. (deg) power r in ( 11 ) r out ( 11 ) θ rot (deg) α θ incl (deg) θ sky (deg) fourier mode: a m, φ (deg) mode: a m, φ (deg) mode: a m, φ (deg) (1) (2) (3) (4) (5) (6) (7) (8) (9) (10) (11) Optimal 1, 2 PSF+sky sersic fourier... 1: : : : : : 5.84 fourier... 5: : sersic fourier... 1: : : : : : 9.84 fourier... 5: : sersic [1.0] power fourier... 1: : : : : : fourier... 5: : sersic [1.0] power fourier... 1: : : : : : fourier... 5: : sersic [1.0] power fourier... 1: : : : : : fourier... 5: : merit χ 2 = N dof = N free = 96 χ 2 ν = Simple 1, 2 PSF+sky sersic bulge 4 sersic lens 5 sersic bar 6 sersic [1.0] disk merit χ 2 = N dof = N free = 33 χ 2 ν = Notes. Values in square brackets were held fixed during the surface brightness model fitting. a The STmag magnitude system is based on the absolute physical flux per unit wavelength. described above and tabulated in Tables When the image of a star was used as the PSF model, the difference in central host-galaxy flux measured from an AGN-free image was only 1%, and it was only slightly higher ( 2%) when a Moffat fit to a star image was used as the PSF model. Broadening the image and the PSF model caused the largest difference in central hostgalaxy flux, about 7%, so while this approach has been found to work in the past for other HST cameras and in other situations, it was the least successful alternative in this case. As expected, the fit residuals at the center of the galaxy are the smallest when we allow multiple TinyTim models to account for the central AGN PSF. Furthermore, TinyTim has the advantage of producing PSF models with infinite S/N, therefore avoiding the problem of introducing additional noise into the AGN-free images from which we determine the host-galaxy starlight contribution. We find the same results when we also fit the image of the bright star in the field of Mrk 290 with multiple TinyTim PSF models the residuals in the fit are decreased without adding extra noise. Below, we provide some notes on each of the individual galaxies modeled in this work. Mrk 142. Mrk 142 is a late-type spiral galaxy at intermediate inclination. It does not appear to have a bulge, but does seem to have a bar that manifests itself as a compact structure with a low S érsic index (n <1) and elongated shape. At the highest redshift of any of the galaxies modeled here (z = 0.045), the bulge may be too compact to disentangle from the very bright unresolved AGN. Its morphological classification according to these images is SBcd-SBd. The parameters for the optimal and simple surface brightness decompositions of Mrk 142 are tabulated in Table 3, and the models and residuals are displayed in Figure 2. SBS A. SBS A is a relatively face-on barred spiral galaxy with an exponential bulge, approximately SBb in type. The best-fit parameters for its surface brightness decompositions, which are given in Table 4, include a lens (uniform disk; de Vaucouleurs 1959) that is more extended than the bulge, nearly circular, and has a very low Sérsic index (n ) in both the optimal and simple models. The models and residuals are displayed in Figure 3. Arp 151. Arp 151 (Mrk 40) is an early-type spiral galaxy (S0-Sa) with a hint of remaining spiral structure and a long tidal tail stretching north northwest from a recent encounter with a small companion galaxy at a projected angular distance of The messy morphology of Arp 151 and its companion required multiple surface brightness components for an accurate fit, and we do not attempt an interpretation of their physical meaning here. The best-fit parameters for its surface brightness decompositions are listed in Table 5, and the models and residuals are displayed in Figure 4. Mrk Mrk 1310 is a ringed spiral galaxy, approximately Sb in type, with an apparently large number of bright globular clusters. There is also a faint galaxy directly south of Mrk 1310 that appears as an arc. The location of the galaxy along the line of sight to Mrk 1310 is unknown, but the distorted shape of this faint galaxy may mean that it is being tidally disrupted by Mrk 1310, or it may simply be a chance superposition. The large angular separation and orientation of elongation rule 12
13 Table 5 Surface Brightness Decomposition Arp 151 Fit No. PSF+sky Δx ( 11 ) Δy ( 11 ) m a dsky stmag... Sky (counts) sersic Δx ( 11 ) Δy ( 11 ) m stmag r e ( 11 dx (10 4 dsky counts) dy (10 4 counts) Note ) n b/a P.A. (deg) fourier mode: a m, φ (deg) mode: a m, φ (deg) mode: a m, φ (deg) (1) (2) (3) (4) (5) (6) (7) (8) (9) (10) (11) Optimal 1, 2 PSF+sky PSF sersic fourier... 1: : : fourier... 5: sersic fourier... 1: : : fourier... 5: sersic [1.0] fourier... 1: : : fourier... 5: PSF sersic fourier... 1: : sersic [1.0] fourier... 1: : sersic [1.0] fourier... 1: : sersic [1.0] fourier... 1: : merit χ 2 = N dof = N free = 101 χν 2 Simple 1, 2 PSF+sky [25.0] PSF PSF sersic bulge 5 sersic bulge 7 sersic [1.0] disk/debris 8 sersic [1.0] debris 9 PSF sersic sersic [1.0] sersic [1.0] PSF sersic sersic [1.0] merit χ 2 = N dof = N free = 75 χν 2 Notes. Values in square brackets were held fixed during the surface brightness model fitting. a The STmag magnitude system is based on the absolute physical flux per unit wavelength. out the possibility of gravitational lensing. Additional color information, at the minimum, will be necessary to determine where this small galaxy exists along our line of sight to Mrk The best-fit parameters for the surface brightness decompositions of Mrk 1310 are given in Table 6, and the models and residuals are displayed in Figure 5. Mrk 202. Mrk 202 is a compact face-on spiral galaxy, approximately Sb in type, with a bright star-forming ring. The best-fit parameters for its surface brightness decompositions are listed in Table 7, and the models and residuals are displayed in Figure 6. NGC NGC 4253 (Mrk 766) is a barred spiral galaxy of type SBc with a distinct nuclear spiral and a faint outer ring. It is also classified as a narrow-line Seyfert 1 because of its relatively narrow broad emission lines. The best-fit parameters for its surface brightness decompositions are given in Table 8, and the models and residuals are displayed in Figure 7. NGC NGC 4748 is a barred spiral galaxy with a nuclear starbursting ring and is currently undergoing an interaction with another, slightly smaller, spiral galaxy. The best-fit parameters for its surface brightness decompositions are given in Table 9, and the models and residuals are displayed in Figure 8. Mrk 290. Mrk 290 is an early-type spiral galaxy (Sa-Sab) at a relatively low inclination to our line of sight. The bright source to the southeast appears to be a star in our own Galaxy. The best-fit parameters for its surface brightness decompositions are listed in Table 10, and the models and residuals are displayed in Figure 9. NGC NGC 6814 is a beautiful, face-on, moderately barred spiral galaxy at a fairly low redshift of (D L 20 Mpc), making it one of the nearest broad-lined AGNs in the local universe and in our sample. The best-fit parameters for its surface brightness decompositions are given in Table 11, and the models and residuals are displayed in Figure AGN FLUXES 5.1. Starlight Measurements and AGN Flux Recovery The host-galaxy starlight contribution to the 5100 Å spectroscopic flux was determined by first measuring the yield of 13
14 Table 6 Surface Brightness Decomposition Mrk 1310 Fit No. PSF+sky Δx ( 11 ) Δy ( 11 ) m a dsky stmag... Sky (counts) dx (10 4 dsky counts) dy (10 4 counts) Note sersic Δx ( 11 ) Δy ( 11 ) m stmag r e ( 11 ) n b/a P.A. (deg) sersic3 Δx ( 11 ) Δy ( 11 ) Σ b r b ( 11 ) n b/a P.A. (deg) radial Δx ( 11 ) Δy ( 11 ) r break ( 11 ) Δr soft ( 11 ) b/a P.A. (deg) power r in ( 11 ) r out ( 11 ) θ rot (deg) α θ incl (deg) θ sky (deg) fourier mode: a m, φ (deg) mode: a m, φ (deg) mode: a m, φ (deg) (1) (2) (3) (4) (5) (6) (7) (8) (9) (10) (11) Optimal 1, 2 PSF+sky [73.5] PSF PSF sersic fourier... 1: : : fourier... 5: : sersic [1.0] power fourier... 1: sersic [1.0] radial,inner fourier... 1: : : fourier... 5: radial,outer fourier... 1: : : fourier... 5: sersic small galaxy fourier... 1: merit χ 2 = N dof = N free = 85 χν 2 Simple 1, 2 PSF+sky sersic bulge 4 sersic bulge+ring 5 sersic [1.0] disk merit χ 2 = N dof = N free = 19 χν 2 Notes. Values in square brackets were held fixed during the surface brightness model fitting. a The STmag magnitude system is based on the absolute physical flux per unit wavelength. electrons within a rectangular aperture, with dimensions and orientation matching that of the ground-based monitoring campaign, centered on the nucleus of the galaxy in the PSF- and sky-subtracted HST image. The exposure time and inverse sensitivity for each image (HST keyword photflam, having units of erg cm 2 Å 1 electron 1 ) were utilized to recover the incident photon flux from the yield of electrons. All photflam values were taken from the most recent recalibration of the appropriate data set through the HST pipeline as of 2012 June 12. For the ACS images, the photflam values are somewhat different from those previously used by (2009a) because they have been updated to account for the loss of sensitivity of the High Resolution Channel over time (Bohlin et al. 2011). Once the host-galaxy flux through the HST system had been determined, a small color correction was necessary to account for the difference between rest-frame 5100 Å and the pivot wavelength 18 of the filter. To determine the color correction, a bulge template spectrum (Kinney et al. 1996) was redshifted and reddened by the appropriate amounts to approximate the central host galaxy of each AGN. Only Galactic extinction was included in the reddening, and the values used are slightly different from previous values employed by (2009a) because they are based on the Schlafly & Finkbeiner (2011) recalibration of the Schlegel et al. (1998) dust map. The Galactic extinction values are smaller by a few hundredths of a magnitude for 18 A measure of the effective wavelength of a filter that is independent of the source spectral energy distribution (Tokunaga & Vacca 2005). all of our sample (median difference of mag) except for 3C 120 where the new extinction value is 0.2 mag smaller than before. The ratio of the 5100 Å flux to the flux through the HST filter (which we associate with the pivot wavelength) was estimated from the redshifted and reddened spectrum using synphot, and is listed in Table 12. The final derived host-galaxy flux contributions to the ground-based spectroscopic continuum flux are given in Table 12. These values were subtracted from the absolute calibrations of the mean continuum fluxes during the monitoring campaigns to recover the mean AGN fluxes at rest-frame 5100 Å, from which the AGN luminosities were determined. We discuss the effects of ground-based seeing and modeling uncertainties, among others, below Uncertainties The uncertainty in the recovered AGN flux is a combination of the mean measurement uncertainty in the continuum flux from the reverberation campaign and the uncertainty in the host-galaxy contribution to the continuum flux. The former is a small component, ranging from 1% to 5% for the measurements included here. This is due to the requirement for reverberationmapping campaigns to achieve a high S/N per pixel in the continuum flux of each individual spectrum acquired throughout the campaign (typically S/N ) in order to measure the few-percent variations that evidence the reverberation signal. The latter contribution to the AGN flux uncertainty was determined by adding in quadrature the uncertainty in the starlight 14
Methods of Measuring Black Hole Masses: Reverberation Mapping. Misty C. Bentz Georgia State University
 Methods of Measuring Black Hole Masses: Reverberation Mapping Misty C. Bentz Georgia State University Black Hole Masses in AGNs Dynamical methods generally not feasible in AGNs AGNs rare = distant, poor
ACTIVE GALACTIC NUCLEI: optical spectroscopy. From AGN classification to Black Hole mass estimation
 ACTIVE GALACTIC NUCLEI: optical spectroscopy From AGN classification to Black Hole mass estimation Second Lecture Reverberation Mapping experiments & virial BH masses estimations Estimating AGN black hole
Black Hole and Host Galaxy Mass Estimates
 Black Holes Black Hole and Host Galaxy Mass Estimates 1. Constraining the mass of a BH in a spectroscopic binary. 2. Constraining the mass of a supermassive BH from reverberation mapping and emission line
The cosmic distance scale
 The cosmic distance scale Distance information is often crucial to understand the physics of astrophysical objects. This requires knowing the basic properties of such an object, like its size, its environment,
The overall uncertainty of single-epoch virial black hole mass estimates and its implication to the M BH -σ relation
 The overall uncertainty of single-epoch virial black hole mass estimates and its implication to the M BH -σ relation and Daeseong Park Seoul National University E-mail: woo@astro.snu.ac.kr, pds2001@astro.snu.ac.kr
Infow and Outfow in the Broad Line Region of AGN
 Infow and Outfow in the Broad Line Region of AGN Anna Pancoast (Harvard-Smithsonian Center for Astrophysics) Einstein Fellows Symposium, October 13, 2017 Collaborators: Catherine Grier (PSU) Michael Fausnaugh
Hubble Space Telescope ultraviolet spectroscopy of blazars: emission lines properties and black hole masses. E. Pian, R. Falomo, A.
 Hubble Space Telescope ultraviolet spectroscopy of blazars: emission lines properties and black hole masses E. Pian, R. Falomo, A. Treves 1 Outline Extra Background Introduction Sample Selection Data Analysis
Surface Photometry Quantitative description of galaxy morphology. Hubble Sequence Qualitative description of galaxy morphology
 Hubble Sequence Qualitative description of galaxy morphology Surface Photometry Quantitative description of galaxy morphology Galaxy structure contains clues about galaxy formation and evolution Point
Lecture Outlines. Chapter 24. Astronomy Today 8th Edition Chaisson/McMillan Pearson Education, Inc.
 Lecture Outlines Chapter 24 Astronomy Today 8th Edition Chaisson/McMillan Chapter 24 Galaxies Units of Chapter 24 24.1 Hubble s Galaxy Classification 24.2 The Distribution of Galaxies in Space 24.3 Hubble
Survey of Astrophysics A110
 Goals: Galaxies To determine the types and distributions of galaxies? How do we measure the mass of galaxies and what comprises this mass? How do we measure distances to galaxies and what does this tell
The Evolution of BH Mass Scaling Relations
 The Evolution of BH Mass Scaling Relations Nicola Bennert UCSB in collaboration with Tommaso Treu (UCSB), Jong-Hak Woo (UCLA), Alexandre Le Bris (UCSB), Matthew A. Malkan (UCLA), Matthew W. Auger (UCSB),
Chapter 15 2/19/2014. Lecture Outline Hubble s Galaxy Classification. Normal and Active Galaxies Hubble s Galaxy Classification
 Lecture Outline Chapter 15 Normal and Active Galaxies Spiral galaxies are classified according to the size of their central bulge. Chapter 15 Normal and Active Galaxies Type Sa has the largest central
There are three main ways to derive q 0 :
 Measuring q 0 Measuring the deceleration parameter, q 0, is much more difficult than measuring H 0. In order to measure the Hubble Constant, one needs to derive distances to objects at 100 Mpc; this corresponds
A New Mass Estimate of the Central Supermassive Black Hole in NGC with Reverberation Mapping
 A New Mass Estimate of the Central Supermassive Black Hole in NGC 4051 with Reverberation Mapping Kelly D. Denney 1 ABSTRACT There is increasingly strong evidence from observations of the local universe
Astro2010 Science White Paper: Tracing the Mass Buildup of Supermassive Black Holes and their Host Galaxies
 Astro2010 Science White Paper: Tracing the Mass Buildup of Supermassive Black Holes and their Host Galaxies Anton M. Koekemoer (STScI) Dan Batcheldor (RIT) Marc Postman (STScI) Rachel Somerville (STScI)
Frequency of Seyfert Type Transitions in a Sample of 102 Local Active Galactic Nuclei
 Frequency of Seyfert Type Transitions in a Sample of 102 Local Active Galactic Nuclei Jordan Runco A Thesis presented for the degree of Physics Department of Physics California Polytechnic State University
Lecture 19: Galaxies. Astronomy 111
 Lecture 19: Galaxies Astronomy 111 Galaxies What is a galaxy? Large assembly of stars, gas and dust, held together by gravity Sizes: Largest: ~1 Trillion stars (or more) Smallest: ~10 Million stars Milky
Measuring Black Hole Masses in Nearby Galaxies with Laser Guide Star Adaptive Optics
 Measuring Black Hole Masses in Nearby Galaxies with Laser Guide Star Adaptive Optics Claire Max Anne Medling Mark Ammons UC Santa Cruz Ric Davies Hauke Engel MPE-Garching Image of NGC 6240: Bush et al.
arxiv: v1 [astro-ph] 20 Oct 2008
![arxiv: v1 [astro-ph] 20 Oct 2008](/thumbs/73/68920988.jpg "arxiv: v1 [astro-ph] 20 Oct 2008") Systematic Uncertainties in Black Hole Masses Determined from Single Epoch Spectra Kelly D. Denney 1, Bradley M. Peterson 1, Matthias Dietrich 1, Marianne Vestergaard 2, and Misty C. Bentz 1,3 arxiv:0810.3234v1
Systematic Uncertainties in Black Hole Masses Determined from Single Epoch Spectra Kelly D. Denney 1, Bradley M. Peterson 1, Matthias Dietrich 1, Marianne Vestergaard 2, and Misty C. Bentz 1,3 arxiv:0810.3234v1
The AGN Black Hole Mass Database
 PUBLICATIONS OF THE ASTRONOMICAL SOCIETY OF THE PACIFIC, 127:67 73, 2015 January 2015. The Astronomical Society of the Pacific. All rights reserved. Printed in U.S.A. The AGN Black Hole Mass Database MISTY
Astr 5465 Feb. 13, 2018 Distribution & Classification of Galaxies Distribution of Galaxies
 Astr 5465 Feb. 13, 2018 Distribution & Classification of Galaxies Distribution of Galaxies Faintest galaxies are distributed ~ uniformly over the sky except for the Galactic plane (zone of avoidance) Brighter
Structure and Kinematics of the central BLR in AGN
 Structure and Kinematics of the central BLR in AGN Wolfram Kollatschny, Göttingen Divcibare, 2011 University Observatory Institute for Astrophysics Broad Line Region Size? radius: - 10-4...10-1 pc - 1...
The Classification of Galaxies
 Admin. 11/9/17 1. Class website http://www.astro.ufl.edu/~jt/teaching/ast1002/ 2. Optional Discussion sections: Tue. ~11.30am (period 5), Bryant 3; Thur. ~12.30pm (end of period 5 and period 6), start
An Introduction to Galaxies and Cosmology. Jun 29, 2005 Chap.2.1~2.3
 An Introduction to Galaxies and Cosmology Jun 29, 2005 Chap.2.1~2.3 2.1 Introduction external galaxies normal galaxies - majority active galaxies - 2% high luminosity (non-stellar origin) variability
Galaxies with Active Nuclei. Active Galactic Nuclei Seyfert Galaxies Radio Galaxies Quasars Supermassive Black Holes
 Galaxies with Active Nuclei Active Galactic Nuclei Seyfert Galaxies Radio Galaxies Quasars Supermassive Black Holes Active Galactic Nuclei About 20 25% of galaxies do not fit well into Hubble categories
Chapter 19 Galaxies. Hubble Ultra Deep Field: Each dot is a galaxy of stars. More distant, further into the past. halo
 Chapter 19 Galaxies Hubble Ultra Deep Field: Each dot is a galaxy of stars. More distant, further into the past halo disk bulge Barred Spiral Galaxy: Has a bar of stars across the bulge Spiral Galaxy 1
Surface Brightness of Spiral Galaxies
 Surface Brightness of Spiral Galaxies M104: SA N4535: SAB LMC: dwarf irregular,barred Normal 1/4-law+exp fits An example of surface brightness profile. The top curve is the sum of exp disk+1/4-bulge. The
Line Profile Variability in AGNs
 Line Profile Variability in AGNs Wolfram Kollatschny, Göttingen Serbia, 2007 University Observatory Institute for Astrophysics Scale Sizes of an AGN HST : 0.1 2pc R. Blandford 1pc = 3.3 ly = 1190. ld =
Quasars and Active Galactic Nuclei (AGN)
") Quasars and Active Galactic Nuclei (AGN) Astronomy Summer School in Mongolia National University of Mongolia, Ulaanbaatar July 21-26, 2008 Kaz Sekiguchi Hubble Classification M94-Sa M81-Sb M101-Sc M87-E0
Quasars and Active Galactic Nuclei (AGN) Astronomy Summer School in Mongolia National University of Mongolia, Ulaanbaatar July 21-26, 2008 Kaz Sekiguchi Hubble Classification M94-Sa M81-Sb M101-Sc M87-E0
Quasars ASTR 2120 Sarazin. Quintuple Gravitational Lens Quasar
 Quasars ASTR 2120 Sarazin Quintuple Gravitational Lens Quasar Quasars Quasar = Quasi-stellar (radio) source Optical: faint, blue, star-like objects Radio: point radio sources, faint blue star-like optical
Coevolution (Or Not) of Supermassive Black Holes and Galaxies
 of Supermassive Black Holes and Galaxies") Coevolution (Or Not) of Supermassive Black Holes and Galaxies Luis C. Ho ( 何子山 ) The Observatories of the Carnegie Institution for Science Ho 2008, ARA&A Nuclear Activity in Nearby Galaxies Kormendy &
Coevolution (Or Not) of Supermassive Black Holes and Galaxies Luis C. Ho ( 何子山 ) The Observatories of the Carnegie Institution for Science Ho 2008, ARA&A Nuclear Activity in Nearby Galaxies Kormendy &
24.1 Hubble s Galaxy Classification
 Chapter 24 Galaxies Units of Chapter 24 24.1 Hubble s Galaxy Classification 24.2 The Distribution of Galaxies in Space 24.3 Hubble s Law 24.4 XXActive Galactic Nuclei XXRelativistic Redshifts and Look-Back
Galaxies. Galaxy Diversity. Galaxies, AGN and Quasars. Physics 113 Goderya
 Galaxies, AGN and Quasars Physics 113 Goderya Chapter(s): 16 and 17 Learning Outcomes: Galaxies Star systems like our Milky Way Contain a few thousand to tens of billions of stars. Large variety of shapes
The Correlation Between Supermassive Black Hole Mass and the Structure of Ellipticals and Bulges
 1 The Correlation Between Supermassive Black Hole Mass and the Structure of Ellipticals and Bulges Peter Erwin 1, Alister W. Graham 2, Nicola Caon 1 (1) Instituto de Astrofísica de Canarias, La Laguna,
Star systems like our Milky Way. Galaxies
 Galaxies Star systems like our Milky Way Galaxies Contain a few thousand to tens of billions of stars,as well as varying amounts of gas and dust Large variety of shapes and sizes Gas and Dust in
Active Galaxies & Emission Line Diagnostics
 Active Galaxies & Emission Line Diagnostics Review of Properties Discussed: 1) Powered by accretion unto a supermassive nuclear black hole 2) They are the possible precursors to luminous massive galaxies
Black Holes and Active Galactic Nuclei
 Black Holes and Active Galactic Nuclei A black hole is a region of spacetime from which gravity prevents anything, including light, from escaping. The theory of general relativity predicts that a sufficiently
MASSIVE BLACK HOLES AMY REINES IN NEARBY DWARF GALAXIES HUBBLE FELLOW NATIONAL OPTICAL ASTRONOMY OBSERVATROY
 MASSIVE BLACK HOLES IN NEARBY DWARF GALAXIES AMY REINES HUBBLE FELLOW NATIONAL OPTICAL ASTRONOMY OBSERVATROY Motivation: The origin of massive black holes (BHs) Massive BHs are fundamental components of
Astr 2320 Thurs. April 27, 2017 Today s Topics. Chapter 21: Active Galaxies and Quasars
 Astr 2320 Thurs. April 27, 2017 Today s Topics Chapter 21: Active Galaxies and Quasars Emission Mechanisms Synchrotron Radiation Starburst Galaxies Active Galactic Nuclei Seyfert Galaxies BL Lac Galaxies
Big Galaxies Are Rare! Cepheid Distance Measurement. Clusters of Galaxies. The Nature of Galaxies
 Big Galaxies Are Rare! Potato Chip Rule: More small things than large things Big, bright spirals are easy to see, but least common Dwarf ellipticals & irregulars are most common Faint, hard to see Mostly
Galaxies & Introduction to Cosmology
 Galaxies & Introduction to Cosmology Other Galaxies: How many are there? Hubble Deep Field Project 100 hour exposures over 10 days Covered an area of the sky about 1/100 the size of the full moon Probably
THE LICK AGN MONITORING PROJECT: THE M BH σ RELATION FOR REVERBERATION-MAPPED ACTIVE GALAXIES
 The Astrophysical Journal, 716:269 280, 2010 June 10 C 2010. The American Astronomical Society. All rights reserved. Printed in the U.S.A. doi:10.1088/0004-637x/716/1/269 THE LICK AGN MONITORING PROJECT:
AST Cosmology and extragalactic astronomy. Lecture 20. Black Holes Part II
 AST4320 - Cosmology and extragalactic astronomy Lecture 20 Black Holes Part II 1 AST4320 - Cosmology and extragalactic astronomy Outline: Black Holes Part II Gas accretion disks around black holes, and
Black Holes in Hibernation
 Black Holes in Hibernation Black Holes in Hibernation Only about 1 in 100 galaxies contains an active nucleus. This however does not mean that most galaxies do no have SMBHs since activity also requires
Chapter 10: Unresolved Stellar Populations
 Chapter 10: Unresolved Stellar Populations We now consider the case when individual stars are not resolved. So we need to use photometric and spectroscopic observations of integrated magnitudes, colors
Normal Galaxies ASTR 2120 Sarazin
 Normal Galaxies ASTR 2120 Sarazin Test #2 Monday, April 8, 11-11:50 am ASTR 265 (classroom) Bring pencils, paper, calculator You may not consult the text, your notes, or any other materials or any person
MASSACHUSETTS INSTITUTE OF TECHNOLOGY Physics Department Earth, Atmospheric, and Planetary Sciences Department. Final Exam
 MASSACHUSETTS INSTITUTE OF TECHNOLOGY Physics Department Earth, Atmospheric, and Planetary Sciences Department Physics 8.282J EAPS 12.402J May 20, 2005 Final Exam Name Last First (please print) 1. Do any
Active Galactic Nuclei
 Active Galactic Nuclei Optical spectra, distance, line width Varieties of AGN and unified scheme Variability and lifetime Black hole mass and growth Geometry: disk, BLR, NLR Reverberation mapping Jets
NICMOS Status and Plans
 1997 HST Calibration Workshop Space Telescope Science Institute, 1997 S. Casertano, et al., eds. NICMOS Status and Plans Rodger I. Thompson Steward Observatory, University of Arizona, Tucson, AZ 85721
Active Galaxies & Quasars
 Active Galaxies & Quasars Normal Galaxy Active Galaxy Galactic Nuclei Bright Active Galaxy NGC 5548 Galaxy Nucleus: Exact center of a galaxy and its immediate surroundings. If a spiral galaxy, it is the
2. Active Galaxies. 2.1 Taxonomy 2.2 The mass of the central engine 2.3 Models of AGNs 2.4 Quasars as cosmological probes.
 2. Active Galaxies 2.1 Taxonomy 2.2 The mass of the central engine 2.3 Models of AGNs 2.4 Quasars as cosmological probes Read JL chapter 3 Active galaxies: interface with JL All of JL chapter 3 is examinable,
Galaxy Classification and the Hubble Deep Field
 Galaxy Classification and the Hubble Deep Field A. The Hubble Galaxy Classification Scheme Adapted from the UW Astronomy Dept., 1999 Introduction A galaxy is an assembly of between a billion (10 9 ) and
M31 - Andromeda Galaxy M110 M32
 UNIT 4 - Galaxies XIV. The Milky Way galaxy - a huge collection of millions or billions of stars, gas, and dust, isolated in space and held together by its own gravity M110 M31 - Andromeda Galaxy A. Structure
Source plane reconstruction of the giant gravitational arc in Abell 2667: a condidate Wolf-Rayet galaxy at z 1
 Source plane reconstruction of the giant gravitational arc in Abell 2667: a condidate Wolf-Rayet galaxy at z 1 Speaker: Shuo Cao Department of Astronomy Beijing Normal University Collaborators: Giovanni
The shapes of faint galaxies: A window unto mass in the universe
 Lecture 15 The shapes of faint galaxies: A window unto mass in the universe Intensity weighted second moments Optimal filtering Weak gravitational lensing Shear components Shear detection Inverse problem:
Active Galactic Alexander David M Nuclei
 d.m.alexander@durham.ac.uk Durham University David M Alexander Active Galactic Nuclei The Power Source QuickTime and a YUV420 codec decompressor are needed to see this picture. Black hole is one billionth
GALAXIES. I. Morphologies and classification 2. Successes of Hubble scheme 3. Problems with Hubble scheme 4. Galaxies in other wavelengths
 GALAXIES I. Morphologies and classification 2. Successes of Hubble scheme 3. Problems with Hubble scheme 4. Galaxies in other wavelengths 5. Properties of spirals and Irregulars. Hubble tuning-fork diagram.
BHS Astronomy: Galaxy Classification and Evolution
 Name Pd Date BHS Astronomy: Galaxy Classification and Evolution This lab comes from http://cosmos.phy.tufts.edu/~zirbel/ast21/homework/hw-8.pdf (Tufts University) The word galaxy, having been used in English
LECTURE 1: Introduction to Galaxies. The Milky Way on a clear night
 LECTURE 1: Introduction to Galaxies The Milky Way on a clear night VISIBLE COMPONENTS OF THE MILKY WAY Our Sun is located 28,000 light years (8.58 kiloparsecs from the center of our Galaxy) in the Orion
Reverberation Mapping
 Reverberation Mapping Astro 7B Spring 2016, Lab 101 GSI: Goni Halevi SOLUTIONS 1 What is it? As a quick review, let s recall that the purpose of reverberation mapping is to measure black hole masses. In
Quantifying the Assembly History of Elliptical Galaxies
 Quantifying the Assembly History of Elliptical Galaxies Michael Pierce (University of Wyoming) A Science Use Case for GMT and TMT Origin of Elliptical Galaxies! Elliptical Galaxies Form Through Mergers!
Halo Gas Velocities Using Multi-slit Spectroscopy
 Halo Gas Velocities Using Multi-slit Spectroscopy Cat Wu Thesis Proposal, Fall 2009 Astronomy Department New Mexico State University Outline Diffuse ionized gas; galaxy halos Origin of halo galactic fountain
arxiv: v1 [astro-ph.ga] 11 Jan 2018
![arxiv: v1 [astro-ph.ga] 11 Jan 2018](/thumbs/93/113435957.jpg "arxiv: v1 [astro-ph.ga] 11 Jan 2018") arxiv:1803866v1 [astro-ph.ga] 11 Jan 2018 Reverberation Mapping of High-z, High-luminosity Quasars Paulina Lira 1, Ismael Botti 2, Shai Kaspi 3 and Hagai Netzer 3,4 1, Departamento de Astronomía, Universidad
arxiv:1803866v1 [astro-ph.ga] 11 Jan 2018 Reverberation Mapping of High-z, High-luminosity Quasars Paulina Lira 1, Ismael Botti 2, Shai Kaspi 3 and Hagai Netzer 3,4 1, Departamento de Astronomía, Universidad
Galaxy Classification
 Galaxies Galaxies are collections of billons of stars; our home galaxy, the Milky Way, is a typical example. Stars, gas, and interstellar dust orbit the center of the galaxy due to the gravitational attraction
AGN Central Engines. Supermassive Black Holes (SMBHs) Masses and Accretion Rates SMBH Mass Determinations Accretion Disks
 Masses and Accretion Rates SMBH Mass Determinations Accretion Disks") AGN Central Engines Supermassive Black Holes (SMBHs) Masses and Accretion Rates SMBH Mass Determinations Accretion Disks 1 Supermassive Black Holes Need to generate L > 10 43 ergs/sec inside radius < 10
AGN Central Engines Supermassive Black Holes (SMBHs) Masses and Accretion Rates SMBH Mass Determinations Accretion Disks 1 Supermassive Black Holes Need to generate L > 10 43 ergs/sec inside radius < 10
Luminosity Functions of Planetary Nebulae & Globular Clusters. By Azmain Nisak ASTR 8400
 Luminosity Functions of Planetary Nebulae & Globular Clusters By Azmain Nisak ASTR 8400 Calculating Distance! m = apparent magnitude! M = absolute magnitude! r = distance in pc GLOBULAR CLUSTERS AS DISTANCE
The Next 2-3 Weeks. Important to read through Chapter 17 (Relativity) before I start lecturing on it.
 before I start lecturing on it.") The Next 2-3 Weeks [27.1] The Extragalactic Distance Scale. [27.2] The Expansion of the Universe. [29.1] Newtonian Cosmology [29.2] The Cosmic Microwave Background [17] General Relativity & Black Holes
The Next 2-3 Weeks [27.1] The Extragalactic Distance Scale. [27.2] The Expansion of the Universe. [29.1] Newtonian Cosmology [29.2] The Cosmic Microwave Background [17] General Relativity & Black Holes
2 Galaxy morphology and classification
 2 Galaxy morphology and classification Galaxy classification is an important first step towards a physical understanding of the nature of these objects. For a detailed description of classification systems
Reverberation Mapping in the Era of MOS and Time-Domain Surveys: from SDSS to MSE
 Reverberation Mapping in the Era of MOS and Time-Domain Surveys: from SDSS to MSE Yue Shen Carnegie Obs -> University of Illinois at Urbana-Champaign MSE Science Team Meeting, July 29-31 2015, Big Island
Multi-wavelength Surveys for AGN & AGN Variability. Vicki Sarajedini University of Florida
 Multi-wavelength Surveys for AGN & AGN Variability Vicki Sarajedini University of Florida What are Active Galactic Nuclei (AGN)? Galaxies with a source of non-stellar emission arising in the nucleus (excessive
ASTRO 310: Galac/c & Extragalac/c Astronomy Prof. Jeff Kenney. Class 17 Mar 30, 2016 Starlight Distribu/ons in Disk Galaxies
 ASTRO 310: Galac/c & Extragalac/c Astronomy Prof. Jeff Kenney Class 17 Mar 30, 2016 Starlight Distribu/ons in Disk Galaxies reminder no class next Monday, April 3!! 3 Color op/cal image of spiral galaxy
Hubble s Law and the Cosmic Distance Scale
 Lab 7 Hubble s Law and the Cosmic Distance Scale 7.1 Overview Exercise seven is our first extragalactic exercise, highlighting the immense scale of the Universe. It addresses the challenge of determining
Techniques for measuring astronomical distances generally come in two variates, absolute and relative.
 Chapter 6 Distances 6.1 Preliminaries Techniques for measuring astronomical distances generally come in two variates, absolute and relative. Absolute distance measurements involve objects possibly unique
Calibration of ACS Prism Slitless Spectroscopy Modes
 The 2005 HST Calibration Workshop Space Telescope Science Institute, 2005 A. M. Koekemoer, P. Goudfrooij, and L. L. Dressel, eds. Calibration of ACS Prism Slitless Spectroscopy Modes S. S. Larsen, M. Kümmel
1 Lecture, 2 September 1999
 1 Lecture, 2 September 1999 1.1 Observational astronomy Virtually all of our knowledge of astronomical objects was gained by observation of their light. We know how to make many kinds of detailed measurements
Introduction to AGN. General Characteristics History Components of AGN The AGN Zoo
 Introduction to AGN General Characteristics History Components of AGN The AGN Zoo 1 AGN What are they? Active galactic nucleus compact object in the gravitational center of a galaxy that shows evidence
High Redshift Universe
 High Redshift Universe Finding high z galaxies Lyman break galaxies (LBGs) Photometric redshifts Deep fields Starburst galaxies Extremely red objects (EROs) Sub-mm galaxies Lyman α systems Finding high
Journal Club Presentation on The BIMA Survey of Nearby Galaxies. I. The Radial Distribution of CO Emission in Spiral Galaxies by Regan et al.
 Journal Club Presentation on The BIMA Survey of Nearby Galaxies. I. The Radial Distribution of CO Emission in Spiral Galaxies by Regan et al. ApJ, 561:218-237, 2001 Nov 1 1 Fun With Acronyms BIMA Berkely
Spectral variability of AGN Dragana Ilić
 Spectral variability of AGN Dragana Ilić Luka Č. Popović, Andjelka Kovačević, Alla Shapovalova 1. Department of Astronomy, Faculty of Math. - University of Belgrade, 2. Astronomical Observatory Belgrade,
Gas and Stellar Dynamical Black Hole Mass Measurements:
 Gas and Stellar Dynamical Black Hole Mass Measurements: Revisiting M84 and a Consistency Test with NGC 3998 Jonelle Walsh (UC Irvine/UT Austin) Aaron Barth (UC Irvine) Remco van den Bosch (MPIA) Marc Sarzi
Part two of a year-long introduction to astrophysics:
 ASTR 3830 Astrophysics 2 - Galactic and Extragalactic Phil Armitage office: JILA tower A909 email: pja@jilau1.colorado.edu Spitzer Space telescope image of M81 Part two of a year-long introduction to astrophysics:
Observing the Formation of Dense Stellar Nuclei at Low and High Redshift (?) Roderik Overzier Max-Planck-Institute for Astrophysics
 Roderik Overzier Max-Planck-Institute for Astrophysics") Observing the Formation of Dense Stellar Nuclei at Low and High Redshift (?) Roderik Overzier Max-Planck-Institute for Astrophysics with: Tim Heckman (JHU) GALEX Science Team (PI: Chris Martin), Lee Armus,
Observing the Formation of Dense Stellar Nuclei at Low and High Redshift (?) Roderik Overzier Max-Planck-Institute for Astrophysics with: Tim Heckman (JHU) GALEX Science Team (PI: Chris Martin), Lee Armus,
Galaxies. The majority of known galaxies fall into one of three major classes: spirals (78 %), ellipticals (18 %) and irregulars (4 %).
, ellipticals (18 %) and irregulars (4 %).") Galaxies Collection of stars, gas and dust bound together by their common gravitational pull. Galaxies range from 10,000 to 200,000 light-years in size. 1781 Charles Messier 1923 Edwin Hubble The distribution
Galaxies Collection of stars, gas and dust bound together by their common gravitational pull. Galaxies range from 10,000 to 200,000 light-years in size. 1781 Charles Messier 1923 Edwin Hubble The distribution
UNIVERSITY OF SOUTHAMPTON
 UNIVERSITY OF SOUTHAMPTON PHYS2013W1 SEMESTER 1 EXAMINATION 2012/13 GALAXIES Duration: 120 MINS Answer all questions in Section A and two and only two questions in Section B. Section A carries 1/3 of the
2. Can observe radio waves from the nucleus see a strong radio source there Sagittarius A* or Sgr A*.
 7/7 The Nucleus of the MW its center 1. Can t see the nucleus in visible light too much stuff in the way. 2. Can observe radio waves from the nucleus see a strong radio source there Sagittarius A* or Sgr
View of the Galaxy from within. Lecture 12: Galaxies. Comparison to an external disk galaxy. Where do we lie in our Galaxy?
 Lecture 12: Galaxies View of the Galaxy from within The Milky Way galaxy Rotation curves and dark matter External galaxies and the Hubble classification scheme Plotting the sky brightness in galactic coordinates,
A. Thermal radiation from a massive star cluster. B. Emission lines from hot gas C. 21 cm from hydrogen D. Synchrotron radiation from a black hole
 ASTR 1040 Accel Astro: Stars & Galaxies Prof. Juri Toomre TA: Nicholas Nelson Lecture 26 Thur 14 Apr 2011 zeus.colorado.edu/astr1040-toomre toomre HST Abell 2218 Reading clicker what makes the light? What
3 The lives of galaxies
 Discovering Astronomy : Galaxies and Cosmology 24 3 The lives of galaxies In this section, we look at how galaxies formed and evolved, and likewise how the large scale pattern of galaxies formed. But before
Thus Far. Intro / Some Definitions Hubble Classification Components of Galaxies. Specific Galaxy Types Star Formation Clusters of Galaxies
 Thus Far Intro / Some Definitions Hubble Classification Components of Galaxies Stars Gas Dust Black Holes Dark Matter Specific Galaxy Types Star Formation Clusters of Galaxies Components of Galaxies:
A PRELIMINARY CLASSIFICATION SCHEME FOR THE CENTRAL REGIONS OF LATE-TYPE GALAXIES
 A PRELIMINARY CLASSIFICATION SCHEME FOR THE CENTRAL REGIONS OF LATE-TYPE GALAXIES SIDNEY VAN DEN BERGH* Dominion Astrophysical Observatory, National Research Council 5071 West Saanich Road, Victoria, B.C.,
STRUCTURE OF GALAXIES
 STRUCTURE OF GALAXIES 2., classification, surface photometry Piet van der Kruit Kapteyn Astronomical Institute University of Groningen the Netherlands February 2010, classification, surface photometry
Active Galactic Nuclei - Zoology
 Active Galactic Nuclei - Zoology Normal galaxy Radio galaxy Seyfert galaxy Quasar Blazar Example Milky Way M87, Cygnus A NGC 4151 3C273 BL Lac, 3C279 Galaxy Type spiral elliptical, lenticular spiral irregular
arxiv: v1 [astro-ph.ga] 10 Nov 2014
![arxiv: v1 [astro-ph.ga] 10 Nov 2014](/thumbs/86/93681647.jpg "arxiv: v1 [astro-ph.ga] 10 Nov 2014") DRAFT VERSION NOVEMBER 12, 2014 Preprint typeset using LATEX style emulateapj v. 08/13/06 THE AGN BLACK HOLE MASS DATABASE MISTY C. BENTZ 1, SARAH KATZ 2,3 (Received; Accepted) Draft version November 12,
DRAFT VERSION NOVEMBER 12, 2014 Preprint typeset using LATEX style emulateapj v. 08/13/06 THE AGN BLACK HOLE MASS DATABASE MISTY C. BENTZ 1, SARAH KATZ 2,3 (Received; Accepted) Draft version November 12,
Probing the Origin of Supermassive Black Hole Seeds with Nearby Dwarf Galaxies. Amy Reines Einstein Fellow NRAO Charlottesville
 Probing the Origin of Supermassive Black Hole Seeds with Nearby Dwarf Galaxies Amy Reines Einstein Fellow NRAO Charlottesville Motivation: The origin of supermassive BH seeds Motivation: The origin of
29:50 Stars, Galaxies, and the Universe Final Exam December 13, 2010 Form A
 29:50 Stars, Galaxies, and the Universe Final Exam December 13, 2010 Form A There are 40 questions. Read each question and all of the choices before choosing. Budget your time. No whining. Walk with Ursus!
ACS CCDs UV and narrowband filters red leak check
 Instrument Science Report ACS 2007-03 ACS CCDs UV and narrowband filters red leak check Marco Chiaberge and Marco Sirianni May 01, 2007 ABSTRACT We present results of the observations of the star 15 Mon,
Extragalactic Sub-Committee, Keck NGAO
 Extragalactic Sub-Committee, Keck NGAO Claire Max, Tommaso Treu, Aaron Barth, David Koo, Chuck Steidel, Richard Ellis, Rich Dekaney CfAO Workshop on Keck NGAO March 30-31, 2006 We are focusing on four
CIRCUMNUCLEAR GAS IN SEYFERT 1 GALAXIES: MORPHOLOGY, KINEMATICS, AND DIRECT MEASUREMENT OF BLACK HOLE MASSES
 Accepted by ApJ Preprint typeset using L A TEX style emulateapj v. 03/07/07 CIRCUMNUCLEAR GAS IN SEYFERT 1 GALAXIES: MORPHOLOGY, KINEMATICS, AND DIRECT MEASUREMENT OF BLACK HOLE MASSES Erin K. S. Hicks
BROCK UNIVERSITY. Test 2, March 2015 Number of pages: 9 Course: ASTR 1P02 Number of Students: 420 Date of Examination: March 5, 2015
 BROCK UNIVERSITY Page 1 of 9 Test 2, March 2015 Number of pages: 9 Course: ASTR 1P02 Number of Students: 420 Date of Examination: March 5, 2015 Number of hours: 50 min Time of Examination: 18:00 18:50
Galaxy Collisions & the Origin of Starburst Galaxies & Quasars. February 24, 2003 Hayden Planetarium
 Galaxy Collisions & the Origin of Starburst Galaxies & Quasars February 24, 2003 Hayden Planetarium Normal massive galaxy types elliptical & spiral galaxies Spiral Bulge of old stars Large black hole Very