Quantitative Reliability Analysis
|
|
|
- Sheena Sherman
- 5 years ago
- Views:
Transcription
1 Quantitative Reliability Analysis Moosung Jae May 4, 2015
2 System Reliability Analysis System reliability analysis is conducted in terms of probabilities The probabilities of events can be modelled as logical combinations or logical outcomes of other random events Graphical methods include Failure Modes and Effects Analysis (FMEA) Reliability Block Diagrams (RBD) Master Logic Diagrams etc Two main methods used include: Fault tree analysis Event tree analysis
3 Failure Modes and Effects Analysis Failure modes and effects analysis (FMEA) is a qualitative technique for understanding the behaviour of components in an engineered systems The objective is to determine the influence of component failure on other components, and on the system as a whole It is often used as a preliminary system reliability analysis to assist the development of a more quantitative event tree/fault tree analysis FMEA can also be used as a stand-alone procedure for relative ranking of failure modes that screens them according to risk i.e., as a screening tool
4 FMEA (cont d) As a risk evaluation technique, FMEA treats risk in it true sense as the combination of likelihood and consequences However, strictly speaking, it is not a probabilistic method because it does not generally use quantified probability statements Rather, failure mode occurrences are described using qualitative statements of likelihood (e.g., rare vs. frequent etc.) Consequences are also ranked qualitatively using levels or categories e.g., ranging from safe to catastrophic FMEA uses a rank-ordered scale of likelihood with respect to failure mode occurrence, so that together with the consequence categories, a rank-ordered level of relative risk can be derived for each failure mode
5 FMEA (cont d) FMEA consists of sequentially tabulating each component with all associated possible failure modes impacts on other components and the system consequence ranking failure likelihood detection methods compensating provisions Failure modes effect and criticality analysis (FMECA) is similar to FMEA except that the criticality of failure is analyzed in greater detail


 for the")
6 Example Example: Consider the following water heater system used in a residential home. The objective is to conduct a failure modes and effects analysis (FMEA) for the system.
7 Solution (cont d) Define consequence categories as I. Safe no effect on system II. Marginal failure will degrade system to some extent but will not cause major system damage or injury to personnel III. Critical failure will degrade system performance and/or cause personnel injury, and if immediate action is not taken, serious injuries or deaths to personnel and/or loss of system will occur IV. Catastrophic failure will produce severe system degradation causing loss of system and/or multiple deaths or injuries The FMEA is shown in the following table
8 Component Pressure relief valve Failure Effects on Solution Mode other Jammed open Jammed closed components Increased gas flow and thermostat operation Effects on whole system Loss of hot water, more cold water input and gas Consequence Category I - Safe Failure Likelihood Reasonably probable Detection Method Observe at pressure relief valve None None I - Safe Probable Manual testing Compensating Provisions Shut off water supply, reseal or replace relief valve No conseq. unless combined with other failure modes Gas valve Jammed open Burner continues to operate, pressure relief valve opens Water temp. and pressure increase; water turns to steam III - Critical Reasonably probable Water at faucet too hot; pressure relief valve open (obs.) Open hot water faucet to relieve pres., shut off gas; pressure relief valve compensates Jammed closed Burner ceases to operate System fails to produce hot water I - Safe Remote Observe at faucet (cold water) Thermostat Fails to react to Fundamentals of Reliability temp. operate, M. Pandey, University of Waterloo rise Burner continues to pressure relief valve opens Water temp. rises; water turns to steam III - Critical Remote Water at faucet too hot Open hot water faucet to relieve pressure; pressure relief valve compensates Fails to react to temp. drop Burner fails to function Water temperature too low I - Safe Remote Observe at faucet (cold water)
9 Reliability Block Diagrams Most systems are defined through a combination of both series and parallel connections of subsystems Reliability block diagrams (RBD) represent a system using interconnected blocks arranged in combinations of series and/or parallel configurations They can be used to analyze the reliability of a system quantitatively Reliability block diagrams can consider active and stand-by states to get estimates of reliability, and availability (or unavailability) of the system Reliability block diagrams may be difficult to construct for very complex systems Fundamentals of Reliability M. Pandey, University of Waterloo
10 Series Systems Series systems are also referred to as weakest link or chain systems System failure is caused by the failure of any one component Consider two components in series 1 2 Failure is defined as the union of the individual component failures For small failure probabilities where Q denotes the probability of failure


11 Series Systems (cont d) For n components in series, the probability of failure is then Therefore, for a series system, the system probability of failure is the sum of the individual component probabilities In case the component probabilities are not small, the system probability of failure can be expressed as For n components in series
12 Series Systems (cont d) Reliability is the complement of the probability of failure For the two components in series, the system reliability can be expressed as Assuming independence For n components in series Therefore, for a series system, the reliability of the system is the product of the individual component reliabilities
13 Parallel Systems Parallel systems are also referred to as redundant The system fails only if all of the components fail Consider two components in parallel 1 2 Failure is defined by the intersection of the individual (component) failure events Assuming independence
14 Parallel Systems For n components in parallel, the probability of failure is then Therefore, for a parallel system, the system probability of failure is the product of the individual component probabilities The reliability of the parallel system is For n components in parallel, the system reliability is
15 Example Problem Example: Compute the reliability and probability of failure for the following system. Assume the failure probabilities for the components are Q 1 = 0.01, Q 2 = 0.02 and Q 3 = Solution: First combine the parallel components 2 and 3 The probability of failure is The reliability is
16 Solution (cont d) Next, combine component 1 and the sub-system (2,3) in series The probability of failure for the system is then The system reliability is
17 Solution (cont d) The system probability of failure is equal to The system reliability is which is also equal to R SYS = 1 Q SYS As shown in this example, the system probability of failure and reliability are dominated by the series component 1 i.e. a series system is as good as its weakest link
18 Things to Consider Reliability block diagrams can also be used to assess Voting systems (k-out-of-n logic) Standby systems (load sharing or sequential operation) Simple systems can be assessed by gradually reducing them to equivalent series/parallel configurations More complex systems would require the use of a more comprehensive approach, such as conditional probabilities or imaginary components For complex systems, great effort is needed to identify the ways in which the system fails or survives Fault trees can be used to decompose the main failure event into unions and intersections of sub-events Event trees can be used to identify the possible sequence of events (also failures)
19 Series systems Examples A series system is one which operates if and only if all of its components operate. The equivalent circuit diagram is Let R i = P(component i works) and R sys = P(system works) Then, if the components operate independently, P( system operates) P(1 works 2 works n works) P(1 works) P(2 works) P( n works) R R R R sys 1 2 n
 i i unreliability of component i P( system fails) P(1 fails n fails) P(1 fails) P( n fails) Q Q Q Q sys 1 2")
20 Parallel systems A parallel system is one which operates if and only if any of its components operate. Q 1 R P( component i fails) i i unreliability of component i P( system fails) P(1 fails n fails) P(1 fails) P( n fails) Q Q Q Q sys 1 2 n 1 R (1 R )(1 R ) (1 R ) sys 1 2 n
21 Series/parallel systems Example Find the reliability of the system shown below, if all components have reliability 0.8. Solution. The system can be broken down into subsystems that are series or parallel.
22 Decomposition Q 1 Q Q 1 C D R R R R R 2 A B Q sys 2 E ( ) R sys Q Q 0.923
23 Conditional probability method Some complex systems cannot be broken down into series and parallel subsystems. There are several reliability analysis methods such as conditional probability, and cut sets and fault trees. Example. Find the reliability of the complex system shown below, if all components have reliability 0.8. This keystone component is chosen carefully. In this case we choose component E. Using the law of total probability gives P( system works) P( E works) P( system works E works) P( E fails) P( system works E fails) R R R Q R sys E sys E E sys E
24 Conditional probability method R sys E 2 QAB QAQB QCD R R R sys E AB CD R sys E R R R R R 2 AC A C B D Q Q Q R sys E sys E AC BD (1 0.64) R R R Q R sys E sys E E sys E
25 Cut set method Find the reliability of the complex system shown below, if all components have reliability 0.8. A cut set is a subset of the components with the property that if all components in set fail, then the system fails. For example, {A, B, E} is a cut set in the system above. Definition. A minimal cut set is a cut set for which no subset is a cut set. For example, in the system above, {A, B, E} is not a minimal cut set, but {A, B} is a minimal cut set. The list of all minimal cut sets for the system above is Define C 1 to be the event all components in cut set C 1 fail, etc. Then,,,,,,,,, C A B C C D C A D E C B C E P( system fails) Q P( C C C C ) sys
26 Standby systems One example of a standby system is of the power supply to a hospital. The primary supply is from the electricity grid. The backup might be a diesel generator. A standby system differs from a parallel system in two ways: the backup component is not in use while the primary component is operational (and therefore is not susceptible to failure) there is a switching mechanism, which detects failure of the primary component and activates the backup component. This switching mechanism may fail to operate (e.g., the diesel generator may fail to start). There may be more than one backup component, as shown below.
27 To Calculate the reliability function of a standby system in which, the primary component has a constant hazard rate of 0.01 per hour, while the backup component has hazard rate 0.02 per hour 1 and 2 We show the general tcase, with failure rates R ( t) R ( t) f ( s) R ( t s) ds sys s0 1t 1t 2 ( ts) e e e ds s0 1t 2t ( 2 1 ) s e e e ds Note that we need to distinguish here between two cases. If up with the result of the Example. Here we consider only the case t 1 ( 21) s 1t 2t e Rsys () t e 1e 2 1 s0 which, after some manipulation, ( 21) t 1 1t 2te e 1e t s0 1 2 t then we will end, which gives e t e t
28 Example of Standby systems The primary component has a constant hazard rate of 0.01 per hour, while the backup component has hazard rate 0.02 per hour. Compare the mean times to failure if these components are operated (a) in parallel, (b) in standby mode. (a) For the parallel system, (b) For the standby system, we have E T sys hr Thus the standby system gives the longer MTTF. This agrees with common sense, since in the standby system the standby component begins its life later. Suppose that the primary and backup components both have hazard rate 0.01 per hour. Compare reliability functions if these components are operated (a) in parallel, (b) in standby mode E T sys ET1 ET2 150hr R t e e e e R ( t) P( T 1) P(2 nd failure occurs after time t) t t t 2t sys ( ) 1 (1 )(1 ) sys sys P N 0.1 ( 1) 1.1e 0.995
29 Review on Reliability and Failure Rate
30 ET and FT IE Sys-A Sys-B Result 10-1 /yr Success Failure Success OK OK Failure CD CDF=1.1X10⁻⁷ /yr Sys-A Failure 10-4 /yr Sys-B Failure 1.1x10⁻² /yr Pump-1 Failure Pump-2 Failure 10-2 /yr 10-2 /yr Pump-1 Failure Pump-2 Failure 10-2 /yr 10-3 /yr
31 Emergency Diesel Generators The probability that a device will perform successfully for the period of time intended under the operating conditions. Emergency Electric Power System ( 비상전력계통 ) E1 E2 30KVA 30KVA 30KVA G1 G2 G3 At least 60KVA
32 An Example Emergency Electric Power System ( 비상전력계통 ) E1 E2 30KVA 30KVA 30KVA G1 G2 G3 At least 60KVA 기본사건 (Basic Event) E1 E2 G1 G2 G3 기기고장률 (Demand Failure) 3.18E E E E E-06
33 FT in KIRAP 최소단절집합 (Minimal Cut Set) 총 8 가지 {G1,G2} {G2,G3} {G1,G3} {E1,E2} {E1,G2} {E1,G3} {E2,G2} {E2,G1}
34 An Example Results KCUT Version 4.8a(20) Uncertainty Boolean Equation Reduction Program + Uncertainty Copyright Han, S.H. KAERI Fri Feb 06 18:00: > > LEVEL ( 0.000e+000 ). Reporting for FAIL value = 1.053e-005 Final Cut Sets 시스템이용불능도 no value f-v acc cut sets e E1 E e E1 G e E1 G e G1 E e G2 E e G1 G e G1 G e G2 G3 Execution time 0 seconds (gen:0, exp:0, abs:0), Return Code = 1 End of CUT Run
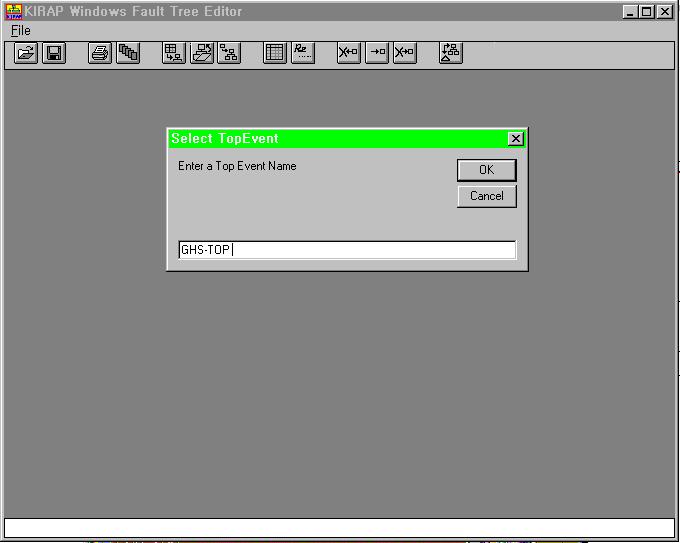
35 KIRAP 의실행초기화면
36 KIRAP 의실행
37 KIRAP Menu
38 KIRAP 메뉴설명 이름의미 Name Type Description 현재사건의이름을입력현재사건의형태를입력현재사건에대한자세한설명 Mean, Cal. Type, Lambda, Tau EF Dist. Type Transfer Module Remark Mean 은현재사건에대한신뢰도값을의미하며, 사용자가직접입력하는것이아니라 Lambda, Tau 값들의계산을통해얻어짐 각사건에대해주어진 Mean 값의오차인자 사건에주어진신뢰도값에대한확률분포를정해줌 현재사건은전이게이트 (Transfer gate) 로만듬 현재사건을전이게이트에서해제 현재사건에대한비고나특기사항들을기록

39 KIRAP 메뉴설명 Cal. Type Lambda (λ) Tau (τ) Mean 의계산 의 미 0 Demand Failure Prob. - Mean = λ : 고장확률을바로줄경우사용. 대부분의 demand failure 가이에해당. 1 Running Failure Rate Mission Time Mean = λx τ : 사고후주어진시간동안운전하지못하는확률을표현 2 Running Failure Rate Repair Time Mean = λx τ : 항상기기를감시하다가고장이나면바로수리하는경우에이용불능도를표현 3 Standby Failure Rate Test Interval Mean = λx τ/2 : 대기상태에있으면서정기적으로점검하는기기의이용불능도를표현. 4 Failure Rate - Mean = λ : 고장율을단위로가진 Event 에사용.

40 KIRAP 메뉴설명


41 KIRAP 메뉴설명 Tree Display Option


42 KIRAP 메뉴설명 계산수행 - 이용불능도계산 - 최소단절군 (MCS) 및중요도계산 etc
Chapter 5. System Reliability and Reliability Prediction.
 Chapter 5. System Reliability and Reliability Prediction. Problems & Solutions. Problem 1. Estimate the individual part failure rate given a base failure rate of 0.0333 failure/hour, a quality factor of
RISK-INFORMED OPERATIONAL DECISION MANAGEMENT (RIODM): RISK, EVENT TREES AND FAULT TREES
: RISK, EVENT TREES AND FAULT TREES") 22.38 PROBABILITY AND ITS APPLICATIONS TO RELIABILITY, QUALITY CONTROL AND RISK ASSESSMENT Fall 2005, Lecture 1 RISK-INFORMED OPERATIONAL DECISION MANAGEMENT (RIODM): RISK, EVENT TREES AND FAULT TREES
22.38 PROBABILITY AND ITS APPLICATIONS TO RELIABILITY, QUALITY CONTROL AND RISK ASSESSMENT Fall 2005, Lecture 1 RISK-INFORMED OPERATIONAL DECISION MANAGEMENT (RIODM): RISK, EVENT TREES AND FAULT TREES
Engineering Risk Benefit Analysis
 Engineering Risk Benefit Analysis 1.155, 2.943, 3.577, 6.938, 10.816, 13.621, 16.862, 22.82, ESD.72, ESD.721 RPRA 3. Probability Distributions in RPRA George E. Apostolakis Massachusetts Institute of Technology
Reliable Computing I
 Instructor: Mehdi Tahoori Reliable Computing I Lecture 5: Reliability Evaluation INSTITUTE OF COMPUTER ENGINEERING (ITEC) CHAIR FOR DEPENDABLE NANO COMPUTING (CDNC) National Research Center of the Helmholtz
Chapter 6. a. Open Circuit. Only if both resistors fail open-circuit, i.e. they are in parallel.
 Chapter 6 1. a. Section 6.1. b. Section 6.3, see also Section 6.2. c. Predictions based on most published sources of reliability data tend to underestimate the reliability that is achievable, given that
Safety analysis and standards Analyse de sécurité et normes Sicherheitsanalyse und Normen
 Industrial Automation Automation Industrielle Industrielle Automation 9.6 Safety analysis and standards Analyse de sécurité et normes Sicherheitsanalyse und Normen Prof Dr. Hubert Kirrmann & Dr. B. Eschermann
B.H. Far
 SENG 637 Dependability, Reliability & Testing of Software Systems Chapter 3: System Reliability Department of Electrical & Computer Engineering, University of Calgary B.H. Far (far@ucalgary.ca) http://www.enel.ucalgary.ca/people/far/lectures/seng637/
Chapter 18 Section 8.5 Fault Trees Analysis (FTA) Don t get caught out on a limb of your fault tree.
 Don t get caught out on a limb of your fault tree.") Chapter 18 Section 8.5 Fault Trees Analysis (FTA) Don t get caught out on a limb of your fault tree. C. Ebeling, Intro to Reliability & Maintainability Engineering, 2 nd ed. Waveland Press, Inc. Copyright
Chapter 18 Section 8.5 Fault Trees Analysis (FTA) Don t get caught out on a limb of your fault tree. C. Ebeling, Intro to Reliability & Maintainability Engineering, 2 nd ed. Waveland Press, Inc. Copyright
Quantitative evaluation of Dependability
 Quantitative evaluation of Dependability 1 Quantitative evaluation of Dependability Faults are the cause of errors and failures. Does the arrival time of faults fit a probability distribution? If so, what
B.H. Far
 SENG 521 Software Reliability & Software Quality Chapter 8: System Reliability Department of Electrical & Computer Engineering, University of Calgary B.H. Far (far@ucalgary.ca) http://www.enel.ucalgary.ca/people/far/lectures/seng521
Terminology and Concepts
 Terminology and Concepts Prof. Naga Kandasamy 1 Goals of Fault Tolerance Dependability is an umbrella term encompassing the concepts of reliability, availability, performability, safety, and testability.
Module No. # 03 Lecture No. # 11 Probabilistic risk analysis
 Health, Safety and Environmental Management in Petroleum and offshore Engineering Prof. Dr. Srinivasan Chandrasekaran Department of Ocean Engineering Indian Institute of Technology, Madras Module No. #
Assessing system reliability through binary decision diagrams using bayesian techniques.
 Loughborough University Institutional Repository Assessing system reliability through binary decision diagrams using bayesian techniques. This item was submitted to Loughborough University's Institutional
Analysis methods for fault trees that contain secondary failures
 Loughborough University Institutional Repository Analysis methods for fault trees that contain secondary failures This item was submitted to Loughborough University's Institutional Repository by the/an
Safety and Reliability of Embedded Systems
 (Sicherheit und Zuverlässigkeit eingebetteter Systeme) Fault Tree Analysis Mathematical Background and Algorithms Prof. Dr. Liggesmeyer, 0 Content Definitions of Terms Introduction to Combinatorics General
Quiz #2 A Mighty Fine Review
 Quiz #2 A Mighty Fine Review February 27: A reliable adventure; a day like all days filled with those events that alter and change the course of history and you will be there! What is a Quiz #2? Three
Quantitative evaluation of Dependability
 Quantitative evaluation of Dependability 1 Quantitative evaluation of Dependability Faults are the cause of errors and failures. Does the arrival time of faults fit a probability distribution? If so, what
Reliability Engineering I
 Happiness is taking the reliability final exam. Reliability Engineering I ENM/MSC 565 Review for the Final Exam Vital Statistics What R&M concepts covered in the course When Monday April 29 from 4:30 6:00
Lecture 5 Probability
 Lecture 5 Probability Dr. V.G. Snell Nuclear Reactor Safety Course McMaster University vgs 1 Probability Basic Ideas P(A)/probability of event A 'lim n64 ( x n ) (1) (Axiom #1) 0 # P(A) #1 (1) (Axiom #2):
Modeling Common Cause Failures in Diverse Components with Fault Tree Applications
 Modeling Common Cause Failures in Diverse s with Fault Tree Applications Joseph R. Belland, Isograph Inc. Key Words: Common Cause Failures, Fault Trees, Beta Factor SUMMARY & CONCLUSIONS A common cause
12 - The Tie Set Method
 12 - The Tie Set Method Definitions: A tie set V is a set of components whose success results in system success, i.e. the presence of all components in any tie set connects the input to the output in the
Common Cause Failures: Extended Alpha Factor method and its Implementation
 Common Cause Failures: Extended Alpha Factor method and its Implementation Alexandra Sitdikova Reactor Engineering Division, Jožef Stefan Institute Jamova 39, SI-1000 Ljubljana, Slovenia Institute of Physics
Presentation of Common Cause Failures in Fault Tree Structure of Krško PSA: An Historical Overview
 International Conference Nuclear Energy for New Europe 2003 Portorož, Slovenia, September 8-11, 2003 http://www.drustvo-js.si/port2003 Presentation of Common Cause Failures in Fault Tree Structure of Krško
Overview of Control System Design
 Overview of Control System Design General Requirements 1. Safety. It is imperative that industrial plants operate safely so as to promote the well-being of people and equipment within the plant and in
Safety and Reliability of Embedded Systems. (Sicherheit und Zuverlässigkeit eingebetteter Systeme) Fault Tree Analysis Obscurities and Open Issues
 Fault Tree Analysis Obscurities and Open Issues") (Sicherheit und Zuverlässigkeit eingebetteter Systeme) Fault Tree Analysis Obscurities and Open Issues Content What are Events? Examples for Problematic Event Semantics Inhibit, Enabler / Conditioning
(Sicherheit und Zuverlässigkeit eingebetteter Systeme) Fault Tree Analysis Obscurities and Open Issues Content What are Events? Examples for Problematic Event Semantics Inhibit, Enabler / Conditioning
Cyber Physical Power Systems Power in Communications
 1 Cyber Physical Power Systems Power in Communications Information and Communications Tech. Power Supply 2 ICT systems represent a noticeable (about 5 % of total t demand d in U.S.) fast increasing load.
Failures in Process Industries
 Fault Tree Analysis Failures in Process Industries Single Component Failure Data for failure rates are compiled by industry Single component or single action Multiple Component Failure Failures resulting
Chapter 15. System Reliability Concepts and Methods. William Q. Meeker and Luis A. Escobar Iowa State University and Louisiana State University
 Chapter 15 System Reliability Concepts and Methods William Q. Meeker and Luis A. Escobar Iowa State University and Louisiana State University Copyright 1998-2008 W. Q. Meeker and L. A. Escobar. Based on
Signal Handling & Processing
 Signal Handling & Processing The output signal of the primary transducer may be too small to drive indicating, recording or control elements directly. Or it may be in a form which is not convenient for
EE 445 / 850: Final Examination
 EE 445 / 850: Final Examination Date and Time: 3 Dec 0, PM Room: HLTH B6 Exam Duration: 3 hours One formula sheet permitted. - Covers chapters - 5 problems each carrying 0 marks - Must show all calculations
of an algorithm for automated cause-consequence diagram construction.
 Loughborough University Institutional Repository Development of an algorithm for automated cause-consequence diagram construction. This item was submitted to Loughborough University's Institutional Repository
Practical Applications of Reliability Theory
 Practical Applications of Reliability Theory George Dodson Spallation Neutron Source Managed by UT-Battelle Topics Reliability Terms and Definitions Reliability Modeling as a tool for evaluating system
Fault Tolerance. Dealing with Faults
 Fault Tolerance Real-time computing systems must be fault-tolerant: they must be able to continue operating despite the failure of a limited subset of their hardware or software. They must also allow graceful
Application of the Cause-Consequence Diagram Method to Static Systems
 Application of the ause-onsequence Diagram Method to Static Systems L.M.Ridley and J.D.Andrews Department of Mathematical Sciences Loughborough University Loughborough Leicestershire LE11 3TU Keywords:
Reliability of Technical Systems
 Reliability of Technical Systems Main Topics 1. Short Introduction, Reliability Parameters: Failure Rate, Failure Probability, etc. 2. Some Important Reliability Distributions 3. Component Reliability
UNIVERSITY OF MASSACHUSETTS Dept. of Electrical & Computer Engineering. Fault Tolerant Computing ECE 655
 UNIVERSITY OF MASSACHUSETTS Dept. of Electrical & Computer Engineering Fault Tolerant Computing ECE 655 Part 1 Introduction C. M. Krishna Fall 2006 ECE655/Krishna Part.1.1 Prerequisites Basic courses in
Risk Analysis of Highly-integrated Systems
 Risk Analysis of Highly-integrated Systems RA II: Methods (FTA, ETA) Fault Tree Analysis (FTA) Problem description It is not possible to analyse complicated, highly-reliable or novel systems as black box
Reliability Analysis of Electronic Systems using Markov Models
 Reliability Analysis of Electronic Systems using Markov Models István Matijevics Polytechnical Engineering College, Subotica, Serbia and Montenegro, matistvan@yahoo.com Zoltán Jeges Polytechnical Engineering
System Reliability Analysis. CS6323 Networks and Systems
 System Reliability Analysis CS6323 Networks and Systems Topics Combinatorial Models for reliability Topology-based (structured) methods for Series Systems Parallel Systems Reliability analysis for arbitrary
Systems reliability for phased missions
 Loughborough University Institutional Repository Systems reliability for phased missions This item was submitted to Loughborough University's Institutional Repository by the/an author. Additional Information:
Nuclear reliability: system reliabilty
 Nuclear reliability: system reliabilty Dr. Richard E. Turner (ret26@cam.ac.uk) December 3, 203 Goal of these two lectures failures are inevitable: need methods for characterising and quantifying them LAST
Development of Multi-Unit Dependency Evaluation Model Using Markov Process and Monte Carlo Method
 Development of Multi-Unit Dependency Evaluation Model Using Markov Process and Monte Carlo Method Sunghyon Jang, and Akira Yamaguchi Department of Nuclear Engineering and Management, The University of
A New Reliability Allocation Method Based on FTA and AHP for Nuclear Power Plant!
 A New Reliability Allocation Method Based on FTA and AHP for Nuclear Power Plant! Presented by Rongxiang Hu Contributed by FDS Team Institute of Nuclear Energy Safety Technology (INEST) Chinese Academy
PROBABILISTIC AND POSSIBILISTIC FAULT TREE ANALYSIS
 PROBABILISTIC AD POSSIBILISTIC FAULT TREE AALYSIS M. Ragheb 12/28/2017 ITRODUCTIO In the design of nuclear power plants, it is important to analyze the probable and possible mechanisms of failure. Fault
Dynamic Programming Model Integer Programming Model
 Dynamic Programming Model Integer Programming Model D. L. Bricker Dept of Mechanical & Industrial Engineering The University of Iowa Optimal Redundancy 4/1/2002 page 1 of 26 One of the systems of a communication
Fault-Tolerant Computing
 Fault-Tolerant Computing Motivation, Background, and Tools Slide 1 About This Presentation This presentation has been prepared for the graduate course ECE 257A (Fault-Tolerant Computing) by Behrooz Parhami,
Combinational Techniques for Reliability Modeling
 Combinational Techniques for Reliability Modeling Prof. Naga Kandasamy, ECE Department Drexel University, Philadelphia, PA 19104. January 24, 2009 The following material is derived from these text books.
ELE 491 Senior Design Project Proposal
 ELE 491 Senior Design Project Proposal These slides are loosely based on the book Design for Electrical and Computer Engineers by Ford and Coulston. I have used the sources referenced in the book freely
Availability analysis of nuclear power plant system with the consideration of logical loop structures
 Availability analysis of nuclear power plant system with the consideration of logical loop structures MATSUOKA Takeshi 1, 2 1. Mechanical Systems Engineering, Department of Engineering, Utsunomiya University,
Basic Elements of System Reliability
 Chapter 2 Basic Elements of System Reliability It is difficult to get where you want to go if you don t know where that is. Abstract This chapter presents the basic principles and functional relationships
Evaluation and Validation
 Evaluation and Validation Peter Marwedel TU Dortmund, Informatik 12 Germany Graphics: Alexandra Nolte, Gesine Marwedel, 2003 2011 06 18 These slides use Microsoft clip arts. Microsoft copyright restrictions
9. Reliability theory
 Material based on original slides by Tuomas Tirronen ELEC-C720 Modeling and analysis of communication networks Contents Introduction Structural system models Reliability of structures of independent repairable
Causal & Frequency Analysis
 Causal & Frequency Analysis Arshad Ahmad arshad@utm.my Fishbone Diagram 2 The Cause and Effect (CE) Diagram (Ishikawa Fishbone) Created in 1943 by Professor Kaoru Ishikawa of Tokyo University Used to investigate
Tradeoff between Reliability and Power Management
 Tradeoff between Reliability and Power Management 9/1/2005 FORGE Lee, Kyoungwoo Contents 1. Overview of relationship between reliability and power management 2. Dakai Zhu, Rami Melhem and Daniel Moss e,
Frontiers of Risk and Reliability Engineering Research
 Frontiers of Risk and Reliability Engineering Research Mohammad Modarres Department of Mechanical Engineering Kececioglu Lecture April 14, 2016 Department of Aerospace and Mechanical Engineering University
Evaluating the Core Damage Frequency of a TRIGA Research Reactor Using Risk Assessment Tool Software
 Evaluating the Core Damage Frequency of a TRIGA Research Reactor Using Risk Assessment Tool Software M. Nematollahi and Sh. Kamyab Abstract After all preventive and mitigative measures considered in the
Basic notions of probability theory
 Basic notions of probability theory Contents o Boolean Logic o Definitions of probability o Probability laws Objectives of This Lecture What do we intend for probability in the context of RAM and risk
Engineering Risk Benefit Analysis
 Engineering Risk enefit nalysis.55, 2.943, 3.577, 6.938, 0.86, 3.62, 6.862, 22.82 ESD.72J, ESD.72 RPR. The Logic of ertainty George E. postolakis Massachusetts Institute of Technology Spring 2007 RPR.
Common Cause Failure (CCF)
") Common Cause Failure (CCF) 건국대학교컴퓨터공학과 UC Lab. 정혁준 & 박경식 amitajung@naver.com, kyeongsik@konkuk.ac.kr Contents Common Cause Failure (CCF) Types of CCF Examples Reducing CCF Common Cause Failure (CCF) Definition
Common Cause Failure (CCF) 건국대학교컴퓨터공학과 UC Lab. 정혁준 & 박경식 amitajung@naver.com, kyeongsik@konkuk.ac.kr Contents Common Cause Failure (CCF) Types of CCF Examples Reducing CCF Common Cause Failure (CCF) Definition
Basics of Uncertainty Analysis
 Basics of Uncertainty Analysis Chapter Six Basics of Uncertainty Analysis 6.1 Introduction As shown in Fig. 6.1, analysis models are used to predict the performances or behaviors of a product under design.
PASS Sample Size Software. Poisson Regression
 Chapter 870 Introduction Poisson regression is used when the dependent variable is a count. Following the results of Signorini (99), this procedure calculates power and sample size for testing the hypothesis
Experiment for Justification the Reliability of Passive Safety System in NPP
 XIII International Youth Scientific and Practical Conference FUTURE OF ATOMIC ENERGY - AtomFuture 2017 Volume 2017 Conference Paper Experiment for Justification the Reliability of Passive Safety System
A new FMECA model for reliability computations in electrical distribution systems
 Proceedings of the 6th WSEAS/IASME Int. Conf. on Electric Power Systems, High Voltages, Electric Machines, Tenerife, Spain, December 6-8, 2006 A new FMECA model for reliability computations in electrical
Reliability of Safety-Critical Systems 5.1 Reliability Quantification with RBDs
 Reliability of Safety-Critical Systems 5.1 Reliability Quantification with RBDs Mary Ann Lundteigen and Marvin Rausand mary.a.lundteigen@ntnu.no &marvin.rausand@ntnu.no RAMS Group Department of Production
Reliability of Technical Systems
 Reliability of Technical Systems Main Topics. Short Introduction, Reliability Parameters: Failure Rate, Failure Probability, etc. 2. Some Important Reliability Distributions 3. Component Reliability 4.
Non-observable failure progression
 Non-observable failure progression 1 Age based maintenance policies We consider a situation where we are not able to observe failure progression, or where it is impractical to observe failure progression:
NUCLEAR SAFETY AND RELIABILITY WEEK 3
 Nuclear Safety and Reliability Dan Meneley Page 1 of 10 NUCLEAR SAFETY AND RELIABILITY WEEK 3 TABLE OF CONTENTS - WEEK 1 1. Introduction to Risk Analysis...1 Conditional Probability Matrices for Each Step
Introduction to Engineering Reliability
 Introduction to Engineering Reliability Robert C. Patev North Atlantic Division Regional Technical Specialist (978) 318-8394 Topics Reliability Basic Principles of Reliability Analysis Non-Probabilistic
Fundamentals of Reliability Engineering and Applications
 Fundamentals of Reliability Engineering and Applications E. A. Elsayed elsayed@rci.rutgers.edu Rutgers University Quality Control & Reliability Engineering (QCRE) IIE February 21, 2012 1 Outline Part 1.
Mixed Criticality in Safety-Critical Systems. LS 12, TU Dortmund
 Mixed Criticality in Safety-Critical Systems Prof. Dr. Jian-Jia Chen LS 12, TU Dortmund 18, July, 2016 Prof. Dr. Jian-Jia Chen (LS 12, TU Dortmund) 1 / 25 Motivation today s embedded systems use complex
Field data reliability analysis of highly reliable item
 Field data reliability analysis of highly reliable item David Vališ & Zdeněk Vintr Faculty of Military Technologies University of Defence 612 00 Brno Czech Republic david.valis@unob.cz Miroslav Koucký
Basic notions of probability theory
 Basic notions of probability theory Contents o Boolean Logic o Definitions of probability o Probability laws Why a Lecture on Probability? Lecture 1, Slide 22: Basic Definitions Definitions: experiment,
6.1 Dependability Modeling. General Rules. Analysis
 Dependable Systems Winter term 2018/2019 Dependable Systems 6 th Chapter Quantitative Analysis - Structural Models Christine Jakobs Professur Betriebssysteme Dependability is an umbrella term for a set
Dependable Systems. ! Dependability Attributes. Dr. Peter Tröger. Sources:
 Dependable Systems! Dependability Attributes Dr. Peter Tröger! Sources:! J.C. Laprie. Dependability: Basic Concepts and Terminology Eusgeld, Irene et al.: Dependability Metrics. 4909. Springer Publishing,
Learning Objectives:
 Learning Objectives: t the end of this topic you will be able to; draw a block diagram showing how -type flip-flops can be connected to form a synchronous counter to meet a given specification; explain
Chapter 8. Calculation of PFD using Markov
 Chapter 8. Calculation of PFD using Markov Mary Ann Lundteigen Marvin Rausand RAMS Group Department of Mechanical and Industrial Engineering NTNU (Version 0.1) Lundteigen& Rausand Chapter 8.Calculation
System Reliability Modeling Considering Correlated Probabilistic Competing Failures
 IEEE TRANSACTIONS ON RELIABILITY 1 System Reliability Modeling Considering Correlated Probabilistic Competing Failures Yujie Wang, Liudong Xing, Senior Member, IEEE, Honggang Wang, Senior Member, IEEE,
Chapter 2 Fault Modeling
 Chapter 2 Fault Modeling Jin-Fu Li Advanced Reliable Systems (ARES) Lab. Department of Electrical Engineering National Central University Jungli, Taiwan Outline Why Model Faults? Fault Models (Faults)
Time Dependent Analysis with Common Cause Failure Events in RiskSpectrum
 Time Dependent Analysis with Common Cause Failure Events in RiskSpectrum Pavel Krcal a,b and Ola Bäckström a a Lloyd's Register Consulting, Stockholm, Sweden b Uppsala University, Uppsala, Sweden Abstract:
Chapter 9 Part II Maintainability
 Chapter 9 Part II Maintainability 9.4 System Repair Time 9.5 Reliability Under Preventive Maintenance 9.6 State-Dependent Systems with Repair C. Ebeling, Intro to Reliability & Maintainability Chapter
Reliability, Redundancy, and Resiliency
 Lecture #11 October 3, 2017 Review of probability theory Component reliability Confidence Redundancy Reliability diagrams Intercorrelated Failures System resiliency Resiliency in fixed fleets 1 2017 David
Power System Security. S. Chakrabarti
 Power System Security S. Chakrabarti Outline Introduction Major components of security assessment On-line security assessment Tools for contingency analysis DC power flow Linear sensitivity factors Line
Lecture 5 Fault Modeling
 Lecture 5 Fault Modeling Why model faults? Some real defects in VLSI and PCB Common fault models Stuck-at faults Single stuck-at faults Fault equivalence Fault dominance and checkpoint theorem Classes
Constant speed drive time between overhaul extension: a case study from Italian Air Force Fleet.
 Constant speed drive time between overhaul extension: a case study from Italian Air Force Fleet. Capt. M. Amura¹, Capt. F. De Trane², Maj. L. Aiello¹ Italian Air Force Centro Sperimentale Volo - Airport
Dependable Computer Systems
 Dependable Computer Systems Part 3: Fault-Tolerance and Modelling Contents Reliability: Basic Mathematical Model Example Failure Rate Functions Probabilistic Structural-Based Modeling: Part 1 Maintenance
Chapter 1 (Basic Probability)
") Chapter 1 (Basic Probability) What is probability? Consider the following experiments: 1. Count the number of arrival requests to a web server in a day. 2. Determine the execution time of a program. 3.
Chapter 1 (Basic Probability) What is probability? Consider the following experiments: 1. Count the number of arrival requests to a web server in a day. 2. Determine the execution time of a program. 3.
Reliability of sequential systems using the causeconsequence diagram method
 Loughborough University Institutional Repository Reliability of sequential systems using the causeconsequence diagram method This item was submitted to Loughborough University's Institutional Repository
Mean fault time for estimation of average probability of failure on demand.
 Mean fault time for estimation of average probability of failure on demand. Isshi KOYATA a *, Koichi SUYAMA b, and Yoshinobu SATO c a The University of Marine Science and Technology Doctoral Course, Course
On Qualitative Analysis of Fault Trees Using Structurally Persistent Nets
 On Qualitative Analysis of Fault Trees Using Structurally Persistent Nets Ricardo J. Rodríguez rj.rodriguez@unileon.es Research Institute of Applied Sciences in Cybersecurity University of León, Spain
Risk and Safety in Civil, Surveying and Environmental Engineering
 Risk and Safety in Civil, Surveying and Environmental Engineering Prof. Dr. Michael Havbro Faber ETH Zurich, Switzerland Contents of Today's Lecture Introduction to structural systems reliability General
Time-varying failure rate for system reliability analysis in large-scale railway risk assessment simulation
 Time-varying failure rate for system reliability analysis in large-scale railway risk assessment simulation H. Zhang, E. Cutright & T. Giras Center of Rail Safety-Critical Excellence, University of Virginia,
Risk Matrix vs Risk Matrix Reloaded
 Risk Matrix vs Risk Matrix Reloaded B. McLaughlin, ScD, MInstP Regional Managing Director ReliabilitySolutions@charter.net www.lifetime reliability.com 864.430.2695 Classical Risk Matrix The classical
Reliability and Risk Analysis in Naval Architecture and Ocean Engineering
 Reliability and Risk Analysis in Naval Architecture and Ocean Engineering USP Escola Politécnica EPUSP Naval Architecture and Ocean Engineering Department Prof. Marcelo Ramos Martins (mrmartin@usp.br)
SUPPLEMENT TO CHAPTER
 SUPPLEMENT TO CHAPTER 4 Reliability SUPPLEMENT OUTLINE Introduction, 2 Finding Probability of Functioning When Activated, 2 Finding Probability of Functioning for a Given Length of Time, 4 Key Terms, 10
B1-1. Closed-loop control. Chapter 1. Fundamentals of closed-loop control technology. Festo Didactic Process Control System
 B1-1 Chapter 1 Fundamentals of closed-loop control technology B1-2 This chapter outlines the differences between closed-loop and openloop control and gives an introduction to closed-loop control technology.
Fuzzy reliability analysis of washing unit in a paper plant using soft-computing based hybridized techniques
 Fuzzy reliability analysis of washing unit in a paper plant using soft-computing based hybridized techniques *Department of Mathematics University of Petroleum & Energy Studies (UPES) Dehradun-248007,
MFE634. Reliability Analysis. Group 5. Xiangyu Luo Ameya Palekar Krutin Parashuram Patil Chao Sa
 MFE634 Reliability Analysis Group 5 Xiangyu Luo Ameya Palekar Krutin Parashuram Patil Chao Sa Contents. Generate Data and Verify.... Calculate and Analyze the Data.... Complete Sample...... 95% Confidence
The Applications of Inductive Method in the Construction of Fault Trees MENG Qinghe 1,a, SUN Qin 2,b
 The Applications of Inductive Method in the Construction of Fault Trees MENG Qinghe 1,a, SUN Qin 2,b 1 School of Aeronautics, Northwestern Polytechnical University, Xi an 710072, China 2 School of Aeronautics,
12 Moderator And Moderator System
 12 Moderator And Moderator System 12.1 Introduction Nuclear fuel produces heat by fission. In the fission process, fissile atoms split after absorbing slow neutrons. This releases fast neutrons and generates
Chapter 4 Availability Analysis by Simulation and Markov Chain
 Chapter 4 Availability Analysis by Simulation and Markov Chain Chapter 4 Availability Analysis by Simulation and Markov Chain 4.1 Introduction: For a perfect design, an engineering systems, component and