NACA AERODYNAMIC HEATING OF A WING AS DETERMINED. By Andrew G. Swanson and Charles B. Rumsey. Langley Aeronautical Laboratory Langley Field, Va.
|
|
|
- Denis Eaton
- 5 years ago
- Views:
Transcription
1 RM L56Flla NACA a RESEARCH MEMORANDUM AERODYNAMIC HEATING OF A WING AS DETERMINED FROM A FREE -FLIGHT ROCKET-MODEL TEST TO MACH NUMBER 3.64 By Andrew G. Swanson and Charles B. Rumsey Langley Aeronautical Laboratory Langley Field, Va. NATIONAL ADVISORY COMMITTEE FOR AERONAUTICS WASHINGTON September 11, 1956 Declassified September 1, 1959
2 RATIONAL ADVISORY COmITTEE &'OR moea%ptics AEXOD-YNAMIC HEATING OF A WING AS DETERMINED PROM A PREE-FLIGHT ROCKET-MODEL TEST Ti) MACH NUMBER 3.64 By Andxew G. Swanson and Charles B. Rumsey As part of a general program to study aerodynamic heating, a wing of aspect ratio 2.9 having a 30' swept leading edge, an unswept trailing edge, and a hexegonal airfoil section was flight tested on a rocket-propelled model to a Mach number of 3.& and a Reynolds number of 31.9 x 10⁶ (based on wing mean aerodynamic chord of 1.52 feet). The highest temperatures and heat-transfer rates occurred at the stagnation line on the leading edge of the wing; however, the temperature measurement technique was inadequate for correlating the data with theory. Stanton numbers reduced from the temperature time histories measured at locations other than the stagnation point were in fair agreement with the theoretical results of Van Driest for flat plates with turbulent boundary layers. The use of the Van Driest theory in predicting temperature time histories was shown to give results of good engineering accuracy for the conditions of this test. Under the transient heating conditions of the test, large temperature gradients were found to exist over the surface of the wing. Also, a temperature differential through the skin was measured. INTRODUCTION A fairly extensive literature exists on eqerimental investigations of supersonic aerodynamic heat transfer to bodies of revolution (including various nose shapes) and flat plates, but the data for other components of airplanes and missiles are relatively meager. Preliminary data on heat transfer to such components as wings, canopies, and control surfaces are given in reference 1 for a few values of Mach number and Reynolds number. Details of one of the investigations of reference are available in reference 2 for a 60' delta wing at a Mach number of Heat-transf er data for two-dimensional wings, at fairly low Reynolds numbers, are given in reference 3 for Mach numbers in the range 1.5 to 2.0. AS -x~t ~i a general program by the Langley Pilotless Aircraft Resc,-el?,Xv- i r)n to defermine supersonic aerodynaraic heat transfer to coxponej.x, f I~ )f?-otu~e rneasuse~nents were obtained on a wing mounted as
3 one of the stabilizing fins mounted on a rocket motor used to propel a conical-nose model, The main objective of the test was to obtain heattransfer data for the cone, The primary purpose of the wing instrumentation was to obtain data for use in design of NACA research missiles; however, it is believed that the wing is representative of typical supersonic designs and that the data will be of general use and interest. Only the wing data are reported. herein. The wing, of aspect ratio 2.9, had a 30 swept leading edge and an ucswept trailing edge and eznployed a hexagonal airfoil section. The rocket motor propelled the test vehicle to a Mach number of 3.64 and a corresponding free-stream Reynolds number of 31.9 x 10 based on wing mean aerodynamic chord of 1.52 feet. The data are compared with results predicted from the theory of Van Driest for a flat plate with a turbulent boundary layer. The flight test was conducted at the Pilotless Aircraft Research Station at Wallops Island, Va. 0 6 SYMBOLS Stmton number, h (CPPV) 2 local skin-friction coefficient spec if ic heat, Btu (slug)(or> density, slugs/cu ft emissivity Stefan-Boltzmann constant, X 10-l2 Btu thickness, ft temperature, OR time, seconds velocity, ft/sec recovery factor, Taw - T2 Tt - T2
4 viscosity, slugs/ft-sec thermal conductivity, (~tu) (f t ) (sq ft) (set) (OR) static pressure, lb/sq ft dynamic pressure, lb/sq ft Reynolds number, p~x/p distance from wing leading edge (measured in free-stream direction), ft Prandtl number, cp/k chord, ft Mach nunber local aerodynamic heat-transfer coefficient, Btu (see)(s4 ft) (OR) distance along wing surface (measured in direction of conductive heat flow), ft Subscripts: 2 aw t W m just outside boundary layer adiabatic wall stagnation wall (skin) free stream MODEL AND LIiJSIPRUMENTATION The general arrangement and pertinent dimensions of the test vehicle are shown in the sketch of figure 1 and in the photograph of figure 2. A detailed sketch of the wing alone is shown in figwe 3 with geometric charc,cteristics being given in table I.
5 %he wing was mounted as one of four similar stabilizing fins of the rocket motor (M-5 JAW or Nike missile booster) which was used to propel a conical nose. (see fig, 2. ) Magnesium sheet of 3/16-inch thickness was used for the flat section of the wing and 118-inch-thick sheet was used for the leading- and trailing-edge wedge sections. Magnesium spars were welded to the skin at the break lines and ran from root to tip. The leading-edge skin was supported by 3/32-inch-thick magnesium ribs, A weld bead, rounded to approximately,semicircular shape, joined the top and bottom skins at both the leading and trailing edges. The wing root was welded along the flat section to a cast magnesium shroud wrapped around the rocket motor nozzle. The tip was sealed with a magnesium plate. The skin surfaces were fairly smooth but were not polished. The maximum camber, bow (spanwise), and twist of the wing were less than 0.04, 0.20 inch, and 0.3', respectively. The alinement of the wing with the rocket motor and cone center line was within lo. The locations of the iron-constantan thermocouples are given in figure 3 and table PI. The thermocouples were all mounted sufficiently far from the ribs for the heat flow into the ribs to have negligible influence on the skin temperatures at the measurement points. The spars may have had some influence on the data obtained af.ter the peak temperature was reached, as is discussed later. Thermocouples 11 and 12 were mounted close to the root to determine heat-sink effects of the fin mounting shroud on fin temperatures. With the exception of thermocouples 3 and 5, all thermocouples were located at the inside surfaces of the skin. Thermocouple 3 measured a temperature on the outside surface, as shown in figure 3, by having the bead (the fused junction of the wires) welded in a hole countersunk about 1/16 inch deep in the outer surface. The diameter of the hole under the bead, through which the wires were led, was about 1/16 inch in diameter. The thermocouple leads were insulated from one another and the skin up to the juncture of the bead. Thermocouple 5 was mounted in a shilar fashion at the outer surface of the leading edge at the stagnation point. Measurements of the temperatures were transmitted to the ground by a telemeter located in the nose cone. The maximum probable error in the temperature measured on the flat portion and the trailing-edge wedge of the wing is *lo0 R. This value is based on a maximum probable error of " percent of the calibrated full-scale range which is the usual accuracy of Pilotless Aircraft Research Division flight-model instrumentation. Eowever, since the thermocouple telemetric technique includes an in-flight calibration (transmission of three known voltages in addition to the thermocouple readings), the accuracy of these temperatures probably approaches f5o R (fl percent of full-scale range). Because the temperatures on the leading-edge wedge section exceeded the nominal calibrated
6 NACA ~56~l.l.a 5 ful.l=scale-range upper limit of 1,020~ R by varying amounts, the accuracy of these measurements is less a.t the maximum values and is probably about f 15O R at L,%OO~ R. A more complete discussion of the general. methods of thermocouple installation and of the temperature telemetric techniques employed by the Langley Pilotless Aircraft Research Division is presented in reference 4. TEST AND ANALYSIS The model was ground launched at an elevation angle of 75'. Temperature data were recorded during and after the burning of the M-5 JATO rocket motor. Velocity data were obtained from a CW Doppler radar, model space position was obtained from an NACA modified SCR 584 tracking radar, and atmospheric data were obtained from a rawinsonde (a radar-tracked sounding balloon). Velocity data were corrected for the wind velocity determined by the rawinsonde. The temperature time-history data were reduced to Stanton number from the following relation (which is discussed in more detail in refs. 4 and 5: where The data were reduced using a constant recovery factor of 0.89, which is an average value of (N~) 'I3 (the theoretical recovery factor for a turbulent boundary layer) for the range of wall temperatures of the test. To determine local flow conditions over the surface of the wing, pressure coefficients were determined from linear theory (ref, 6). Local Mach numbers and static pressures were computed from these coefficients (which are shown in fig. 4) by aseiming the total pressure over the wing t~ be that behind a normal shock using the component of free-stream Mach number noml to the leading edge, Since the stagnation temperature at any Mach number is constm-t throughout the flow, the local static
7 -texperatures could be compute6 from %be local Mach nli.p'ir,ers v%"l; the supersonic plot^ tables. '%These local temperatuzres were combined wlth the pressures "c obtain %he Eocal densities, Shce the range of Eocal static temperatures was not large, c p2 (local specific heat of air) was assumed to have a constant value of Btu This assumption results in negligible error in the 7*73 (slug)(91) * NSt data presented. The values of specific heat for magnesium as a function of temperature were obtained from reference 7. Estimates of the radiation term (second term on right-hand side of eq. (1)) showed its effects to be negligible so it was not included in the data reduction. No exact computations of the conduction term (last term of eq. (1) could be made since there were insufficient temperatures 2 recorded to determine the values of a ~ ~ and, / theref b ore, ~ no ~ conduc- tion effects were included in the data reduction, Approximate calculations did indicate, however, that for about the first 5 to 8 seconds of the flight conduction would have very small effect on the temperature and heattransfer data (except for those stations near the root). One or two seconds beyond peak temperatures (i.e., after about 10 to 12 sec), the errors introduced in the heat-transfer data, due to neglecting the conduetion terms, are no longer negligible but are small and of the same magnitude as the possible errors in the other quantities involved 5ri the data reduction. At times near peak temperature, the slopes dq/dr are close to zero, and smll differences between relatively large quantities, Taw and Tw, are involved in the data reduction, Consequently, any small errors in those quantities are considerably magnified, which results in large scatter and very poor accuracy. Therefore, values of NSt were not calculated in the time range near peak temperatures. For this test the same difficulties exist, to a lesser extent, as the skin begins to heat (i.e., up to about 2 or 3 sec) and, also, when the skin is cooling (i.e., after about 11 sec). For these times the maximum probable error in the NSt data is computed to be in the range of 215 to k25 percent. When the heating rates are high (i.e., from about 3 to 8 sec), the maximum probable error is computed to be about f1o percent. The method used in computing the accuracy of the NSt data is presented in reference 5 which discusses in some detail the accuracy of the general method used to obtaie NSL data with rocket-propelled models in the Langley Pilotless Aircraft Research Division.
8 In the "i;e region new peak temperature, the aerodynamic heat transfer to the skin is approximately -the same numerical value as the conductive beat transfer along the skin to the spars. Since conduction was not accomted for in the computation of experimental values of Nstj the net result of those conduction effects is to extend the time interval, mentioned previously, over ~hich NSt data cannot be obtained. Experimental recovery factors could not be determined since conduction would also,influence these data. It is believed that, if conduction could accurately be accounted for, the experimental recovery factor would not differ greatly from For comparison with the experimental data, theoretical values of Stanton number, based on the local flow conditions of the test, were obtained from the theory of Van Driest for flat plates having turbulent boundary layers (ref. 8). The expression for Cf as given by this reference was modified by use of the Von K6"rmkn similarity law for mixing length as suggested on page 16 of reference 9. The value of NSt was taken to be 0.6~~ as suggested in reference 10. Local Reynolds numbers were calculated considering the effective length to be the distance from the leading edge. Theoretical temperature time histories were computed for some of the stations. The Stanton numbers for these calculations were obtained from the Van Driest theory as previously. Skin temperatures were calculated by a step-by-step procedure from equation (1) (with the proper rearrangement of terms). In computing Taw, a constant recovery factor of 0.89 was assumed. Radiation effects were estimated as negligible and conduction was assumed to be zero. For the subsonic portion of the flight, local flow conditions were assumed equal to free-stream conditions. This assumption introduced negligible error since the heat transfer and temperature rise were quite low during this portion of the flight. Supersonic local flow conditions used were those obtained for the reduction of the NSt data. Efforts were made to calculate the temperature at the leading edge (station 5) by using the theory of reference 11. Since a complete time history for station 5 was not available (readings from thermocouple 5 exceeded the calibrated range between 3.3 and 8.8 sec), only a partial analysis could be made.
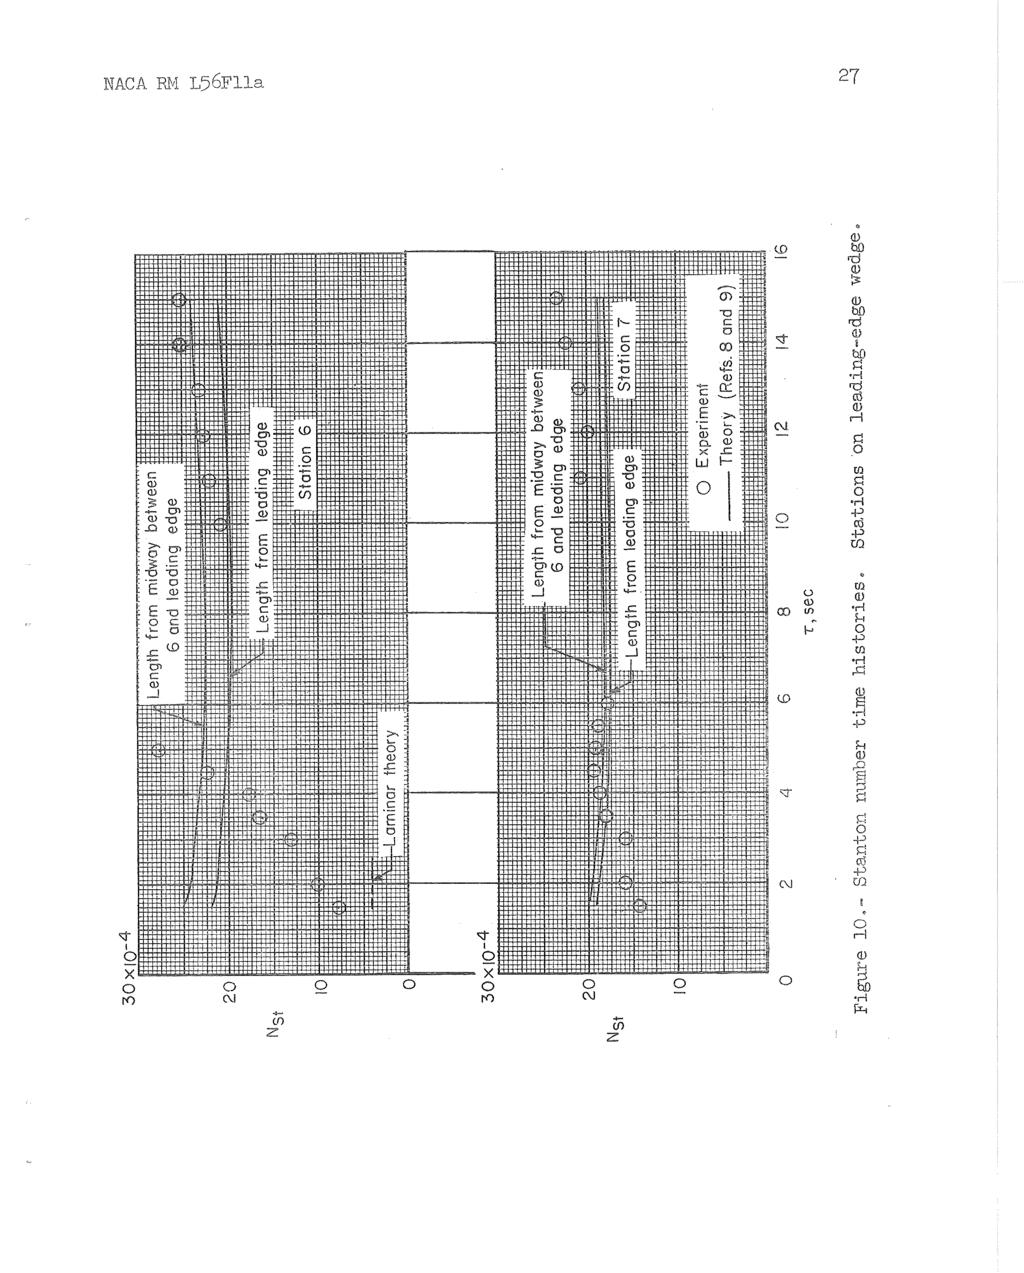
9 General The values of free-stream Mach number, Reynolds number per foot, and stagnation temperature obtained during the flight test are presented as functions of time in figure 5. Temperature time histories are presented in figures 6 to 9. With minor exceptions, which are discussed later, the general trend is as would be anticipated. The temperatures rose most steeply as the model accelerated and less steeply after rocket motor b m out (about 3,2 sec) until a maximum was reached when the wall temperatures equaled the adiabatic wall temperature. The wall temperature then decreased as the heat stored in the skin was transferred to the cooler boundary layer. The highest temperatures and heat-transfer rates were at the stagnation pobt (station 5). the time from 3.3 to 8.8 sec.) Heating rates generally decreased as distance from the leading edge and therefore boundary-layer thickness increased. When the temperature data of figure 6 are considered, it h he data for station 5 exceeded the calibrated range during should be noted that the true magnitude of the reductions in heat transfer due to the changes in local flow conditions over the surface of the wing is masked by the increased heat capacity of the thick skin of the wing center section over the thinner skin of the leading and trailing edges. The data are shown reduced to Stanton number NSt in figures 10 to 12. Although there is some scatter in the experimental data, the general trend is in fair agreement with the theory of Van Driest for flat plates with turbulent boundary layers (refs. 8 and 9). Also, the trends of the experimental results are generally compatible when comparisons are made between the data for the various stations. It is believed that accurately accounting for conduction would generally increase the agreement between theory and experiment. Forward Wedge Sect ion Analysis proceeds more readiu if the temperature and Stanton number data for the forward wedge section are considered together, It is apparent from the temperature time histories of f iwes 6 and 7 and the Nst data of figure 10 that the flow at station 6 was transitional to approximately the time of peak temperature, This transitional flow caused the temper- ature at station 6 to lag behind the temperature at station 7 even though station 7 7m.s the more rearward one and would normally be expected to be cooler because of increa,sed boundary-layer thickness. Shortly before peak temperature was reached, the transition point must have been only
10 slightly ahead of station 6 which resulted in a short effective length of turbulent flow and, therefore, Tn higher heat transfer at station 6 than would have existed if the flow had been turbulent from the leading edge, The level of the data for station 7 (figs. 7 and 10) indicates predominantly turbulent flow for some distance ahead of station 7. The somewhat low level of the experimental NSt data up to 3 seconds (see fig. 10) could be an indication of transitional flow at station 7 but is more apt to be due to scatter in the data. After the time of peak temperature, the Nst data for both stations 6 and 7 (fig. 10) are somewhat above the turbulent theory based on length from the leading edge. The agreement is improved, especially for station 6, if the boullaary-layer transition is assumed to occur about halfway from the leading edge to station 6 and the theory is based on length from the transition point. Theoretical values for stations 6 and 7 based on this assumption are also shown in figure 10. Although the agreement is not as good at station 7 as at station 6, the assumption may nevertheless be valid since the data for station 7 would be expected to show greater influence of conduction than the data for station 6. The anomalies due to transition are, of course, incidental to the major premise of reasonably good agreement between the experimental values of NSt md those predicted from the Van Driest theory. If the flow had been turbulent from the leading edge, the temperatures at station 1 (see fig. 7) according to theory should have been somewhat lower than those measured. A short length of laminar flow, extending about one-third of the distance from the leading edge to station 1 (i. e., a length of laminar boundary layer similar to that assumed in regard to stations 6 and 7), would raise the theoretical heating rate sufficiently to result in theoretical temperatures at station 1 equal to those measured. Flat Section The data for the stations on the flat section of the wing, figures 8 and 11 show generally the trend that would be expected. Since linear theory predicts practically identical flow conditions over the entire flat section of the wing, heat-transfer rates at a given time would be determined primarily by length from the leading edge, that is, Reynolds number, other things being equal. A measure of inequality is introduced, however, by the proximity of stations 11 and 12 to the large relatively cool mass of the fin mounting shroud. As was anticipated, this heat sink reduced the apparent aerodynamic heat-transfer rates for these stations d1x.ing the %ihe the skin was heating and increased the rates during the -time the skin was cooling by absorbing heat from the skin. Since the conduction effects during the first few seconds were estimated to be on:
11 NACA RM ~ 56~lla about 10 percent for even the case of zero temperature rise on the shroud, it is probable that all of the experimental NSt data for station 11 are somewhat reduced owing to a thick boundary layer at the wing-body juncture. The trends of the experimental data for stations 8 and 9 and the good agreement between theory and experiment for these two stations indicate that, after the transitional flow at the leading edge, the heat transfer along this chord line was primarily a function of the usually considered parameters of Reynolds number, Mach number, and TJT~. From the temperature data of figure 8 and the NSt data of figure 11, it would appear that the heat transfer at station 2 was slightly low. The differences between the data obtained and theory are fairly small and are within the range of possible error in the data; however, this small difference (particularly up to 4 sec ) may explain some effects noted subsequently. Since the conduction effects for stations 2 and 8 would be expected to be similar, the levels of the NSt data for these two stations would tend to substantiate the belief that, for the data presented after peak temperature (12 to 15 sec), the error due to neglecting conduction is about the same value as the remaining possible errors. Trailing-Edge Wedge Section As would be expected, the temperature data for stations 4 and 10 on the trailing-edge wedge section l lotted in fig. 9) are quite similar. The data for station 10 are shown reduced to Stanton number in figure 12 and are in fair agreement with the Van Driest theory. 31 view of the similarity between temperature tbe histories and local flow conditions for stations 10 and 4, the heat-transfer data for the two stations would also be similar. Calculated and Measured Temperature Comparison Although there is some disagreement between the experimental Stanton number data and the values obtained from the theory of Van Driest, the use of the theory in predicting temperatures would give good results for the conditions of this test as is illustrated by the data of figure 13 which compare temperatures calculated by using the theory with the measured temperatures at three stations on one chord line at the 42-percent-span station. The comparison is generally quite good and indicates that for surfaces such.as thin wings, which do not deviate too far from a flat plate, the theory w ill predict temperature time histories with good engineering accuracy, at least for the conditions encountered in this test.
12 NACA RM ~56~lla To illustrate more clearly the effects of the leading- and trailingedge wedge sections on the temperature distribution, a temperature time history for station 9, which is on the flat section of the wing, is presented in figure 13 for a 118-inch thickness (the thickness of the skin on the wedge sections) in addition to a time history for the actual skin thickness at station 9 of 3/16 inch. Discounting Reynolds number effects, which would be relatively small, the changes in local flow conditions after each change in slope of the airfoil are seen to have about equal influence on the heat transfer. Also, the increased heat capacity of the thicker skin can be seen to have an effect equal to that of the expansion in reducing the maximum temperature, clearly illustrating that, for rapid transient heating, structural characteristics and aerodynamic phenomona can be equally powerful influences on the temperature distribution. For this test, changes in NSt of f 20 percent of the values of NSt computed from Van Driest theory resulted in a variation of about f10 percent in the maximum temperature rise computed in the temperature tlme history. The amount of variation in peak temperature for a given variation in NSt is, of course, a function of Taw - T and therefore a function of the particular vehicle, and its trajectory, for which the computations are made. In computing the temperature histories, a variation of f20 percent in the static-pressure coefficients resulted in less than?-percent change in the product pv. (variations in the term pv have, of course, the same effect on temperature time-history calculations as do similar variations in Nst.) The pv product was sensitive, however, to the assumed value of total pressure over the wing surface. A change from an attached oblique shock to a detached normal shock at the wing leading edge resulted in changes of about 10 percent to 50 percent in the values of pv. It should be remarked that although the use of the Van Driest turbulent theory should, in most instances, give good engineering accuracy in predicting temperatures over the wing surface, a transition from laminar to turbulent flow could result in actual temperatures near the transition point somewhat higher than those calculated assuming turbulent flow over the entire surface. In the case of the leading-edge temperature at the stagnation line, a rigorous comparison between experiment and theory could not be made since a complete time history of leading-edge temperature was not obtained (readings from thermocouple 5 exceeded the calibrated range from about 3.3 to 8.8 sec). However, computations of temperature at the stagnation line were made by using heat-transfer coefficients obtained from the theory of reference 11. The values of h were based on the nominal leading-edge diameter of 1/4 inch.. The effective thickness was assumed to be 1-18 inch
13 l2 NACA P-SjI ~56~12~ and. the adiabatic wall temperatwe was assumed as T (or recovery factor q = 0 As can be seen in figure 14, the temperature history thus computed is in fair agreement with the experimental data available during the heating portion of the flight but is in poorer agreement as to the level and trend during the the the leadkg edge is cooling. It is believed that the peak temperature predicted is probably representative of the actual temperature of the wing beading edge. Temperature Gradient Through Skin An attempt was made to measure the temperature differential through the skin by installing thermocouples at the outside and inside surfaces, stations 3 and 2, respectively. The results are shown in figure 15 together with a differential predicted from reference 12 by assuming a variation of temperature at station 3 proportional to time squared (with axis at t = 1.0) and then computing the resulting temperature at the inside surface. The theory gives a temperature differential considerably less than that measured. The methods of reference 13, in which the heat input rather than the variation of temperature on the outside surface is used, gave similar results. Since the thermal properties of the wall do not vary much over the range of temperatures involved, the theoretical results should be fairly exact and it is most probable that the experimental data do not give a true indication of the gradient through the skin since the techniques of measurement were not sufficiently sophisticated to determine accurately the temperature difference through a solid homogenec~ls wall. The type of thermocouple installation at station 3 (see fig. 3) would tend to create a local hot spot, owing to the decreased mass beneath the thermocouple, which would result in a surface temperature higher than would have existed on a homogeneous skin. This effect is probably the prime source of difference between theory and experiment. Also, as noted previously, the heat transfer at station 2 is sligm1.y low during the first portion of the flight. If this low value is due to some error in the temperature measurement rather than an actual effect of local flow conditions at station 2, the temperature data for station 8 m ight give a truer picture of the actual inside wall temperature in the vicinity of stations 2 and 3. As can be seen in figure 15, the agreement between measured and predicted temperature differential is somewhat improved if the data for station 8 are used in place of the data for station 2. Bcth experimental and theoretical Stanton numbers are negligibly in error even though this gradient through the skin was not accounted for in the calculations since the gradient has small effect on the slopes dq,/d~ and, even at the highest of heatfng rates, the small temperature differential makes the inside (measured) wall temperature not much different from mean temperature.
14 Temperatme Gradients Over Surface As would be expected, severe gradients over the swfaee of the wing were found to exist under the transient aerodynamic heating conditions of this test. Presented in figure 16 is the chordwise temperature distribution at the 42-percent-span station for four different times and Mach numbers during the coasting portion of the flight. (The lines connecting the data points axe not fairings, since there were too few measurements to define adequately the distribution, but are merely for identification purposes. ) The changing character of the gradients with tfme (and therefore heating rate) are clearly indicatd. These gradients might be expected to have some influence on the measured data; however, no influence is apparent from comparison of the experhnental heat-transfer data with the theory (which is for isothermal surface conditions). CONCLUSIONS Rocket-model tests of a wing of aspect ratio 2.9 having a 30' swept leading edge and an unswept trailhg edge and employing a hexagonal airfoil section have been made to a Mach number of and a Reynolds number of 31.9 x lo6 (based on wing mean aerodynamic chord). The data indicate the following results: I. The highest temperatures and heat-transfer rates occurred at the stagnation line on the leading edge of the wing; however, the temperature measurement technique was inadequate for correlating the data with theory. 2. The Stanton numbers reduced from the temperature time histories for stations other than the stagnation point were in fair agreement with the theoretical results of Van Driest for 'flat plates with turbulent boundary layers. 3. For the conditions of this test, skin temperatures were predicted with good engineering accuracy by use of Van Driest" theory. Langley Aeronautical Laboratory, National Advisory Committee for Aeronautics, Langley Field, Va., May 29, 1956.
15 1. Chauvin, Leo T.: Aerodynamic Heating of Aircraft Components, WCA RM L55Llgb, Carter, Howard S.: Heat Transfer on the Lifting Surfaces of a 600 Delta Wing at Angle of Attack for Mach Number 1.98, NACA RM ~56~23, , Sterbutzel, Gerald A., and Kajencki, Stephen S.: Experimental Investigation of Heat Transfer From Aerodynamic Bodies in Supersonic Flow. Rep. No. ~~-473-~-9 (contract ~ ac )~ Cornell Aero. Lab,, Inc., Apr. 1970, 4. Rumsey, Charles B., and Lee, Dorothy B.: Measurements of Aerodynamic Heat Transfer and Boundary-Layer Transition on a lo0 Cone in Free Flight at Supersonic Mach Numbers up to 5 9. NACA RM ~56~07, Piland, Robert O., Collie, Katherine A., and Stoney, William E.: Turbulent and Laminar Heat-Transfer Measurements on a 1/6-~cale NACA RM-10 Missile in Free Flight to a Mach Number of 4.2 and to a Wall Temperature of 1400~ R. NACA RM ~56~05, Ferri, Antonio: Elements of Aerodynamics of Supersonic Flows. The Macmillian Co., Kelley, K. K.: Contributions to the Data on Theoretical Metallurgy. 11. High-Temperature Specific-Heat Equations for Inorganic Substances. Bulletin 371, Bur. Mines, 1934, p Van Driest, E. R.: The Turbulent Boundary Layer for Compressible Fluids on a Flat Plate With Heat Transfer. Rep. No. AL-997, North American Aviation, Inc., Jan 27, 1950, 9. Van Driest, E. R.: The Turbulent Boundary Layer With Variable Prandtl Number. Rep. No. AL-1914, North American Aviation, Lnc., Apr. 2, 1%. 10. Rubesin, Morris W.: A Modified Reynolds Analogy for the Compressible Turbulent Boundary Layer on a Flat Plate. NACA TN 2917, Beckwith, Ivan E.: Theoretical Investigation of Lminar Heat Transfer on Yawed Cylinders in Supersonic Flow and a Compa~ison With Experimental Data, NACA RM L55F09, , Churchill, Rue1 V,: Modern Operational Mathematics in Engineering. McGraw-Hill Book Co., Inc., 199, p. 106, problem 7.
16 13. Coulbert, C. Do, Maclnnes, W. F., IshTznoto, T., Bussell, B., a.nd Ambrosia, A.: Temperature Response of Infinite Flat-Plates and Slabs to Heat Tnputs of Short Duration at One Surface. Contract No. AF33 (038) , TJniv. of California, Dept. Eng., Apr
17 TABLE I.. WING GEOMETRY. 2.9 Taper ratio... * 0.41 Thickness ratio (tip). percent Thickness ratio (root). percent Leading-edge sweep. deg Trailing-edge sweep. deg... 0 Leading-edge wedge angle. deg Trailing-edge wedge angle. deg Airfoil section... Hexagonal Aspect ratio (based on exposed area in one plane)... Mean aerodynamic chord. ft...
18 TABLE 11.- COUPLE LOCATIONS
19
20 NACA RM ~ 5 6 ~ l l a Figure '2.- Rocket model on launcher. ~-89648,%
21 Typical i-he~mscoupie instailation Figure 3,- General arrangement sf wing alone, Dimensions are in %arches uiiess oakremise stated.
22 (a) Static-pressure coefficient (from linear theory) M, (b) Local Mach number (normal shock at leading edge), Figure 4.- Local flow parmeters as functions sf free-stream Mach nmber,
23 MACA RM ~ 5 6 ~ l l a (a) Free-stream k c h number. 30x10~ T,sec (b) Free-stream Reynolds number per foot. -a (c ) Stagnation temperature. -- Figure 5.- Mach number, Reynolds number, and stagnation-temperature time histories.

24 NACA RM ~56~lla
25
26

27 NACA RM ~ 56~lla
28

29 r,sec - r'iwe 11.- Stanton number time histories, Stations on flat section,
30 NACA IQ4 ~56~1la
31 NACA RM ~ 56~lla
32
33
34 NACA RM ~ 5 6 ~ 1 ~ a Time MCD ,s sec 3.68 Figure Chord~.rise temperature distributions, Spanwise station LO. 5 (42-percent-span station),
MACH NUMBERS BETWEEN 0.8 AND 2.2 AS DETERMINED FROM THE
 NACA RM SL5kH2 NATIONAL ADVISORY COMMI'ITEE FOR AERONAUTICS RESEARCH MEMORANDUM for the Bureau of Aeronautics, Department of the Navy mo-lift DRAG OF THE CHANCE VOUGHT Rl3GULUS I1 MISSILE AT MACH NUMBERS
RESEARCH MEMORANDUM FUGHT CHARACTERSSTICS OF A WINGIZSS ROCKET-POWERED MODEL WITH FOUR EXTERNALLY MOUNTED AIR-TO-APR MISSILES,$ Langley.Field, Va.
 3 1176 6 693 i RESEARCH MEMORANDUM FUGHT CHARACTERSSTCS OF A WNGZSS ROCKET-POWERED MODEL 'r- WTH FOUR EXTERNALLY MOUNTED AR-TO-APR MSSLES,$ AT MACH NUMBERS FROM.7 TO 1.6 By Allen B. Henning and Clarence
FREE-FLIGHT SKIN TEMPERATURE AND PRESSURE MEASUREMENTS ON A SLIGHTLY BLUNTED 2 5' CONE -CYLINDER-FLARE CONFIGURATION
 RESEARCH MEMORANDUM FREE-FLIGHT SKIN TEMPERATURE AND PRESSURE MEASUREMENTS ON A SLIGHTLY BLUNTED 2 5' CONE -CYLINDER-FLARE CONFIGURATION T O A MACH NUMBER O F 9.89 I! B y Aleck C. Bond and Charles B. Rumsey
RESEARCH MEMORANDUM AND SURFACE-PRESSURE MEASUREMENTS ON A HIGHLY POLISHED NOSE HAVING A 100 TOTAL-ANGLE CONE AND A
 RESEARCH MEMORANDUM FREE-FIJGHT SKIN-TEMPERATURE AND SURFACE-PRESSURE MEASUREMENTS ON A HIGHLY POLISHED NOSE HAVING A 100 TOTAL-ANGLE CONE AND A IO0 HALF-ANGLE CONICAL FLAR,E SECTION UP TO A MACH NUMBER
Introduction to Aerospace Engineering
 4. Basic Fluid (Aero) Dynamics Introduction to Aerospace Engineering Here, we will try and look at a few basic ideas from the complicated field of fluid dynamics. The general area includes studies of incompressible,
AEROSPACE ENGINEERING DEPARTMENT. Second Year - Second Term ( ) Fluid Mechanics & Gas Dynamics
 Fluid Mechanics & Gas Dynamics") AEROSPACE ENGINEERING DEPARTMENT Second Year - Second Term (2008-2009) Fluid Mechanics & Gas Dynamics Similitude,Dimensional Analysis &Modeling (1) [7.2R*] Some common variables in fluid mechanics include:
AEROSPACE ENGINEERING DEPARTMENT Second Year - Second Term (2008-2009) Fluid Mechanics & Gas Dynamics Similitude,Dimensional Analysis &Modeling (1) [7.2R*] Some common variables in fluid mechanics include:
SPC Aerodynamics Course Assignment Due Date Monday 28 May 2018 at 11:30
 SPC 307 - Aerodynamics Course Assignment Due Date Monday 28 May 2018 at 11:30 1. The maximum velocity at which an aircraft can cruise occurs when the thrust available with the engines operating with the
TECHNICAL NOTE D ABLATING UNDER CONSTANT AERODYNAMIC CONDITIONS. By Robert R. Howell. Langley Research Center Langley Station, Hampton, Va.
 -. NASA TN D-1635 TECHNICAL NOTE 1 D- 1635 AN EXPERIMENTAL STUDY OF THE BEHAVIOR OF SPHERES ABLATING UNDER CONSTANT AERODYNAMIC CONDITIONS By Robert R. Howell Langley Research Center Langley Station, Hampton,
Given the water behaves as shown above, which direction will the cylinder rotate?
 water stream fixed but free to rotate Given the water behaves as shown above, which direction will the cylinder rotate? ) Clockwise 2) Counter-clockwise 3) Not enough information F y U 0 U F x V=0 V=0
AN ENGINEERING LEVEL PREDICTION METHOD FOR NORMAL-FORCE INCREASE DUE TO WEDGE SECTIONS
 27 TH INTERNATIONAL CONGRESS OF THE AERONAUTICAL SCIENCES AN ENGINEERING LEVEL PREDICTION ETHOD FOR NORAL-FORCE INCREASE DUE TO WEDGE SECTIONS Asher Sigal Shehafim R&D, Haifa 34861, Israel Keywords: wedge
NATIONALADVISORY COMMITTEE FOR AERONAUTICS TECHNICAL NOTE 4214 AT MACH 3.1. Paul F. Brinich. Flight Propulsion Laboratory Cleveland, Ohio.
 r NATONALADVSORY COMMTTEE FOR AERONAUTCS TECHNCAL NOTE 4214 BOUNDARY -LAYER TRANSTON ON AN OPEN -NOSE CONE AT MACH 3.1 By Paul F. Brinich Lewis Flight Propulsion Laboratory Cleveland, Ohio =w= Washington
APPENDIX C DRAG POLAR, STABILITY DERIVATIVES AND CHARACTERISTIC ROOTS OF A JET AIRPLANE (Lectures 37 to 40)
") APPENDIX C DRAG POLAR, STABILITY DERIVATIVES AND CHARACTERISTIC ROOTS OF A JET AIRPLANE (Lectures 37 to 40 E.G. TULAPURKARA YASHKUMAR A. VENKATTRAMAN REPORT NO: AE TR 2007-3 APRIL 2007 (REVISED NOVEMBER
APPENDIX C DRAG POLAR, STABILITY DERIVATIVES AND CHARACTERISTIC ROOTS OF A JET AIRPLANE (Lectures 37 to 40 E.G. TULAPURKARA YASHKUMAR A. VENKATTRAMAN REPORT NO: AE TR 2007-3 APRIL 2007 (REVISED NOVEMBER
High Speed Aerodynamics. Copyright 2009 Narayanan Komerath
 Welcome to High Speed Aerodynamics 1 Lift, drag and pitching moment? Linearized Potential Flow Transformations Compressible Boundary Layer WHAT IS HIGH SPEED AERODYNAMICS? Airfoil section? Thin airfoil
Transonic Aerodynamics Wind Tunnel Testing Considerations. W.H. Mason Configuration Aerodynamics Class
 Transonic Aerodynamics Wind Tunnel Testing Considerations W.H. Mason Configuration Aerodynamics Class Transonic Aerodynamics History Pre WWII propeller tip speeds limited airplane speed Props did encounter
RESEARCH MEMORANDUM NATIONAL ADVISORY COMMITTEE FOR AERONAUTICS. -9:.f CANCELLED. . *..,t--:;.,q. By Edward C. Polhamus and Thomas J. Ring, Jr.
 RESEARCH MEMORANDUM AERODYNAMIC CIylRACTEmTICS WITH FEED AND FRcEE TRAN;SITION '",? f- I r\ t 7-1. *..,t--:;.,q OF A MODIFIED DELTA WINGIN COMBINATION WITH A FUSEIAGE AT EIGE SUBSONIC SPEEDS By Edward
Improved Method for Prediction of Attainable Wing Leading-Edge Thrust
 NASA Technical Paper 3557 Improved Method for Prediction of Attainable Wing Leading-Edge Thrust Harry W. Carlson Lockheed Engineering & Sciences Company Hampton, Virginia Marcus O. McElroy and Wendy B.
Given a stream function for a cylinder in a uniform flow with circulation: a) Sketch the flow pattern in terms of streamlines.
 Sketch the flow pattern in terms of streamlines.") Question Given a stream function for a cylinder in a uniform flow with circulation: R Γ r ψ = U r sinθ + ln r π R a) Sketch the flow pattern in terms of streamlines. b) Derive an expression for the angular
Question Given a stream function for a cylinder in a uniform flow with circulation: R Γ r ψ = U r sinθ + ln r π R a) Sketch the flow pattern in terms of streamlines. b) Derive an expression for the angular
Drag (2) Induced Drag Friction Drag Form Drag Wave Drag
 Induced Drag Friction Drag Form Drag Wave Drag") Drag () Induced Drag Friction Drag Form Drag Wave Drag Outline Nomenclature and Concepts Farfield Drag Analysis Induced Drag Multiple Lifting Surfaces Zero Lift Drag :Friction and Form Drag Supersonic
Drag () Induced Drag Friction Drag Form Drag Wave Drag Outline Nomenclature and Concepts Farfield Drag Analysis Induced Drag Multiple Lifting Surfaces Zero Lift Drag :Friction and Form Drag Supersonic
INSTITUTE OF AERONAUTICAL ENGINEERING (Autonomous) Dundigal, Hyderabad
 Dundigal, Hyderabad") INSTITUTE OF AERONAUTICAL ENGINEERING (Autonomous) Dundigal, Hyderabad - 500 043 AERONAUTICAL ENGINEERING TUTORIAL QUESTION BANK Course Name : LOW SPEED AERODYNAMICS Course Code : AAE004 Regulation : IARE
INSTITUTE OF AERONAUTICAL ENGINEERING (Autonomous) Dundigal, Hyderabad - 500 043 AERONAUTICAL ENGINEERING TUTORIAL QUESTION BANK Course Name : LOW SPEED AERODYNAMICS Course Code : AAE004 Regulation : IARE
Steady waves in compressible flow
 Chapter Steady waves in compressible flow. Oblique shock waves Figure. shows an oblique shock wave produced when a supersonic flow is deflected by an angle. Figure.: Flow geometry near a plane oblique
Lecture-4. Flow Past Immersed Bodies
 Lecture-4 Flow Past Immersed Bodies Learning objectives After completing this lecture, you should be able to: Identify and discuss the features of external flow Explain the fundamental characteristics
Module3: Waves in Supersonic Flow Lecture14: Waves in Supersonic Flow (Contd.)
") 1 Module3: Waves in Supersonic Flow Lecture14: Waves in Supersonic Flow (Contd.) Mach Reflection: The appearance of subsonic regions in the flow complicates the problem. The complications are also encountered
1 Module3: Waves in Supersonic Flow Lecture14: Waves in Supersonic Flow (Contd.) Mach Reflection: The appearance of subsonic regions in the flow complicates the problem. The complications are also encountered
= 390 ( R). Then, for a given edge Mach number, M e., and ratio of wall temperature to adiabatic wall temperature T W = T W. T AW = T e 2 M e 2
. Then, for a given edge Mach number, M e., and ratio of wall temperature to adiabatic wall temperature T W = T W. T AW = T e 2 M e 2") D-32 Applied Computational Aerodynamics D.5 Program FRICTION FRICTION provides an estimate of laminar and turbulent skin friction suitable for use in aircraft preliminary design. It is an entirely new
D-32 Applied Computational Aerodynamics D.5 Program FRICTION FRICTION provides an estimate of laminar and turbulent skin friction suitable for use in aircraft preliminary design. It is an entirely new
NATIONAL ADVISORY COMMITTEE ix FOR AERONAUTICS. I 1 I/ $. t. Langley Aeronautical Laboratory. Washington TECHNICAL NOTE 3861
 * NATIONAL ADVISORY COMMITTEE ix c t. e... 9 FOR AERONAUTICS. TECHNICAL NOTE 3861 \ d \ I 1 I/ $. t I 4' \,,,',I i. * I*---,h,q ~,-,. I AERODYNAMIC CHARACTERISTICS OF A CIRCULAR CYLINDER AT MACH NUMBER
Definitions. Temperature: Property of the atmosphere (τ). Function of altitude. Pressure: Property of the atmosphere (p). Function of altitude.
. Function of altitude. Pressure: Property of the atmosphere (p). Function of altitude.") Definitions Chapter 3 Standard atmosphere: A model of the atmosphere based on the aerostatic equation, the perfect gas law, an assumed temperature distribution, and standard sea level conditions. Temperature:
Definitions Chapter 3 Standard atmosphere: A model of the atmosphere based on the aerostatic equation, the perfect gas law, an assumed temperature distribution, and standard sea level conditions. Temperature:
Introduction to Atmospheric Flight. Dr. Guven Aerospace Engineer (P.hD)
") Introduction to Atmospheric Flight Dr. Guven Aerospace Engineer (P.hD) What is Atmospheric Flight? There are many different ways in which Aerospace engineering is associated with atmospheric flight concepts.
Introduction to Atmospheric Flight Dr. Guven Aerospace Engineer (P.hD) What is Atmospheric Flight? There are many different ways in which Aerospace engineering is associated with atmospheric flight concepts.
Brenda M. Kulfan, John E. Bussoletti, and Craig L. Hilmes Boeing Commercial Airplane Group, Seattle, Washington, 98124
 AIAA--2007-0684 Pressures and Drag Characteristics of Bodies of Revolution at Near Sonic Speeds Including the Effects of Viscosity and Wind Tunnel Walls Brenda M. Kulfan, John E. Bussoletti, and Craig
6.1 According to Handbook of Chemistry and Physics the composition of air is
 6. Compressible flow 6.1 According to Handbook of Chemistry and Physics the composition of air is From this, compute the gas constant R for air. 6. The figure shows a, Pitot-static tube used for velocity
FUNDAMENTALS OF AERODYNAMICS
 *A \ FUNDAMENTALS OF AERODYNAMICS Second Edition John D. Anderson, Jr. Professor of Aerospace Engineering University of Maryland H ' McGraw-Hill, Inc. New York St. Louis San Francisco Auckland Bogota Caracas
RESEARCH MEMORANDUM NATIONAL ADVISORY COMMITTEE FOR AERONAUTICS UNCLASSIFIED AND DIRECTIONAL AERODYNAMIC CHARACTERISTICS OF FOUR
 " I RESEARCH MEMORANDUM SOME EFFECTS OF AILERON DEFLECTION ON THE STATIC LATERAL AND DIRECTIONAL AERODYNAMIC CHARACTERISTICS OF FOUR CONTEMPORARY AIRPLANE MODELS By Willard G. Smith and Peter F. Intrieri
Fundamentals of Aerodynamics
 Fundamentals of Aerodynamics Fourth Edition John D. Anderson, Jr. Curator of Aerodynamics National Air and Space Museum Smithsonian Institution and Professor Emeritus University of Maryland Me Graw Hill
AE 451 Aeronautical Engineering Design I Aerodynamics. Prof. Dr. Serkan Özgen Dept. Aerospace Engineering December 2017
 AE 451 Aeronautical Engineering Design I Aerodynamics Prof. Dr. Serkan Özgen Dept. Aerospace Engineering December 2017 Lift curve 2 Lift curve slope 3 Subsonic lift curve slope C Lα = 2 + 4 + AR2 β 2 η
What is the crack propagation rate for 7075-T6 aluminium alloy.
 - 130 - APPENDIX 4A 100 QUESTIONS BASED ON SOURCE DOCUMENTS LISTED IN APPENDIX 4B 20-06 Magnitude of reductions in heat transfer on the nose region of a body when ablation of the surface takes place. (PI2002)
Fundamentals of Aerodynamits
 Fundamentals of Aerodynamits Fifth Edition in SI Units John D. Anderson, Jr. Curator of Aerodynamics National Air and Space Museum Smithsonian Institution and Professor Emeritus University of Maryland
Drag Analysis of a Supermarine. Spitfire Mk V at Cruise Conditions
 Introduction to Flight Aircraft Drag Project April 2016 2016 Drag Analysis of a Supermarine Spitfire Mk V at Cruise Conditions Nicholas Conde nicholasconde@gmail.com U66182304 Introduction to Flight Nicholas
for what specific application did Henri Pitot develop the Pitot tube? what was the name of NACA s (now NASA) first research laboratory?
 first research laboratory?") 1. 5% short answers for what specific application did Henri Pitot develop the Pitot tube? what was the name of NACA s (now NASA) first research laboratory? in what country (per Anderson) was the first
1. 5% short answers for what specific application did Henri Pitot develop the Pitot tube? what was the name of NACA s (now NASA) first research laboratory? in what country (per Anderson) was the first
Part 3. Stability and Transition
 Part 3 Stability and Transition 281 Overview T. Cebeci 1 Recent interest in the reduction of drag of underwater vehicles and aircraft components has rekindled research in the area of stability and transition.
1. Introduction Some Basic Concepts
 1. Introduction Some Basic Concepts 1.What is a fluid? A substance that will go on deforming in the presence of a deforming force, however small 2. What Properties Do Fluids Have? Density ( ) Pressure
Syllabus for AE3610, Aerodynamics I
 Syllabus for AE3610, Aerodynamics I Current Catalog Data: AE 3610 Aerodynamics I Credit: 4 hours A study of incompressible aerodynamics of flight vehicles with emphasis on combined application of theory
Flight Vehicle Terminology
 Flight Vehicle Terminology 1.0 Axes Systems There are 3 axes systems which can be used in Aeronautics, Aerodynamics & Flight Mechanics: Ground Axes G(x 0, y 0, z 0 ) Body Axes G(x, y, z) Aerodynamic Axes
AE 451 Aeronautical Engineering Design I Aerodynamics. Prof. Dr. Serkan Özgen Dept. Aerospace Engineering December 2015
 AE 451 Aeronautical Engineering Design I Aerodynamics Prof. Dr. Serkan Özgen Dept. Aerospace Engineering December 2015 Lift curve 2 Lift curve slope 3 Subsonic lift curve slope C Lα = 2 + 4 + AR2 β 2 η
Chapter 5 Wing design - selection of wing parameters 2 Lecture 20 Topics
 Chapter 5 Wing design - selection of wing parameters Lecture 0 Topics 5..4 Effects of geometric parameters, Reynolds number and roughness on aerodynamic characteristics of airfoils 5..5 Choice of airfoil
Ramjets: Thermal Management An Integrated Engineering Approach
 Ramjets: Thermal Management An Integrated Engineering Approach Ronald G. Veraar TNO Defence, Security and Safety P.O. Box 45 2280 AA Rijswijk NETHERLANDS ronald.veraar@tno.nl ABSTRACT Within the framework
Relaminerization of a Highly Accelerated Flow on a Convex Curvature
 Relaminerization of a Highly Accelerated Flow on a Convex Curvature Abstract Relaminarization of turbulent flow is a process by which the mean flow reverts to an effectively laminar state. The phenomenon
Nonlinear Aerodynamic Predictions Of Aircraft and Missiles Employing Trailing-Edge Flaps
 Nonlinear Aerodynamic Predictions Of Aircraft and Missiles Employing Trailing-Edge Flaps Daniel J. Lesieutre 1 Nielsen Engineering & Research, Inc., Santa Clara, CA, 95054 The nonlinear missile aerodynamic
Stability and Control Some Characteristics of Lifting Surfaces, and Pitch-Moments
 Stability and Control Some Characteristics of Lifting Surfaces, and Pitch-Moments The lifting surfaces of a vehicle generally include the wings, the horizontal and vertical tail, and other surfaces such
Thin airfoil theory. Chapter Compressible potential flow The full potential equation
 hapter 4 Thin airfoil theory 4. ompressible potential flow 4.. The full potential equation In compressible flow, both the lift and drag of a thin airfoil can be determined to a reasonable level of accuracy
ν δ - 1 -
 ν δ - 1 - δ ν ν δ ν ν - 2 - ρ δ ρ θ θ θ δ τ ρ θ δ δ θ δ δ δ δ τ μ δ μ δ ν δ δ δ - 3 - τ ρ δ ρ δ ρ δ δ δ δ δ δ δ δ δ δ δ - 4 - ρ μ ρ μ ρ ρ μ μ ρ - 5 - ρ τ μ τ μ ρ δ δ δ - 6 - τ ρ μ τ ρ μ ρ δ θ θ δ θ - 7
Restriction/ Classification Cancelled
 Restriction/ Classification Cancelled NACA RM E55KOla SYMBOLS............................... 3 PRELIMINARY CONSIDERATIONS..................... 5 Description of Cascade...................... 5 Performance
Wings and Bodies in Compressible Flows
 Wings and Bodies in Compressible Flows Prandtl-Glauert-Goethert Transformation Potential equation: 1 If we choose and Laplace eqn. The transformation has stretched the x co-ordinate by 2 Values of at corresponding
RESEARCH MEMORANDUM NATIONALADVISORY COMMITTEE FOR AERONAUTICS. OF SONIC PROPpUMIVE JETS OF A FOUR-ENGINE. Langley Aeronautical Langley Field, Va.
 :. i COPY RM L57E31 RESEARCH MEMORANDUM.. -. OF SONIC PROPpUMIVE JETS OF A FOUR-ENGINE DELTA-WING CONFIGURATION By Joseph H. Judd and Ralph A. Falanga Langley Aeronautical Langley Field, Va. CLASSIFIED
Heat transfer in the region of interaction of an oblique shock wave and a laminar boundary layer
 Retrospective Theses and Dissertations 1964 Heat transfer in the region of interaction of an oblique shock wave and a laminar boundary layer William John Cook Iowa State University Follow this and additional
MDTS 5705 : Aerodynamics & Propulsion Lecture 2 : Missile lift and drag. G. Leng, MDTS, NUS
 MDTS 5705 : Aerodynamics & Propulsion Lecture 2 : Missile lift and drag 2.1. The design of supersonic airfoils For efficient lift generation at subsonic speeds, airfoils look like : So why can t a similar
Chapter 3 Lecture 8. Drag polar 3. Topics. Chapter-3
 Chapter 3 ecture 8 Drag polar 3 Topics 3.2.7 Boundary layer separation, adverse pressure gradient and favourable pressure gradient 3.2.8 Boundary layer transition 3.2.9 Turbulent boundary layer over a
RESEARCH MEMORANDUM. JUL3 1%-i NATIONAL ADVISORY COMMITTEE. 8 Langley Aeronautical Laboratory Langley Ffeld$XASSIFICATION CHANGED
 03 0 w r-l t- z JUL3 1%-i RESEARCH MEMORANDUM LFT AND DRAG COEFFCENTS FOR THE BELL X-1 ARPLANE (8-PEFCEN"TEUCK WNG) N POWER-OFF 3 TFUWSONC FLGHT By L. Robert Carman and John R. Carden B 8 Langley Aeronautical
DEVELOPMENT OF A COMPRESSED CARBON DIOXIDE PROPULSION UNIT FOR NEAR-TERM MARS SURFACE APPLICATIONS
 DEVELOPMENT OF A COMPRESSED CARBON DIOXIDE PROPULSION UNIT FOR NEAR-TERM MARS SURFACE APPLICATIONS Erin Blass Old Dominion University Advisor: Dr. Robert Ash Abstract This work has focused on the development
To highlight the change in drag with lift: Drag = Zero-Lift Drag + Lift-Dependent Drag + Compressibility Drag
 Drag Drag Bookkeeping Drag may be divided into components in several ways: To highlight the change in drag with lift: Drag = Zero-Lift Drag + Lift-Dependent Drag + Compressibility Drag To emphasize the
Lecture1: Characteristics of Hypersonic Atmosphere
 Module 1: Hypersonic Atmosphere Lecture1: Characteristics of Hypersonic Atmosphere 1.1 Introduction Hypersonic flight has special traits, some of which are seen in every hypersonic flight. Presence of
External Forced Convection. Copyright The McGraw-Hill Companies, Inc. Permission required for reproduction or display.
 External Forced Convection Copyright The McGraw-Hill Companies, Inc. Permission required for reproduction or display. Drag and Heat Transfer in External flow Fluid flow over solid bodies is responsible
Supersonic Aerodynamics. Methods and Applications
 Supersonic Aerodynamics Methods and Applications Outline Introduction to Supersonic Flow Governing Equations Numerical Methods Aerodynamic Design Applications Introduction to Supersonic Flow What does
Performance. 5. More Aerodynamic Considerations
 Performance 5. More Aerodynamic Considerations There is an alternative way of looking at aerodynamic flow problems that is useful for understanding certain phenomena. Rather than tracking a particle of
The E80 Wind Tunnel Experiment the experience will blow you away. by Professor Duron Spring 2012
 The E80 Wind Tunnel Experiment the experience will blow you away by Professor Duron Spring 2012 Objectives To familiarize the student with the basic operation and instrumentation of the HMC wind tunnel
THE EFFECT OF WING GEOMETRY ON LIFT AT SUPERSONIC SPEEDS
 Journal of Engineering Science and Technology EURECA 2013 Special Issue August (2014) 16-27 School of Engineering, Taylor s University THE EFFECT OF WING GEOMETRY ON LIFT AT SUPERSONIC SPEEDS ABDULKAREEM
NUMERICAL OPTIMIZATION OF THE SHAPE OF A HOLLOW PROJECTILE
 NUMERICAL OPTIMIZATION OF THE SHAPE OF A HOLLOW PROJECTILE Wessam Mahfouz Elnaggar, Zhihua Chen and Hui Zhang Key Laboratory of Transient Physics, Nanjing University of Science and Technology, Nanjing,
LONGITUDINAL STABILITY AND TRIM OF AN ARIANE 5 FLY-BACK BOOSTER
 12th AIAA International Space Planes and Hypersonic Systems and Technologies 1-19 December 23, Norfolk, Virginia AIAA 23-7 LONGITUDINAL STABILITY AND TRIM OF AN ARIANE FLY-BACK BOOSTER Th. Eggers DLR,
Masters in Mechanical Engineering Aerodynamics 1 st Semester 2015/16
 Masters in Mechanical Engineering Aerodynamics st Semester 05/6 Exam st season, 8 January 06 Name : Time : 8:30 Number: Duration : 3 hours st Part : No textbooks/notes allowed nd Part : Textbooks allowed
Hypersonic Flight Effects on Optical Sensors
 A Tutorial Of: Hypersonic Flight Effects on Optical Sensors Matt Salem The University of Arizona: OPTI 521 12/4/2016 Background: In recent years hypersonic vehicles have received a lot of attention from
PREDICTION OF SOUND PRESSURE LEVELS ON ROCKET VEHICLES DURING ASCENT Revision E
 PREDICTION OF SOUND PRESSURE LEVELS ON ROCKET VEHICLES DURING ASCENT Revision E By Tom Irvine Email: tomirvine@aol.com July 0, 011 Figure 0. Schlieren Photo, Wind Tunnel Test Engineers conducted wind tunnel
FREE-FLIGHT INVESTIGATION AT TRANSONIC SPEED3 OF THE. POWER-ON CHARACTERISTICS JlXCLUDIN'G SOME EFFECTS DELTA-WING CONFIGURATION
 RESEAR N FREE-FLIGHT INVESTIGATION AT TRANSONIC SPEED3 OF THE POWER-ON CHARACTERISTICS JlXCLUDIN'G SOME EFFECTS OF SONIC PROPULSIVE JETS OF A FOUR-ENGINE DELTA-WING CONFIGURATION By Joseph H. Judd and
AIRFRAME NOISE MODELING APPROPRIATE FOR MULTIDISCIPLINARY DESIGN AND OPTIMIZATION
 AIRFRAME NOISE MODELING APPROPRIATE FOR MULTIDISCIPLINARY DESIGN AND OPTIMIZATION AIAA-2004-0689 Serhat Hosder, Joseph A. Schetz, Bernard Grossman and William H. Mason Virginia Tech Work sponsored by NASA
ADVERSE REYNOLDS NUMBER EFFECT ON MAXIMUM LIFT OF TWO DIMENSIONAL AIRFOILS
 ICAS 2 CONGRESS ADVERSE REYNOLDS NUMBER EFFECT ON MAXIMUM LIFT OF TWO DIMENSIONAL AIRFOILS Kenji YOSHIDA, Masayoshi NOGUCHI Advanced Technology Aircraft Project Center NATIONAL AEROSPACE LABORATORY 6-
Technology of Rocket
 Technology of Rocket Parts of Rocket There are four major parts of rocket Structural system Propulsion system Guidance system Payload system Structural system The structural system of a rocket includes
Introduction to Aerospace Engineering
 Introduction to Aerospace Engineering Lecture slides Challenge the future 3-0-0 Introduction to Aerospace Engineering Aerodynamics 5 & 6 Prof. H. Bijl ir. N. Timmer Delft University of Technology 5. Compressibility
AOE 3114 Compressible Aerodynamics
 AOE 114 Compressible Aerodynamics Primary Learning Objectives The student will be able to: 1. Identify common situations in which compressibility becomes important in internal and external aerodynamics
rublication No, 6 ; "
 Department of Aeronautical Engineering Renssolaer Folytechnic Institute y Troy, New Y,/ rublication No, 6 ; " qt HYPERSONIC VISCOUS FLOW ON NONINSULATED 0 FLAT PLATE' ' ' ing-yi L.i CA Department of Aeronautical
Applied Fluid Mechanics
 Applied Fluid Mechanics 1. The Nature of Fluid and the Study of Fluid Mechanics 2. Viscosity of Fluid 3. Pressure Measurement 4. Forces Due to Static Fluid 5. Buoyancy and Stability 6. Flow of Fluid and
RESEARCH MEMORANDUM AERODYNAMIC HEATING AND BOUNDARY-MYER TRANSITION ON A. l/io-power NOSE SHAPE IN FREE FLIGHT AT MACH NUMBERS
 262 COPY RM L57E14a RESEARCH MEMORANDUM AERODYNAMIC HEATING AND BOUNDARY-MYER TRANSITION ON A l/io-power NOSE SHAPE IN FREE FLIGHT AT MACH NUMBERS.: -. f Tjp 0 6.7.&D. FREE-STREAM REYNOLDS N-UlMBERS :
Applied Fluid Mechanics
 Applied Fluid Mechanics 1. The Nature of Fluid and the Study of Fluid Mechanics 2. Viscosity of Fluid 3. Pressure Measurement 4. Forces Due to Static Fluid 5. Buoyancy and Stability 6. Flow of Fluid and
and K becoming functions of Mach number i.e.: (3.49)
") Chapter 3 Lecture 11 Drag polar 6 Topics 3.3.4 Parabolic drag polar at high speeds 3.3.5 Guidelines for variations of C Do and K for subsonic jet transport airplanes 3.3.6 Variations of C Do and K for
Chapter 3 Lecture 11 Drag polar 6 Topics 3.3.4 Parabolic drag polar at high speeds 3.3.5 Guidelines for variations of C Do and K for subsonic jet transport airplanes 3.3.6 Variations of C Do and K for
Jet Aircraft Propulsion Prof. Bhaskar Roy Prof. A.M. Pradeep Department of Aerospace Engineering
 Jet Aircraft Propulsion Prof. Bhaskar Roy Prof. A.M. Pradeep Department of Aerospace Engineering Indian Institute of Technology, IIT Bombay Module No. # 01 Lecture No. # 08 Cycle Components and Component
Applied Fluid Mechanics
 Applied Fluid Mechanics 1. The Nature of Fluid and the Study of Fluid Mechanics 2. Viscosity of Fluid 3. Pressure Measurement 4. Forces Due to Static Fluid 5. Buoyancy and Stability 6. Flow of Fluid and
EFFECT OF ATMOSPHERIC ALTITUDE ON THE DRAG OF WING AT SUBSONIC AND SUPERSONIC SPEEDS
 Journal of Engineering Science and Technology 6 th EURECA 2016 Special Issue May (2017) 71-83 School of Engineering, Taylor s University EFFECT OF ATMOSPHERIC ALTITUDE ON THE DRAG OF WING AT SUBSONIC AND
PRINCIPLES OF FLIGHT
 1 Considering a positive cambered aerofoil, the pitching moment when Cl=0 is: A infinite B positive (nose-up). C negative (nose-down). D equal to zero. 2 The angle between the aeroplane longitudinal axis
Hypersonic flow and flight
 University of Stuttgart, Aerospace Engineering and Geodesy Dept. - Lecture - Hypersonic flow and flight Master Level, Specialization 4 lecture hours per week in WS, 3-6 LPs/ECTS Lecturer: Dr. Markus J.
University of California at Berkeley Department of Mechanical Engineering ME 163 ENGINEERING AERODYNAMICS FINAL EXAM, 13TH DECEMBER 2005
 University of California at Berkeley Department of Mechanical Engineering ME 163 ENGINEERING AERODYNAMICS FINAL EXAM, 13TH DECEMBER 2005 Answer both questions. Question 1 is worth 30 marks and question
the pitot static measurement equal to a constant C which is to take into account the effect of viscosity and so on.
 Mechanical Measurements and Metrology Prof. S. P. Venkateshan Department of Mechanical Engineering Indian Institute of Technology, Madras Module -2 Lecture - 27 Measurement of Fluid Velocity We have been
If there is convective heat transfer from outer surface to fluid maintained at T W.
 Heat Transfer 1. What are the different modes of heat transfer? Explain with examples. 2. State Fourier s Law of heat conduction? Write some of their applications. 3. State the effect of variation of temperature
DEVELOPMENT OF A COMPUTER PROGRAM FOR ROCKET AERODYNMIC COEFFICIENTS ESTIMATION
 Jurnal Mekanikal June 2009, No. 28, 28-43 DEVELOPMENT OF A COMPUTER PROGRAM FOR ROCKET AERODYNMIC COEFFICIENTS ESTIMATION Md. Nizam Dahalan*, Su Vin Cent, Mohd. Shariff Ammoo Department of Aeronautical
Department of Mechanical Engineering
 Department of Mechanical Engineering AMEE401 / AUTO400 Aerodynamics Instructor: Marios M. Fyrillas Email: eng.fm@fit.ac.cy HOMEWORK ASSIGNMENT #2 QUESTION 1 Clearly there are two mechanisms responsible
ROAD MAP... D-1: Aerodynamics of 3-D Wings D-2: Boundary Layer and Viscous Effects D-3: XFLR (Aerodynamics Analysis Tool)
") AE301 Aerodynamics I UNIT D: Applied Aerodynamics ROAD MAP... D-1: Aerodynamics o 3-D Wings D-2: Boundary Layer and Viscous Eects D-3: XFLR (Aerodynamics Analysis Tool) AE301 Aerodynamics I : List o Subjects
AE301 Aerodynamics I UNIT D: Applied Aerodynamics ROAD MAP... D-1: Aerodynamics o 3-D Wings D-2: Boundary Layer and Viscous Eects D-3: XFLR (Aerodynamics Analysis Tool) AE301 Aerodynamics I : List o Subjects
2 Navier-Stokes Equations
 1 Integral analysis 1. Water enters a pipe bend horizontally with a uniform velocity, u 1 = 5 m/s. The pipe is bended at 90 so that the water leaves it vertically downwards. The input diameter d 1 = 0.1
List of symbols. Latin symbols. Symbol Property Unit
 Abstract Aircraft icing continues to be a threat for modern day aircraft. Icing occurs when supercooled large droplets (SLD s) impinge on the body of the aircraft. These droplets can bounce off, freeze
Nose Cone & Fin Optimization
 Nose Cone & Fin Optimization Tripoli Minnesota Gary Stroick January 2011 Purpose Focus is on drag optimization to maximize rocket performance! Copyright 2011 by Off We Go Rocketry 2 Agenda Definitions
TRANSONIC AERODYNAMIC AND SCALING ISSUES FOR LATTICE FIN PROJECTILES TESTED IN A BALLISTICS RANGE
 EB01 19th International Symposium of Ballistics, 7 11 May 2001, Interlaken, Switzerland TRANSONIC AERODYNAMIC AND SCALING ISSUES FOR LATTICE FIN PROJECTILES TESTED IN A BALLISTICS RANGE Gregg Abate1, Gerald
UNIT II CONVECTION HEAT TRANSFER
 UNIT II CONVECTION HEAT TRANSFER Convection is the mode of heat transfer between a surface and a fluid moving over it. The energy transfer in convection is predominately due to the bulk motion of the fluid
Experimental Evaluation of Aerodynamics Characteristics of a Baseline Airfoil
 Research Paper American Journal of Engineering Research (AJER) e-issn: 2320-0847 p-issn : 2320-0936 Volume-4, Issue-1, pp-91-96 www.ajer.org Open Access Experimental Evaluation of Aerodynamics Characteristics
Aerodynamic Characteristics of Two Waverider-Derived Hypersonic Cruise Configurations
 NASA Technical Paper 3559 Aerodynamic Characteristics of Two Waverider-Derived Hypersonic Cruise Configurations Charles E. Cockrell, Jr. and Lawrence D. Huebner Langley Research Center Hampton, Virginia
The Computations of Jet Interaction on a Generic Supersonic Missile
 The Computations of Jet Interaction on a Generic Supersonic Missile *Jinbum Huh 1) and Seungsoo Lee 2) 1), 2) Department of Aerospace Engineering, Inha Univ., Incheon, Korea 2) slee@inha.ac.kr ABSTRACT
'FOR 'AERONAUTICS LATERAL STABILITY CHARACTERISTICS BETWEEN...~ .MACH:NUMBERS OF 0.80 AND 1.57 A N D, SiMULATION OF COUPLED
 ......,~,.............,. LATERAL STABILITY CHARACTERISTICS BETWEEN...~.MACH:NUMBERS OF 0.80 AND 1.57 A N D, SiMULATION OF COUPLED.......,,.............. MOTION AT MACH NUMBER 1.30 OF A ROCKET-PROPELLED
External Flow and Boundary Layer Concepts
 1 2 Lecture (8) on Fayoum University External Flow and Boundary Layer Concepts By Dr. Emad M. Saad Mechanical Engineering Dept. Faculty of Engineering Fayoum University Faculty of Engineering Mechanical