Fast Computation of Large Scale Marginal Extremes with Multi-Dimensional Covariates
|
|
|
- Allison Doyle
- 5 years ago
- Views:
Transcription
1 Computational Statistics & Data Analysis 9, March 26, Pages Fast Computation of Large Scale Marginal Extremes with Multi-Dimensional Covariates Laks Raghupathi a,, David Randell b, Kevin Ewans c, Philip Jonathan b a Shell India Markets Pvt. Ltd., Bangalore, 648, India. b Shell Global Solutions (UK), Manchester M22 RR, United Kingdom. c Sarawak Shell Bhd., 4 Kuala Lumpur, Malaysia. Abstract Safe and reliable design and operation of fixed and floating marine structures often located in remote and hostile environments is challenging. Rigorous extreme value analysis of meteorological and oceanographic data can greatly aid the design of such structures. Extreme value analysis is typically undertaken for single spatial locations or for small neighbourhoods; moreover, non-stationary effects of covariates on extreme values are typically accommodated in an ad-hoc manner. The objective of the work summarised here is to improve design practice by estimating environmental design conditions (such as return values for extreme waves, winds and currents) for a whole ocean basin, including additional covariate effects (such as storm direction) as necessary, in a consistent manner. Whole-basin non-stationary extreme value modelling is computationally complex, requiring inter-alia the estimation of tail functions, the parameters of which vary with respect to multi-dimensional covariates characterised by us using tensor products of penalised B-splines. We outline two technical contributions which make whole-basin non-stationary analysis feasible. Firstly, we adopt generalised linear array methods to reduce the computational burden of matrix manipulations. Secondly, using high-performance computing, we develop a parallel implementation of maximum likelihood estimation for the generalised Pareto distribution. Together, these innovations allow estimation of rigorous whole-basin extreme value models in reasonable time. We evaluate the new approach in application to marginal extreme value modelling of storm peak significant wave heights in two ocean basins, accommodating spatial and directional covariate effects. Keywords: extremes, splines, non-stationary effects, fast-computation, high-performance computation. Introduction.. Background Safe exploration and production of oil and gas from offshore locations requires the design and construction of marine structures able to withstand severe environmental conditions, more extreme than the worst foreseeable during the required structural lifetime, associated with an annual probability of failure typically less than in,. Robust modelling of extreme environmental conditions is therefore critical for safe day-to-day operation and long-term structural reliability. This requires the specification of return values for oceanographic phenomena such as waves, winds, currents and associated variables. The metocean engineer faces the challenge of analysing huge samples of measured or hindcast meteorological and oceanographic data exhibiting complex dependencies, including non-stationarity with respect to multiple covariates and spatial dependence of extremes, in order to estimate both marginal and joint return values for a large number of wave-, wind- and current-related variables. Extreme value analysis is motivated by asymptotic arguments. In the metocean context, only the largest values in the sample (for example, observations exceeding some threshold) should be used for extreme value modelling, but the sample size must also be sufficient for good empirical modelling. Therefore, the amount of data available for analysis at a specific location is often limited. Reducing the threshold value runs the risk of invalidating asymptotic arguments underlying the modelling strategy. Increasing the threshold value reduces sample size still further. One pragmatic solution to the sample size issue is to aggregate observations from a neighbourhood of spatial locations and analyse the pooled sample. However, neighbouring locations in general have different extreme value characteristic, and observations from neighbouring locations are typically not statistically independent. aive analysis of spatial extremes over spatial neighbourhoods can lead therefore to erroneous inferences. Fortunately, recent developments in statistical modelling of extreme ocean environments offer solutions other than pooling; a recent review is presented in [JE3]. [JER3] and [JRWE4] present recent progress in the spline-based modelling of covariates effect. Here, we further develop these methods for basin-wide marginal modelling of extremes, incorporating non-stationarity due to direction, longitude and Corresponding author. l.raghupathi@shell.com Preprint submitted to Comp. Stat. Data Anal. (Elsevier) 24th July 2
2 latitude, and adjusting for spatial dependence between locations in all uncertainty analyses. An outline of the modelling procedure is given at the start of 2. At present, preliminary design conditions for a specific location are typically estimated by the metocean engineer based on data for (the neighbourhood of) that location. This process is typical time-consuming and technically challenging. Moreover, industry design procedures are sufficiently vague that there could be inconsistency between estimated design conditions for the same location made by different metocean engineers, using different data sources, modelling assumptions and procedures. With a basin-wide extreme value model in place, spatio-directional return values for all locations in the ocean basin of interest can be estimated. The estimates obtained provide outline directional design conditions for locations of interest in the basin based on rigorous, consistent statistical analysis, allowing fair comparison of environmental risk for those locations. The estimates might further be pre-computed, stored in a database and accessed via a graphical user interface to a device of choice querying the database. In practice, it may further be necessary to calibrate hindcast data to measurements at specific locations. The paper is organised as follows. 2 presents the model formulation for extreme values subject to spatio-directional non-stationarity, outlining computational challenges to its implementation basin-wide. 3 describes generalised linear array methods and reports their performance by incorporation within the extreme value model. 4 describes parallel adaption of the generalised Pareto algorithm and quantifies computational improvements achieved. describes the practical application of the above methodology to estimation of basin-wide return values for ocean storm severity in two ocean basins. Discussion, conclusions and opportunities for further development are summarised in A spatio-directional marginal extreme value model The objective is the estimation of marginal return values for storm severity (quantified using significant wave height) for locations within a spatial neighbourhood, accounting for spatial and storm directional variability of extremal characteristics. 2.. Model Components Following the work of [JE8] and [JE], summarised in [JRWE4], we model storm peak significant wave height, namely the largest value of significant wave height observed at each location during the period of a storm event. At a given location, storm peak events are reasonably assumed to be statistically independent given covariates since they correspond to occurrences of independent atmospheric pressure fields. We assume that each storm event is observed at all locations within the neighbourhood under consideration. For a sample {ż i }ṅi= of ṅ storm peak significant wave heights (henceforth H S ) observed at locations {ẋ i, ẏ i }ṅi= with dominant wave directions { θ i }ṅi= at storm peak H S (henceforth storm directions ), we proceed using the peaks-over-threshold approach as follows. We first estimate a threshold function φ above which observations ż are assumed to be extreme. The threshold varies smoothly as a function of covariates (φ = φ(θ, x, y)) and is estimated using quantile regression. We retain the set of n threshold exceedances {z i } n i= observed at locations {x i, y i } n i= with storm peak directions {θ i} n i= for further modelling. We next estimate the rate of occurrence ρ of threshold exceedance using a Poisson process model with Poisson rate ρ ( = ρ(θ, x, y)). Finally we estimate the size of occurrence of threshold exceedance using a generalised Pareto (henceforth GP) model; the GP probability density function is given in the Appendix. The GP shape and scale parameters ξ and σ are also assumed to vary smoothly as functions of covariates, with ξ real and σ >. Positivity of GP scale is ensured throughout in the optimisation scheme. The GP shape parameter is unrestricted in the full optimisation, but limited to the interval (-., +.2) in the estimation of the GP starting solution. This approach to extreme value modelling follows that of [CDD] and is equivalent to direct estimation of a nonhomogeneous Poisson point process model ([DTV98], [JE3]). Appendix A provides an outline of the corresponding penalised likelihood optimisations required to estimate model parameters. We emphasise that, in common with [CDD] and [JE3], we perform marginal non-stationary extreme value analysis across a grid of (dependent) spatial locations, accounting (per location) for directional and spatial variability in extremal characteristics. We further account for the effects of (extremal) spatial dependence between locations on inferences using a block bootstrapping scheme Parameterising covariates Applying the model to whole-basin applications is methodologically straightforward, but computationally challenging. Physical considerations suggest we should consider parameters φ, ρ, ξ and σ to be smooth functions of covariates θ, x, y [RYJE3]. For estimation, this can be achieved by expressing the value of each parameter in terms of a linear combination of appropriate basis for the domain D of covariates, where D = D θ D x D y. Here D θ = [, 36) is the (marginal) domain of storm peak directions, and D x, D y are the domains of x- and y-values (e.g. longitudes and latitudes) under consideration. For each covariate (and marginal domain) in turn, we first calculate a B spline basis matrix for an index set of size m (m << n) of covariate values; potentially we could calculate the basis matrix for each of the n observations, but usually avoid this for computational and statistical efficiency. For instance in the case of D θ, we calculate an m θ p θ 2
3 basis matrix B θ such that the value of any function at each of the m θ points in the index set for storm direction can be expressed as linear combination B θ β θ for some p θ vector β θ of basis coefficients. ote that periodic marginal bases can be specified if appropriate (e.g. for D θ ). Then we define a basis matrix for the three-dimensional domain D using tensor products of marginal basis matrices. Thus B = B y B x B θ () provides an m p basis matrix (where m = m θ m x m y, and p = p θ p x p y ) for modelling each of φ, ρ, ξ and σ on the corresponding spatio-directional index set of size m. Any of φ, ρ, ξ and σ (η, say, for brevity) can then be expressed in the form η = Bβ for some p vector β of basis coefficients. Model estimation therefore reduces to estimating appropriate sets of basis coefficients for each of φ, ρ, ξ and σ. The value of any marginal p i (i.e. p θ, p x, or p y ) is equal to the number q i of spline knots specified for periodic domains (e.g D θ ), and to q i + d i for aperiodic domains (e.g D x and D y ), where d i is the order of the B-spline function specified (always 3 in this work, so that spline functions are twice differentiable). The roughness R of any function η defined on the support of the spline basis can be easily evaluated on the index set (at which η = Bβ). For a one-dimensional (e.g. directional) spline basis, following the approach of [EM], writing the vector of differences of consecutive values of β as β, and vectors of second and higher order differences using k β = ( k β), k = 2, 3,..., the roughness R of η is given by R = β Pβ (2) where P = ( k ) ( k ) for differences of order k (with appropriate modifications to preserve periodicity as necessary). For a spatio-directional spline basis, the penalty matrix P can be similarly defined using P = P y P x P θ (3) in the obvious notation. We use k = throughout this work. With this choice of k, heavy roughness penalisation results in stationarity of parameters with respect to periodic and aperiodic covariates. To avoid potential over-fitting, parameter estimation requires that the (negative log) likelihood function is penalised (see the appendix) using a linear combination of parameter roughnesses with roughness coefficients λ η (for each model parameter η). The choice of optimal penalty coefficients is determined by block cross-validation, further adding to computational complexity. Since each storm is observed as a spatially-dependent event at all spatial locations, we define a storm block to be the set of occurrences of a particular storm at all locations for the purposes of both cross-validation (in estimation of model smoothness) and bootstrapping (for uncertainty quantification). For the spatio-directional problem, it is also possible to vary the relative size of basis penalisation with respect to direction, longitude and latitude. In this work, the same penalty value was adopted for both spatial co-ordinates, and the relative value of the directional to spatial penalty was decided using a series of experiments with different penalty choices Managing computational burden We manage the considerable computational challenges of basin-wide extreme value modelling using the following techniques: Generalised linear array model (GLAM) framework ([CDE6]) for fast computation of matrix inner products and matrix vector products (described in 3) Parallel adaption of the generalised Pareto optimisation loop to exploit modern parallel computing environment (described in 4) We outline these developments and the potential computational gains in the next two sections. 3. Generalised linear array model As an illustration of the complexity of explicit matrix operations necessary for spatio-directional inference, consider the back-fitting iteration ([Dav3], referred to in equations A.32 and A.33 of the appendix) for estimation of generalised Pareto (and Poisson) spline basis coefficients and parameter estimates. Estimation involves repeated solution (for β) of equations of the form (B H B + λp)β = B H u (4) where B is a tensor product of marginal spline bases B d B, and B i is the m i p i basis matrix for the ith marginal covariate (θ, x and y respectively for i=,2,3 in the spatio-directional problem). Computation of the inner product B p mh m m B m p results in a p p matrix for inversion. Since non-sparse weight matrix H and working variable u are functions of the starting value β of β at the current iteration, the inversion must be repeated a number of times (especially in the case of generalised Pareto, as will be illustrated below) before convergence. This computational challenge 3
4 increases with increasing number m (= m i ) of covariate bins and total number p (= p i ) of spline coefficients. For a basin-wide spatio-directional model on a x spatial grid compared to a directional model for a single location, the value of m would increase by a factor of one million, and the value of p by a factor of,. Block cross-validatory choice of λ, and bootstrap uncertainty analysis, further increases the number of inversions required. Explicit computation of inner products and their manipulation would be very demanding; but fortunately, due to generalised linear array model (GLAM) methodology, these computations are not necessary. Estimation requires computation of linear forms Bβ and B H u, and inner products of the form B H B. These and similar matrix operations on d-dimensions are possible without explicitly evaluating full linear forms and inner products, dramatically reducing the number of arithmetic operations and memory requirements. Let us illustrate this with a specific 2D case. The linear form Bβ can be written (B 2 B ) β B M(β) B 2 () p p 2 p p 2 where the p p 2 matrix M(β) is the p p 2 vector β arranged in matrix form, and denotes this equivalence. Computationally, the right hand side of () provides a major advantage: it avoids explicit computation of B. The number of multiplications to evaluate it is very much smaller than that needed to evaluate the left-hand side: if B and B 2 are both 3 2 then the left-hand side requires multiplications whereas the right-hand side requires just over 8 multiplications. In general, for m = m 2 = m and p = p 2 = p, evaluation of the left hand expression involves m 2 p 2 multiplications, compared with (m + p)mp for the right hand expression. Similarly, the computational complexity of the inner product operation is greatly reduced when the operation is expressed in terms of the row tensor operator G(B), namely the tensor product of the i th row of B with itself G(B) = (B ) ( B). (6) Here, is a column vector of appropriate length, each element of which is unity. The inner product B H B becomes (B 2 B ) H m m 2 m m 2 (B 2 B ) G(B ) M(H ) m 2 m2 2 G(B 2 ) (7) where m 2 m2 2 matrix M(H ) is a rearranged form of the m m 2 m m 2 matrix H. Again, the right hand side provides marked improvement in computational efficiency. 3.. Improved computational efficiency We now present the results of applying the GLAM approach for basin-wide extreme value analysis. We compare execution times and peak memory usage for an explicit non-glam ( baseline ) analysis with a GLAM implementation as a function of the number of covariate bins m, for relatively small problems only. We estimate the spatio-directional model for a fixed number of spatial and directional knots, (specifically for fixed p = p x p y p θ = = 48), for successively larger spatial domains, resulting in increasing sample sizes and number of covariate bins. For example, a model for 32 directional bins on a spatial grid corresponds to 32 covariate bins, and for 32 directional bins on a 2 2 spatial grid 2, 8 bins. All experiments were run on an 8 core Intel Xeon 2.GHz with 3 GB RAM. Results are illustrated in Figure. Identical inferences were obtained from both the baseline and GLAM analysis, but both run time and peak memory usage are considerably lower for the GLAM implementation. For larger problems, we are unable to execute the baseline analysis. 4. Parallel generalised Pareto algorithm Here we present a parallel adaptation of maximum likelihood estimation for the non-stationary generalised Pareto likelihood, exploiting a multi-processor, multi-node distributed computing architecture. Using simulation we quantify the reduction in execution time achieved compared with sequential execution, and propose a strategy to optimise architecture given problem characteristics. Finally we incorporate bootstrap uncertainty analysis, exploiting the natural massive parallelism of the bootstrapping procedure. 4.. Parallel Adaption of GP The computational efficiency of generalised Pareto (GP) optimisation, using the back-fitting algorithm, has already been markedly improved using GLAM methods, as described in 3. However, in a trial modelling study involving 7 analyses employing between 3, and 384, covariate bins, estimation of GP parameters accounted for between 6% and 9% of overall computation time, making it an obvious candidate for further improvement in computational efficiency. Algorithm illustrates the naive approach to estimating GP shape and scale parameters, each of which is modelled as a linear combination of spline basis functions. In order to identify optimal spline roughness penalty coefficients, crossvalidation ([Sto74]) is used; this involves repeated optimisation for n CV pre-specified subsets of the original sample and 4
5 Run time (min) Peak memory (MB) Baseline GLAM Execution time Peak memory usage Baseline GLAM umber of covariate bins, m (a) umber of covariate bins, m (b) Figure : (a) Execution time for estimation with explicit (non-glam) baseline (red) and GLAM (blue) computation as a function of number of covariate combinations m on log scale; (b) Analogous comparison of peak memory usage. input : Input data dat, number of penalties n λ, number of cross-validations n CV output: Optimal value of λ parameter //loop over penalty coefficients; for i λ to n λ do //loop over cross-validations; for i CV to n CV do //Divide the data into fit and test; datfit SplitDat (dat = i CV ); dattst SplitDat ( dat i CV ); σ, ξ GPFit ( datfit, i λ ); LOF icv ComputeLOF (dattst, σ, ξ); end LOF iλ Σ n CV (LOF icv ); end LOF min(lof iλ ); λ ComputeOptLmb (LOF); Algorithm : Serial algorithm for GP fitting with nested loops over roughness penalty and cross-validations. input : Input data dat, number of penalties n λ, number of cross-validations n CV output: Optimal value of λ parameter //loop over both penalty coefficients and cross-validation sets; for iloop to n λ n CV do //Obtain penalty and cross-validation set membership; i λ, i CV = LookUpTable ( iloop ) ; //Divide the data into fit and test; datfit SplitDat (dat = i CV ); dattst SplitDat ( dat i CV ); σ, ξ GPFit ( datfit, i λ ); LOF icv,i λ ComputeLOF ( dattst, σ, ξ ) ; end for i λ to n λ do LOF iλ Σ n CV (LOF icv,i λ ); end LOF min(lof iλ ); λ ComputeOptLmb (LOF); Algorithm 2: Parallel adaption for GP fitting with single loop.
6 Quantile Regression Poisson Estimation Runs stand-alone #cores = n λ x n CV Parallel GP Runs on HPC HPC ode GPFit (, ) GPFit (, 2) HPC ode n GPFit (i λ, i CV ) GPFit (n λ, n CV ) GPFit (, ) GPFit (, 2) GPFit (n λ, n CV ) Core... Core k... Core n-k... Core Core Core 2... Core Shared Memory Shared Memory Estimate GP params, Return Val (a) Runs stand-alone High Speed Interconnect (b) Figure 2: (a) Overall modelling work-flow showing parallel GP tasks. (b) Deployment of the parallel adaption of the generalised Pareto algorithm in a distributed memory high-performance computing environment. n λ pre-specified values for spline roughness penalty. The optimal penalty is that which minimises the predictive lack of fit (LOF) of the GP model. There is clear scope to unroll this double loop over n CV and n λ, allocating tasks across multiple computing units. Algorithm 2 illustrates the proposed parallel GP optimisation of effectively independent tasks over multiple computing cores. The double loop of algorithm has been unrolled into a single loop using a pre-computed look-up table of combinations of roughness penalty and boolean memberships (for partitioning the sample into training and test subsets) for each cross-validation. This is a classic case of task parallelism where essentially the same computational task is performed in parallel on slightly different sets of data. The algorithm also illustrates the merging of results from different tasks so that overall predictive LOF can be evaluated. Figure 2 (a) illustrates how the parallel GP algorithm described above is integrated into the modelling work-flow. Analysis steps prior to GP modelling (i.e., quantile regression for threshold estimation, Poisson modelling for estimation of rate of threshold exceedances, and a GP starting solution) are performed serially using improved GLAM algorithms described in 3. Subsequently, the parallel GP algorithm is executed in a high-performance computing environment and resulting output consolidated to estimate model parameters. Figure 2 (b) illustrates the distributed memory computing system. The parallel algorithm has n λ n CV threads to compute, achieved by assigning up to n λ n CV computing cores spread over many nodes. In the illustration shown we assume n independent nodes each with k cores, totalling (= k n) parallel cores. If we set n λ n CV =, each thread can be assigned a unique core. If < n λ n CV, fewer operations are performed in parallel; the reminder are scheduled after tasks from earlier batches are complete. In the next section, we discuss metrics to determine the optimal number of cores for efficient and rapid analysis Reduction in execution time The parallel GP algorithm provides considerable reduction in execution time over serial. Figure 3 (a) shows the average run time (over three runs) of the parallel GP algorithm, as a function of the total number of cores, for a trial analysis with n λ = 3 and n CV =. Serial computations previously taking days to execute are now complete in a few hours. Reductions of close to two orders of magnitude in execution times are achieved until 7, beyond which run time improvement diminishes. Figure 3 (b) compares execution time t for an -core architecture against execution time t using a single core. Defining Speedup Factor as Speedup Factor = t t (8) we can compare the realised speedup factor with the idealised speedup factor (= for an -core architecture). Realised and idealised speedup factors diverge for > 7, indicating limitations to the scalability of the parallel implementation due to communication, memory, thread wait and other overheads incurred. Quantifying these overheads is essential for judicious choice of architecture and estimation of execution times. Speedup characteristics are of course dependent on the architecture of computing resources available. Figure 4 (a) illustrates that execution times for individual parallel tasks vary quite markedly, due to different values of penalty coefficient and cross-validation sample partition. Since the full analysis is complete only when all individual tasks are complete, this suggests different approaches to resource utilisation. We might fully subscribe as many cores as the number of parallel tasks ( = n λ n CV ). Alternatively we might under subscribe cores, such that < n λ n CV. When we fully subscribe (as shown in Figure 4 (a)), different tasks take different times. Once a core completes a relatively quick task it remains idle until it receives a communication that all tasks are complete; only then are resources released for other tasks. This leads to obvious inefficiencies and diminishing returns as more cores are added. 6
7 Run time (min) Run time (min) Speed-up factor Parallel GP run time Vs Actual Ideal Speed-up factor Vs umber of cores, (a) umber of cores, (b) Figure 3: (a) Execution time of parallel GP algorithm as a function of the number of cores assigned demonstrating close to two orders of magnitude reduction in execution time for < 7. (b) Comparison of realised and idealised speedup factors which diverge with > 7. Parallel GP individual task run time Parallel task number (a) Avg. Min. Max. Scaling efficiency (%) 8 Parallel scaling efficiency Strong (t )/(t ) Weak (t */t *) umber of cores, (b) Figure 4: (a) Execution times for individual GP tasks for fully subscribed case ( = n λ n CV ) showing variations in run times of parallel tasks. The horizontal black line indicates overall mean execution time. (b) Strong and weak scaling efficiencies of the parallel GP algorithm to aide balancing of computing time with optimal resource usage. 7
8 4.3. Performance Test using Scalability Measures We introduce two measures of scalability ([Kam3]) to determine the optimal number of cores empirically. For a constant problem size, we increase the number of cores and measure execution time and define a metric known as strong scaling efficiency: t E STROG = % (9) t where t and t are defined as earlier. Using this measure, we determine a sweet-spot facilitating computations within reasonable time whilst also using allocated computing resources efficiently. A second measure of weak scaling efficiency is estimated by increasing problem size as a function of number of cores so that each core receives the same quantum of task: E WEAK = t t % () For example, we could use one core to fit one GP (say t for a given λ, CV), then two cores to fit two GP fits (t 2 ) and so on. Figure 4 (b) shows that both strong and weak scaling efficiencies drop below % with increasing, corroborating inferences from Figure 4 (a). Setting expected efficiencies to around 6% and number of cores = 7 appears a reasonable compromise. The high performance computing architecture adopted here is a generic distributed memory computing system with multiple nodes. Each node has multiple CPU cores and shared memory linked via a high speed network. Additional enhancements to parallel task scheduling methodologies are largely unimportant in the current context of independent tasks not requiring inter-processor communication for data transfer. We might exploit relatively quick shared memory by scheduling certain tasks within the same computing node. To minimise wait cycles, we might also communicate task completion at a node and allocate pending tasks adaptively. A-priori analysis of task complexity might enable even greater efficiencies; particularly problematic individual GP optimisations might themselves then be partitioned into multiple tasks Uncertainty Analysis using Massive Parallelism It is critical to quantify the uncertainty with which extreme value models are estimated. Re sampling techniques such as bootstrapping can be used to estimate the uncertainty of model parameters and estimates of return values and other structure variables. [CDD] describe the application of a block bootstrap approach to estimate parameter uncertainty and the precision of extreme quantile estimates, applicable when dependent data from neighbouring locations are used. [JE7] use block bootstrapping to evaluate uncertainties associated with extremes in storm peak significant wave heights in the Gulf of Mexico. In the current context, bootstrapping involves resampling the original sample with replacement to create a bootstrap resample. The whole modelling procedure - including parameter and return value estimation - is then executed for the resampled data. By repeating this scheme for a large number of bootstrap resamples, we can estimate the size of sampling uncertainty on parameter and return value estimates. Model fitting for each bootstrap resample is independent of fitting for all others. Computationally, this problem is seen to be embarrassingly parallel ([Fos9]). In theory, given sufficient resources, all bootstrapping threads might be run simultaneously in parallel, potentially with each task utilising multiple cores using the parallel techniques described in 4. However in practice, there is a limitation on the number of computing resources available at a given time. Hence the task scheduler may impose restrictions on the number of cores that can be allocated to a given task. In such a scenario, a job array approach may be invoked to schedule only one or few bootstrapping iterations at a given time. The job array can be configured in such a manner as to automatically schedule the next set of bootstrapping iterations once the current tasks are done. In.3, we discuss the estimation of parameter uncertainty for the Gulf of Mexico application in more detail.. Applications This section illustrates the methodology in application to estimation of return values for storm severity, corresponding to long return periods, in the Gulf of Mexico (GoM). We also summarise a further similar application to the orth West Shelf of Australia... GoM: Background The Gulf of Mexico is a major energy producing region accounting for 2% of oil and 4% of the natural gas production of the U.S. [GOM4a]. The Gulf is vast with a total area of,87, km 2. Tropical cyclones (or hurricanes) are intense revolving depressions that can generate extreme storm conditions. They can impact almost any part of the US Gulf coast, typically between June and ovember. In deep water, H S exceeding 6 m is possible, with peak seas radiating outwards from the storm centre. Groups of large waves travelling in different directions close to the centre of the storm may combine to give exceptionally high individual wave heights in excess of 3 m ([API7],[ISO]). Specification of realistic metocean criteria is critical for safe and efficient operation of offshore structures. umerical 8
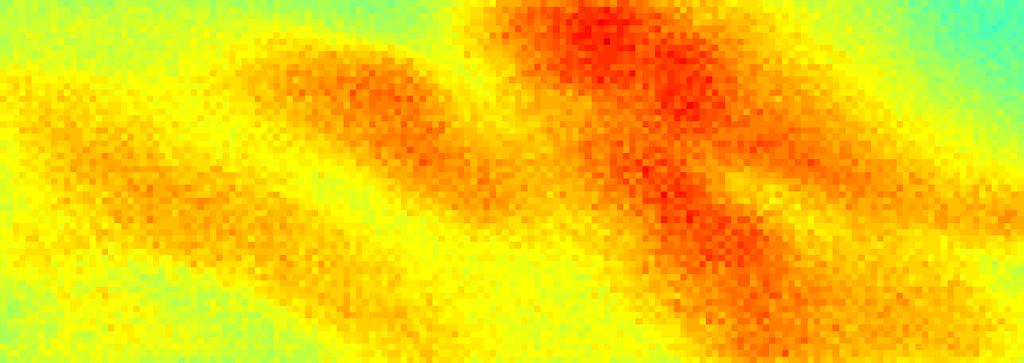
9 Run time (min) Parallel GP speed-up Baseline GP Parallel GP umber of covariate bins, m Figure : Comparative run-time performance (log-log scale) for GP fitting using HPC with different numbers of covariate bins. hindcast studies of extreme and operational conditions include the Gulf of Mexico Oceanographic and Meteorological Study (GOMOS) [GOM4b]. GOMOS8 includes a 29-year continuous wind and wave hindcast for the period 98-28, 379 tropical events (hurricanes) for the period 9-28, and 68 extra-tropical events (winter storms) for the period A 3rd generation wave model with /6th degree fine grid (7km) was used to model extreme storms. A total of 7 hurricane events at 977 spatial locations were considered in this work..2. GoM: Computational burden Conventionally, metocean criteria are estimated using a site-specific approach due to lack of statistical and computational resources. Storm peak values from a small neighbourhood of locations centred around a particular reference location of interest are aggregated to create a sample for extreme value analysis, typically ignoring non-stationarity and spatial dependence. With the computational advances described in 3 and 4, we now have the capability to estimate marginal design conditions for the whole Gulf simultaneously. Physical considerations suggest that setting p = p x p y p θ = provides good spatial and directional resolution. Using the GOMOS hindcast described above, we develop a marginal model for storm peak significant wave height for all spatial locations (at /6 degree resolution) and 32 directional sectors. This requires estimation on the index set of m = m x m y m θ = = 384, covariate combinations for p =, 368 spline coefficients for each of GP shape and scale (and similar numbers for quantile threshold and Poisson rate). We might compare this with a typical problem for the neighbourhood of a single location of size m = 32 = 32 covariate combinations. Figure shows comparative run-times for baseline estimation (GLAM version using 8 cores) and parallel approach (HPC version using 3 cores). Extreme value estimation for the whole of GOMOS can be completed (without uncertainty analysis) within a few hours..3. GoM: Parameter estimation Following a sensitivity study into the stability of GP shape parameter and median -year return value with threshold non-exceedance probability, a threshold non-exceedance probability of. was deemed appropriate. Figure 6 shows parameter estimates as functions of spatio-directional covariates, spatially for directional octants and for all directions (or omni-directionally ). The threshold estimate is relatively stable with respect to both space and direction at around 2.m. The rate of occurrence of threshold exceedances is highest for hurricanes from the East and South-East as expected from physical considerations. Omni-directionally, locations in the eastern Gulf exhibit both larger GP shape and scale, suggesting that extreme values in this region will be larger than elsewhere - again, consistent with historical evidence. We note that values of GP shape range from -. to.6 and GP scale from. to 4.2. ote that the units for parameters are as follows: threshold (metres), rate of threshold exceedance (occurrences per degree per location per annum), GP shape (dimensionless) and GP scale (metres). ote that maximum likelihood estimators for GP shape and scale are asymptotically negatively dependent. It is common in applications to observe negative dependence between estimates of these parameters (see, e.g., [SM2]). Figure 7 illustrates uncertainties in quantile regression, Poisson rate of threshold exceedance, GP shape and scale parameter estimates for the Gulf of Mexico estimated from 2 bootstrap resamples in terms of 2., and 97. percentiles of bootstrap distributions on direction, longitude and latitude. on-overlap of uncertainty estimates indicates (e.g. for Poisson rate) material difference between extreme value models for different combination of covariates. The relatively wide uncertainty bands for GP shape indicate difficulty in estimating the GP parameters for some combinations of covariates. 9


 (b) 4.2.")


 (d)")


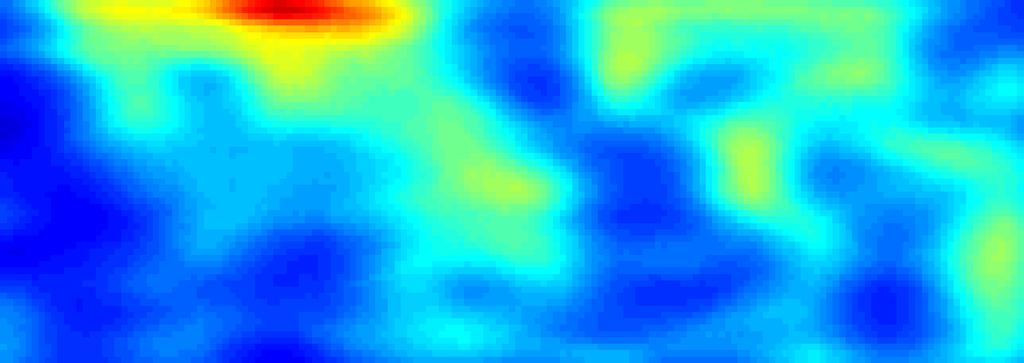
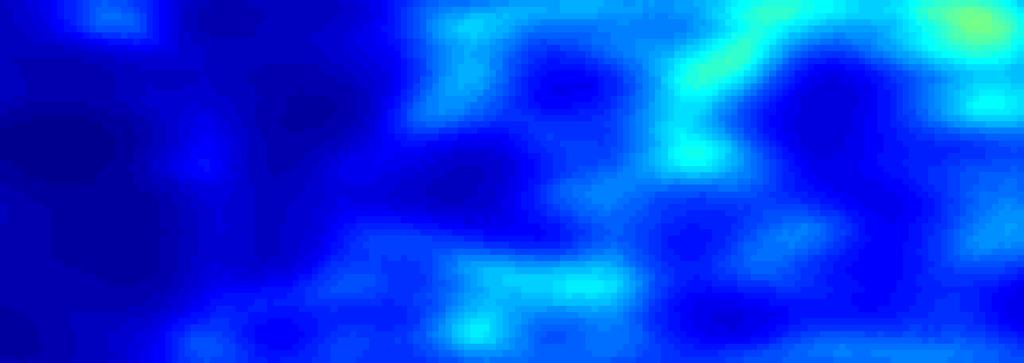

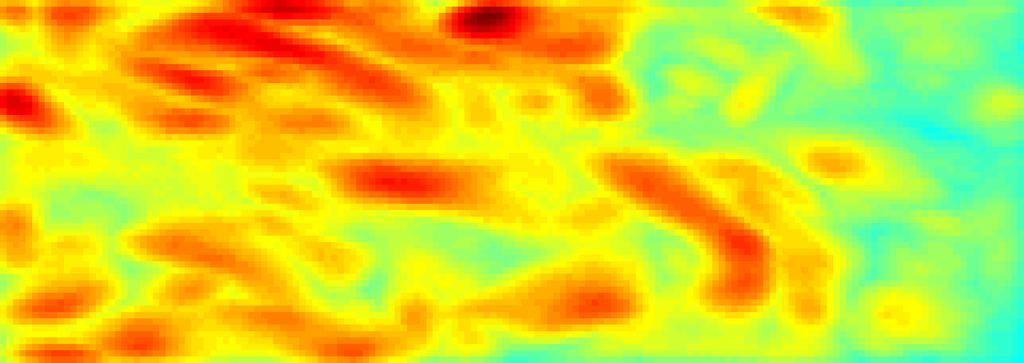


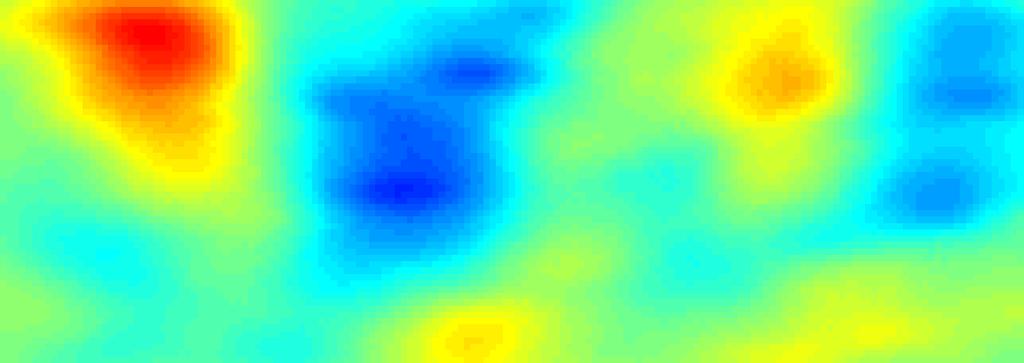

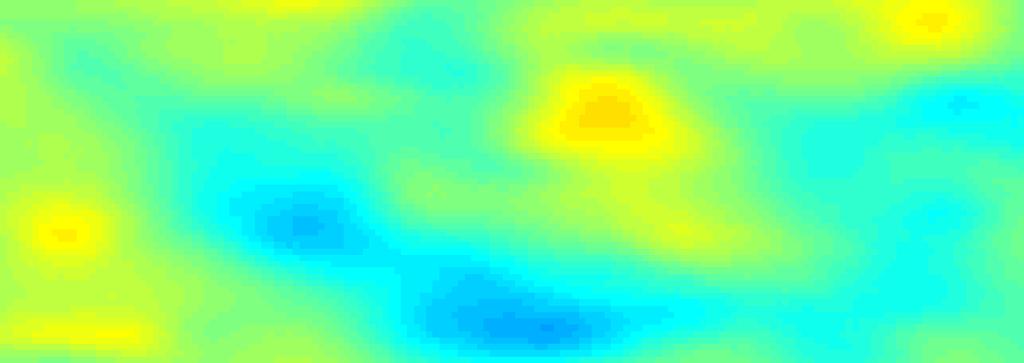

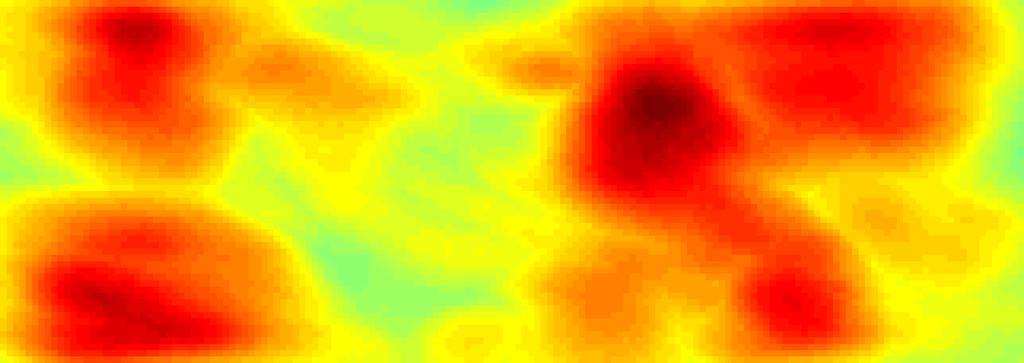
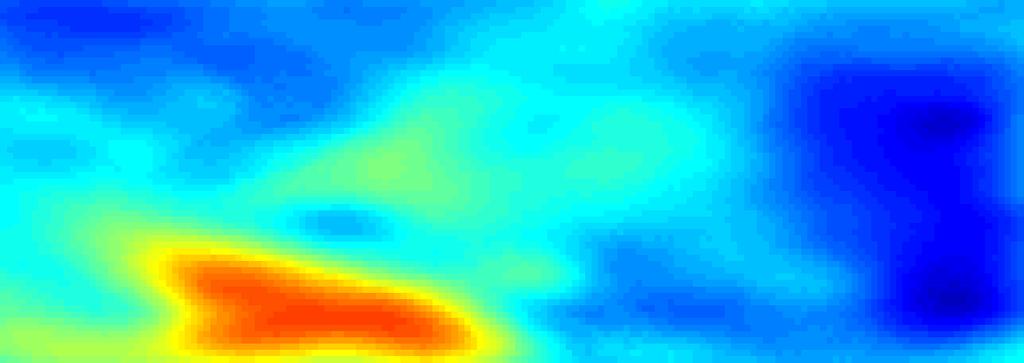

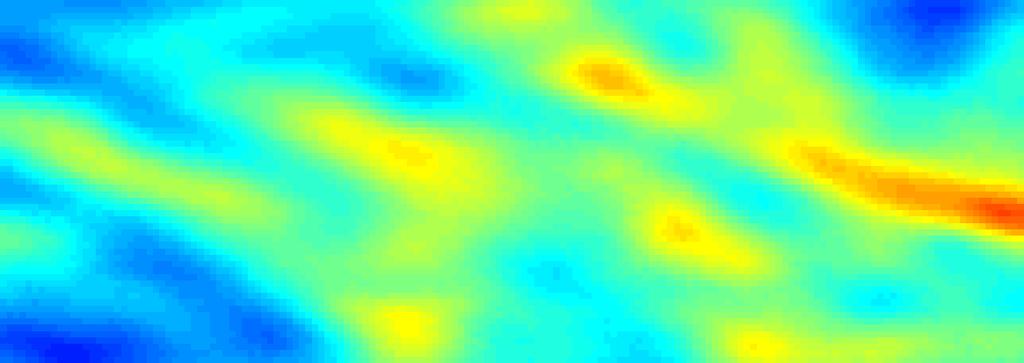
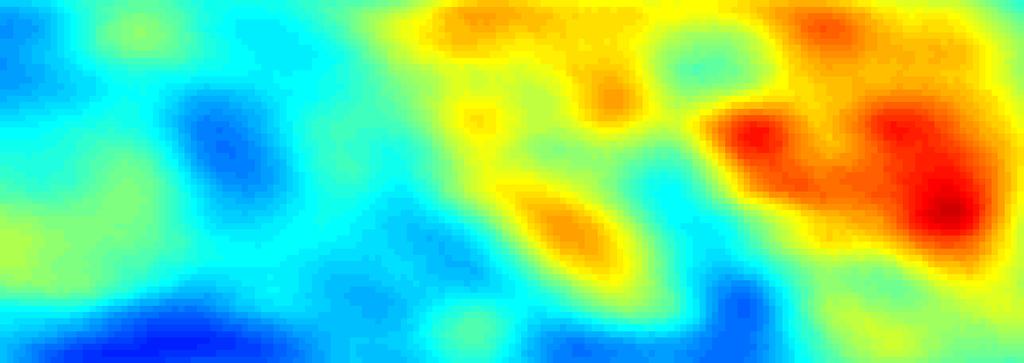


10 2.7 W E W W E 2. SE S SW E W Rel. Latitude Rel. Latitude SW. E S 3.43 SE.72 - Rel. Longitude Rel. Longitude (a) (b) W S SW SE -.7 E E S 3. SE W E Rel. Latitude Rel. Latitude SW W E W Rel. Longitude (c) Rel. Longitude (d) Figure 6: Spatio-directional plot of parameter estimates for the Gulf of Mexico: (a) threshold (metres), (b) rate of threshold exceedance (occurrences per degree per spatial location per annum), (c) GP shape (dimensionless) and (d) scale (metres). For each parameter, the lower plot shows median omnidirectional parameter estimates for each of 977 locations. The 8 upper plots show median directional sector parameter estimates per location for 8 directional octants centred (from left to right, top to bottom) on storms from W,, and E; W and E; SW, S and SE respectively..
11 3 2. Spatio-directional QR threshold 3 Spatio-directional Poisson rate of exceedance Direction Direction Relative Longitude Relative Longitude Relative Latitude (a) Spatio-directional GP shape Relative Latitude (b) Spatio-directional GP scale Direction Direction Relative Longitude Relative Longitude Relative Latitude (c) Relative Latitude (d) Figure 7: Model parameter uncertainty analysis for Gulf of Mexico, from 2 bootstrap iterations illustrated using the 2. (lower dashed), (centre solid) and 97. percentile (top dashed) of the bootstrap distribution of parameter estimates. The panels show estimates for (a) quantile regression threshold (metres), (b) Poisson rate (occurrenes per degree per location per annum), (c) GP shape (dimensionless) and (d) GP scale (metres). In each panel, the upper plot gives parameter estimates as a function of direction for typical SW (red), centre (green) and E (blue) locations respectively; the middle plot as a function of longitude for storms from o and minimum latitude (red), from 2 o and central latitude (green) and 24 o and maximum latitude (blue); the bottom plot as a function of latitude for storms from o and minimum longitude (red), from 2 o and central longitude (green) and from 27 o and maximum longitude (blue).
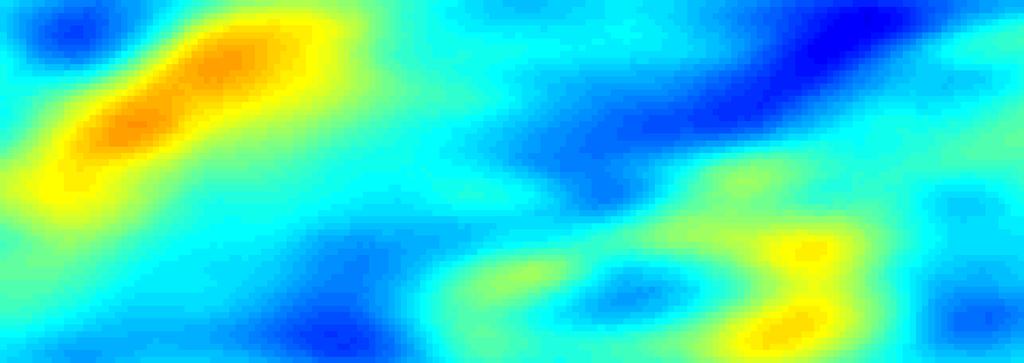
12 .4. GoM: Return Value Estimation Return value distributions can be estimated by the simulation procedure described in [JRWE4]. Briefly, for each location in turn, the distribution of the -year return period is estimated omni-directionally and for 8 directional sectors of equal size centred on cardinal and semi-cardinal directions, using all of the estimated extreme value models (for the actual sample and its bootstrap resamples). Figure 8 (a) shows median -year marginal return values for the entire Gulf, incorporating directional dissipation (as described in [JRWE4]). Omnidirectional estimates (lower panel) of approximately m are consistent with expectation. Directionally, the most severe storms occur in the eastern and south-eastern sectors, consistent with physical understanding. Figures (b) and (c) show estimates for the 2. and 97. percentiles of the return value distribution respectively. Largest return values, and largest return value uncertainties, occur in the hurricane alley region. Using model output such as that in the figure, the metocean specialist can access extreme value estimates for any spatial location and directional octant of choice, generated by a thorough consistent approach for the whole ocean basin... GoM: Model diagnostics Model diagnostics are essential to demonstrate adequate model fit. Of primary concern is that the estimated extreme value model generates spatio-directional distributions consistent with observed storm peak data (see [FRW + ], [JRWE4]). Figure 9(a) provides a spatial comparison of cumulative distribution functions for return values for the period of the original sample, estimated using the original sample (red) and using realisations under the model (black) for a 3 3 grid of locations in the eastern Gulf, corresponding approximately to the so-called hurricane alley, where interest in return value estimation is greatest. Figure 9(b) gives the corresponding directional comparison. There is good agreement. Wider uncertainty bands in western directional sectors are due to lower rates of occurrence of hurricanes..6. orth West Shelf application We briefly describe a second application to estimation of return values of storm peak significant wave height for storms on the orth West Shelf (WS) of Australia. The regional climate is monsoonal, displaying two distinct seasons, winter from April to September and summer from October to March, with very rapid transitions between these, generally in April and September to October. Tropical cyclones during summer months are most influential for extreme metocean criteria, producing severe sea conditions from 4. m and often exceeding 8. m significant wave height. Typically, named tropical storms per year occur in Western Australia [BOM4]. The orth Australia Metocean Study (AMOS) provides hindcast data for tropical cyclones [AM4]. The application sample considered here corresponds to approximately.3 9 values of storm peak H S and dominant wave direction (at storm peak H S ) for 76 hindcasts at 49 locations on a 6 63 regular grid over the orth West Shelf (WS) of Western Australia for the period 97-27, corresponding to a spatial domain of approximately 4 longitude by 4 latitude. Physical considerations again suggest that setting the number of spline coefficients at p = p x p y p θ = is reasonable. Based on stability analysis of GP shape and -year return value with threshold non exceedance probability, we chose a non-exceedance threshold probability of. for extreme value analysis. The extreme value threshold is found to be approximately constant in space and direction at around 3.m. However, the rate of threshold exceedance shows obvious spatial and directional variation, largest in the north-west for storms emanating from the west. Estimates for extreme value shape parameter are lower for WS compared with GoM, suggesting that the distribution of storm peak H S is more heavy-tailed in GoM. Return value distributions for the -year event, estimated by simulation, indicate omnidirectional return values from 8m to 9m, with highest values in the east and north-east. The largest return values occur for cyclones from the west, and lowest for storms from the south-west. 6. Discussion on-stationary marginal extreme value modelling for complete ocean basins is computationally complex, necessitating the estimation of millions of parameters, and large simulations under fitted models for return value estimation and uncertainty analysis. In this paper, we adopt two computational strategies to make this analysis feasible and orders of magnitude more efficient than naive approaches. Using generalised linear array methods, we reduce the computational burden of matrix manipulations of tensor products of spline bases. Using high-performance computing, we develop a parallel implementation of maximum likelihood estimation for the generalised Pareto distribution. We apply the methodology to marginal spatio-directional extreme value modelling of storm peak significant wave heights for the Gulf of Mexico and orth West Shelf of Australia. Using the methodology, metocean design conditions can be estimated for large spatial grids of locations, incorporating the effects of non-stationarity, adjusting for spatial dependence and uncertainty analysis in a sound and consistent fashion. In this sense, the methodology is a considerable improvement on current practice. For preliminary design at least, the methodology offers the possibility that previously-computed extreme value parameter and return value estimates might be browsed interactively via a suitable user interface throughout an ocean basin, providing immediate design criteria and removing the need for the metocean engineer to perform extreme value analysis at all. 2


")

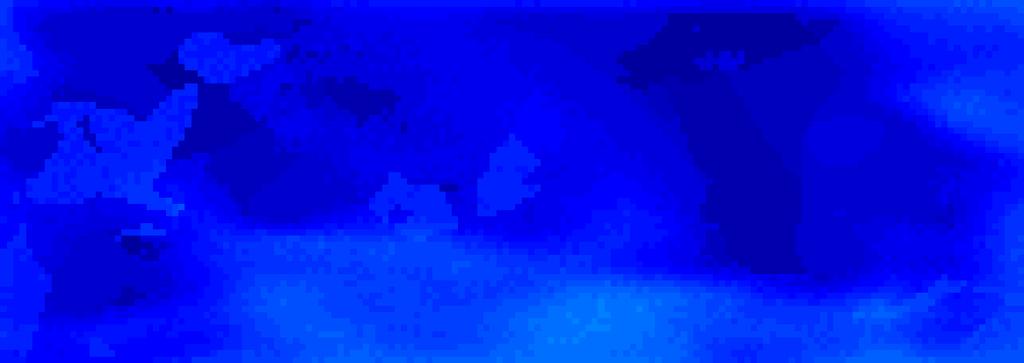


13 3 2 W E W SW E S 2 SE Rel. Latitude - - Rel. Longitude (a) W E W SW S SE E E SW - - W Rel. Latitude Rel. Latitude W E S SE - Rel. Longitude - (b) Rel. Longitude (c) Figure 8: Spatio-directional plots for quantiles of the -year return value distribution for the Gulf of Mexico: (a) median, (b) 2. and (c) 97. percentiles respectively. In each figure, the lower panel shows the omnidirectional estimate per location, and the 8 upper panels show estimates per directional sector per location for 8 directional octants centred (from left to right, top to bottom) on storms from W,, and E; W and E; SW, S and SE respectively. The common colour scale (in metres) is shown in (a). 3
14 Cumulative probability Cumulative probability (RLn, RLt -.87) (7, 6.) Storm peak H S (RLn, RLt.2) (7, 67.8) (RLn, RLt ) (7, 67.3) (39, 44.3) (27, 28.) (76, 74.6) Storm peak H S (RLn., RLt.2) (7, 6.) (RLn., RLt ) (7, 6.) (RLn., RLt -.87) (7, 6.7) (a) (7, 67.8) W W SW (23, 93.4) (b) S E SE E (RLn 2, RLt.2) (7, 6.) (RLn 2, RLt ) (7, 9.) (RLn 2, RLt -.87) (7, 7.8) (29, 279.2) (43, 42.6) (38, 369.) Figure 9: Validation of spatio-directional model by (a) spatial and (b) directional comparison of cumulative distribution functions (cdfs) for return value distributions of the original sample (red) with those from realisations under the model corresponding to the same time period as the original sample, shown in terms of the median (solid grey) and 9% uncertainty band (dashed grey). Figure (a) corresponds to omni-directional comparisons for a 3 3 grid of locations in the spatial domain, the relative longitudes and latitudes of which are given in the panel titles. The second pair of numbers in the panel title gives the number of observed and (average) simulated observations. Figure (b) gives a comparison of distributions for directional octants (for the same 3 3 grid of locations) centred (from left to right, top to bottom) on W,, and E; W and E; SW, S and SE respectively. Panel titles give the number of observed and (average) simulated observations. Return values are measured in metres. 4
15 It is important to consider the extent to which the capability to estimate large-scale non-stationary extreme value models rapidly, demonstrated here, is practically useful. From an engineering perspective, the consistency offered by application of a single basin-wide analysis is very attractive compared to ad-hoc analyses (often stationary) for single locations. However, it is also clear that a high spatial and directional resolution exists beyond which further increases in resolution are of little value. For example, directionally, the characteristics of storms are approximately stationary within a 2 3 sector in general; this suggests that, for extreme value analysis of storm severities, a directional resolution of approximately is probably sufficient in general. Similarly, spatial characteristics of storm severity are approximately stationary within a km neighbourhood in general, suggesting a limiting practical spatial resolution. Moreover, the characteristics of the sample from which inferences are to be made also obviously suggests limits to our ability to resolve non-stationary features. An important advantage of a non-parametric smoothing approach is the avoidance of the need for model comparison as a means of model selection. Penalised likelihood estimation provides optimally smooth parameter functions for a given sample. In this particular application, both the generalised Pareto shape and scale parameters are indeed near constant, but the rate of occurrence of threshold exceedances is clearly nonstationary. In other applications this may not be the case. The non-parametric penalised likelihood approach is equally and generally applicable. There are considerable opportunities for application and further development of this approach. The current work addresses extreme value modelling of one variate (e.g. storm peak H S ) conditional on multidimensional covariates (e.g. space-direction). Other recent work (e.g. [JER3]) has outlined how the method can be extended to the conditional modelling of one variate (e.g. storm peak current speed) given extreme values of another (e.g. storm peak H S ) and one or more covariates (e.g. current direction, storm direction and season). Further, spatial dependence models (e.g. [DPR2]) seek to characterise extremal spatial dependence across multiple locations as well as marginal non-stationarity. Such models are central to good metocean design; they are computationally even more complex than the current model, and would benefit considerably from the computational improvements developed here. Acknowledgments We would like to acknowledge the support and encouragement of Bertwim van Beest and Vianney Koelman from the Computational Technology Platform, metocean guidance from Graham Feld and Michael Vogel, and useful discussions with Shell colleagues in Bangalore and Manchester, and with colleagues at Lancaster University. References [API7] API. American Petroleum Institute - Interim Guidance on Hurricane Conditions in the Gulf of Mexico,. Bulletin 2IT-MET, 27. [BOM4] BOM. Tropical Cyclones in Western Australia, Bureau of Meteorology Accessed: [CDD] V. Chavez-Demoulin and A.C. Davison. Generalized Additive Modelling of Sample Extremes. J. R. Stat. Soc. C: Applied Statistics, 4:27, 2. [CDE6] I.D. Currie, M. Durban, and P.H.C. Eilers. Generalized Linear Array Models with Applications to Multidimensional Smoothing. J. R. Stat. Soc. B, 26. [Dav3] A. C. Davison. Statistical Models. Cambridge University Press, 23. [DPR2] A. C. Davison, S. A. Padoan, and M. Ribatet. Statistical Modelling of Spatial Extremes. Statistical Science, 27:6 86, 22. [DTV98] J. M. Dixon, J. A. Tawn, and J. M. Vassie. Spatial Modelling of Extreme Sea-levels. Environmetrics, 9:283 3, 998. [EM] P.H.C. Eilers and B.D. Marx. Splines, Knots and Penalties. Wiley Interscience Reviews: Computational Statistics, 2:637 63, 2. [Fos9] I. Foster. Designing and Building Parallel Programs. Addison-Wesley, 99. [FRW + ] G. Feld, D. Randell, Y. Wu, K. Ewans, and P. Jonathan. Estimation of storm peak and intra-storm directional-seasonal design conditions in the orth Sea. J. Offshore. Arct. Eng., 37:22:, 2. [GOM4a] GOM. U.S. Offshore Oil and Gas Accessed: [GOM4b] GOMOS8. Gulf of Mexico Oceanographic Study, Oceanweather, Inc. html, 24. Accessed: [ISO] ISO. International Standards Organization: Petroleum and atural Gas Industries - Specific Requirements for Offshore Structures. ISO 99-, 2. [JE7] P. Jonathan and K.C. Ewans. Uncertainties in Extreme Wave Height Estimates for Hurricane Dominated Regions. J. Offshore Mech. Arc. Eng., 29:3 3, 27. [JE8] P. Jonathan and K. C. Ewans. On Modelling Seasonality of Extreme Waves. In Proc. 27th Intl. Conf. Offshore Mech. Arc. Eng., 4-8 June, Estoril, Portugal, 28. [JE] P. Jonathan and K. C. Ewans. A Spatiodirectional Model for Extreme Waves in the Gulf of Mexico. ASME J. Offshore Mech. Arct. Eng., 33:6, 2. [JE3] P. Jonathan and K. C. Ewans. Statistical Modelling of Extreme Ocean Environments with Implications for Marine Design : A Review. Ocean Eng., 62:9 9, 23. [JER3] P. Jonathan, K.C. Ewans, and D. Randell. Joint Modelling of Extreme Ocean Environments Incorporating Covariate Effects. Coastal Eng., 79:22 3, 23. [JRWE4] P. Jonathan, D. Randell, Y. Wu, and K. Ewans. Return Level Estimation from on-stationary Spatial Data Exhibiting Multidimensional Covariate Effects. Ocean Eng., 88:2 32, 24. [Kam3] Alan Kaminsky. Big CPU, Big Data - Solving the World s Toughest Computational Problems with Parallel Computing. Creative Commons, 23.
MULTIDIMENSIONAL COVARIATE EFFECTS IN SPATIAL AND JOINT EXTREMES
 MULTIDIMENSIONAL COVARIATE EFFECTS IN SPATIAL AND JOINT EXTREMES Philip Jonathan, Kevin Ewans, David Randell, Yanyun Wu philip.jonathan@shell.com www.lancs.ac.uk/ jonathan Wave Hindcasting & Forecasting
Consistent Design Criteria for South China Sea with a Large-Scale Extreme Value Model
 Manuscript submitted to Offshore Technology Conference Asia, Kuala Lumpur, 2016 OTC-26668-MS Consistent Design Criteria for South China Sea with a Large-Scale Extreme Value Model L. Raghupathi, Shell India
Multidimensional covariate effects in spatial and joint extremes
 Multidimensional covariate effects in spatial and joint extremes P. Jonathan, K. Ewans and D. Randell Shell Projects & Technology Corresponding author: philip.jonathan@shell.com 13th International Workshop
Bayesian covariate models in extreme value analysis
 Bayesian covariate models in extreme value analysis David Randell, Philip Jonathan, Kathryn Turnbull, Mathew Jones EVA 2015 Ann Arbor Copyright 2015 Shell Global Solutions (UK) EVA 2015 Ann Arbor June
Proceedings of the ASME nd International Conference on Ocean, Offshore and Arctic Engineering OMAE2013 June 9-14, 2013, 2013, Nantes, France
 Proceedings of the ASME 2013 32nd International Conference on Ocean, Offshore and Arctic Engineering OMAE2013 June 9-14, 2013, 2013, Nantes, France OMAE2013-10187 MODELLING COVARIATE EFFECTS IN EXTREMES
Threshold estimation in marginal modelling of spatially-dependent non-stationary extremes
 Threshold estimation in marginal modelling of spatially-dependent non-stationary extremes Philip Jonathan Shell Technology Centre Thornton, Chester philip.jonathan@shell.com Paul Northrop University College
Statistics of extreme ocean environments: Non-stationary inference for directionality and other covariate effects
 Ocean Engineering v9 pp3- Statistics of extreme ocean environments: Non-stationary inference for directionality and other covariate effects Matthew Jones a, David Randell b, Kevin Ewans c, Philip Jonathan
On covariate smoothing for non-stationary extremes
 On covariate smoothing for non-stationary extremes Matthew Jones a, David Randell a, Kevin Ewans b, Philip Jonathan a, a Shell Projects & Technology, Manchester M RR, United Kingdom. b Sarawak Shell Bhd.,
Kevin Ewans Shell International Exploration and Production
 Uncertainties In Extreme Wave Height Estimates For Hurricane Dominated Regions Philip Jonathan Shell Research Limited Kevin Ewans Shell International Exploration and Production Overview Background Motivating
Statistical modelling of extreme ocean environments for marine design : a review
 Statistical modelling of extreme ocean environments for marine design : a review Philip Jonathan Shell Projects and Technology Thornton, CH1 3SH, UK. Kevin Ewans Sarawak Shell Bhd., 50450 Kuala Lumpur,
Estimation of storm peak and intra-storm directional-seasonal design conditions in the North Sea
 Estimation of storm peak and intra-storm directional-seasonal design conditions in the North ea Graham Feld hell Projects & Technology Aberdeen AB 3FY United Kingdom graham.feld@shell.com David Randell
Distributions of return values for ocean wave characteristics in the South China Sea using directional-seasonal extreme value analysis
 Environmetrics - () Distributions of return values for ocean wave characteristics in the outh China ea using directional-seasonal extreme value analysis D. Randell, G. eld, K. Ewans and P. onathan bstract
Flexible Spatio-temporal smoothing with array methods
 Int. Statistical Inst.: Proc. 58th World Statistical Congress, 2011, Dublin (Session IPS046) p.849 Flexible Spatio-temporal smoothing with array methods Dae-Jin Lee CSIRO, Mathematics, Informatics and
Efficient adaptive covariate modelling for extremes
 Efficient adaptive covariate modelling for extremes Slides at www.lancs.ac.uk/ jonathan Matthew Jones, David Randell, Emma Ross, Elena Zanini, Philip Jonathan Copyright of Shell December 218 1 / 23 Structural
Multi-Dimensional Predictive Analytics for Risk Estimation of Extreme Events
 Multi-Dimensional Predictive Analytics for Risk stimation of xtreme vents (ubmitted to the I High-Performance Computing, Data and Analytics Conference www.hipc.org/hipc) Laks Raghupathi, David Randell,
Evaluating environmental joint extremes for the offshore industry using the conditional extremes model
 Evaluating environmental joint extremes for the offshore industry using the conditional extremes model Kevin Ewans Sarawak Shell Bhd., 50450 Kuala Lumpur, Malaysia. Philip Jonathan Shell Projects and Technology
On the spatial dependence of extreme ocean storm seas
 Accepted by Ocean Engineering, August 2017 On the spatial dependence of extreme ocean storm seas Emma Ross a, Monika Kereszturi b, Mirrelijn van Nee c, David Randell d, Philip Jonathan a, a Shell Projects
Appendix 1: UK climate projections
 Appendix 1: UK climate projections The UK Climate Projections 2009 provide the most up-to-date estimates of how the climate may change over the next 100 years. They are an invaluable source of information
Modelling spatially-dependent non-stationary extremes with application to hurricane-induced wave heights
 Modelling spatially-dependent non-stationary extremes with application to hurricane-induced wave heights Paul Northrop and Philip Jonathan March 5, 2010 Abstract In environmental applications it is found
Accommodating measurement scale uncertainty in extreme value analysis of. northern North Sea storm severity
 Introduction Model Analysis Conclusions Accommodating measurement scale uncertainty in extreme value analysis of northern North Sea storm severity Yanyun Wu, David Randell, Daniel Reeve Philip Jonathan,
Uncertainty quantification in estimation of extreme environments
 First revised version, submitted to Coastal Engineering, June 2018 Uncertainty quantification in estimation of extreme environments Matthew Jones a, Hans Fabricius Hansen b, Allan Rod Zeeberg c, David
Bayesian inference for non-stationary marginal extremes
 Environmetrics 2016; 27: 439 450 Bayesian inference for non-stationary marginal extremes D. Randell, K. Turnbull, K. Ewans and P. Jonathan (First revision, accepted by Environmetrics June 2016 ) We propose
Design conditions for waves and water levels using extreme value analysis with covariates
 1 2 3 4 5 6 7 Design conditions for waves and water levels using extreme value analysis with covariates Graham Feld a, David Randell b, Emma Ross b, Philip Jonathan c,d, a Shell UK, Aberdeen AB12 3FY,
P -spline ANOVA-type interaction models for spatio-temporal smoothing
 P -spline ANOVA-type interaction models for spatio-temporal smoothing Dae-Jin Lee 1 and María Durbán 1 1 Department of Statistics, Universidad Carlos III de Madrid, SPAIN. e-mail: dae-jin.lee@uc3m.es and
Estimating surge in extreme North Sea storms
 Accepted by Ocean Eng. January 28. Revised version submitted to Ocean Engineering, December 27 Estimating surge in extreme North Sea storms Emma Ross a, Samta Sam b, David Randell a, Graham Feld c, Philip
Currie, Iain Heriot-Watt University, Department of Actuarial Mathematics & Statistics Edinburgh EH14 4AS, UK
 An Introduction to Generalized Linear Array Models Currie, Iain Heriot-Watt University, Department of Actuarial Mathematics & Statistics Edinburgh EH14 4AS, UK E-mail: I.D.Currie@hw.ac.uk 1 Motivating
SHAPE Pilot Albatern: Numerical Simulation of Extremely Large Interconnected Wavenet Arrays
 Available online at www.prace-ri.eu Partnership for Advanced Computing in Europe SHAPE Pilot Albatern: Numerical Simulation of Extremely Large Interconnected Wavenet Arrays William Edwards a bill.edwards@albatern.co.uk,
METOCEAN CRITERIA FOR VIRGINIA OFFSHORE WIND TECHNOLOGY ADVANCEMENT PROJECT (VOWTAP)
") METOCEAN CRITERIA FOR VIRGINIA OFFSHORE WIND TECHNOLOGY ADVANCEMENT PROJECT (VOWTAP) Report Number: C56462/7907/R7 Issue Date: 06 December 2013 This report is not to be used for contractual or engineering
METOCEAN CRITERIA FOR VIRGINIA OFFSHORE WIND TECHNOLOGY ADVANCEMENT PROJECT (VOWTAP) Report Number: C56462/7907/R7 Issue Date: 06 December 2013 This report is not to be used for contractual or engineering
SUPPLEMENTARY INFORMATION
 SUPPLEMENTARY INFORMATION DOI: 10.1038/NCLIMATE2336 Stormiest winter on record for Ireland and UK Here we provide further information on the methodological procedures behind our correspondence. First,
peak half-hourly New South Wales
 Forecasting long-term peak half-hourly electricity demand for New South Wales Dr Shu Fan B.S., M.S., Ph.D. Professor Rob J Hyndman B.Sc. (Hons), Ph.D., A.Stat. Business & Economic Forecasting Unit Report
152 STATISTICAL PREDICTION OF WATERSPOUT PROBABILITY FOR THE FLORIDA KEYS
 152 STATISTICAL PREDICTION OF WATERSPOUT PROBABILITY FOR THE FLORIDA KEYS Andrew Devanas 1, Lydia Stefanova 2, Kennard Kasper 1, Sean Daida 1 1 NOAA/National Wear Service, Key West, Florida, 2 COAPS/Florida
peak half-hourly Tasmania
 Forecasting long-term peak half-hourly electricity demand for Tasmania Dr Shu Fan B.S., M.S., Ph.D. Professor Rob J Hyndman B.Sc. (Hons), Ph.D., A.Stat. Business & Economic Forecasting Unit Report for
Modeling Spatial Extreme Events using Markov Random Field Priors
 Modeling Spatial Extreme Events using Markov Random Field Priors Hang Yu, Zheng Choo, Justin Dauwels, Philip Jonathan, and Qiao Zhou School of Electrical and Electronics Engineering, School of Physical
Verification challenges in developing TC response procedures based on ensemble guidance
 Verification challenges in developing TC response procedures based on ensemble guidance Grant Elliott Senior Metocean Meteorologist ECMWF UEF 2016 workshop Disclaimer and important notice This presentation
Climate Risk Profile for Samoa
 Climate Risk Profile for Samoa Report Prepared by Wairarapa J. Young Samoa Meteorology Division March, 27 Summary The likelihood (i.e. probability) components of climate-related risks in Samoa are evaluated
IT S TIME FOR AN UPDATE EXTREME WAVES AND DIRECTIONAL DISTRIBUTIONS ALONG THE NEW SOUTH WALES COASTLINE
 IT S TIME FOR AN UPDATE EXTREME WAVES AND DIRECTIONAL DISTRIBUTIONS ALONG THE NEW SOUTH WALES COASTLINE M Glatz 1, M Fitzhenry 2, M Kulmar 1 1 Manly Hydraulics Laboratory, Department of Finance, Services
1 Executive summary. 2 Principles of SAT-OCEAN service
 S SCOPE OF WORK FOR ROUTING SERVICES 1 Executive summary SAT-OCEAN has developed an innovative routing service enabling for significant time and energy savings. This solution is going beyond traditional
E. P. Berek. Metocean, Coastal, and Offshore Technologies, LLC
 THE EFFECT OF ARCHIVING INTERVAL OF HINDCAST OR MEASURED WAVE INFORMATION ON THE ESTIMATES OF EXTREME WAVE HEIGHTS 1. Introduction E. P. Berek Metocean, Coastal, and Offshore Technologies, LLC This paper
DYNAMIC POSITIONING CONFERENCE September 28-30, 2004 ENVIRONMENT METOCEAN PHENOMENA IN THE GULF OF MEXICO AND THEIR IMPACT ON DP OPERATIONS
 DYNAMIC POSITIONING CONFERENCE September 28-30, 2004 ENVIRONMENT METOCEAN PHENOMENA IN THE GULF OF MEXICO AND THEIR IMPACT ON DP OPERATIONS Chris Yetsko Fugro GEOS - Houston Presentation Overview Gulf
GLAM An Introduction to Array Methods in Statistics
 GLAM An Introduction to Array Methods in Statistics Iain Currie Heriot Watt University GLAM A Generalized Linear Array Model is a low-storage, high-speed, method for multidimensional smoothing, when data
New Zealand Fisheries Assessment Report 2017/26. June J. Roberts A. Dunn. ISSN (online) ISBN (online)
 ISBN (online)") Investigation of alternative model structures for the estimation of natural mortality in the Campbell Island Rise southern blue whiting (Micromesistius australis) stock assessment (SBW 6I) New Zealand
Investigation of alternative model structures for the estimation of natural mortality in the Campbell Island Rise southern blue whiting (Micromesistius australis) stock assessment (SBW 6I) New Zealand
PRMS WHITE PAPER 2014 NORTH ATLANTIC HURRICANE SEASON OUTLOOK. June RMS Event Response
 PRMS WHITE PAPER 2014 NORTH ATLANTIC HURRICANE SEASON OUTLOOK June 2014 - RMS Event Response 2014 SEASON OUTLOOK The 2013 North Atlantic hurricane season saw the fewest hurricanes in the Atlantic Basin
Space-time modelling of air pollution with array methods
 Space-time modelling of air pollution with array methods Dae-Jin Lee Royal Statistical Society Conference Edinburgh 2009 D.-J. Lee (Uc3m) GLAM: Array methods in Statistics RSS 09 - Edinburgh # 1 Motivation
New Intensity-Frequency- Duration (IFD) Design Rainfalls Estimates
 Design Rainfalls Estimates") New Intensity-Frequency- Duration (IFD) Design Rainfalls Estimates Janice Green Bureau of Meteorology 17 April 2013 Current IFDs AR&R87 Current IFDs AR&R87 Current IFDs - AR&R87 Options for estimating
New Intensity-Frequency- Duration (IFD) Design Rainfalls Estimates Janice Green Bureau of Meteorology 17 April 2013 Current IFDs AR&R87 Current IFDs AR&R87 Current IFDs - AR&R87 Options for estimating
Understanding Weather and Climate Risk. Matthew Perry Sharing an Uncertain World Conference The Geological Society, 13 July 2017
 Understanding Weather and Climate Risk Matthew Perry Sharing an Uncertain World Conference The Geological Society, 13 July 2017 What is risk in a weather and climate context? Hazard: something with the
Introduction. Chapter 1
 Chapter 1 Introduction In this book we will be concerned with supervised learning, which is the problem of learning input-output mappings from empirical data (the training dataset). Depending on the characteristics
Sensitivity of limiting hurricane intensity to ocean warmth
 GEOPHYSICAL RESEARCH LETTERS, VOL. 39,, doi:10.1029/2012gl053002, 2012 Sensitivity of limiting hurricane intensity to ocean warmth J. B. Elsner, 1 J. C. Trepanier, 1 S. E. Strazzo, 1 and T. H. Jagger 1
Cape Verde. General Climate. Recent Climate. UNDP Climate Change Country Profiles. Temperature. Precipitation
 UNDP Climate Change Country Profiles C. McSweeney 1, M. New 1,2 and G. Lizcano 1 1. School of Geography and Environment, University of Oxford. 2. Tyndall Centre for Climate Change Research http://country-profiles.geog.ox.ac.uk
WIND INTEGRATION IN ELECTRICITY GRIDS WORK PACKAGE 3: SIMULATION USING HISTORICAL WIND DATA
 WIND INTEGRATION IN ELECTRICITY GRIDS WORK PACKAGE 3: SIMULATION USING PREPARED BY: Strategy and Economics DATE: 18 January 2012 FINAL Australian Energy Market Operator Ltd ABN 94 072 010 327 www.aemo.com.au
OPTIMISING THE TEMPORAL AVERAGING PERIOD OF POINT SURFACE SOLAR RESOURCE MEASUREMENTS FOR CORRELATION WITH AREAL SATELLITE ESTIMATES
 OPTIMISING THE TEMPORAL AVERAGING PERIOD OF POINT SURFACE SOLAR RESOURCE MEASUREMENTS FOR CORRELATION WITH AREAL SATELLITE ESTIMATES Ian Grant Anja Schubert Australian Bureau of Meteorology GPO Box 1289
MONTE CARLO SIMULATION RISK ANALYSIS AND ITS APPLICATION IN MODELLING THE INCLEMENT WEATHER FOR PROGRAMMING CIVIL ENGINEERING PROJECTS
 MONTE CARLO SIMULATION RISK ANALYSIS AND ITS APPLICATION IN MODELLING THE INCLEMENT WEATHER FOR PROGRAMMING CIVIL ENGINEERING PROJECTS Pedram Daneshmand Associate Director Blue Visions Management (bluevisions)
2013 ATLANTIC HURRICANE SEASON OUTLOOK. June RMS Cat Response
 2013 ATLANTIC HURRICANE SEASON OUTLOOK June 2013 - RMS Cat Response Season Outlook At the start of the 2013 Atlantic hurricane season, which officially runs from June 1 to November 30, seasonal forecasts
MEASURED TROPICAL CYCLONE SEAS. S J Buchan, S M Tron & A J Lemm. WNI Oceanographers & Meteorologists Perth, Western Australia
 MEASURED TROPICAL CYCLONE SEAS S J Buchan, S M Tron & A J Lemm WNI Oceanographers & Meteorologists Perth, Western Australia 1. INTRODUCTION Wave forecasting and hindcasting usually entails spectral modelling,
Assessing Storm Tide Hazard for the North-West Coast of Australia using an Integrated High-Resolution Model System
 Assessing Storm Tide Hazard for the North-West Coast of Australia using an Integrated High-Resolution Model System J. Churchill, D. Taylor, J. Burston, J. Dent September 14, 2017, Presenter Jim Churchill
Additional file A8: Describing uncertainty in predicted PfPR 2-10, PfEIR and PfR c
 Additional file A8: Describing uncertainty in predicted PfPR 2-10, PfEIR and PfR c A central motivation in our choice of model-based geostatistics (MBG) as an appropriate framework for mapping malaria
DRAFT ON ENVIRONMENTAL CONTOURS FOR MARINE AND COASTAL DESIGN. Ole Christian Astrup Elzbieta Bitner-Gregersen Erik Vanem DNV-GL, 1363 Hovik, Norway
 Proceedings of 38th International Conference on Ocean, Offshore & Arctic Engineering OMAE2019 9-14 June, 2019, Glasgow, Scotland, UK OMAE2019-96587 DRAFT ON ENVIRONMENTAL CONTOURS FOR MARINE AND COASTAL
The Spatial Variation of the Maximum Possible Pollutant Concentration from Steady Sources
 International Environmental Modelling and Software Society (iemss) 2010 International Congress on Environmental Modelling and Software Modelling for Environment s Sake, Fifth Biennial Meeting, Ottawa,
Extending clustered point process-based rainfall models to a non-stationary climate
 Extending clustered point process-based rainfall models to a non-stationary climate Jo Kaczmarska 1, 2 Valerie Isham 2 Paul Northrop 2 1 Risk Management Solutions 2 Department of Statistical Science, University
Chapter 3 East Timor (Timor-Leste)
") Chapter 3 East Timor (Timor-Leste) 49 3.1 Climate Summary 3.1.1 Current Climate Despite missing temperature records for Dili Airport, it is probable that over the past half century there has been a warming
Chapter 3 East Timor (Timor-Leste) 49 3.1 Climate Summary 3.1.1 Current Climate Despite missing temperature records for Dili Airport, it is probable that over the past half century there has been a warming
Meteorological and Dispersion Modelling Using TAPM for Wagerup
 Meteorological and Dispersion Modelling Using TAPM for Wagerup Phase 1: Meteorology Appendix A: Additional modelling details Prepared for: Alcoa World Alumina Australia, P. O. Box 252, Applecross, Western
Evaporation Duct Height Climatology for Norwegian Waters Using Hindcast Data
 Evaporation Duct Height Climatology for Norwegian Waters Using Hindcast Data Petter Østenstad Norwegian Defence Research Establishment (FFI) Horten NORWAY Petter.Ostenstad@ffi.no Marthe Marie Meltzer Norwegian
Stochastic Hydrology. a) Data Mining for Evolution of Association Rules for Droughts and Floods in India using Climate Inputs
 Data Mining for Evolution of Association Rules for Droughts and Floods in India using Climate Inputs") Stochastic Hydrology a) Data Mining for Evolution of Association Rules for Droughts and Floods in India using Climate Inputs An accurate prediction of extreme rainfall events can significantly aid in policy
Stochastic Hydrology a) Data Mining for Evolution of Association Rules for Droughts and Floods in India using Climate Inputs An accurate prediction of extreme rainfall events can significantly aid in policy
CHAPTER 27 AN EVALUATION OF TWO WAVE FORECAST MODELS FOR THE SOUTH AFRICAN REGION. by M. Rossouw 1, D. Phelp 1
 CHAPTER 27 AN EVALUATION OF TWO WAVE FORECAST MODELS FOR THE SOUTH AFRICAN REGION by M. Rossouw 1, D. Phelp 1 ABSTRACT The forecasting of wave conditions in the oceans off Southern Africa is important
Building Blocks for Direct Sequential Simulation on Unstructured Grids
 Building Blocks for Direct Sequential Simulation on Unstructured Grids Abstract M. J. Pyrcz (mpyrcz@ualberta.ca) and C. V. Deutsch (cdeutsch@ualberta.ca) University of Alberta, Edmonton, Alberta, CANADA
April Forecast Update for North Atlantic Hurricane Activity in 2019
 April Forecast Update for North Atlantic Hurricane Activity in 2019 Issued: 5 th April 2019 by Professor Mark Saunders and Dr Adam Lea Dept. of Space and Climate Physics, UCL (University College London),
STATISTICAL DOWNSCALING FOR FUTURE EXTREME WAVE HEIGHTS IN THE NORTH SEA,,
 Submitted to the Annals of Applied Statistics arxiv: arxiv:0000.0000 STATISTICAL DOWNSCALING FOR FUTURE EXTREME WAVE HEIGHTS IN THE NORTH SEA,, By Ross Towe, Emma Eastoe, Jonathan Tawn and Philip Jonathan
GEOPHYSICAL RESEARCH LETTERS, VOL. 31, L20110, doi: /2004gl020843, 2004
 GEOPHYSICAL RESEARCH LETTERS, VOL. 31,, doi:10.1029/2004gl020843, 2004 A Poisson regression model approach to predicting tropical cyclogenesis in the Australian/southwest Pacific Ocean region using the
A Gaussian state-space model for wind fields in the North-East Atlantic
 A Gaussian state-space model for wind fields in the North-East Atlantic Julie BESSAC - Université de Rennes 1 with Pierre AILLIOT and Valï 1 rie MONBET 2 Juillet 2013 Plan Motivations 1 Motivations 2 Context
Structural Uncertainty in Health Economic Decision Models
 Structural Uncertainty in Health Economic Decision Models Mark Strong 1, Hazel Pilgrim 1, Jeremy Oakley 2, Jim Chilcott 1 December 2009 1. School of Health and Related Research, University of Sheffield,
ASSESMENT OF THE SEVERE WEATHER ENVIROMENT IN NORTH AMERICA SIMULATED BY A GLOBAL CLIMATE MODEL
 JP2.9 ASSESMENT OF THE SEVERE WEATHER ENVIROMENT IN NORTH AMERICA SIMULATED BY A GLOBAL CLIMATE MODEL Patrick T. Marsh* and David J. Karoly School of Meteorology, University of Oklahoma, Norman OK and
THE STUDY OF NUMBERS AND INTENSITY OF TROPICAL CYCLONE MOVING TOWARD THE UPPER PART OF THAILAND
 THE STUDY OF NUMBERS AND INTENSITY OF TROPICAL CYCLONE MOVING TOWARD THE UPPER PART OF THAILAND Aphantree Yuttaphan 1, Sombat Chuenchooklin 2 and Somchai Baimoung 3 ABSTRACT The upper part of Thailand
Fire Weather Drivers, Seasonal Outlook and Climate Change. Steven McGibbony, Severe Weather Manager Victoria Region Friday 9 October 2015
 Fire Weather Drivers, Seasonal Outlook and Climate Change Steven McGibbony, Severe Weather Manager Victoria Region Friday 9 October 2015 Outline Weather and Fire Risk Environmental conditions leading to
Deterministic vs. Ensemble Forecasts: The Case from Sandy
 Deterministic vs. Ensemble Forecasts: The Case from Sandy Robert Gall, David McCarren and Fred Toepfer Hurricane Forecast Improvement Program (HFIP); National Weather Service (NWS); National Oceanic and
The benefits and developments in ensemble wind forecasting
 The benefits and developments in ensemble wind forecasting Erik Andersson Slide 1 ECMWF European Centre for Medium-Range Weather Forecasts Slide 1 ECMWF s global forecasting system High resolution forecast
8.1.2 Climate Projections
 Chapter 8 Nauru 167 8.1 Climate Summary 8.1.1 Current Climate Over the past half century it is likely that there has been a warming air temperature trend at Nauru which is partly associated with warming
Multidimensional Density Smoothing with P-splines
 Multidimensional Density Smoothing with P-splines Paul H.C. Eilers, Brian D. Marx 1 Department of Medical Statistics, Leiden University Medical Center, 300 RC, Leiden, The Netherlands (p.eilers@lumc.nl)
A Numerical Simulation for Predicting Sea Waves Characteristics and Downtime for Marine and Offshore Structures Installation Operations
 K. Sadeghi, GAU J. Soc. & Appl. Sci., 3(5), 1-12, 2007 A Numerical Simulation for Predicting Sea Waves Characteristics and Downtime for Marine and Offshore Structures Installation Operations Kabir Sadeghi
CMIP5-based global wave climate projections including the entire Arctic Ocean
 CMIP5-based global wave climate projections including the entire Arctic Ocean 1 ST International Workshop ON Waves, storm Surges and Coastal Hazards Liverpool, UK, 10-15 September 2017 Mercè Casas-Prat,
RECOMMENDED PRACTICE FOR SITE SPECIFIC ASSESSMENT OF MOBILE JACK-UP UNITS
 RECOMMENDED PRACTICE FOR SITE SPECIFIC ASSESSMENT OF MOBILE JACK-UP UNITS GULF OF MEXICO ANNEX Revision 0 September 2007 Rev Issue Date Details 0 September 2007 Submitted to SNAME OC7 for Adoption Introduction:
A Conditional Approach to Modeling Multivariate Extremes
 A Approach to ing Multivariate Extremes By Heffernan & Tawn Department of Statistics Purdue University s April 30, 2014 Outline s s Multivariate Extremes s A central aim of multivariate extremes is trying
A High Resolution Daily Gridded Rainfall Data Set ( ) for Mesoscale Meteorological Studies
 for Mesoscale Meteorological Studies") National Climate Centre Research Report No: 9/2008 A High Resolution Daily Gridded Rainfall Data Set (1971-2005) for Mesoscale Meteorological Studies M. Rajeevan and Jyoti Bhate National Climate Centre
National Climate Centre Research Report No: 9/2008 A High Resolution Daily Gridded Rainfall Data Set (1971-2005) for Mesoscale Meteorological Studies M. Rajeevan and Jyoti Bhate National Climate Centre
APPENDIX B PHYSICAL BASELINE STUDY: NORTHEAST BAFFIN BAY 1
 APPENDIX B PHYSICAL BASELINE STUDY: NORTHEAST BAFFIN BAY 1 1 By David B. Fissel, Mar Martínez de Saavedra Álvarez, and Randy C. Kerr, ASL Environmental Sciences Inc. (Feb. 2012) West Greenland Seismic
INTEGRATING DIVERSE CALIBRATION PRODUCTS TO IMPROVE SEISMIC LOCATION
 INTEGRATING DIVERSE CALIBRATION PRODUCTS TO IMPROVE SEISMIC LOCATION ABSTRACT Craig A. Schultz, Steven C. Myers, Jennifer L. Swenson, Megan P. Flanagan, Michael E. Pasyanos, and Joydeep Bhattacharyya Lawrence
Some conditional extremes of a Markov chain
 Some conditional extremes of a Markov chain Seminar at Edinburgh University, November 2005 Adam Butler, Biomathematics & Statistics Scotland Jonathan Tawn, Lancaster University Acknowledgements: Janet
The National Spatial Strategy
 Purpose of this Consultation Paper This paper seeks the views of a wide range of bodies, interests and members of the public on the issues which the National Spatial Strategy should address. These views
Performance of the ocean wave ensemble forecast system at NCEP 1
 Performance of the ocean wave ensemble forecast system at NCEP 1 Degui Cao 2,3, Hendrik L. Tolman, Hsuan S.Chen, Arun Chawla 2 and Vera M. Gerald NOAA /National Centers for Environmental Prediction Environmental
April Forecast Update for Atlantic Hurricane Activity in 2018
 April Forecast Update for Atlantic Hurricane Activity in 2018 Issued: 5 th April 2018 by Professor Mark Saunders and Dr Adam Lea Dept. of Space and Climate Physics, UCL (University College London), UK
EXTREMAL MODELS AND ENVIRONMENTAL APPLICATIONS. Rick Katz
 1 EXTREMAL MODELS AND ENVIRONMENTAL APPLICATIONS Rick Katz Institute for Study of Society and Environment National Center for Atmospheric Research Boulder, CO USA email: rwk@ucar.edu Home page: www.isse.ucar.edu/hp_rick/
Uncertainty analysis of heliostat alignment at the Sandia solar field
 Available online at www.sciencedirect.com Energy Procedia 00 (2013) 000 000 www.elsevier.com/locate/procedia SolarPACES 2013 Uncertainty analysis of heliostat alignment at the Sandia solar field Rachel
Enhancing Weather Information with Probability Forecasts. An Information Statement of the American Meteorological Society
 Enhancing Weather Information with Probability Forecasts An Information Statement of the American Meteorological Society (Adopted by AMS Council on 12 May 2008) Bull. Amer. Meteor. Soc., 89 Summary This
August Forecast Update for Atlantic Hurricane Activity in 2016
 August Forecast Update for Atlantic Hurricane Activity in 2016 Issued: 5 th August 2016 by Professor Mark Saunders and Dr Adam Lea Dept. of Space and Climate Physics, UCL (University College London), UK
Combining Deterministic and Probabilistic Methods to Produce Gridded Climatologies
 Combining Deterministic and Probabilistic Methods to Produce Gridded Climatologies Michael Squires Alan McNab National Climatic Data Center (NCDC - NOAA) Asheville, NC Abstract There are nearly 8,000 sites
Pre-Season Forecast for North Atlantic Hurricane Activity in 2018
 Pre-Season Forecast for North Atlantic Hurricane Activity in 2018 Issued: 30 th May 2018 by Professor Mark Saunders and Dr Adam Lea Dept. of Space and Climate Physics, UCL (University College London),
Using satellite-based remotely-sensed data to determine tropical cyclone size and structure characteristics
 DISTRIBUTION STATEMENT A. Approved for public release; distribution is unlimited. Using satellite-based remotely-sensed data to determine tropical cyclone size and structure characteristics PI: Elizabeth
Investigation into the use of confidence indicators with calibration
 WORKSHOP ON FRONTIERS IN BENCHMARKING TECHNIQUES AND THEIR APPLICATION TO OFFICIAL STATISTICS 7 8 APRIL 2005 Investigation into the use of confidence indicators with calibration Gerard Keogh and Dave Jennings
July Forecast Update for North Atlantic Hurricane Activity in 2018
 July Forecast Update for North Atlantic Hurricane Activity in 2018 Issued: 5 th July 2018 by Professor Mark Saunders and Dr Adam Lea Dept. of Space and Climate Physics, UCL (University College London),
El Niño 2015/2016 Impact Analysis Monthly Outlook February 2016
 El Niño 2015/2016 Impact Analysis Monthly Outlook February 2016 Linda Hirons, Nicolas Klingaman This report has been produced by University of Reading for Evidence on Demand with the assistance of the
Modelling trends in the ocean wave climate for dimensioning of ships
 Modelling trends in the ocean wave climate for dimensioning of ships STK1100 lecture, University of Oslo Erik Vanem Motivation and background 2 Ocean waves and maritime safety Ships and other marine structures
FOWPI Metocean Workshop Modelling, Design Parameters and Weather Windows
 FOWPI Metocean Workshop Modelling, Design Parameters and Weather Windows Jesper Skourup, Chief Specialist, COWI 1 The Project is funded by The European Union Agenda 1. Metocean Data Requirements 2. Site
A NEW METHODOLOGY FOR EXTREME WAVES ANALYSIS BASED ON WEATHER- PATTERNS CLASSIFICATION METHODS. Sebastián Solari 1 and Rodrigo Alonso 1
 A NEW METHODOLOGY FOR EXTREME WAVES ANALYSIS BASED ON WEATHER- PATTERNS CLASSIFICATION METHODS Sebastián Solari 1 and Rodrigo Alonso 1 Extreme Value Analysis is usually based on the assumption that the