The development of a whole-head human finiteelement model for simulation of the transmission of bone-conducted sound
|
|
|
- Nathan Horton
- 5 years ago
- Views:
Transcription

1 The development of a whole-head human finiteelement model for simulation of the transmission of bone-conducted sound You Chang, Namkeun Kim and Stefan Stenfelt Journal Article Original Publication: N.B.: When citing this work, cite the original article. You Chang, Namkeun Kim and Stefan Stenfelt, The development of a whole-head human finite-element model for simulation of the transmission of bone-conducted sound, Journal of the Acoustical Society of America, (3), pp Copyright: Acoustical Society of America / Nature Publishing Group Postprint available at: Linköping University Electronic Press
2 The development of a whole-head human finite-element model for simulation of the transmission of bone-conducted sound You Chang 1), Namkeun Kim 2), and Stefan Stenfelt 1) 1) Department of Clinical and Experimental Medicine, Linköping University, Linköping, Sweden 2) Division of Mechanical System Engineering, Incheon National University, Incheon, Korea Running title: whole-head finite-element model for bone conduction 1
3 Abstract A whole head finite element model for simulation of bone conducted (BC) sound transmission was developed. The geometry and structures were identified from cryosectional images of a female human head and 8 different components were included in the model: cerebrospinal fluid, brain, three layers of bone, soft tissue, eye and cartilage. The skull bone was modeled as a sandwich structure with an inner and outer layer of cortical bone and soft spongy bone (diploë) in between. The behavior of the finite element model was validated against experimental data of mechanical point impedance, vibration of the cochlear promontories, and transcranial BC sound transmission. The experimental data were obtained in both cadaver heads and live humans. The simulations showed multiple low-frequency resonances where the first was caused by rotation of the head and the second was close in frequency to average resonances obtained in cadaver heads. At higher frequencies, the simulation results of the impedance were within one standard deviation of the average experimental data. The acceleration response at the cochlear promontory was overall lower for the simulations compared with experiments but the overall tendencies were similar. Even if the current model cannot predict results in a specific individual, it can be used for understanding the characteristic of BC sound transmission in general. PACS numbers: Bt, At 2
4 I. INTRODUCTION Bone conduction (BC) sound is vibration of the bones and soft tissues in the human head that ultimately causes a hearing sensation. Bone conducted sound is important as it is used for hearing testing (BC thresholds), communications, and hearing rehabilitation. One example of the latter is BC hearing aids for people with large conductive hearing losses or for patients needing amplification who cannot use conventional hearing aids (Snik et al., 2005). Even if it is different from air conduction (AC) sound transmission, BC sound is transmitted to the inner ear and causes a wave motion of the basilar membrane (Stenfelt et al., 2003), similar to that caused by AC sound (Békésy, 1932; Stenfelt, 2007). Due to the structural and geometrical complexity of the human head, the transmission of BC sound in the human head is complex and several physical phenomena are involved in hearing BC sound (Stenfelt and Goode, 2005). Since the beginning of the twentieth century, different aspects of BC response during vibratory stimulation have been described in the literature using experimental investigations of the human head with BC excitation in dry skulls, cadaver heads, and living humans (Eeg-Olofsson et al., 2008, 2011, 2013; Franke, 1959; Håkansson et al., 1986, 1994, 2008; Khalil et al., 1979; Stenfelt, 2012; Stenfelt and Goode, 2005a, b; Stenfelt et al., 2000). One often studied parameter of the human heads was the mechanical point impedance and another was the free resonances of the human head. Franke (1959) investigated dry skulls and reported the lowest resonance frequency of the human skull to be 500 Hz when it was filled with gel. Khalil et al. (1979) investigated two dry skulls (male and female) by experimental modal analysis and they found 11 resonance frequencies for the male skull and 6 for the female in the frequency range 20 Hz to 5 khz. The Håkansson group conducted extensive investigation on the parameters of the human head in live humans equipped with titanium fixtures in the skull bone for anchoring BC hearing aids. They reported the first two free skull resonance frequencies based on the mechanical point impedance of heads 3
5 in live humans to be on average 1000 Hz and 1500 Hz with standard deviations of 200 Hz and 270 Hz, respectively (Håkansson et al., 1986). Later, Håkansson et al. (1994) used modal analysis to extract the first two free resonance frequencies from six human skulls in vivo and reported the averages as 972 and 1230 Hz, respectively. Other investigations have focused on the vibration transmission of BC sound from the skull surface to the bone enclosing the cochlea. Stenfelt et al. (2000) measured the vibration of the bone close to the cochlea in a human dry skull in three orthogonal directions when the excitation was at the ipsilateral and contralateral mastoids as well as the forehead. The mechanical point impedance of the dry skull and the acceleration response of the bone at the cochlea (arcuate eminence of the temporal bone) were reported. Stenfelt and Goode (2005a) extended the study to human cadaver heads. They used six intact cadaver heads and reported the mechanical point impedance and the acceleration response of the cochlea promontory in three perpendicular directions with 27 stimulation positions over the occiput, vertex and forehead. Similar measurements but only in one direction were conducted by Eeg-Olofsson et al. (2008, 2011) on seven human cadavers and similar mechanical point impedance patterns were observed as well as BC sound transmissions. The vibration data from cadaver heads were extended to live humans by Eeg- Olofsson et al. (2013). They used hearing thresholds as well as the vibration response of the cochlear promontory in 16 live humans to predict the BC sound transmission. Håkansson et al. (2008) presented measurements in one cadaver for the comparison of the cochlear promontory vibration between percutaneous and transcutaneous BC stimulations. Stenfelt (2012), in unilateral deaf participants, reported the transcranial attenuation of BC sound to depend on the stimulation position and frequency. Due to practical as well as ethical reasons, most experiments involving direct measurement in living human participants to investigate BC sound are not possible. Also, the complexity of the experimental manipulations as well as the large number of test subjects to estimate the variability of the results are 4
6 difficult to achieve. Moreover, because of the individual differences of test objects, the reproducibility and comparability of experiments are other problematic. One way to overcome some of these problems is to use a simulation model for BC sound transmission in the human skull. Several finite element (FE) whole head models have been presented with the aim to investigate stress patterns from head injuries (Kleiven and Hardy, 2002; Luo et al., 2012; Ji et al., 2013; Sahoo et al., 2013). Some tissues and geometries important for BC sound transmission were ignored in these models. In a 3D FE model by Kim et al. (2014) BC sound analysis was reported for a human dry skull. The drawback of that model was that only the dry skull response was captured and that does not represent the true response of BC sound in a human head. Taschke and Hudde (2006) presented another 3D FE model of the human head and reported the vibration pattern of the middle ear and inner ear. However, this head model only includes two parts: the skull and the soft tissues. Other pathways of BC sound were excluded. In a 3D FE model of the human external ear by Brummund et al. (2014) the BC occlusion effect was investigated. The limitation of such model is that a partial model is unable to describe the real vibration response of BC sound in the head. For example, the transcranial transmission and the effect of contralateral stimulation were ignored. The aim of the current study was to develop a FE model of the human head that can simulate BC sound transmission. The FE model should have the real geometry and structure of a human head and the comprised tissues should be represented by their real mechanical parameter values. The FE model should simulate vibration patterns of the human head similar to those found with experiments in cadaver and live human heads. 5
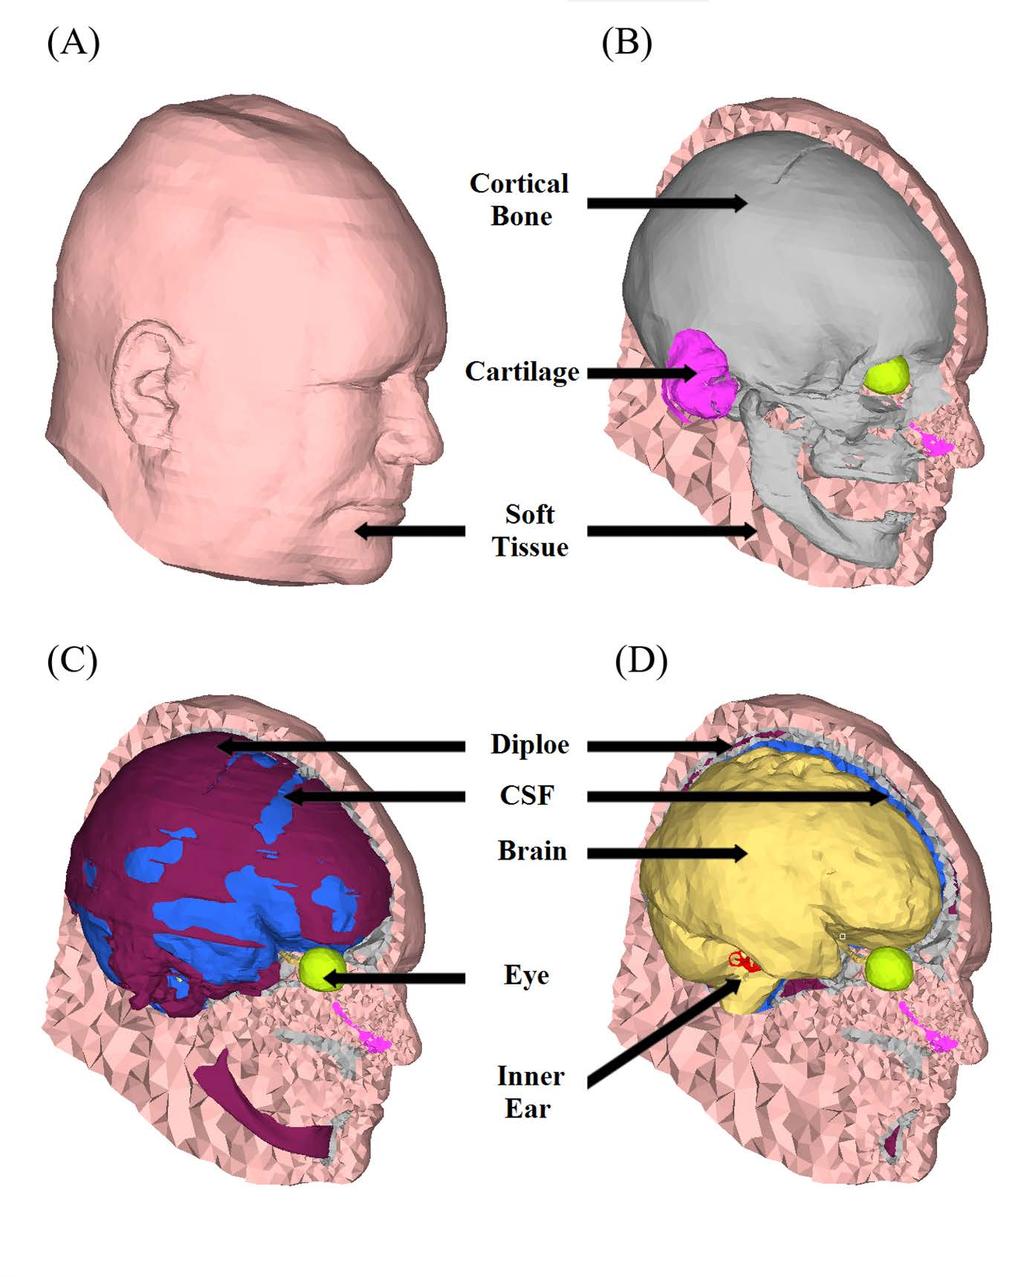
7 II. MATERIALS AND METHODS Through the Visible Human Project ( cryosectional images of an adult female cadaver head were obtained and used to reconstruct the geometry of the FE model (FIG. 1). The original cryosectional images have a voxel size of 0.33x0.33x0.33 mm. To get the intact geometry of the human head, 703 images were used, from the top of the head to the bottom of the chin. The FE model contained eight domains: (1) the brain, (2) cerebrospinal fluid (CSF), (3) eye balls, (4) inner ears, (5) cartilages, (6) cortical bone (including teeth), (7) soft bone (diploë), and (8) soft tissues (FIG. 2). A. Finite element model of a human head The eight domains were identified in the cryosectional images. The space between the brain and the skull was assumed to be CSF. The brain, cerebellum, and part of the brainstem were modelled as brain tissue. The nerves, like the optic and auditory nerves, were also modeled as brain tissue. The skull bone was reconstructed as a three-layer structure comprised of two different materials. The inner and outer layers were cortical bones with diploë (spongy bone structure) inbetween. The teeth were modeled as cortical bone. The vertebrae were removed, as well as the extension of the brainstem towards the spinal cord, and this space was filled with soft tissue. The auricular cartilages were included as both the pinna and the ear canal can influence BC sound (Stefan and Goode, 2005a). Also, the nasal cartilages were included in the model. Due to the limited resolution of the cryosectional images and the complex anatomy of the human head, other tissues such as skin, fat, muscle, blood, lymph, etc., were all classified as soft tissue. This simplification was also done to reduce the demands on memory and time consumption for the computations. The meshes for the different structures in the FE head model were created by Hypermesh (Altair Engineering, Troy, MI, USA). The final FE model consists of 87,000 nodes and 481,000 four-noded 6
8 tetrahedron elements. The structures and components of the FE model are shown in FIG. 2. The model was computed by an FE solver (ACTRAN, MSC Software Corp., Newport Beach, CA, USA) and solved the coupled Helmholtz equation and force-equilibrium equation for acoustic and solid materials, respectively. The simulation was performed in the frequency domain from 0.1 to 10 khz with a frequency resolution of 25 Hz up to 0.5 khz, 50 Hz resolution between 0.5 and 1.0 khz, and 100 Hz resolution above 1.0 khz. The material properties in the FE model were obtained from previously published experimental data and other FE human head models. The CSF is treated as liquid and the eyeballs and the inner ears are filled with liquid. These liquids have essentially the same properties as water (Levin et al., 1981) and their material properties are modeled as water. In most FE head models for head injury simulations, the brain has been modeled as a hyperelastic or viscoelastic material with high Poisson s ratio (close to 0.5) (Kleiven and Hardy, 2002; Luo et al., 2012; Sahoo et al., 2013). However, compared with the excitation level used in head injury models, the stimulation intensity of BC sound is low and the structure of the brain is intact during the excitation. Therefore, the brain was modeled as an elastic material with low Young s modulus. It should be noted that in the current version of the model, the inner ear only contains fluid and the minute details of the inner ear structures such as the basilar membrane and the organ of Corti were omitted from the model. These fine structures were not identifiable in the cryosectional images. The human skull bone has a three-layered sandwich structure, where the middle layer consists of liquid filled spongy bone (diploë), whereas the outer and inner layers consist of hard (cortical) bone. Fry and Barger (1978) measured the densities and found them to be 1,870 kg/m 3 for the outer layer, 1,910 kg/m 3 for the inner layer, and 1,740 kg/m 3 for the middle layer (diploë). In a more recent study, Peterson and Dechow (2003) reported the density of the cortical bone to be 1,869±104 kg/m 3 for the outer layer and 1,813±127 kg/m 3 for the inner layer. In most FE models of the human head, the density of the cortical 7
9 bone ranges from to 1,900 kg/m 3 and that of the diploë ranges from 1,000 to 1,500 kg/m 3 (Kleiven and Hardy, 2002; Luo et al., 2012; Sahoo et al., 2013). Most FE models for head injury have used a high Young s modulus of the bones, about 15 GPa for the cortical bones and 5 GPa for the diploë. However, the Young s modulus of a live human skull may not have such high stiffness. McElhaney et al. (1970) measured the Young s modulus in fresh human cranial bone to be on average 2.4±1.5GPa. Motherway et al. (2009) reported the average elastic modulus of cranial bone, tested at dynamic speeds of 0.5, 1 and 2.5 m/s, to be 7.467±5.39 GPa, ±9.38 GPa and ±10.29 GPa. Auperrin et al. (2014) measured the average Young s modulus as 3.81±1.55 GPa in the frontal bone, 5.00±3.12 GPa in the parietal bone, and 9.70±5.75 GPa in the temporal bone. Thus, according to the experimental data, the fresh human skull has a lower Young s modulus than used in previous head models. In the current model a Young s modulus of 4 GPa and a density of 2,200 kg/m 3 was used for cortical bone (Table I). Due to the spongy structure of the diploë, the Young s modulus of the diploë of most head injury models is normally modeled as one or one and a half orders of magnitude lower than the cortical bone at the same position (1 GPa for Kleiven and Hardy, 2002; GPa for Sahoo et al., 2013; GPa for Valášek et al., 2014). One model reported by Wang et al. (2014) used a Young s modulus of the diploë as low as 40 MPa. However, based on experimental data, Jaasma et al. (2002) reported Young s modulus of 0.431±0.217 GPa for the diploë of the human mandible, Keaveny et al. (1997) reported 0.075±0.032 GPa for the human vertebra, and Hamed et al., (2012) reported ± GPa for the human tibia. Experimental results for Young s modulus of trabecular bone are on the lower side of the values reported in most head injury models. Therefore, the Young s modulus for the diploë in the current study was set to 0.4 GPa and the density was 1,000 kg/m 3 (Table I). The soft tissue in the FE model is mainly composed of fat, muscle, blood and lymph. The densities of blood and lymph are similar to that of water. The fat has a slightly lower density than water (900 kg/m 3, Farvid et al., 2005) and muscle has a slightly higher density (between 1,050 and 1,100 kg/m 3, Ward and 8
10 Lieber, 2005; Urbanchek et al., 2001). Accordingly, the density of the soft tissue should be close to that of water. In a FE model of the human head, Taschke (2005) used a density for the soft tissue of 890 to 1,170 kg/m 3 and 0.05 MPa as the Young s modulus. In another model, Kim et al. (2010) used a Young s modulus of MPa for fat and 0.5 to 0.79 MPa for muscle. As the elasticity parameter of the soft tissue primarily depends on the fat and muscles, the Young s modulus was chosen as an intermediate value. Here, the soft tissue is modeled with a density of 900 kg/m 3 and the Young s modulus was set to 0.7 MPa (Table I). For simplicity, blood and lymph that are liquids, were included in the soft tissue part that is modeled as a soft solid. These structures are small compared to the wavelength for sound important for hearing, and this simplification is believed to have a small impact on the simulated results. In previously published models, Taschke (2005) used 1,100 kg/m 3 and 3 MPa as density and Young s modulus for the cartilage while Brummund et al. (2014) used 1,080 kg/m 3 and 7.2 MPa for the same in their FE model. Experimental data for the material properties of cartilage have also been published. Maroudas et al. (1969) measured the density of human adult auricular cartilage as 1,080±10 kg/m 3 and Cox and Peacock (1979) measured the density of the ear cartilage in rabbits as 1,060±40 kg/m 3. Grellmann et al. (2006) measured the Young s modulus of the nasal septum cartilage to be 7.2±3.4 MPa for adult humans. The values of the cartilage for the current model were chosen as 1,000 kg/m 3 for the density and 7.5 MPa for the Young s modulus. Viscoelasticity of the soft tissues and the diploë were represented by using a complex Young s modulus. Specifically, the loss factor was defined as the ratio between the real and imaginary part of the complex Young s modulus. Then, the loss factor was modeled to be proportional to the excitation frequency. For example, for a viscoelastic material, if the loss factor was 0.01 at 1 khz, the values at 0.1 khz and 10 khz were and 0.1, respectively. 9
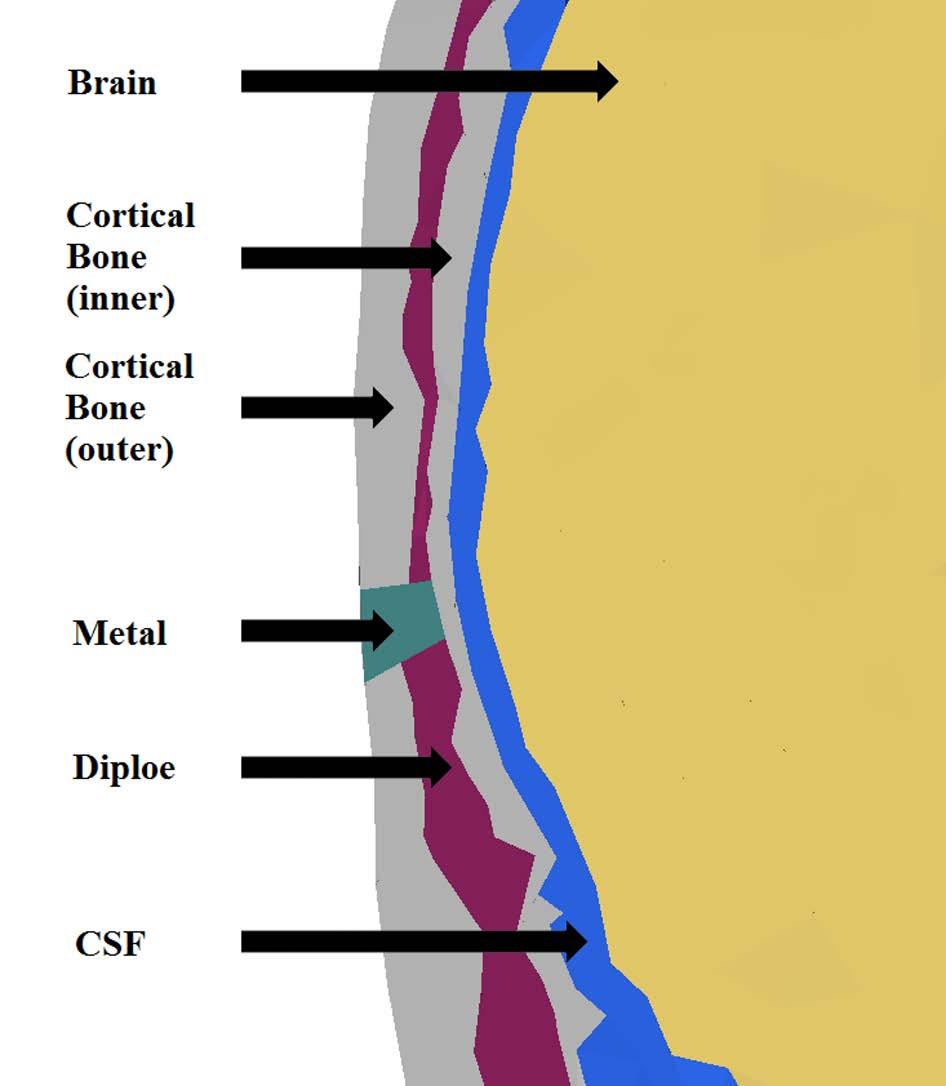
11 All values of the material properties of the current FE human head model are shown in Table Ⅰ. With the chosen densities of the included materials the total mass of the model is 4.96 kg. The dimensions of the whole head and the skull bone is shown in FIG. 3. B. Simulation setup Several experiments investigating BC sound transmission have used human cadaver heads or living subjects (Eeg-Olofsson et al., 2008, 2011, 2013; Håkansson et al., 1986, 1994, 2008; Stenfelt et al., 2000; Stenfelt and Goode, 2005b; Stenfelt, 2012). In all these studies except Eeg-Olofsson et al. (2013), screws were implanted into the skull-bone to attach the vibrator providing the stimulation. The positions of the screws were also the spots for the mechanical point impedance measurements. Although numerous stimulation positions were used in the experiments, a few positions were common to most studies. These were (1) the forehead position, which is in the center of the forehead; (2) the bone conduction hearing aid position, also known as the BAHA position, which is positioned approximately 55 mm behind the ear canal opening in line with the upper part of the pinna; (3) the mastoid position, which is approximately mm behind the ear canal opening, as close to the pinna as possible; and (4) a position between the mastoid and BAHA positions. These four positions were used for stimulation for the validation of the current FE model. The forehead position was termed P0 while the others were termed P1 to P3 from furthest away to closest to the ear canal. The stimulation positions are shown in FIG. 4A. Except for the forehead position, all positions were located on both sides of the skull. In the experimental studies, mini-transducers or vibrators were rigidly attached to the screw-skull system to excite the skull. In the simulations of the FE model, a small steel structure was added at each stimulation position on the skull to simulate the effect of the screw. This simulated screw has approximately the same depth and cross sectional area as the screws used in the experiments (most experiments used screws with 10
12 a diameter of 3 mm). Figure 5 shows the screw inserted in the bone where the screw starts at the outer surface of the skull bone, through the outer layer of cortical bone and the middle layer of diploë, and attach to the inner layer of the cortical bone. This ensured that the excitation were in all three layers of the bone. In the previously reported BC experiments, the human head was placed on a soft pillow resulting in a decoupling of the head from the support. The same boundary condition was used for the simulations where the FE model was freely movable at the outer boundary, even for the boundary condition at the bottom (cut) surface of the neck. A common outcome from experiments in human cadavers or living humans is the acceleration of the cochlear promontory (Eeg-Olofsson et al., 2008, 2011; Håkansson et al., 2008; Stenfelt & Goode, 2005b) which is related to the perception of BC sound (Eeg-Olofsson et al., 2013). In the current study, nodes at the positions of the ipsilateral and contralateral cochlear promontories in the experiments were used for the calculation of the acceleration. These positions are indicated in FIG. 4B. Most of the experimental BC studies the stimulation and response directions were not explicitly stated, or it was just stated that the response was measured in the direction of the stimulation. Stenfelt and Goode (2005b) was the only study, to our knowledge, which presented data on the vibration response in three well-defined orthogonal directions. In the current study three perpendicular directions were defined for the calculation, according to the definition in Stenfelt and Goode (2005b), shown in FIG. 4. The directions are: the x direction (towards the middle of the head; medial), the y direction (towards the top of the head; superior) and the z direction (towards the front of the head; anterior). The x directions on both sides are defined to be aimed toward the center of the head. 11
13 The surface of the skull is curved. In the experiments, where stated, the inputs were perpendicular to the surface of the skull. This means that the inputs may not be aligned along just one coordinate direction (x, y, or z). A similar approach was used in this study and the direction of the stimulation is perpendicular to the skull surface at the stimulation position. The vector components of the stimulation directions are given in Table Ⅱ. C. Mechanical point impedance The mechanical point impedance (Zmech) is defined as the quotient of the excitation force FF and the response velocity υυ at the same position and in the same direction as the applied force: F Z mech =. (1) υ Zmech is a measure of the structure s resistance to motion when an excitation force is applied and is a complex value as it depends on both magnitude and phase of the force and the resulting velocity. The higher the magnitude of the impedance, the lower the vibration magnitudes for a given force. In the current study, the Zmech was measured at all seven stimulation positions. The head was hypothesized to be symmetrical about the sagittal plane and the simulations on the right and left sides of the skull were averaged; the results from the forehead position are based on a single position. D. Mesh convergence A mesh convergence analysis of the model was conducted. Besides the adaptive meshing in Hypermesh, the model was re-simulated with three different numbers of elements, similar to Srinivasa et al. (2012). The number of elements were decreased by 4.4% and 6.0%, and increased by 12.8% compared with the 12
14 original simulations. For the analysis, stimulation at position P1 was used with the measures of mechanical point impedance (Zmech) and acceleration of the cochlear promontory. E. Parameter studies The simulation result depend on the parameter values presented in TABLE I. Therefore, the sensitivity of these parameters for the sound transmission in the model were investigated. This investigation was conducted by analyzing the mechanical point impedance and acceleration of the cochlear promontory while varying the mechanical properties of several components in the current head model such as soft tissues, cortical bone, diploe, CSF, and brain tissue. For the solid elements the Young s modulus, Poisson s ratio, and density were varied whereas sound speed and density were varied for fluid elements. The values were increased and decreased by a factor of 10 except for the Poisson s ratio that was set to 0.15, 0.3, and The analysis was done with stimulation at position P1. 13
15 III. RESULTS In the present study, the stimulation positions P0, P2 and P3 were similar to positions forehead 0, occiput 3 and occiput 4 in the Stenfelt and Goode (2005b) study. The mechanical point impedance results from the current model are compared with the Stenfelt and Goode (2005b) data at those three positions. Also, the acceleration of the cochlear promontory in three perpendicular directions when the stimulation are at positions P0, P2 and P3 are compared to the results from Stenfelt and Goode (2005b). According to Eeg-Olofsson et al. (2008, 2011 and 2013) their measurement direction was towards the middle of the head, similar to the x direction here. In this study, cochlear vibration response with stimulation at the P1 position was compared with the data measured with the stimulation at the BAHA position in Eeg-Olofsson et al. (2008, 2011) for cadaver heads and in Eeg-Olofsson et al. (2013) for live humans. All cochlear vibration responses from the above experimental studies with stimulation at the BAHA position were only measured in the x direction (the lateral-medial direction). Moreover, experimental data with stimulation at the BAHA position in live humans from Håkansson et al. (1986) and Håkansson et al. (1994) were used for comparison and these were also measured in the x direction. A. Mechanical point impedance The magnitude and phase of the mechanical point impedance (Zmech) results are shown in FIG. 6. The results at position P1 were compared with the average data from Håkansson et al. (1986) obtained from seven live participants with implanted titanium screws for the BAHA. The results for the other positions were compared with published experimental data from Stenfelt and Goode (2005b) (averages of six cadaver heads). 14
16 At frequencies below 600 Hz, the magnitudes of the calculated Zmech show a greater frequency dependence than the averages of the experimental data. If the low-frequency resonances are ignored, the general tendency of the simulated Zmech magnitudes at low frequencies are in good agreement with the experimental data. Above 600 Hz, the simulation magnitude results are generally within 6 db of the mean experimental results. The phases of the simulation results are also influenced by the low-frequency resonances with large deviations compared with the averages of the experimental data. At higher frequencies, the phases of the simulation results agree with experimental data measured in cadavers (P0, P2 and P3) and they are typically within 10 degrees below 3 khz and up to 40 degrees above 3 khz, except for the highest frequencies with stimulation at P0 where the difference is closer to 60 degrees. When stimulation is compared to live humans with stimulation at P1, there is a difference between the simulation and experimental results at the highest frequencies where the simulation is close to 20 degrees while the average experimental phase is approximately -80 degrees. The FE model used for the simulations follows the trend of stiffness dominated high-frequency mechanical point impedance similar to the experimental results. Also, most of the simulation mechanical impedance data are within the range of the experimental data as indicated by the error bars showing the standard deviations from the experiments. The fluctuations of the magnitude and phase of the simulated mechanical point impedance at low frequencies indicate that there are several resonances close in frequency. This finding is similar for all positions. At the lowest frequencies, the magnitudes of the Zmech obtained with the FE model increase with frequency. Above approximately 600 Hz, the magnitude of the Zmech of the FE model shows a negative slope and the phase is negative. This is similar to the experiments which indicate that the stiffness influences the impedance at these frequencies. The experimental data shown are averages from 6 (P0) and 12 (P2 and P3) measurements (Stenfelt and Goode, 2005b). The second peaks of the magnitude of the mechanical point impedance are closed to the peaks of the averaged experimental data. When investigating the individual measurements of the mechanical point impedance in Stenfelt and Goode (2005b) there are 15
17 indications of several resonances in the low-frequency region similar to the simulation results seen here. Håkansson et al. (1986) also reported a low-frequency double-peak in the magnitude response of the mechanical point impedance of live humans (P1) indicative of multiple resonances in this frequency region. Consequently, the multiple resonances in the 150 to 400 Hz range seen in the simulations are also reported for Zmech in cadaver heads and live humans. B. Accelerance responses The accelerances (defined as response acceleration divided by the stimulation force) from the simulations and previous experiments are presented in FIG. 7 and FIG. 8. The results are grouped according to stimulation position and response direction. The P1 position (BAHA) is shown in FIG. 7 and compared with experimental data from cadavers and living humans. The data from cadaver heads on ipsilateral and contralateral cochlear responses were published by Eeg-Olofsson et al. (2008) and Eeg- Olofsson et al. (2011), respectively. The data in living humans were measured by Eeg-Olofsson et al. (2013). Only levels in the x direction are shown in FIG. 7. In FIG. 8, stimulation at the other three positions are compared with the cadaver head data from Stenfelt and Goode (2005b) in three directions as magnitude and phase. The panels labeled ipsilateral P2 and ipsilateral P3 are the accelerances of the ipsilateral cochlear promontory while panels labeled contralateral P2 and contralateral P3 are the accelerances of the contralateral cochlear promontory when stimulation is at positions P2 and P3, respectively. The results of the FE model are represented by solid lines while the experimental data from cadaver heads and living humans are indicated by dashed lines and dashed-dotted lines, respectively. As shown in FIGs 7 and 8, although not equal, the accelerance results of the model show an overall resemblance with the experimental data for both magnitude and phase. Among the stimulation positions on the ipsilateral side including P0, the distance from the measurement position is greatest for P0, second greatest for P1 and least for P3. The level difference between the ipsilateral simulation and experiment 16
18 results is smallest when the stimulation position is closest to the cochlea whereas it is greatest when the stimulation is furthest away from the cochlea. However, this trend was not found in the results from the contralateral stimulation positions. In FIG. 7, the FE model accelerance level at both sides (solid line) is in better agreement with the data obtained from the cadaver heads (dashed line) than the live human data (dash-dotted line). At frequencies below 300 Hz, the simulation results have larger fluctuations due to the low-frequency resonances, but the trend is similar to the experimental data. The difference between the simulation accelerances and the cadaver head accelerances at frequencies below 2.5 khz is mostly within 5 db with a difference up to 10 db in a few frequency areas. There are anti-resonances at 3 khz and 10 khz in the ipsilateral and at 5 khz and 9.5 khz in the contralateral simulation data. At these frequencies the difference between simulation and experimental averaged accelerances are greater than at the other frequency areas (up to 20 db in the ipsilateral and closed to 25 db in the contralateral simulation). Otherwise, the difference between the ipsilateral simulation and experimental accelerances are mostly below 10 db and between the contralateral simulation and experimental accelerances the difference is bound by 15 db. When the stimulation position is P0 (forehead) in FIG. 8, the orientation of the stimulation force was primarily in the anterior-posterior direction (z direction, Table Ⅱ). At low frequencies, the response accelerances of the cochlear promontory of the FE model was greatest in this directions and most similar to the experimental results. The level difference between the experimental data and the simulated data in FIG. 8 for P0 was up to 30 db for frequencies below 0.3 khz while it was mostly between 0 and 10 db for the higher frequencies. Larger differences appeared at anti-resonances of the simulated data giving lower response accelerances than at surrounding frequencies. The response from the simulations gives overall lower accelerances levels than those measured experimentally in Stenfelt and Goode (2005b), this is also true for stimulation at positions P2 and P3, for both ipsilateral and contralateral responses. 17
19 For the positions located on the side of the head (P2 and P3), the stimulation force acts mainly in the lateral-medial direction. For these positions, results of the model in the x direction were overall most similar to the published data, especially with contralateral excitation. In the x direction, the simulated accelerances are within 5 db of the average cadaver head data from Stenfelt and Goode (2005b) at frequencies between 0.3 and 5 khz, outside this frequency range the differences are around 10 db but can amount to 20 db at the highest frequencies. For the directions perpendicular to the stimulation direction the accelerances are within 20 db of the Stenfelt and Goode (2005b) data with an overall difference for the ipsilateral responses of 10 db that is closer to 20 db for the contralateral responses. One reason for the greater differences in the perpendicular directions are the non-ideal one-dimensional excitation of the transducer used for the experimental data while the simulations are purely excited in one direction. According to Stenfelt et al. (2002) the difference between the in-line excitation and the perpendicular directions was 10 to 20 db at frequencies up to approximately 5 khz and as low as 5 db at higher frequencies. The responses of the simulations in the x direction with P2 and P3 stimulation and in the z direction with P0 stimulation show overall higher levels of the accelerances in comparison with results in the perpendicular directions. This is also found in the experimental data. For the P2 and P3 positions, the results of the phase in the x direction for ipsilateral stimulations are nearly identical to the experimental data while they show an increasing difference with frequency amounting to about 1 cycle less phase accumulation at the highest frequencies. This may indicate that the wave speed for BC sound in the simulations is higher than in the experiments indicating shorter time delays and less phase accumulation. It could also be due to resonance frequencies causing rapid phase decay present in the experimental data not found in the simulations. In the other directions, there are larger differences between the experimental reported phase and the phase from the simulated accelerances. Part of this difference is attributed to isolated resonances and/or anti-resonances in either the experimental or the simulated data causing rapid phase shifts. Consequently, part of the difference might be explained by 18
20 different phase wrapping in the simulation and experimental data and not necessarily by significant structural differences such as differences in pathways or wave speed. An alternative method to compare the acceleration at the cochlear promontory for different stimulation positions is to calculate a total acceleration for each frequency (Stenfelt et al, 2000; Stenfelt and Goode, 2005b). The total acceleration can be calculated as a quadratic summation of the three orthogonal components. The computation is: a = a a + a a + a a. (2) 2 tot x * x y * y z * z where the a tot is the total acceleration and a x, a y and a z represent the acceleration components in the x, y and z directions, respectively. The * in Equation (2) indicates the complex conjugate. The total accelerance (the total acceleration divided by applied force) of the cochlear promontories when a force is applied to the P2, P3, and P0 are displayed in FIG. 9 (responses from P1 is only in one direction and is omitted here). With the stimulation at the sides, the simulation results for all positions are 5 to 15 db lower than the experimental data. When the stimulation is at P0, the simulated total accelerance level is up to 20 db lower than the experimental data, with a difference of around 30 db at 250 Hz. This difference between the simulation and experiment diminish with frequency and at frequencies above 1 khz, the difference is between 5 and 10 db with the simulated data having the lowest levels. C. Transcranial transmission 19
21 If the stimulation level at a position is high enough, the BC sound can be heard by both the ipsilateral and contralateral cochleae. The difference in sensitivity between the two sides of the transmitted BC sound is often termed transcranial attenuation (Stenfelt, 2012). Because the human skull is fairly symmetrical, the transcranial attenuation is assumed to be the same whether it is measured as the difference at the two cochleae with stimulation from one stimulation position, or measured at one cochlea with the stimulation positions at the ipsilateral and contralateral side of the skull. In this study, the transcranial transmission, the opposite of transcranial attenuation, is defined as the acceleration response at the contralateral cochlear promontory relative to the acceleration response at the ipsilateral cochlear promontory for a specific stimulation position. Transcranial transmissions for positions P2 (solid line) and P3 (dashed-dotted line) are presented in FIG. 10. Also included in FIG. 10 are the experimental data from Stenfelt and Goode (2005b), the dashed line and dotted line for P2 and P3, respectively. The analysis is conducted for the total acceleration according to Eq. (2) as well as the magnitude and phase of the acceleration in the x direction (the main direction of the stimulation). The simulation results are calculated by taking an average from the results at both sides of the FE model to reduce the effects of bilateral differences of the head geometry. For the total accelerance in FIG. 10A, if the slight fluctuations are ignored, the overall levels of the simulation results are similar to the experimental data at frequencies below 2 khz. At frequencies above 2 khz, the simulation results are slightly lower than the experimental data except at the highest frequencies, above approximately 6 khz, where the simulated levels of the total accelerance show about 10 to 25 db greater interaural separation than the experimental data. In the x direction the overall levels of the simulation results and experimental data are similar and within 6 db. This suggests that the main source of the differences in the total accelerance is the other directions. The phase of the simulation result in the x direction is slightly lower than the experimental data for P3. For P2, the differences between the simulation results and experimental data are small below 2.5 khz but increase at frequencies above 2.5 khz with more accumulated phase in the experimental data. The rapid decrease in the simulated P2 phase 20
22 at 2.5 khz result in a phase difference between simulation and experimental data of approximately 1 cycle. This great difference is probably due to the sharp anti-resonance seen in the magnitude data at 2.5 khz (FIG. 10B) for the simulation data not present in the averaged experimental data. Moreover, the simulation result show that when the stimulation is closer to the cochlea, greater interaural differences are obtained at higher frequencies, in line with the experimental data. Håkansson et al. (1994) published measurements of six living humans with bilateral implants for the use of BAHAs where a vibrator was attached to the skull at one BAHA position to provide the stimulation. The accelerations were recorded at the contralateral BAHA position. The point and transcranial accelerances were reported. To enable comparison with the data obtained from the live humans, simulations of the FE model was configured to match the experiment and the results are compared in FIG. 11. Håkansson et al. (1994) did not report the stimulation and response directions. However, based on the phases of the experimental data, we conclude that the contralateral measured response directions were opposite to the stimulation directions. In the experiment, the stimulation vibrator was only attached on one side of the heads. For the response measured at the stimulation position, the level of the simulated point accelerance is within 10 db of the experimental result (FIG. 11A). When the response position was on the contralateral side of the head, the level of the simulation results shows about 15 db more transmission loss than the experimental data (FIG. 11B). Even so, the results show similar trends and the frequencies of peak values are almost the same. The phase of the simulation results agrees well with the experimental point accelerance data with only a slight discrepancy at frequencies above 6 khz (FIG. 11C). However, the simulation phase of the transcranial accelerance accumulates less phase than the experimental results at frequencies above 1 khz resulting in almost 5 cycles difference at 10 khz (FIG. 21
23 11D). This is believed to be a result of higher wave speed in the simulation data and the sharp resonances and anti-resonances seen in the experimental data. D. Mesh convergence The number of elements in the mesh was evaluated by increasing and decreasing the mesh size. When the mesh was decreased by 4.4% and 6.0% the maximum deviation for the mechanical point impedance were 2 db and 15 degrees at frequencies close to 0.3 khz. At the same frequencies, the deviation was 3 db and 5 degrees for a 12.8% increase. At all other frequencies, the deviation of the mechanical point impedance was less than 1 db and 2 degrees for both the decrease and increase of mesh size. When the analysis was conducted for the cochlear promontory acceleration in the x direction, the maximum deviation also occurred at frequencies around 0.3 khz. The maximum deviation was 2 db for both ipsilateral and contralateral stimulation and for both increase and decrease of the mesh size. At other frequencies the deviation for increasing or decreasing the mesh size was less than 1 db. E. Parameter sensitivity FIG. 12 shows the level difference (in db) of the mechanical point impedance (A E) and the accelerance of the ipsilateral cochlear promontory (F J) between the normal case and the cases varying the density of the brain tissue (A and F), CSF (B and G), cortical bone (C and H), diploe (D and I), and soft tissue (E and J). Except for the cortical bone, a ten-fold increase of the density causes about 5 db increase of the Zmech level at frequencies above 1.5 khz and a 10-fold decrease of the density shows almost no change of the Zmech level. However, increasing the density in the cortical bone by a factor 10 gives 8 to 10 db increased impedance level at frequencies above 1 khz while decreasing the density gives a minor effect at frequencies above 2 khz. 22
24 Although a decrease of the density of the brain tissue, CSF, diploe, and soft tissue gives almost no change of the cochlear vibration, an increase of the density and a decrease of the cortical bone density shows a shift of the resonant frequency. The resonant frequency shifts from 2 khz to 1.5 khz by a 10 time increase of the brain, CSF, and diploe density. An increase of the cortical bone density shifts the resonance frequency to 1 khz while decreasing the density shifts it to 3.5 khz. A similar analysis was done for the Poisson s ratio in the solid components (bone and brain and soft tissues). Since Poisson s ratio cannot be defined in a fluid component, the sound speed was changed in the CSF. The change of Zmech and cochlear promontory acceleration levels with any change of Poisson s ratio or sound speed were less than 1 db at any frequency. The effects of Young s modulus on the Zmech and cochlear promontory accelerance are presented in FIG. 13. Changing of Young s modulus in brain and diploe shows almost no effect on the Zmech level or cochlear promontory motion. Also, a decrease of Young s modulus in the soft tissues gives no effect. However, the effect of varying Young s modulus of the cortical bone is significant. An increase of the Young s modulus by 10 increases the Zmech level by 5 to 25 db while decreasing Young s modulus by 10 decreases the Zmech level by 5 15 db. According to Stenfelt and Goode (2005b), the impedance of the head is dominated by the stiffness of the bone around the stimulation position. The current analysis of the Young s modulus of the cortical bone is consistent with Stenfelt and Goode (2005b). According to the analysis of the cochlear promontory vibration, a 10 times higher Young s modulus shifts the resonance frequency from 2 khz to 6 khz whereas a 10 times lower Young s modulus shifts the resonance frequency to below 0.5 khz. 23
25 24
26 IV. DISCUSSION In this study, results are obtained from a FE model of the human head. Four positions commonly used in experiments are defined at the skull bone surface. The accelerations are calculated at the stimulation positions, contralateral skull surface, and cochlear promontories. The magnitudes and phases of the mechanical impedances (Zmech) and cochlear responses are compared with experimental data in the literature, measured in human cadaver heads and living subjects. There are several differences between the simulations and the experiments. The most noticeable is that the FE model only contains the head; the body below the neck was removed. According to Stalnaker and Folge (1971), the head-neck junction is insignificant for frequencies above 400 Hz. Although it may affect the results at low frequencies, it is assumed that using an isolated head for the simulations did not affect the overall trend or responses. Also, adding the neck and upper torso would increase the model size leading to greater demands on computational power and increase simulation times. It should be noted that some of the cadaver head experiments also used severed skulls. Another difference is the measurement method for the vibration of the cochlear promontories in cadavers. The most common method in experiments is to remove the auricle and open the ear canal. The FE model in this study, however, is a whole head with intact anatomy. In the experiments by Stenfelt and Goode (2005b) both an accelerometer and a laser Doppler vibrometer (LDV) were used. The vibration of the intact ear measured by the LDV was compared with the response of the opened ear measured by the accelerometer in the x direction (the auricle was still removed). The experimental results show that the phase difference of the accelerance between the two measurement methods increases with frequency but the pattern for the magnitude of the accelerance was similar. Although the influence of the auricle was unknown, the influence of an intact ear canal may explain some phase differences between the simulations and experiments at high frequencies found in the current study. 25
27 A. Mechanical point impedance of the head In this study, point impedance data measured on cadaver heads (Stenfelt and Goode, 2005b) and live humans (Håkansson et al., 1986) were compared with the model (FIG. 6). It was found that both magnitudes and phases of the simulations were overall similar with experimental data except with stimulation at position P1. For P1, especially the phase differed between the simulation and experiment at frequencies above 2 khz (FIG. 6). One possible explanation for this greater difference is that the experimental data for P1 were measurements from live humans. Characteristics of living subjects (e.g. temperature) and different boundary conditions (e.g. skull-neck interface) might be, at least partially, a source for the greater difference between simulations and experiments. However, the simulation data are from a single subject while the experimental data are averages from several subjects. Therefore, the differences seen could originate in the specific geometry of the model that is unspecific for the population of live humans used in the Håkansson et al. (1986) study. The head geometry of the FE model was based on the images of a female cadaver head and the mechanical properties were identified from the literature. Therefore, the simulation results are not expected to equal the averaged results in the above mentioned experiments. Moreover, for the experiments the excitations were provided by vibration transducers and the accelerations were measured by accelerometers. Both transducers and accelerometers were rigidly attached to the skull which means they may change local parameters like mass or stiffness. In this study, a metal structure was used to simulate the attachment position in the bone for the vibration source. However, other parts of the transducer or accelerometer were ignored. 26
28 In FIG. 6, the point impedance magnitudes and phases of the simulation results at low frequencies show large fluctuations. As stressed previously, these fluctuations, indicative of multiple resonances, were also reported for the experimental data of live humans (Håkansson et al., 1986) and cadaver heads (Stenfelt and Goode, 2005b). Due to the averaging of multiple subjects in these studies where the different resonances appeared at slightly different frequencies, they are not visible in the averaged data. It is here hypothesized that these multiple low-frequency resonances in the point impedance data are the result of rotational modes in addition to the translational motion of the skull. The effect of rotational response on the mechanical point impedance was investigated. One reason for a rotational response is that the stimulation direction is not through the center of mass of the head. Therefore, the directions of the stimulation forces were changed to align with the center of mass. The vector components for the stimulation directions aligned to the head s center of mass are given in Table III and the simulation results are shown in FIG. 14. Each force is applied at the previous positions but the directions of the forces are changed so as to point through the center of mass of the FE model. In FIG. 14, the magnitude of the Zmech for each position are shown as dashed-dotted lines. Even if the directions of the stimulation forces were not the same as in the experiments, the resonance frequencies should be the same. The change of directions altered the mechanical point impedance response slightly, and in relative terms, the level of the first peak diminished. Moreover, for most positions, the second peak, which is close in frequency to the reported resonance frequency of the experimentally obtained mechanical point impedance, has the highest value. However, there are still multiple low-frequency resonances even if the rotational motion was reduced. Consequently, it is not only the rotational motion that is responsible for the multiple low-frequency resonances. Their origin needs to be investigated further. Qualitatively, the simulation results agrees with the experimental data. For the same position, below the resonance frequency, the impedance of the simulation results increases with frequency, indicating a 27
29 mass-dominated system. Above the resonance frequency, the impedance shows a negative magnitude slope, indicating a stiffness-dominated system. For different positions, the thicker the bone was at the stimulation position, the higher the resonance frequency. The simulation results are mostly within 5 db of the average experimental results, and the slight discrepancies are in line with intersubjective differences in the experiments, indicated by the standard deviations in FIG. 6. B. Vibration of the cochlea Figures 7 and 8 show the simulation results of the accelerances at the cochlear promontories when the stimulation is at the skull surface. Figure 7 shows the levels of the accelerances when stimulation was at position P1 in the x direction and FIG. 8 presents the results stimulated at other positions as level and phase in three directions. At frequencies above 300 Hz, the simulation results are within 10 db of the experimental data in the stimulation directions. Similar to the experimental data, the simulations also showed that the dominant vibration response at the cochlea was in the direction of the stimulation. However, in the two perpendicular directions in FIG. 8, the results of the simulation and experiment showed less agreement, with the experiments giving overall greater magnitudes than the simulations. One possible explanation for this difference is that the stimulation directions in the simulations are unambiguous and no excitation occurs in the plane orthogonal to the stimulation directions. However, the vibration transducer used in the experiments gives, beside the excitation in the stimulation direction, also, due to imperfections in the transducer, excitation in the plane orthogonal to the stimulation direction (Stenfelt et al. 2002). It is therefore expected that the experiments give greater accelerance levels in the orthogonal directions of stimulations than the simulation data. When the level of the total accelerance is presented in FIG. 9, the levels from the simulation are significantly smaller than the experimental data. At least part of this discrepancy can be explained by the same mechanism: the orthogonal directions contribute more in the acceleration response of the 28
30 experimental data giving greater total accelerance levels. Another difference between simulations and experiments is that in the head used for the simulations seem to have a larger mas than the heads used for the experiments. The head here had a mass of 4.96 kg while the average head mass in the study by Stenfelt and Goode (2005b) was 3.51 kg. Such difference is expected to give lower responses in the simulations compared to the experiments. At frequencies above 3 khz, the differences between simulation and experimental results increase. There are several possible reasons for that. One such reason is that the model itself is a simplification of reality. For example, the skin, muscles and fat were all modeled as one homogeneous tissue (soft tissue). Another difference is that the spongy bone (diploe) in a real head is fluid filled while it is here only modeled as soft bone. In addition, the mechanical parameters depend on the position in the skull (McElhaney et al., 1970; Motherway et al., 2009; Auperrin et al., 2014), but in this study the values for the different parameters were independent of position. Moreover, the geometry of this model is obtained from one single head while the results are compared to average values from several heads. Even if the results were mostly within the range of the experimental studies, they sometimes differed from the average results. Another possibility is that due to the destruction of the ears in some of the experiments, the changed geometry alters the responses while intact ears were used in the simulations. There are limitations in the FE model itself that may be responsible for some of the differences. At higher frequencies, a finer mesh is required to obtain more exact results. However, in the mesh convergence analysis, an increase of elements by 12.8 % did not change the high frequency results which suggests that for frequencies up to 10 khz that were analyzed here, the mesh is sufficient. The choice of parameter values can also be an origin of the differences seen between the model simulations and experimental data. In the analysis of parameter sensitivity, the results are insensitive to several of the parameter values. The one component that influenced the results the most was the cortical bone. Both its 29
31 density and its stiffness (Young s modulus) affected the mechanical point impedance and the cochlear promontory vibration. Therefore, these values are critical to give correct simulations. In the current model the density of the cortical bone is slightly higher than those obtained experimentally. A lower density of the cortical bone would give better high frequency response according to FIG. 12. Consequently, the density of the cortical bone used in the current study may be too high to provide correct high frequency results for the cochlear promontory vibration. One similarity between the experimental and the simulated responses is the influence of stimulation position. On the ipsilateral side, the response level decreases with the distance between the stimulation point and cochlear promontory, and the accumulated phase shows the opposite trend. On the contralateral side, no systematic differences were seen between the positions. These effects are similar to the experimental data (Stenfelt et al., 2005b; Eeg-Olofsson et al., 2008; 2011). C. Transcranial transmission In FIG. 10, comparisons of transcranial transmission between simulation and experimental results are shown. At frequencies above 6 khz, the magnitude difference of the transcranial transmission between simulation and experiment results increased. Based on the total accelerance data, simulation results showed 10 to 25 db greater separation between the cochleae than the experimental results at frequencies above 7 khz. Since these data are composed of the data shown in FIG. 8, the explanation for the differences is the same as for the accelerance data mentioned above. Moreover, compared with the transcranial transmission based on the total accelerance, the magnitude of the transcranial transmission based on the accelerance in the x direction shows less difference at high frequencies. This again may be a result of the imperfect one-dimensional stimulation by the transducer used in the experiments. The phases of the transcranial transmission based on the accelerance in the x direction present a small deviation for the whole frequency range. It may be due to the different directions between model simulation and 30
32 experiment. Another reason could be that different geometries result in different centers of mass, which affected the vibration response. When the stimulation was at position P1 (BAHA position) the results were compared with data from live humans (FIG. 11). The transcranial accelerance of the experimental data gave higher magnitudes than the simulations. Again this could be the result of the imperfect one-dimensional excitation from the transducers used in the experimental data. Also the mechanical characteristics of living subjects as well as different support settings might be the origin for some discrepancies. Even so, both the experimental and simulated curves of the accelerance magnitudes show similar tendencies. This is interpreted to mean that the FE model presents a reasonable transcranial response at position P1. However, the phases of the transcranial accelerance show large differences. Although no other phase data of the transcranial transmission between the BAHA positions in live subjects have been reported, time delay results were reported by Eeg-Olofsson et al. (2011) in cadavers. The stimulation position was at the BAHA position and the time delay described a time difference between ipsilateral and contralateral stimulation where the response position was at the cochlea. According to the results measured by Eeg-Olofsson et al. (2011), the time delay between the ipsilateral and contralateral stimulation at the BAHA position in the cadaver heads was less than 0.4 ms at 10 khz, approximately equal to -4 cycles in phase. This is close to the results in the current FE model. Even if the response positions differ slightly, the simulation results of the phase from the FE model are in accordance with the data from cadaver experiments. Moreover, only one subject was measured by Håkansson et al. (1994) and individual differences could affect the results as well. There is also the possibility that vibration responses differ between live subjects and cadaver heads. V. CONCLUSIONS In this study, a FE model of a female human head was developed and validated with experimental data from cadaver heads and live humans to gain insight into the response of the BC sound. Four stimulation 31
33 positions were used and the mechanical point impedance, the vibration response at the cochlear promontory, and transcranial transmission were calculated using this FE model. The results showed similarity with published data from cadaver heads. Also, the simulation results are close to the limited data from living subjects. Therefore, the current FE model could be used as a proxy for live humans when evaluating sound transmission by BC. However, due to individual differences, the results may not match a specific subject. Even so, the simulation results can be helpful to understand and analyze the transmission and response of BC sound. Moreover, the FE model may also be used to predict the vibration pattern surrounding the inner ear that is important for the perception of BC sound. 32
34 REFERENCES Auperrin, A., Delille, R., Lesueur, D., Bruyere, K., Masson, C., and Drazetic, P. (2014). "Geometrical and material parameters to assess the macroscopic mechanical behaviour of fresh cranial bone samples," Journal of biomechanics 47, Békésy, G. V. (1932). "Zur theorie des hörens bei der schallaufnahme durch knochenleitung," Annalen der Physik 405, Brummund, M. K., Sgard, F., Petit, Y., and Laville, F. (2014). "Three-dimensional finite element modeling of the human external ear: Simulation study of the bone conduction occlusion effecta)," The Journal of the Acoustical Society of America 135, Cox, R., and Peacock, M. (1979). "The growth of elastic cartilage," Journal of anatomy 128, 207. Eeg-Olofsson, M., Stenfelt, S., and Granström, G. (2011). "Implications for contralateral bone-conducted transmission as measured by cochlear vibrations," Otology & Neurotology 32, Eeg-Olofsson, M., Stenfelt, S., Taghavi, H., Reinfeldt, S., Håkansson, B., Tengstrand, T., and Finizia, C. (2013). "Transmission of bone conducted sound Correlation between hearing perception and cochlear vibration," Hearing research 306, Eeg-Olofsson, M., Stenfelt, S., Tjellström, A., and Granström, G. (2008). "Transmission of bone-conducted sound in the human skull measured by cochlear vibrations," International journal of audiology 47, Farvid, M., Ng, T., Chan, D., Barrett, P., and Watts, G. (2005). "Association of adiponectin and resistin with adipose tissue compartments, insulin resistance and dyslipidaemia," Diabetes, obesity and metabolism 7, Franke, E. K. (1956). "Response of the human skull to mechanical vibrations," The Journal of the Acoustical Society of America 28, Fry, F., and Barger, J. (1978). "Acoustical properties of the human skull," The Journal of the Acoustical Society of America 63, Grellmann, W., Berghaus, A., Haberland, E. J., Jamali, Y., Holweg, K., Reincke, K., and Bierögel, C. (2006). "Determination of strength and deformation behavior of human cartilage for the definition of significant parameters," Journal of Biomedical Materials Research Part A 78, Hamed, E., Jasiuk, I., Yoo, A., Lee, Y., and Liszka, T. (2012). "Multi-scale modelling of elastic moduli of trabecular bone," Journal of The Royal Society Interface 9, Håkansson, B., Brandt, A., Carlsson, P., and Tjellström, A. (1994). "Resonance frequencies of the human skull invivo," The Journal of the Acoustical Society of America 95, Håkansson, B., Carlsson, P., and Tjellström, A. (1986). "The mechanical point impedance of the human head, with and without skin penetration," The Journal of the Acoustical Society of America 80, Håkansson, B., Eeg-Olofsson, M., Reinfeldt, S., Stenfelt, S., and Granström, G. (2008). "Percutaneous versus transcutaneous bone conduction implant system: a feasibility study on a cadaver head," Otology & Neurotology 29, Jaasma, M. J., Bayraktar, H. H., Niebur, G. L., and Keaveny, T. M. (2002). "Biomechanical effects of intraspecimen variations in tissue modulus for trabecular bone," Journal of biomechanics 35, Ji, S., Ghadyani, H., Bolander, R. P., Beckwith, J. G., Ford, J. C., McAllister, T. W., Flashman, L. A., Paulsen, K. D., Ernstrom, K., and Jain, S. (2014). "Parametric comparisons of intracranial mechanical responses from three validated finite element models of the human head," Annals of biomedical engineering 42, Keaveny, T. M., Pinilla, T. P., Crawford, R. P., Kopperdahl, D. L., and Lou, A. (1997). "Systematic and random errors in compression testing of trabecular bone," Journal of orthopaedic research 15, Khalil, T. B., Viano, D., and Smith, D. (1979). "Experimental analysis of the vibrational characteristics of the human skull," Journal of Sound and Vibration 63, Kim, H., Jürgens, P., Weber, S., Nolte, L.-P., and Reyes, M. (2010). "A new soft-tissue simulation strategy for cranio-maxillofacial surgery using facial muscle template model," Progress in biophysics and molecular biology 103,
35 Kim, N., Chang, Y., and Stenfelt, S. (2014). "A Three-Dimensional Finite-Element Model of a Human Dry Skull for Bone-Conduction Hearing," BioMed research international Kleiven, S., and Hardy, W. N. (2002). "Correlation of an FE Model of the Human Head with Local Brain Motion-- Consequences for Injury Prediction," Stapp Car Crash Journal, Levin, E., Muravchick, S., and Gold, M. I. (1981). "Density of normal human cerebrospinal fluid and tetracaine solutions," Anesthesia & Analgesia 60, Luo, Y., Li, Z., and Chen, H. (2012). "Finite-element study of cerebrospinal fluid in mitigating closed head injuries," Proceedings of the Institution of Mechanical Engineers, Part H: Journal of Engineering in Medicine 226, Maroudas, A., Muir, H., and Wingham, J. (1969). "The correlation of fixed negative charge with glycosaminoglycan content of human articular cartilage," Biochimica et Biophysica Acta (BBA)-General Subjects 177, McElhaney, J. H., Fogle, J. L., Melvin, J. W., Haynes, R. R., Roberts, V. L., and Alem, N. M. (1970). "Mechanical properties of cranial bone," Journal of biomechanics 3, Motherway, J. A., Verschueren, P., Van der Perre, G., Vander Sloten, J., and Gilchrist, M. D. (2009). "The mechanical properties of cranial bone: the effect of loading rate and cranial sampling position," Journal of biomechanics 42, Peterson, J., and Dechow, P. C. (2003). "Material properties of the human cranial vault and zygoma," The Anatomical Record Part A: Discoveries in Molecular, Cellular, and Evolutionary Biology 274, Sahoo, D., Deck, C., Yoganandan, N., and Willinger, R. (2013). "Anisotropic composite human skull model and skull fracture validation against temporo-parietal skull fracture," Journal of the mechanical behavior of biomedical materials 28, Snik, A. F., Mylanus, E., Proops, D. W., Wolfaardt, J. F., Hodgetts, W. E., Somers, T., Niparko, J. K., Wazen, J. J., Sterkers, O., and Cremers, C. (2005). "Consensus statements on the BAHA system: where do we stand at present?," The Annals of otology, rhinology & laryngology. Supplement 195, Srinivasa, C., Suresh, Y., and Kumar, W. P. (2012). "Buckling Studies on Laminated Composite Skew Plates," International Journal of Computer Applications 37, Stalnaker, R. L., Fogle, J. L., and McElhaney, J. H. (1971). "Driving point impedance characteristics of the head," Journal of biomechanics 4, Stenfelt, S. (2007). "Simultaneous cancellation of air and bone conduction tones at two frequencies: Extension of the famous experiment by von Békésy," Hearing research 225, Stenfelt, S. (2012). "Transcranial attenuation of bone-conducted sound when stimulation is at the mastoid and at the bone conduction hearing aid position," Otology & Neurotology 33, Stenfelt, S., and Goode, R. L. (2005a). "Bone-conducted sound: physiological and clinical aspects," Otology & Neurotology 26, Stenfelt, S., and Goode, R. L. (2005b). "Transmission properties of bone conducted sound: measurements in cadaver heads," The Journal of the Acoustical Society of America 118, Stenfelt, S., Hato, N., and Goode, R. L. (2002). "Factors contributing to bone conduction: the middle ear," The Journal of the Acoustical Society of America 111, Stenfelt, S., Håkansson, B., and Tjellström, A. (2000). "Vibration characteristics of bone conducted sound in vitro," The Journal of the Acoustical Society of America 107, Stenfelt, S., Puria, S., Hato, N., and Goode, R. L. (2003). "Basilar membrane and osseous spiral lamina motion in human cadavers with air and bone conduction stimuli," Hearing research 181, Taschke H. (2005). Ph.D. thesis. der Fakultät für Elektrotechnik und Informationstechnik, an der Ruhr-Universität Bochum, P Taschke, H., and Hudde, H. (2006). "A finite element model of the human head for auditory bone conduction simulation," ORL 68,
36 Urbanchek, M. G., Picken, E. B., Kalliainen, L. K., and Kuzon, W. M. (2001). "Specific force deficit in skeletal muscles of old rats is partially explained by the existence of denervated muscle fibers," The Journals of Gerontology Series A: Biological Sciences and Medical Sciences 56, B191-B197. Valášek, J., Jurčenko, M., and Florian, Z. (2014). "Comparative Study of Two Different Types of Human Mandible Boundary Conditions Used in Finite Element Calculations," Applied Mechanics and Materials 436, Wang, D., Song, X. W., Sun, X. Y., Du, Z. J., Zhang, J. Y., and Zhao, H. (2014). "The Construction and Validation of a Finite Element Human Head Model for Skull Fracture," in Advanced Materials Research (Trans Tech Publ), pp Ward, S. R., and Lieber, R. L. (2005). "Density and hydration of fresh and fixed human skeletal muscle," Journal of biomechanics 38,
37 FIG. 1. An example of the cryosectional images of the human head used for the identification of the structures and geometries. FIG. 2. The components of the FE whole head model. A) Outer skin layer of the head which is modeled as soft tissue. B) The soft tissue is removed to expose the skull bone and cartilage. C) and D) The skull bone is removed to show the CSF, brain tissue, eye and also the position of the inner ear. Also indicated is the diploë that is positioned between the inner and outer cortical bone giving the skull bone a sandwich structure. FIG. 3. The dimensions of the whole head (upper part) and the skull bone (lower part) used for the simulations. FIG. 4. (A) The stimulation positions at the ipsilateral side. Position P0 was at the middle of the forehead, P1 was about 55 mm posterior of the ear canal opening similar to the position where a BAHA implant is positioned, P2 was 40 mm posterior of the ear canal opening, and P3 was approximately 20 mm posterior of the ear canal opening, which is approximately where a BC transducer is placed on the mastoid. (B) The measurement positions on the ipsilateral and the contralateral cochlear promontories. The position for the center of mass (CoM) is also indicated. FIG. 5. Cross sectional view showing the insertion of the metal screw at a stimulation position. FIG. 6. The mechanical point impedance as magnitude (left panels) and phase (right panels) for the four stimulation positions. The simulated impedance results are the average values with stimulation from 36
38 both sides except position P0. The solid line is the results from the current model and the dashed line represents the experimental data where the error bars indicate +/- 1 standard deviation. The experimental data at position P1 were from live subjects (Håkansson et al., 1986), the other positions used experimental data measured in cadaver heads (Stenfelt and Goode, 2005b). FIG. 7. The average accelerance (acceleration/force) measured at the cochlear promontory. The stimulation position was at position P1. The results are the mean values with stimulation from both sides of the head and show the level in the x direction. The simulation results are displayed with a solid line, the results from cadaver heads (Eeg-Olofsson et al., 2008, 2011) are shown with a dashed line and data from live humans (Eeg-Olofsson et al., 2013) are shown with a dashed-dotted line. (Color online) FIG. 8. The average accelerance (acceleration/force) as level and phase measured on the cochlear promontory. The results are the mean values from simulations from both sides of the head and are shown for the stimulation positions P2, P3 and P0 and in three directions x, y, z. Data from stimulations at positions P2 and P3 are shown with ipsilateral and contralateral stimulation while only one response is shown with stimulation position P0. The simulation results are displayed with a solid line and the experimental results (Stenfelt and Goode, 2005b) are shown with a dashed line. (Color online) FIG. 9. The average of the total accelerance level calculated as the quadratic summation of the accelerances in the three directions. The results are compared with experimental data from Stefan and Goode (2005b). A) Ipsilateral and C) contralateral stimulation at positions P2 and P3. The curves are shown as: P2 solid line for simulation results and dashed line for experimental data; P3 dashed- 37
39 dotted line and dotted line for simulation and experiment, respectively. B) The results obtained with stimulation applied at position P0. Simulation results are displayed as a solid line and experimental data are displayed as a dashed line. (Color online) FIG. 10. The transcranial transmission with the stimulations at position P2 and P3. A) The total accelerance level (quadratic summation of all three response directions), B) level and, C) phase for the x direction. The simulation results are displayed as: P2 solid line, P3 dashed-dotted line; the related experimental data (Stenfelt and Goode, 2005b) are displayed as dashed line and dotted line. (Color online) FIG. 11. A) Level and C) phase of the point accelerances which is measured at the same position as the stimulation position (P1). B) Level and D) phase of the transcranial accelerances (positions P1) where the measurement position is contralateral to the stimulation position. The solid line is the simulation results and the dashed line is the experimental results (Håkansson et al., 1994). (Color online) FIG. 12. Level difference of the mechanical point impedance ((A) through (E)) and the accelerance of the ipsilateral cochlear promontory in the x direction ((F) through (J)) between the normal case and the cases with varying densities of the brain tissue ((A) and (F)), cortical bone ((B) and (G)), CSF ((C) and (H)), diploe ((D) and (I)), and soft tissue ((E) and (J)). Solid line represents increasing the density by 10 times while the dotted line means decreasing the density 10 times. 38
40 FIG. 13. Level difference of the mechanical point impedance ((A) through (D)) and the accelerance of the ipsilateral cochlear promontory in the x direction ((E) through (H)) between the normal case and the cases with varying Young s modulus of the brain tissue ((A) and (E)), cortical bone ((B) and (F)), diploe ((C) and (G)), and soft tissue ((D) and (H)). Solid line represents increasing the Young s modulus by 10 times while the dotted line means decreasing the Young s modulus 10 times. FIG. 14. The magnitudes of the mechanical point impedances for the four positions: A) P1, B) P2, C) P3, and D) P0. The results are the average values from both sides except position P0. The dashed-dotted line shows the results excited with the stimulation forces aligned with the center of gravity of the FE model. The other curves are the same as in FIG. 6. (Color online) ACKNOWLEDGMENTS Work was supported by the European Union under Grant No for the SIFEM project and by Incheon Nation University (International Cooperative) Research Grant in
41 TABLE Ⅰ. Values of the parameters for the structures of the FE human head model. If the loss factor depend on the frequency it is shows as a function of frequency (f) in Hz. Young's modulus E Density ρ Poisson's Loss factor Sound speed Component (MPa) (kg/m 3 ) ratio ν η C (m/s 2 ) Element type Brain ff Tetrahedron solid CSF Tetrahedron fluid Eye Tetrahedron fluid Inner ear Tetrahedron fluid Cartilage (constant) Tetrahedron solid Cortical bone (constant) Tetrahedron solid Diploe ff Tetrahedron solid Soft tissue ff Tetrahedron solid Screw Tetrahedron solid 40
42 TABLE II. The vectors at the stimulation positions when the directions of the stimulation forces were as same as the experiments. Position x y z P P P P
43 TABLE III. The vectors at the stimulation positions when the directions of the stimulation forces were through the center of mass. Position x y z P P P P

44 Fig 1
45 Fig 2

46 Fig 3 Fig 4

47 Fig 5
Development of 3D Finite Element Model of Human head
 Development of 3D Finite Element Model of Human head Numerical simulation of Mechanical Point Impedance in Human head model for Bone Anchored Hearing Aid (BAHA) Master s Thesis in Mathematical Sciences
MODELLING THE SHAKEN BABY SYNDROME
 MODELLING THE SHAKEN BABY SYNDROME I.C. Howard, E.A. Patterson, J. Langley Structural Integrity Research Institute of the University of Sheffield (SIRIUS) Introduction Physical child abuse is common. For
Sound wave bends as it hits an interface at an oblique angle. 4. Reflection. Sound wave bounces back to probe
 : Ultrasound imaging and x-rays 1. How does ultrasound imaging work?. What is ionizing electromagnetic radiation? Definition of ionizing radiation 3. How are x-rays produced? Bremsstrahlung Auger electron
COMP 546. Lecture 21. Cochlea to brain, Source Localization. Tues. April 3, 2018
 COMP 546 Lecture 21 Cochlea to brain, Source Localization Tues. April 3, 2018 1 Ear pinna auditory canal cochlea outer middle inner 2 Eye Ear Lens? Retina? Photoreceptors (light -> chemical) Ganglion cells
COMP 546. Lecture 20. Head and Ear. Thurs. March 29, 2018
 COMP 546 Lecture 20 Head and Ear Thurs. March 29, 2018 1 Impulse function at t = 0. I X, Y, Z, t = δ(x X 0, Y Y 0, Z Z 0, t) To define an impulse function properly in a continuous space requires more math.
DYNAMIC RESPONSE OF BOX-TYPE SONAR STRUCTURE. Sameer Abdul Azeez and O.R.Nandagopan
 ICSV14 Cairns Australia 9-12 July, 2007 DYNAMIC RESPONSE OF BOX-TYPE SONAR STRUCTURE Sameer Abdul Azeez and O.R.Nandagopan Naval Physical & Oceanographic Laboratory, Kochi, India 682 021 tsonpol@vsnl.com
Size Effects In the Crushing of Honeycomb Structures
 45th AIAA/ASME/ASCE/AHS/ASC Structures, Structural Dynamics & Materials Conference 19-22 April 2004, Palm Springs, California AIAA 2004-1640 Size Effects In the Crushing of Honeycomb Structures Erik C.
Proceedings of Meetings on Acoustics
 Proceedings of Meetings on Acoustics Volume 19, 213 http://acousticalsociety.org/ ICA 213 Montreal Montreal, Canada 2-7 June 213 Engineering Acoustics Session 4pEAa: Sound Field Control in the Ear Canal
MODELLING AND MEASUREMENT OF BACKSCATTERING FROM PARTIALLY WATER-FILLED CYLINDRICAL SHELLS
 MODELLING AND MEASUREMENT OF BACKSCATTERING FROM PARTIALLY WATER-FILLED CYLINDRICAL SHELLS Victor Humphrey a, Lian Sheng Wang a and Nisabha Jayasundere b a Institute of Sound & Vibration Research, University
Inertial Bone Conduction: Symmetric and Anti-Symmetric Components
 JRO 12: 261 279 (11 DOI: 1.17/s1162-11-258-3 D 11 ssociation for Research in Otolaryngology JRO Journal of the ssociation for Research in Otolaryngology Inertial one Conduction: Symmetric and nti-symmetric
Vibration analysis of free isotropic cracked plates
 Computational Methods and Experimental Measurements XII 475 Vibration analysis of free isotropic cracked plates M. Alfano & L. Pagnotta Department of Mechanical Engineering, University of Calabria, Italy
Effects of mass distribution and buoyancy on the sound radiation of a fluid loaded cylinder
 Effects of mass distribution and buoyancy on the sound radiation of a fluid loaded cylinder Hongjian Wu, Herwig Peters, Roger Kinns and Nicole Kessissoglou School of Mechanical and Manufacturing, University
General Physics (PHY 2130)
") General Physics (PHY 2130) Lecture XII Sound sound waves Doppler effect Standing waves Light Reflection and refraction Lightning Review Last lecture: 1. Vibration and waves Hooke s law Potential energy
General Physics (PHY 2130) Lecture XII Sound sound waves Doppler effect Standing waves Light Reflection and refraction Lightning Review Last lecture: 1. Vibration and waves Hooke s law Potential energy
Answer: 101 db. db = 10 * log( 1.16 x 10⁻² W/m 2 / 1 x W/m 2 ) = 101 db
 = 101 db") 54. A machine produces a sound with an intensity of 2.9 x 10⁻³ W/m 2. What would be the decibel rating if four of these machines occupy the same room? Answer: 101 db Four of these machines would be four
54. A machine produces a sound with an intensity of 2.9 x 10⁻³ W/m 2. What would be the decibel rating if four of these machines occupy the same room? Answer: 101 db Four of these machines would be four
General Physics (PHY 2130)
") General Physics (PHY 2130) Lecture XII Sound sound waves Doppler effect Standing waves Light Reflection and refraction http://www.physics.wayne.edu/~apetrov/phy2130/ Lightning Review Last lecture: 1. Vibration
General Physics (PHY 2130) Lecture XII Sound sound waves Doppler effect Standing waves Light Reflection and refraction http://www.physics.wayne.edu/~apetrov/phy2130/ Lightning Review Last lecture: 1. Vibration
Experimental Modal Analysis of a Flat Plate Subjected To Vibration
 American Journal of Engineering Research (AJER) 2016 American Journal of Engineering Research (AJER) e-issn: 2320-0847 p-issn : 2320-0936 Volume-5, Issue-6, pp-30-37 www.ajer.org Research Paper Open Access
Natural Frequency Analysis of the Human Head in Normal models
 Bulletin of Environment, Pharmacology and Life Sciences Bull. Env. Pharmacol. Life Sci., Vol 5 [1] December 2015: 37-41 2015 Academy for Environment and Life Sciences, India Online ISSN 2277-1808 Journal
Prediction of rail and bridge noise from concrete railway viaducts using a. multi-layer rail fastener model and a wavenumber domain method
 Paper accepted for publication by Journal of Rail and Rapid Transit, 18 June 2017 Prediction of rail and bridge noise from concrete railway viaducts using a multi-layer rail fastener model and a wavenumber
CHAPTER 5 SIMULATION OF A PAYLOAD FAIRING
 CHAPTER 5 SIMULATION OF A PAYLOAD FAIRING In the preceding chapters, a model of a PZT actuator exciting a SS cylinder has been presented. The structural model is based on a modal expansion formulation
ME 176 Final Exam, Fall 1997
 Tuesday, December 16, 5:00 8:00 PM, 1997. Answer all questions for a maximum of 100 points. Please write all answers in the space provided. If you need additional space, write on the back sides. Indicate
The influence of Boundary Conditions on Sound Insulation
 The influence of Boundary Conditions on Sound Insulation Master s Thesis in the Master s programme in Sound and Vibration CHRISTOFFER JANCO Department of Civil and Environmental Engineering Division of
Sound impulse. r = (X X 0 ) 2 + (Y Y 0 ) 2 + (Z Z 0 ) 2. and
 2 + (Y Y 0 ) 2 + (Z Z 0 ) 2. and") Sound impulse Consider an isolated perturbation of air pressure at 3D point (X o, Y o, Z o ) and at time t = t 0, for example, due to some impact. Or, you can imagine a digital sound generation system
Sound impulse Consider an isolated perturbation of air pressure at 3D point (X o, Y o, Z o ) and at time t = t 0, for example, due to some impact. Or, you can imagine a digital sound generation system
Active Impact Sound Isolation with Floating Floors. Gonçalo Fernandes Lopes
 Active Impact Sound Isolation with Floating Floors Gonçalo Fernandes Lopes Outubro 009 Active impact sound isolation with floating floors Abstract The users of buildings are, nowadays, highly demanding
OPTI 521, Optomechanical Design, Technical Paper Reviews, Dr. Jim Burge, 2011
 Synopsis of Predicting the vibration characteristics of elements incorporating Incompressible and Compressible Viscoelastic Materials Abstract Jacob Etter OPTI 521, University of Arizona, College of Optical
Experimental and Numerical Modal Analysis of a Compressor Mounting Bracket
 IOSR Journal of Mechanical and Civil Engineering (IOSR-JMCE) e-issn: 2278-1684,p-ISSN: 2320-334X, Volume 14, Issue 1 Ver. VI (Jan. - Feb. 2017), PP 01-07 www.iosrjournals.org Experimental and Numerical
VIBRATION ANALYSIS OF AN AUTOMOTIVE SILENCER
 VIBRATION ANALYSIS OF AN AUTOMOTIVE SILENCER K. R. Gadre PG Student, Department Mechanical Engg., Sinhgad College of Engineering, Pune T. A. Jadhav Associate Professor, Department Mechanical Engg, Sinhgad
VIBRATION ENERGY FLOW IN WELDED CONNECTION OF PLATES. 1. Introduction
 ARCHIVES OF ACOUSTICS 31, 4 (Supplement), 53 58 (2006) VIBRATION ENERGY FLOW IN WELDED CONNECTION OF PLATES J. CIEŚLIK, W. BOCHNIAK AGH University of Science and Technology Department of Robotics and Mechatronics
Sound radiation and transmission. Professor Phil Joseph. Departamento de Engenharia Mecânica
 Sound radiation and transmission Professor Phil Joseph Departamento de Engenharia Mecânica SOUND RADIATION BY A PISTON The piston generates plane waves in the tube with particle velocity equal to its own.
Detailed Learning Outcomes
 Detailed Learning Outcomes Following lectures, workshops and directed study activities, students should: 1. Understand the principles behind the study of bioscience in relation to the profession of SLT
Optimization for heat and sound insulation of honeycomb sandwich panel in thermal environments
 Optimization for heat and sound insulation of honeycomb sandwich panel in thermal environments Jinlong Yuan 1, Haibo Chen 2, Qiang Zhong 3, Kongjuan Li 4 Department of Modern mechanics, University of Science
Electrical Engineering 3BA3: Structure of Biological Materials
 Electrical Engineering 3BA3: Structure of Biological Materials Day Class Instructor: Dr. I. C. BRUCE Duration of Examination: 3 Hours McMaster University Final Examination December, 2004 This examination
Producing a Sound Wave. Chapter 14. Using a Tuning Fork to Produce a Sound Wave. Using a Tuning Fork, cont.
 Producing a Sound Wave Chapter 14 Sound Sound waves are longitudinal waves traveling through a medium A tuning fork can be used as an example of producing a sound wave Using a Tuning Fork to Produce a
Finite Element Analysis of Head Impacts in Contact Sports
 Finite Element Analysis of Head Impacts in Contact Sports Eyal Bar-Kochba 1, Mark Guttag 1, Subham Sett 2, Jennifer A. Franck 1, Kyle McNamara 1, Joseph J. Crisco 3, Janet Blume 1, and Christian Franck
Sound Waves. Sound waves are longitudinal waves traveling through a medium Sound waves are produced from vibrating objects.
 Sound Waves Sound waves are longitudinal waves traveling through a medium Sound waves are produced from vibrating objects Introduction Sound Waves: Molecular View When sound travels through a medium, there
Measurement of Structural Intensity Using an Angular Rate Sensor
 Measurement of Structural Intensity Using an Angular Rate Sensor Nobuaki OMATA 1 ; Hiroki NAKAMURA ; Yoshiyuki WAKI 3 ; Atsushi KITAHARA 4 and Toru YAMAZAKI 5 1,, 5 Kanagawa University, Japan 3, 4 BRIDGESTONE,
Biology 224 Human Anatomy and Physiology - II Week 1; Lecture 1; Monday Dr. Stuart S. Sumida. Review of Early Development of Humans.
 Biology 224 Human Anatomy and Physiology - II Week 1; Lecture 1; Monday Dr. Stuart S. Sumida Review of Early Development of Humans Special Senses Review: Historical and Developmental Perspectives Ontogeny
Proceedings of Meetings on Acoustics
 Proceedings of Meetings on Acoustics Volume 9, 2010 http://asa.aip.org 159th Meeting Acoustical Society of America/NOISE-CON 2010 Baltimore, Maryland 19-23 April 2010 Session 4aSA: Structural Acoustics
Comparison of Maximum Induced Current and Electric Field from Transcranial Direct Current and Magnetic Stimulations of a Human Head Model
 PIERS ONLINE, VOL. 3, NO. 2, 2007 178 Comparison of Maximum Induced Current and Electric Field from Transcranial Direct Current and Magnetic Stimulations of a Human Head Model Mai Lu 1, T. Thorlin 2, Shoogo
Sound radiation and sound insulation
 11.1 Sound radiation and sound insulation We actually do not need this chapter You have learned everything you need to know: When waves propagating from one medium to the next it is the change of impedance
Modal and Static Structural Analysis of Exhaust Collector Box for Compressor test facility
 Modal and Static Structural Analysis of Exhaust Collector Box for Compressor test facility Shankar Gouda 1, Praveen M P 2 P G student, Department of Mechanical Engineering, EPCET, Bangalore, Karnataka,
Performance Evaluation of MEMS Based Capacitive Pressure Sensor for Hearing Aid Application
 International Journal of Advanced Engineering Research and Science (IJAERS) 215] [Vol-2, Issue-4, April- Performance Evaluation of MEMS Based Capacitive Pressure Sensor for Hearing Aid Application Apoorva
Dr. N.V.Srinivasulu, S.Jaikrishna, A.Navatha
 PSD Analysis of an Automobile Dash Panel Dr. N.V.Srinivasulu, S.Jaikrishna, A.Navatha Abstract:-In this paper, PSD analysis of an automobile dash panel is performed in order to reduce the vibrations that
Radiated sound power estimates of building elements by means of laser Doppler vibrometry
 Radiated sound power estimates of building elements by means of laser Doppler vibrometry N.B. Roozen, L. Labelle, M. Rychtáriková,2, C. Glorieux, D. Urbán 3, P. Za tko 3, H. Mullner 4 Laboratory of Acoustics,
Measurement Techniques for Engineers. Motion and Vibration Measurement
 Measurement Techniques for Engineers Motion and Vibration Measurement Introduction Quantities that may need to be measured are velocity, acceleration and vibration amplitude Quantities useful in predicting
Chapter 1- An Orientation to the Human Body NOTES
 Chapter 1- An Orientation to the Human Body NOTES Overview of Anatomy and Physiology: -Anatomy- of body parts and their relationships to one another. -Gross or Macroscopic= large and easily observable
1817. Research of sound absorption characteristics for the periodically porous structure and its application in automobile
 1817. Research of sound absorption characteristics for the periodically porous structure and its application in automobile Xian-lin Ren School of Mechatronics Engineering, University of Electronic Science
Research Article Research on Ossicular Chain Mechanics Model
 Mathematical Problems in Engineering Volume 2010, Article ID 261826, 14 pages doi:10.1155/2010/261826 Research Article Research on Ossicular Chain Mechanics Model Wen-juan Yao, 1, 2 Hua-cong Zhou, 1 Bao-lin
inter.noise 2000 The 29th International Congress and Exhibition on Noise Control Engineering August 2000, Nice, FRANCE
 Copyright SFA - InterNoise 2000 1 inter.noise 2000 The 29th International Congress and Exhibition on Noise Control Engineering 27-30 August 2000, Nice, FRANCE I-INCE Classification: 7.0 VIBRATIONS OF FLAT
DEVIL PHYSICS THE BADDEST CLASS ON CAMPUS IB PHYSICS
 DEVIL PHYSICS THE BADDEST CLASS ON CAMPUS IB PHYSICS TSOKOS OPTION I-2 MEDICAL IMAGING Reading Activity Answers IB Assessment Statements Option I-2, Medical Imaging: X-Rays I.2.1. I.2.2. I.2.3. Define
Introduction to Audio and Music Engineering
 Introduction to Audio and Music Engineering Lecture 7 Sound waves Sound localization Sound pressure level Range of human hearing Sound intensity and power 3 Waves in Space and Time Period: T Seconds Frequency:
Today s menu. Last lecture. Ultrasonic measurement systems. What is Ultrasound (cont d...)? What is ultrasound?
? What is ultrasound?") Last lecture Measurement of volume flow rate Differential pressure flowmeters Mechanical flowmeters Vortex flowmeters Measurement of mass flow Measurement of tricky flows" Today s menu Ultrasonic measurement
Last lecture Measurement of volume flow rate Differential pressure flowmeters Mechanical flowmeters Vortex flowmeters Measurement of mass flow Measurement of tricky flows" Today s menu Ultrasonic measurement
A finite element model to predict the sound attenuation of earplugs in an acoustical test fixture
 A finite element model to predict the sound attenuation of earplugs in an acoustical test fixture Guilhem Viallet, Franck Sgard, Frédéric Laville, and Jérôme Boutin Citation: The Journal of the Acoustical
Time-Series Analysis for Ear-Related and Psychoacoustic Metrics
 Time-Series Analysis for Ear-Related and Psychoacoustic Metrics V. Mellert, H. Remmers, R. Weber, B. Schulte-Fortkamp how to analyse p(t) to obtain an earrelated parameter? general remarks on acoustical
BIOL Anatomy and Physiology I ( version L )
") BIOL 2113 - Anatomy and Physiology I ( version 213L ) Course Title Course Development Learning Support Anatomy and Physiology I Standard No Course Description Introduces the anatomy and physiology of the
BIOL 2113 - Anatomy and Physiology I ( version 213L ) Course Title Course Development Learning Support Anatomy and Physiology I Standard No Course Description Introduces the anatomy and physiology of the
Acoustic Quantities. LMS Test.Lab. Rev 12A
 Acoustic Quantities LMS Test.Lab Rev 12A Copyright LMS International 2012 Table of Contents Chapter 1 Acoustic quantities... 5 Section 1.1 Sound power (P)... 5 Section 1.2 Sound pressure... 5 Section
SENSORY PROCESSES PROVIDE INFORMATION ON ANIMALS EXTERNAL ENVIRONMENT AND INTERNAL STATUS 34.4
 SENSORY PROCESSES PROVIDE INFORMATION ON ANIMALS EXTERNAL ENVIRONMENT AND INTERNAL STATUS 34.4 INTRODUCTION Animals need information about their external environments to move, locate food, find mates,
HELICAL BUCKLING OF DRILL-STRINGS
 HELICAL BUCKLING OF DRILL-STRINGS Marcin Kapitaniak 1,, Vahid Vaziri 1,, and Marian Wiercigroch 1 1 Centre for Applied Dynamics Research, School of Engineering, University of Aberdeen, Aberdeen, AB24 3UE,
EVALUATION OF THE EFFECTS OF TEMPERATURE ON RAILPAD PROPERTIES, RAIL DECAY RATES AND NOISE RADIATION
 EVALUATION OF THE EFFECTS OF TEMPERATURE ON RAILPAD PROPERTIES, RAIL DECAY RATES AND NOISE RADIATION R. A. Broadbent, D. J. Thompson and C. J. C. Jones ISVR, University of Southampton, Southampton, SO7
TRANSVERSE VIBRATION OF A GEAR WHEEL
 ISSN 14-364 TRANSVERSE VIBRATION OF A GEAR WHEEL Stanislaw Noga, Rzeszow University of Technology, ul. W. Pola, 35 959 Rzeszow, Poland. Abstract: In the paper, transversal vibration of the annular plate
EFFECTS OF PERMEABILITY ON SOUND ABSORPTION AND SOUND INSULATION PERFORMANCE OF ACOUSTIC CEILING PANELS
 EFFECTS OF PERMEABILITY ON SOUND ABSORPTION AND SOUND INSULATION PERFORMANCE OF ACOUSTIC CEILING PANELS Kento Hashitsume and Daiji Takahashi Graduate School of Engineering, Kyoto University email: kento.hashitsume.ku@gmail.com
Numerical Model of the Insertion Loss Promoted by the Enclosure of a Sound Source
 Numerical Model of the Insertion Loss Promoted by the Enclosure of a Sound Source Gil F. Greco* 1, Bernardo H. Murta 1, Iam H. Souza 1, Tiago B. Romero 1, Paulo H. Mareze 1, Arcanjo Lenzi 2 and Júlio A.
Hydroelastic vibration of a rectangular perforated plate with a simply supported boundary condition
 Fluid Structure Interaction and Moving Boundary Problems IV 63 Hydroelastic vibration of a rectangular perforated plate with a simply supported boundary condition K.-H. Jeong, G.-M. Lee, T.-W. Kim & J.-I.
Technical University of Denmark
 Technical University of Denmark Page 1 of 11 pages Written test, 9 December 2010 Course name: Introduction to medical imaging Course no. 31540 Aids allowed: none. "Weighting": All problems weight equally.
MEASUREMENT OF INPUT IMPEDANCE OF AN ACOUSTIC BORE WITH APPLICATION TO BORE RECONSTRUCTION
 MEASUREMENT OF INPUT IMPEDANCE OF AN ACOUSTIC BORE WITH APPLICATION TO BORE RECONSTRUCTION Maarten van Walstijn Murray Campbell David Sharp Department of Physics and Astronomy, University of Edinburgh,
Spatio-Temporal Characterization of Bio-acoustic Scatterers in Complex Media
 DISTRIBUTION STATEMENT A. Approved for public release; distribution is unlimited. Spatio-Temporal Characterization of Bio-acoustic Scatterers in Complex Media Karim G. Sabra, School of Mechanical Engineering,
PHYSICS A 2825/02. Health Physics. OXFORD CAMBRIDGE AND RSA EXAMINATIONS Advanced GCE. 1 hour 30 minutes
 OXFORD CAMBRIDGE AND RSA EXAMINATIONS Advanced GCE PHYSICS A 2825/02 Health Physics Monday 27 JUNE 2005 Afternoon 1 hour 30 minutes Candidates answer on the question paper. Additional materials: Electronic
The LAT Electronics consists of five distinct box assemblies as follows:
 I. SYNOPSIS The preliminary stress analyses for the DAQ Electronics assemblies have been performed per the conditions specified in the Environmental Specification LAT-SS-00778. The analysis considered
Shock factor investigation in a 3-D finite element model under shock loading
 10(2013) 941 952 Shock factor investigation in a 3-D finite element model under shock loading Abstract In this paper, a scaled 3D ship under shock loading is modeled and analyzed by finite element method.
Introduction to Acoustics Exercises
 . 361-1-3291 Introduction to Acoustics Exercises 1 Fundamentals of acoustics 1. Show the effect of temperature on acoustic pressure. Hint: use the equation of state and the equation of state at equilibrium.
Model tests and FE-modelling of dynamic soil-structure interaction
 Shock and Vibration 19 (2012) 1061 1069 1061 DOI 10.3233/SAV-2012-0712 IOS Press Model tests and FE-modelling of dynamic soil-structure interaction N. Kodama a, * and K. Komiya b a Waseda Institute for
Computational Perception. Sound Localization 1
 Computational Perception 15-485/785 January 17, 2008 Sound Localization 1 Orienting sound localization visual pop-out eye/body movements attentional shift 2 The Problem of Sound Localization What are the
Nondestructive Monitoring of Setting and Hardening of Portland Cement Mortar with Sonic Methods
 Nondestructive Monitoring of Setting and Hardening of Portland Cement Mortar ith Sonic Methods Thomas Voigt, Northestern University, Evanston, USA Surendra P. Shah, Northestern University, Evanston, USA
Physics General Physics. Lecture 25 Waves. Fall 2016 Semester Prof. Matthew Jones
 Physics 22000 General Physics Lecture 25 Waves Fall 2016 Semester Prof. Matthew Jones 1 Final Exam 2 3 Mechanical Waves Waves and wave fronts: 4 Wave Motion 5 Two Kinds of Waves 6 Reflection of Waves When
Finite Element Simulation of Eddy-Current Flaw Detection Systems
 Konstanty Marek Gawrylczyk Politechnika Szczeciñska Katedra Elektrotechniki Teoretycznej i Informatyki Finite Element Simulation of Eddy-Current Flaw Detection Systems Introduction The eddy-current method
Physics 101. Hour Exam 3 Spring Last Name: First Name Network-ID Discussion Section: Discussion TA Name:
 Last Name: First Name Network-ID Discussion Section: Discussion TA Name: Instructions Turn off your cell phone and put it away. Calculators may not be shared. Please keep yours on your own desk. This is
17. Investigation of loudspeaker cabinet vibration using reciprocity
 17. Investigation of loudspeaker cabinet vibration using reciprocity H Alavi & K R Holland, ISVR, University of Southampton E-mail: Hessam.Alavi@soton.ac.uk This paper investigates the contribution of
Exploring Nonlinear Oscillator Models for the Auditory Periphery
 Exploring Nonlinear Oscillator Models for the Auditory Periphery Andrew Binder Dr. Christopher Bergevin, Supervisor October 31, 2008 1 Introduction Sound-induced vibrations are converted into electrical
Response Spectrum Analysis Shock and Seismic. FEMAP & NX Nastran
 Response Spectrum Analysis Shock and Seismic FEMAP & NX Nastran Table of Contents 1. INTRODUCTION... 3 2. THE ACCELEROGRAM... 4 3. CREATING A RESPONSE SPECTRUM... 5 4. NX NASTRAN METHOD... 8 5. RESPONSE
Sound radiation of a plate into a reverberant water tank
 Sound radiation of a plate into a reverberant water tank Jie Pan School of Mechanical and Chemical Engineering, University of Western Australia, Crawley WA 6009, Australia ABSTRACT This paper presents
Physics 202 Homework 7
 Physics 202 Homework 7 May 15, 2013 1. On a cello, the string with the largest linear density (0.0156 kg/m) is the C 171 newtons string. This string produces a fundamental frequency of 65.4 Hz and has
SIMPLE HARMONIC MOTION AND WAVES
 Simple Harmonic Motion (SHM) SIMPLE HARMONIC MOTION AND WAVES - Periodic motion any type of motion that repeats itself in a regular cycle. Ex: a pendulum swinging, a mass bobbing up and down on a spring.
The physics US and MRI. Prof. Peter Bogner
 The physics US and MRI Prof. Peter Bogner Sound waves mechanical disturbance, a pressure wave moves along longitudinal wave compression rarefaction zones c = nl, (c: velocity, n: frequency, l: wavelength
Finite Element Analysis of Piezoelectric Cantilever
 Finite Element Analysis of Piezoelectric Cantilever Nitin N More Department of Mechanical Engineering K.L.E S College of Engineering and Technology, Belgaum, Karnataka, India. Abstract- Energy (or power)
Fluid structure interaction dynamic analysis of a mixed-flow waterjet pump
 IOP Conference Series: Materials Science and Engineering OPEN ACCESS Fluid structure interaction dynamic analysis of a mixed-flow waterjet pump To cite this article: X W Pan et al 2013 IOP Conf. Ser.:
RESILIENT INFRASTRUCTURE June 1 4, 2016
 RESILIENT INFRASTRUCTURE June 1 4, 2016 DAMAGE DETECTION OF UHP-FRC PLATES USING RANDOM DECREMENT TECHNIQUE Azita Pourrastegar MASc Student, Ryerson University, azita2.pourrastegar@ryerson.ca, Canada Hesham
ELEC ENG 3BA3: Structure of Biological Materials
 Name: Student Number: ELEC ENG 3BA3: Structure of Biological Materials Day Class Instructor: Dr. I. C. BRUCE Duration of Examination: 3 Hours McMaster University Final Examination December 2011 This examination
Influence of background noise on non-contact vibration measurements using particle velocity sensors
 Influence of background noise on non-contact vibration measurements using particle velocity sensors Daniel FERNANDEZ COMESAÑA 1 ; Fan YANG 1,2 ; Emiel TIJS 1 1 Microflown Technologies, the Netherlands
Einstein Classes, Unit No. 102, 103, Vardhman Ring Road Plaza, Vikas Puri Extn., Outer Ring Road New Delhi , Ph. : ,
 PW W A V E S Syllabus : Wave motion. Longitudinal and transverse waves, speed of wave. Dplacement relation for a progressive wave. Principle of superposition of waves, reflection of waves, Standing waves
A Sample Durability Study of a Circuit Board under Random Vibration and Design Optimization
 A Sample Durability Study of a Circuit Board under Random Vibration and Design Optimization By: MS.ME Ahmad A. Abbas Ahmad.Abbas@AdvancedCAE.com www.advancedcae.com Sunday, March 07, 2010 Advanced CAE
Finite Element Modeling of Ultrasonic Transducers for Polymer Characterization
 Excerpt from the Proceedings of the COMSOL Conference 2009 Milan Finite Element Modeling of Ultrasonic Transducers for Polymer Characterization Serena De Paolis *, Francesca Lionetto and Alfonso Maffezzoli
Chapter 1. The Human Organism 1-1
 Chapter 1 The Human Organism 1-1 Overview of Anatomy and Physiology Anatomy: Scientific discipline that investigates the body s structure Physiology: Scientific investigation of the processes or functions
Chapter 1 - Introduction to Human Anatomy and Physiology
 Chapter 1 - Introduction to Human Anatomy and Physiology 1.3 - LEVELS OF ORGANIZATION Early investigators, limited in their ability to observe small structures such as cells, focused their attention on
Time Varying Loudness as a Means of Quantifying Loudness in Nonlinearly Propagated Acoustical Signals. S. Hales Swift. Kent L. Gee, faculty advisor
 Time Varying Loudness as a Means of Quantifying Loudness in Nonlinearly Propagated Acoustical Signals by S. Hales Swift Kent L. Gee, faculty advisor A capstone project report submitted to the faculty of
FREE VIBRATION ANALYSIS OF THIN CYLINDRICAL SHELLS SUBJECTED TO INTERNAL PRESSURE AND FINITE ELEMENT ANALYSIS
 FREE VIBRATION ANALYSIS OF THIN CYLINDRICAL SHELLS SUBJECTED TO INTERNAL PRESSURE AND FINITE ELEMENT ANALYSIS J. Kandasamy 1, M. Madhavi 2, N. Haritha 3 1 Corresponding author Department of Mechanical
THICKNESS VARIATION AND NON UNIFORM PLATE BEHAVIOUR USING MODAL TEST RESULTS
 THICKNESS VARIATION AND NON UNIFORM PLATE BEHAVIOUR USING MODAL TEST RESULTS Jesús Alonso Álvarez 1, Víctor de la Cruz Salmerón 2, Álvaro Yañez González 3, Antonia Pacios- Álvarez 4 and Mª Consuelo Huerta
2.3 Concept of Active Acoustic Metamaterials
 Active Acoustic Metamaterials 23 2.3 Concept of Active Acoustic Metamaterials In order to understand the concept and the structure of an active acoustic metamaterial, consider the structure of the external
VIBRATION RESPONSE OF AN ELECTRIC GENERATOR
 Research Report BVAL35-001083 Customer: TEKES/SMART VIBRATION RESPONSE OF AN ELECTRIC GENERATOR Paul Klinge, Antti Hynninen Espoo, Finland 27 December, 2001 1 (12) Title A B Work report Public research
Dynamic behavior of turbine foundation considering full interaction among facility, structure and soil
 Dynamic behavior of turbine foundation considering full interaction among facility, structure and soil Fang Ming Scholl of Civil Engineering, Harbin Institute of Technology, China Wang Tao Institute of
Estimation of Rotational FRFs via Cancellation Methods
 Estimation of Rotational FRFs via Cancellation Methods Nomenclature ij ( l, k ) ij M. Reza shory, Semnan university, Iran Email: mashoori@semnan.ac.ir exact ccelerance measured accelerance when two mechanical
Name: Period: Chapter 1: Introduction to Human Anatomy and Physiology Study Outline
 Name: Period: Chapter 1: Introduction to Human Anatomy and Physiology Study Outline I. Introduction A. The interests of our earliest ancestors most likely concerned. B. Primitive people certainly suffered