MEANDERING EFFECT FOR EVALUATION OF ROUGHNESS COEFFICIENTS AND BOUNDARY SHEAR DISTRIBUTION IN OPEN CHANNEL FLOW
|
|
|
- Wilfrid Dickerson
- 5 years ago
- Views:
Transcription

1 MEANDERING EFFECT FOR EVALUATION OF ROUGHNESS COEFFICIENTS AND BOUNDARY SHEAR DISTRIBUTION IN OPEN CHANNEL FLOW A Thesis Submitted in Partial Fulfillment of the Requirements for the Degree of Master of Technology in Civil Engineering PINAKI PRASANNA NAYAK DEPARTMENT OF CIVIL ENGINEERING NATIONAL INSTITUTE OF TECHNOLOGY, ROURKELA 2010

2 MEANDERING EFFECT FOR EVALUATION OF ROUGHNESS COEFFICIENTS AND BOUNDARY SHEAR DISTRIBUTION IN OPEN CHANNEL FLOW A Thesis Submitted in Partial Fulfillment of the Requirements for the Degree of Master of Technology in Civil Engineering Under the guidance and supervision of Prof. K.C.Patra & Prof. K.K.Khatua Submitted By: PINAKI PRASANNA NAYAK ROLL.NO: 607CE003 DEPARTMENT OF CIVIL ENGINEERING NATIONAL INSTITUTE OF TECHNOLOGY, ROURKELA 2010

3 National Institute of Technology Rourkela CERTIFICATE This is to certify that the thesis entitled Meandering Effect for Evaluation of Roughness Coefficients and Boundary Shear Distribution in Open Channel Flow being submitted by Pinaki Prasanna Nayak in partial fulfillment of the requirements for the award of Master of Technology in Civil Engineering at National Institute of Technology Rourkela, is a bonafide research carried out by her under our guidance and supervision. The work incorporated in this thesis has not been, to the best of our knowledge, submitted to any other University or Institute for the award of any degree or diploma. Prof. K.C. Patra (Supervisor) Prof. K. K. Khatua (Co-Supervisor) i
4 ACKNOWLEDGEMENTS I sincerely express my deep sense of indebtedness and gratitude to Prof. K.C.Patra and Prof. K.K.Khatua for providing me an opportunity to work under their supervision and guidance. Their continuous encouragement, invaluable guidance and immense help have inspired me for the successful completion of the thesis work. I sincerely thank them for their intellectual support and creative criticism, which led me to generate my own ideas and made my work interesting as far as possible. I would also like to express my sincere thanks to Prof. M. Panda, Head, Civil Engineering Department, Prof. A.K. Pradhan, Prof. P.K.Ray and Prof. R.Jha in providing me with all sorts of help and paving me with their precious comments and ideas. I am indebted to all of them. I am also thankful to staff members and students associated with the Fluid Mechanics and Hydraulics Laboratory of Civil Engineering Department, especially Mr. P. Rout and Mr. K. M. Patra for their useful assistance and cooperation during the entire course of the experimentation and helping me in all possible ways. Friendly environment and cooperative company made I had from my stay at NIT Rourkela, memorable and pleasant. The affection received from my batchmates and juniors will always remind me of my days as a student here. I wish to thank all of them heartily. Their support and suggestions were indeed of great help whenever needed. I am thankful to my parents and my in-laws for their emotional support and being patient during the completion of my dissertation. Last but not the least; I thank the ALMIGHTY for blessing me and supporting me throughout. Pinaki Prasanna Nayak ii
5 ABSTRACT Almost all the natural channels meander. During uniform flow in an open channel the resistance is dependent on a number of flow and geometrical parameters. The usual practice in one dimensional flow analysis is to select an appropriate value of roughness coefficient for evaluating the carrying capacity of natural channel. This value of roughness is taken as uniform for the entire surface and for all depths of flow. The resistance coefficients for meandering channels are found to vary with flow depth, aspect ratio, slope and sinuosity and are all linked to the stage-discharge relationships. Although much research has been done on Manning's n for straight channels, less works are reported concerning the roughness values for meandering channels. An investigation concerning the variation of roughness coefficients for meandering channels with slope, sinuosity and geometry are presented. The loss of energy in terms of Manning s n, Chezy s C, and Darcy-Weisbach coefficient f are evaluated. A simple equation for roughness coefficient based on dimensional analysis is modeled and tested with the recent experimental data. The method gives discharge results that are comparable to that of the observed values as well as to other published data. Knowledge on wall shear stress distribution in open channel flow is required to solve a variety of engineering and river hydraulic problems so as to understand the mechanism of sediment transport, and to design stable channels etc. The study on boundary shear and its distribution also give the basic idea on the resistance relationship. Good many works have been reported on the distribution of wall shear for straight channels, but only a few studies are reported on the works involving meandering channels. Experiments are conducted to evaluate wall shear from point to point along the wetted perimeter of the meandering open channel flow. The wall shear distributions in meandering channel is found to be dependent on the dimensionless parameters such as sinuosity, aspect ratio, and channel roughness. Equations are developed to predict the wall shear distribution in meandering channel which is adequate for the present data and other published data. Key words: Aspect ratio(α), Bed slope(s), Boundary shear, Chezy s C, Darcy-Weisbach coefficient f, Manning s n, Dimensional analysis, Meandering channel, Open channel, Flow resistance, Sinuosity(S r ), Stage-discharge relationship, Wall shear distribution. iii
6 CONTENTS CERTIFICATE ACKNOWLEDGEMENTS ABSTRACT LIST OF TABLES LIST OF FIGURES AND PHOTOGRAPHS LIST OF ACRONYMS AND SYMBOLS i ii iii vii viii xi CHAPTER 1: INTRODUCTION General Meandering Its Effects and Influence Essence of Proper Value of Roughness Coefficient and Boundary Shear Distribution in Meandering Channel Flow Scope and Approach of Present Research Work Organisation of the Thesis 6 CHAPTER 2: LITERATURE REVIEW General Previous Work on Roughness Coefficients and Discharge Estimation Overview of the Research Work on Boundary Shear Objectives of the Present Research Work 20 CHAPTER 3: EXPERIMENTAL WORK General 22 iv
7 3.2 Experimental Setup Experimental Procedure Apparatus and Methodology Determination of Channel Slope Measurement of Discharge and Water Surface Elevation Measurement of Velocity and its Direction 33 CHAPTER 4: RESULTS AND DISCUSSIONS General Stage-Discharge Curves for Meandering Channels Variation of Reach Averaged Longitudinal Velocity U With 39 Depth of Flow 4.4 Distribution of Tangential (Longitudinal Velocity) Straight Channel Meandering Channel Measurement of Boundary Shear Stress Velocity Profile Method Distribution of Boundary Shear Stress Straight Channel Meandering Channel Roughness Coefficients in Open Channel Flow Variation of Manning s n with Depth of Flow Variation of Chezy s C with Depth of Flow Variation of Darcy-Weisbach Friction Factor f with 56 Depth of Flow v
8 4.8 Dimensional Analysis Evaluation Of Roughness Coefficients Derivation of Roughness Coefficients using Dimensional Analysis Discharge Estimation Using the Present Approach Application of Other Methods to the Present Channel Boundary Shear Distribution in Meandering Channel Analysis of Boundary Shear in Meandering Channels 68 CHAPTER 5: CONCLUSIONS AND FURTHER WORK Conclusions Scope for Future Work 73 References 74 Dissemination of Work 79 Brief Bio-Data 80 vi
9 LIST OF TABLES Sl.No. Details of Tables Page No. Table 3.1 Details of Geometrical Parameters of the Experimental Channels 24 Table 3.2 Hydraulics Details of the Experimental Runs 35 Table 4.1(a) Experimental Runs for Type-I and Type-II Straight Channels 37 Table 4.1(b) Experimental Runs for Type-III Meandering Channels 37 Table 4.1(c) Experimental Runs for Type-IV Meandering Channels 38 Table 4.2 Comparison of the Boundary Shear Results for Straight Channel and Meandering Channels at Bend Apex-AA 50 Table 4.3(a) Experimental Results for Straight Channels of Type-I and 53 Type-II Showing n, C and f (Sinuosity=1) Table 4.3(b) Experimental Results of Meandering Channel of Type-III 53 Showing n, C and f (Sinuosity=1.44) Table 4.3(c) Experimental Runs for Meandering Channel of Type-IV 54 Showing n, C and f (Sinuosity=1.91) Table 4.4(a) Summary of Experimental Results Showing Overall Shear 66 Stress in Straight Channels (Type-I and II) (Sinuosity=1) Table 4.4(b) Summary of Experimental Results Showing Overall Shear 66 Stress in Meandering Channel of Type-III (Sinuosity=1.44) Table 4.4(c) Summary of Experimental Results Showing Overall Shear 67 Stress in Meandering Channel of Type-IV (Sinuosity=1.91) Table 4.5 Results of Experimental Data for Boundary Shear Distribution 70 in Type-III and Type-IV Meandering Channels Table 4.6 Results of Experimental Data of Kar (1977) and Das (1984) 70 (from Patra, 1999) vii
10 LIST OF FIGURES AND PHOTOGRAPHS Sl.No. Details of Figures Page No. Fig. 1.1 Simple Illustration of Formation of Meandering Channel from 02 Straight Reach Fig. 1.2 Planform of a Meandering River Showing Meander Wavelength, 03 Radius of Curvature, Amplitude and Bankfull Channel Width Fig. 1.3 Classification of Channels According to Sinuosity Ratio 04 Fig. 3.1(a) Plan View of Type-I Channel inside the Experimental Flume 24 Fig. 3.1(b) Details of Geometrical Parameter of Type- I Channel 25 Fig. 3.2(a) Plan View of Type-II Channel inside in the Experimental Flume 25 Fig. 3.2(b) Details of Geometrical Parameter of Type- II Channel 25 Fig. 3.3(a) Plan View of Type-III Channel inside in the Experimental Flume 26 Fig. 3.3(b) Details of One Wavelength of Type- III Channel 26 Fig. 3.4(a) Plan View of Type-IV Channel inside in the Experimental Flume 27 Fig. 3.4(b) Details of One Wavelength of Type- IV Channel 27 Fig. 3.5(b) Standard Features of a MicroADV 33 Fig. 3.5(b) Details of Probe of a MicroADV 33 Fig. 4.1 Cross Section of Channel for Experimentation 36 Fig. 4.2 Stage Discharge Variations in Open Channel Flow 39 Fig. 4.3 Variation of Reach Averaged Longitudinal Velocity U with 40 Depth of Flow Fig. 4.4 (a) Location of Bend Apex (A-A) of Type-III Meandering Channel 41 Fig. 4.4 (b) Location of Bend Apex (A-A) of Type-IV Meandering Channel 41 Figs Contours Showing the Distribution of Tangential Velocity and Boundary Shear Distribution of Type-II Straight Channel viii
11 Figs Contours Showing the Distribution of Tangential Velocity and Boundary Shear Distribution of Type-III Meandering Channel at Bend Apex (Section A-A) Figs Contours Showing the Distribution of Tangential Velocity and Boundary Shear Distribution of Type-IV Meandering Channel at Bend Apex (Section AA) Fig. 4.8 Variation of Manning`s n with Flow Depth 55 Fig. 4.9 Variation of Chezy`s C with Flow Depth 56 Fig Variation of Darcy - Weisbach f with Flow Depth 56 Fig Calibration Equation between gr 10 S 1 ν m and ( URSr να) for 59 Manning`s n Fig Calibration Equation for between gr S 1 ν and ( URSr να) for 60 Derivation of Chezy`s C and Darcy Weisbach f Fig (a) Variation of Observed and Modeled Discharge Using Manning`s n 61 Fig (b) Variation of Observed and Modeled Discharge Using Chezy`s C 62 Fig (c) Variation of Observed and Modeled Discharge Using 62 Darcy Weisbach f Fig (a) Standard Error of Estimation of Discharge using Proposed Manning`s Equation and other established Methods 63 Fig. 4.14(b) Standard Error of Estimation of Discharge using Proposed 63 Chezy`s Equation other established Methods Fig. 4.14(c) Standard Error of Estimation of Discharge using Proposed 64 Darcy Weisbach equation and other established Methods Fig (a) Variation of Percentage of Wall Shear with Aspect Ratio 68 Fig (b) Variation of Percentage of Wall Shear with Sinuosity 69 Fig Variation of Observed and Modeled Value of Wall 71 Shear in Meandering Channel Fig Percentage of Error in Calculating %SFW with 71 Values of Aspect Ratios ix
12 Sl.No. Details of Photographs Page No. Photo 3.1 Plan form of Type-II Channel from Down Stream 23 Photo 3.2 Plan form of Type-III Channel from Down Stream 23 Photo 3.3 Plan form of Type-IV Channel from Down Stream 23 Photo 3.4 Mechanism of Re-circulation of Flow of Water 30 Photo 3.4(a) Two Parallel Pumps for Re-circulation of Flow of Water 30 Photo 3.4(b) Overhead Tank with a Glass Pipe for Storage of Water 30 Photo 3.4(c) Stilling Tank with Baffles for Reduction of Turbulence of Water 30 Photo 3.4(d) Channel Showing Flow of Water from Upstream to Downstream 30 Photo 3.4(e) Tailgate end of the Channel at the Downstream 30 Photo 3.4(f) Volumetric Tank with Glass Pipe at Tailgate of the Channel 30 Photo 3.5 Pointer Gauge used for Slope Measurements 31 Photo 3.6 Micro-ADV, Pointer Gauge and Micro- Pitot Tube Fitted to the 31 Traveling Bridge Photo 3.7(a) Micro-ADV with the Probes in Water 31 Photo 3.7(b) The Processor and other Accessories fitted to Micro-ADV 31 Photo 3.8 Micro- Pitot Tube in Conjunction with Inclined Manometer 32 Photo 3.9(a) Nozzle of the Pitot Tube in water 32 Photo 3.9(b) A Manometer attached to the Pitot Tube 32 Photo 3.9(c) Pitot Tube and Pointer Gauge attached to the travelling Gauge 32 Photo 3.10 One Wave Length of Type-III Meandering Channel 32 Photo 3.11 One Wave Length of Type-IV Meandering Channel 32 Photo 3.12 Slope Changing Lever 32 x
13 LIST OF ACRONYMS AND SYMBOLS Abbreviations ADV ENU LSCS W BF WSD A b C f h n Acoustics Doppler Velocity Meter East, North and Upward Linear Soil Conservation Services Bankfull channel width West, South and Down ward Area of channel cross section Bottom width of channel Chezy s channel coefficient Darcy-Weisbach Friction factor Height of channel Manning s roughness coefficient Symbols %SF B %SF W A` b/h d` ρ f a f c g h` h`1 and h`2 h 0 k K s Percentage of shear force which is carried by the base Percentage of shear force which is carried by the walls Amplitude of a meander channel Width depth ratio or aspect ratio The thickness of laminar sub-layer Density of flowing fluid Apparent friction factor Composite friction Acceleration due to gravity Distance from the channel wall Heights respectively from the wall Distance from the channel bottom at which logarithmic law indicates zero velocity Von Karman s constant The equivalent sand grain roughness of the surface xi
14 M N r P Q R r c S SF S r U Slope of the semi-log plot of velocity distributions Reynolds number ratio Wetted perimeter of the channel section Discharge Hydraulic radius of the channel cross section Least centerline radius of curvature Bed Slope of the Channel Total shear force shear force Sinuosity of the Channel Primary longitudinal velocity u* The velocity scale in the study of velocity distribution close to the walls in open channels u 1 and u 2 V V x V y V z W 0 w α Αspect ratio ν The time averaged velocities The secondary flow velocities Longitudinal component of velocity in ADV Radial component of velocity in ADV Vertical component of velocity in ADV The secondary flow velocities Dynamic viscosity of water Mean Wall shear stress by Energy Gradient Method Distribution of wall shear stress around wetted perimeter. Kinematic viscosity xii
15 CHAPTER 1 INTRODUCTION
16 INTRODUCTION 1.1. GENERAL A lmost all the natural water resource conduits are open channel that meander. In fact straight river reaches longer than 10 to 12 times the channel widths are almost nonexistent in nature. Reliable estimates of discharge capacity are essential for the design, operation, and maintenance of open channels, more importantly for the prediction of flood, water level management, and flood protection measures. River meandering is a complicated process involving a large number of channel and flow parameters. Inglis (1947) was probably the first to define meandering and it states where however, banks are not tough enough to withstand the excess turbulent energy developed during floods, the banks erode and the river widens and shoals. In channels with widely fluctuating discharges and silt charges, there is a tendency for silt to deposit at one bank and for the river to move to the other bank. This is the origin of meandering Leliavsky (1955) summarizes the concept of river meandering in his book which quotes The centrifugal effect, which causes the super elevation may possibly be visualised as the fundamental principles of the meandering theory, for it represents the main cause of the helicoidal cross currents which removes the soil from the concave banks, transport the eroded material across the channel, and deposit it on the convex banks, thus intensifying the tendency towards meandering. It follows therefore that the slightest accidental irregularity in channel formation, turning as it does, the stream lines from their straight course may, under certain circumstances constitute the focal point for the erosion process which leads ultimately to meander. A river is the author of its own geometry. Distribution of flow and velocity in a meandering river is an important topic in river hydraulics to be investigated from a practical point of view in relation to the bank protection, navigation, water intakes, and sediment transport-depositional patterns. This further helps to determine the energy expenditure and bed shear stress distribution. The distribution of wall shear stress is influenced by many factors, notably the shape of the cross-section, the longitudinal variation in plan form geometry, the sediment concentration and the lateral and longitudinal distribution of wall roughness. Accurate assessment of the discharge capacity of meandering channels are 1

17 Introduction therefore essential in suggesting structures for flood control and in designing artificial waterways etc MEANDERING - ITS EFFECTS AND INFLUENCE The term meandering derives its meaning from the river known to the ancient Greeks as Maiandros or Meander, characterised by a very convoluted path along the lower reach. As such, even in Classical Greece the name of the river had become a common noun meaning anything convoluted and winding, such as decorative patterns or speech and ideas, as well as the geomorphological feature. Strabo said: "... its course is so exceedingly winding that everything winding is called meandering." The Meander River is located in present-day Turkey, south of Izmir, eastward the ancient Greek town of Miletus, now Turkish Milet. It flows through a graben in the Menderes Massif, but has a flood plain much wider than the meander zone in its lower reach. In the Turkish name, the Büyük Menderes River, Menderes is from "Meander". Meanders are also formed as a result of deposition and erosion. Fig. 1.1 Simple Illustration of Formation of Meandering Channel from Straight Reach Meandering channels are equilibrium features that represent the most probable channel plan geometry, where single channels deviate from straightness (Fig. 1.1). A meander, in general, is a bend in a sinuous watercourse. It is formed when the moving water in a river erodes the outer banks and widens its valley. A stream of any volume of water may assume a meandering course, alternatively eroding sediments from the outside of a bend and depositing them on the inside. The result is a snaking pattern as the stream meanders back and forth across its down-valley axis. The degree of sinuosity required before a channel is called meandering. As bed width is related to discharge, meander wavelength also is related to discharge. The quasi-regular alternating bend of stream meanders are described in terms of their wavelength m, their radius of curvature r m, and their amplitude α m and is bankfull 2
18 Introduction channel width W BF. The radius of curvature of meander bends is not constant, so r m is somewhat subjectively defined for the bend apex (Fig. 1.2). Fig. 1.2 Planform of a Meandering River Showing Meander Wavelength, Radius of Curvature, Amplitude and Bankfull Channel Width It is an established fact that meandering represents a degree of adjustment of water and sediment laden river with its size, shape, and slope. The curvature develops and adjusts itself to transport the water and sediment load supplied from the watershed. The channel geometry, side slope, degree of meandering, roughness and other allied parameters are so adjusted that in course of time the river does the least work in turning, while carrying the loads. With the exception of straight rivers, for most of the natural rivers, the channel slope is usually less than the valley slope. The meander pattern represents a degree of channel adjustment so that a river with flatter slope can exist on a steeper valley slope. Sinuosity is one of the channel types that a stream may assume overall or part of its course. All streams are sinuous at some time in their geologic history over some part of their length. The meander ratio or sinuosity index is a means of quantifying how much a river or stream meanders (how much its course deviates from the shortest possible path). It is calculated as the length of the stream divided by the length of the valley. A perfectly straight river would have a meander ratio of 1 (it would be the same length as its valley), while the higher this ratio, the more the river meanders. Sinuosity indices are calculated from the map or from an aerial photograph measured over a distance called the reach, which should be at least 20 times the average fullbank channel width. The length of the stream is measured by channel, or thalweg, length over the reach, while the bottom value of the ratio is the downvalley length or air distance of the stream between two points on it defining the reach. The sinuosity index plays a part in mathematical descriptions of streams (Fig. 1.3). 3
19 Introduction Fig. 1.3 Classification of Channels According to Sinuosity Ratio Two parameters are used to classify meandering channels into its categories. Rivers with, is classified as straight when the sinuosity ratio is less than 1.05, and more are classified as sinuous and meandering. The other parameter defining meandering plan form is the ratio of the least centerline radius of curvature (r c ) to the channel width (b) given as (r c /b). Meandering channels are also classified as shallow or deep depending on the ratio of the average channel width (b) to its depth (h). In shallow channels (b/h >5, Rozovskii, 1961) the wall effects are limited to a small zone near the wall which may be called as "wall zone". The central portion called "core zone" is free from the wall effects. In deep channels (b/h<5) the influence of walls are felt throughout the channel width. Meandering and the flow interaction between main channel and its adjoining floodplains are those natural processes that have not been fully understood ESSENCE OF PROPER VALUE OF ROUGHNESS COEFFICIENTS AND BOUNDARY SHEAR DISTRIBUTION IN MEANDERING CHANNEL FLOW The usual practice in one dimensional flow analysis is to select an appropriate value of roughness coefficient for evaluating the actual stage-discharge relationship of natural channel. The energy loss in a meandering channel is influenced by the channel flow parameters and are assumed to be lumped into a single value manifested in the form of resistance coefficients in terms of Manning`s n, Chezy`s C and Darcy Weisbach f. An improper roughness value can either underestimates or overestimate the discharge. A number of researchers have studied the phenomenon of flow mostly in straight channels and 4
20 Introduction have proposed a number of methods for estimating the discharge. Sellin (1964) and Shino and Knight (1999), Patra and Kar (2000), Patra and Khatua (2006), etc. have shown that the structure of the flow is surprisingly complex, even for straight compound channels. It has velocity in all the three directions. Consequently, the use of design methods based on straight channels is inappropriate when applied to multiple stage meandering channels, results in large errors when estimating the discharge. Determination of suitable value of roughness coefficient for a given channel is therefore the most significant factor for evaluating the actual carrying capacity of a natural channel. Knowledge on wall shear stress distribution in open channel flow is required to solve a variety of engineering and river hydraulics problems so as to give a basic idea on the resistance relationship, to understand the mechanism of sediment transport, and to design stable channels etc. The study also helps in the analysis of migration problems as well as bank erosion in river channel. It is a great challenge to the river engineers and researchers to predict the distribution of wall shear stress ( w ) around the wetted perimeter of a given channel for a certain flow-rate. By integrating the wall shear stress along the surface, contribution to lift and drag on immersed objects can also be computed. Good many works have been reported on the distribution of wall shear for straight channels, but only a few studies are reported on the works involving meandering channels. The interaction between the primary longitudinal velocity U, the secondary flow velocities, V and W are responsible for non-uniform wall shear distribution in an open channel flow. So it is necessary for researchers and engineers to predict the distribution of wall shear in open channel flow both for straight and meandering reach in a sediment free condition SCOPE AND APPROACH OF PRESENT RESEARCH WORK In general, the classical methods of discharge estimations are normally based on flow in a straight channel. These are essentially flawed when applied to meandering channels. The study undertaken in the present case is primarily a step in understanding the flow processes and distribution of boundary shear in an idealised meander channel. It is supported by data collected from three experimental channels of different geometry, slope, aspect ratio and sinuosity. Experiments are conducted using fabricated channels at the Fluid Mechanics and Hydraulics Engineering Laboratory at the National Institute of Technology, Rourkela, on straight and meandering channels under sediment-free condition. A rigid boundary channel 5
21 Introduction is considered to be more appropriate to study the basic nature of flow interaction and flow parameters than going for movable bed. Most of the discharge calculation for channel is based mainly on refined one dimensional (1D) method. However, both 2D and 3D approaches are more complex to use in practice. An investigation of energy losses resulting from boundary friction, secondary flow, turbulence, and other factors in meandering channels has been presented. The energy loss is manifested in the form of variation of resistance coefficients of the channel with depth of flow. The variations of roughness coefficients with depths of flow are investigated. In the present study, it is attempted to formulate the models for predicting discharge by selecting a proper value of roughness coefficient in terms of Manning`s n, Chezy`s C and Darcy Weisbach f. The results of the present model are compared well with other established methods of Shino et al. (1999), LSCS method of James and Wark (1992), Toebes and Sooky (1967) method and the conventional method for discharge estimation. Also, a modified method has been proposed for evaluation of boundary shear in a meandering channel considering sinuosity and aspect ratio as basic influencing parameter ORGANISATION OF THE THESIS The thesis comprises of five chapters. General introduction is given in Chapter 1, literature review is presented in Chapter 2, experimental work is outlined in Chapter 3, results and discussions of the present work is Chapter 4 and finally the conclusions are in Chapter 5. The first chapter provides us a glance about the contents of the research work along with its related topics. It gives us an overview about the work done and presented in the dissertation. The literature review presented in Chapter 2 relates us to the work done by other established authors in this field from the very beginning till date. The chapter emphasizes on the research carried out in straight and meandering channels based on stage-discharge relationships, roughness coefficients and boundary shear distribution. Chapter 3 explains about the experimental work as a whole. This chapter discusses about the experimental set up and the adopted procedures of flow parameters, observations of channel. It also explains about the instruments used during the experimental processes. 6
22 Introduction The experimental results concerning boundary shear force, stage-discharge, and energy loss aspects in terms of Manning`s n, Chezy s C and Darcy-Weisbach f with the discussion of the results and theoretical considerations are depicted in Chapter 4. Finally, Chapter 5 summarizes the important conclusions drawn from the present work. Scope of future work that can be further carried out is also discussed in this chapter. References that have been made in the subsequent chapters are given at the end of the dissertation. 7
23 CHAPTER 2 LITERATURE REVIEW
24 LITERATURE REVIEW 2.1. GENERAL A look into the plan form of all meandering channels show that there can be three distinct type of geometry. They are straight, curved or meandering. Almost all natural rivers meander. The name meander, which probably originated from the river Meanders in Turkey is so frequent in river that it has attracted the interest of investigators from many disciplines. Thomson (1876) was probably the first to point out the existence of spiral motion in curved open channel. Since then, a lot of laboratory and theoretical studies are reported, more so, in the last decade or so concerning the flow in straight or curved channel. It may be worth while to understand the nature of flow in straight channels before knowing about the meander channels. There are limited studies available concerning the flow in meandering channels. Discharge estimation is based on the most suitable value of roughness coefficient. Knowledge on wall shear stress distribution in open channel flow is required to solve a variety of engineering and river hydraulic problems so as to understand the mechanism of sediment transport, and to design stable channels etc. The study on boundary shear and its distribution also give the basic idea on the resistance relationship PREVIOUS WORK ON ROUGHNESS COEFFICIENTS AND DISCHARGE ESTIMATION The Meandering channel flow is considerably more complex than constant curvature bend flow. Due to continuous stream wise variation of radius of curvature flow geometry in meander channel is in the state of either development or decay or both. The following important studies are reported concerning the flow in meander channels. Chezy was the first to investigate the flow in open the channel of the new Paris water supply. Chezy was the first to consider the wetted perimeter of channels as an analog of boundary resistance (Rouse and Ince, 1957). Chezy s equation has the form of V = C R 1/2 Sc 1/2 that uses a resistance coefficient C, the hydraulic radius (R=A/P) and the slope of the channel (S c ). 8
25 Literature Review The U.S. Army Corps of Engineers (Hydraulic 1956) conducted a series of stagedischarge experiments in meandering channels at the Waterways Experiments Station in Vicksburg. The main purpose of these experiments was to investigate the effect of the following geometric parameters on the conveyance capacity of compound meandering channels: radius of curvature of the bends, sinuosity of the main channel, depth of the floodplain flow, ratio of the floodplain area to the main channel area, and floodplain roughness. Although the study did not investigate the behaviour of the flow, its conclusions were of importance and were outlined as follows: (1) The effect of the main channel sinuosity on the channel conveyance was small when the main channel was narrow in comparison to the floodplain width; (2) the channel conveyance decreased as the sinuosity of the main channel increased; (3) the effect of the main channel sinuosity on the total channel conveyance was small when the floodplain width was more than three times the width of the meander belt; and (4) as the floodplain roughness increased, the conveyance decreased accordingly. Sinuosity is defined as the ratio of the length along the channel centre line between two points to the straight line distance between the points. Cowan (1956) proposed an equation to evaluate n as n = (n b + n 1 + n 2 + n 3 + n 4 ) m where, n b = base n value; n 1 = addition for surface irregularities; n 2 = addition for variation in channel cross section; n 3 = addition for obstructions; n 4 = addition for vegetation; m = ratio for meandering. The above method was improved by Arcement and Schneider (1989). Suggested values for Manning s n are tabulated by Chow (1959). The Soil Conservation Service (SCS) method for selecting roughness coefficient values for channels (Guide 1963) was found to be the best, giving a better stage prediction than the other methods. It proposed accounting for meander losses by adjusting the basic value of Manning's n on the basis of sinuosity (s), as follows: n ` = n n ` = n n ` = n for s < 1.2 for 1.2 s < 1.5 for s 1.5 9
26 Literature Review where, n` = the adjusted value; and n = the basic value. Because n is proportional to f l/2 the adjustment should be squared when using the Darcy-Weisbach equation. Toebes and Sooky (1967) carried out several experiments in small-scale flumes to determine the overall conveyance of meandering channels as a function of stage for specific geometries and to study the redistribution of the erosive forces acting on the boundaries under overbank flow conditions. They concluded that the energy losses, caused partially by the main channel and floodplain interaction and the sinuosity of the main channel, depend on both the Reynolds and the Froude numbers. Velocity components were measured for the different geometries to investigate the secondary flows and the formation of helical currents in the main channel and floodplain. From experimental results in a small laboratory channel with a sinuosity of 1.09, they proposed an adjustment to Darcy Weisbach`s f. Chang (1983) investigated energy expenditure and proposed an analytical model for obtaining the energy gradient, based on fully developed secondary circulation for wide rectangular sections. The method was for fully developed secondary circulation. In fact, the circulation took considerable distance to develop through a bend and begins to decay once the channel straightens out. For meanders there was also a tendency for the circulation to reverse between successive bends. The average energy gradient associated with secondary circulation along the channel was therefore substantially less than predicted assuming full development. Chang s approach was subsequently adapted to meandering channels by James and Wark (1992). Later, Chang (1984) analysed the meander curvature and other geometric features of the channel using energy approach. It established the maximum curvature for which the river did the last work in turning, using the relations for flow continuity, sediment load, resistance to flow, bank stability and transverse circulation in channel bends. The analysis demonstrated how uniform utilisation of energy and continuity of sediment load was maintained through meanders. He accounted for applying his full circulation loss model together with non-uniform flow calculations and predicted the distribution of losses, boundary shear stresses, and water levels through bends. Jarrett (1984) developed a model to determine Manning s n for natural high gradient channels having stable bed and in bank flow without meandering coefficient. He proposed, a 10
27 Literature Review value for Manning`s n as n = 0.32 R S where, S is the channel gradient, R the hydraulic radius in meters. The equation was developed for natural main channels having stable bed and bank materials (boulders) without bed rock. It was intended for channel gradients from and hydraulic radii from m, although Jarrett noted that extrapolation to large flows should not be too much. Wormleaton and Hadjipanos (1985) measured the velocity in each subdivision of the channel, and found that even if the errors in the calculation of the overall discharge were small, the errors in the calculated discharges in the floodplain and main channel may be very large when treated separately. They also observed that, typically, underestimating the discharge on the floodplain was compensated by overestimating it for the main channel. The failure of most subdivision methods is due to the complicated interaction between the main channel and floodplain flows. The interaction phenomenon has been studied by many researchers [e.g., Myers (1978), Knight and Demetriou (1983), Knight and Shiono (1990), and Shiono and Knight (1991)] in an attempt to quantify the effect and hence to predict correctly the flow in compound channels. Arcement and Schneider (1989) was basically modified Cowan method discussed above. It was designed specifically to account for selecting n values for natural channels and flood plains resistance. This work was performed for the U.S. Department of Transportation. In the modified equation the coefficients were taken as n b = a base value n for the floodplain`s natural bare soil; n 1 = a correction factor for the effect of surface irregularities on floodplain (range0-0.02); n 2 = a value for variation in channel shape and size of the floodplain cross section; n 3 = a value for obstructions on the floodplain (range ); n 4 = a value for vegetation on the floodplain (range ); m = a correction factor for sinuosity of the floodplain=1.0. Each variable values were selected from tables in Arcement and Schneider (1989). The equation was verified for wooden floodplains with flow depths from m. James and Wark s comprehensive study (1992) compared different methods of estimating the conveyance in meandering compound channels, and was summarized in Wark and James (1994). The methods were compared with three sets of laboratory-based data. The step nature of the SCS recommendation introduces discontinuities at the limits of the defined sinuosity ranges, with consequent ambiguity and uncertainty. To overcome the 11
28 Literature Review problem the relationship was linearised, known as the Linearised SCS (LSCS) Method. He proposed the value of Manning`s n using two cases of sinuosity (S r ), i.e. S r <1.7 and S r 1.7. Ervine et al. (1993) investigated the main parameters that affect the conveyance of compound meandering channels with different floodplain roughness using the Flood Channel Facility (FCF) at HR Wallingford, Oxfordshire, U.K. Three configurations were examined: (1) A 607 angle to the crossover with a regular trapezoidal main channel cross section; (2) a 607 angle to the crossover with a natural main channel cross section; and (3) a 1107 angle to the crossover with a natural main channel cross section. It was observed that the sinuosity has a large effect on both smooth and rough floodplain channels. The effect of the sinuosity decreases as the depth on the floodplain increases. The magnitude of this decrease is noticeably higher for channels with roughened floodplains. The aspect ratio of the main channel was also found to contribute significantly to the interaction between the floodplain and the main channel and, hence, also to the flow structure mechanisms. Higher meander belt ratios resulted in higher energy losses. Greenhill and Sellin (1993) compared different subdivision methods applied to meandering channels, using FCF stage discharge data from smooth meandering channels with two sinuosities. It was found that the error in discharge prediction was drastically reduced when a refined division method was used. The refined method was based on dividing the channel into three sub-channels: the main river channel, using the main channel bed slope; the floodplain within the meander belt, using the valley slope; and the floodplain outside the meander belt, also using the valley slope. The refined method was found to predict discharges with a very low error margin when checked against the experimental smooth channel data, provided that the value of the Manning coefficient was accurately chosen. Willets and Hardwick (1993) investigated flow in meandering channels using a small laboratory flume. Four sinuosities were examined with trapezoidal and natural cross sections for the channel. The conveyance of the overall channel was found to be affected inversely by the channel sinuosity. In other words, the flow resistance increases substantially with an increase in the main channel sinuosity. The main channel/floodplain flow interaction responsible for the flow resistance was also found to be dependent on the main channel cross section geometries. 12
29 Literature Review James (1994) reviewed the various methods for bend loss in meandering channel proposed by different investigators. He tested the results of the methods using the data of FCF, trapezoidal channel of Willets, at the University of Aberdeen, and the trapezoidal channels measured by the US Army Corps of Engineers at the Waterways Experiment Station, Vicksburg. The results were found considerably different. He proposed some new methods accounting for additional resistance due to bend by suitable modifications of previous methods. His modified methods predicted well the stage discharge relationships for meandering channels. Pang (1998) conducted experiments on compound channel in straight reaches under isolated and interacting conditions. It was found that the distribution of discharge between the main channel and floodplain was in accordance with the flow energy loss, which can be expressed in the form of flow resistance coefficient. In general, Manning's roughness coefficient n not only denoted the characteristics of channel roughness, but also influenced the energy loss in the flow. The value of n with the same surface in the main channel and floodplain possessed different values when the water depth in the section varied. Shiono, Al-Romaih, and Knight (1999) reported the effect of bed slope and sinuosity on discharge of two stage meandering channel. Basing on dimensional analysis, an equation for the conveyance capacity was derived, which was subsequently used to obtain the stagedischarge relationship for meandering channel with over bank flow. It was found that the channel discharge increased with an increase in bed slope and it decreased with increase in sinuosity for the same channel. An error of 10% in discharge estimation was reported for relative depths exceeding Maria and Silva (1999) expressed the friction factor of rough turbulent meandering flows as the function of sinuosity and position (which is determined by, among other factors, the local channel curvature). They validated the expression by the laboratory data for two meandering channels of different sinuosity. The expression was found to yield the computed vertically averaged flows that were in agreement with the flow pictures measured for both large and small values of sinuosity. Patra (1999), Patra and Kar (2000), Patra and Khatua (2006) and Khatua (2008) have shown that Manning s n not only denotes the roughness characteristics of a channel but also 13
30 Literature Review the energy loss in the flow. Jana & Panda et.al (2006) have performed dimensional analysis and predicted the stage-discharge relationship in meandering channels of low sinuosity. Lai Sat Hin et al. (2008) expressed that estimation of discharge capacity in river channels was complicated by variations in geometry and boundary roughness. Estimating flood flows was particularly difficult because of compound cross-sectional geometries and because of the difficulties of flow gauging. They presented results of a field study including the stage-discharge relationships and surface roughness in term of the Darcy-Weisbach friction factor, f a for several frequently flooded equatorial natural rivers. Equations were presented giving the apparent shear force acting on the vertical interface between the main channel and floodplain. The resulted apparent friction factor, f a was shown to increase rapidly for low relative depth. A method for predicting the discharge of overbank flow of natural rivers was then presented, by means of a composite friction, f c, which represented the actual resistance to flow due to the averaged boundary shear force and the apparent shear force. Equations were also presented giving the composite friction factor from easily calculated parameters for overbank flow of natural rivers. The discharge obtained using the proposed methods showed a significant improvement over traditional methods, with an averaged error of 2.7% OVERVIEW OF THE RESEARCH WORK ON BOUNDARY SHEAR Distribution of wall shear stress around the wetted perimeter of a channel is influenced by many factors notably, the shape of channel cross-section, the longitudinal variation in plan form geometry, the sediment concentration and the lateral-longitudinal distribution of wall roughness. It is important to appreciate the general three-dimensional flow structures that exist in open channels to understand the lateral distribution of boundary shear stress. The interaction between the primary longitudinal velocity U, and the secondary flow velocities, V and W are responsible for non-uniform wall shear distribution in an open channel flow. Researchers and engineers have predicted the distribution of wall shear in open channel flow for both straight and meandering reach. Einstein s (1942) hydraulic radius separation method is still widely used in laboratory studies and engineering practice. Einstein divided a cross-sectional area into two areas and assumed that the down-stream component of the fluid weight was balanced by the resistance of the bed. Likewise, the downstream component of the fluid weight in area A w was balanced 14
31 Literature Review by the resistance of the two side-walls. There was no friction at the interface between the two areas A b and A w. In terms of energy, the potential energy provided by area A b was dissipated by the channels bed, and the potential energy provided by area A w was dissipated by the two side-walls. Since 1960s, several experimental studies related to boundary shear and its distribution in open channel flow has been reported by many eminent researchers. Lundgren and Jonsson (1964) extended the logarithmic law to a parabolic cross-sectional open-channel and proposed a method to determine the shear stress. Ghosh and Roy (1970) presented that the boundary shear distribution in both rough and smooth open channels of rectangular and trapezoidal sections was obtained by direct measurement of shear drag on an isolated length of the test channel utilizing the technique of three point suspension system suggested by Bagnold. Existing shear measurement techniques were reviewed critically. Comparisons were made of the measured distribution with other indirect estimates, from isovels, and Preston tube measurements, based on Keulegan s resistance laws. The discrepancies between the direct and indirect estimates were explained and out of the two indirect estimates the surface Pitot tube technique was found to be more reliable. The influence of secondary flow on the boundary shear distribution was not accurately defined in the absence of a dependable theory on secondary flow. Kartha and Leutheusser (1970) expressed that the designs of alluvial channels by the tractive force method requires information on the distribution of wall shear stress over the wetted perimeter of the cross-section. The study was undertaken in order to provide some details on actually measured shear distributions and, hence, to check the validity of available design information. The latter was entirely analytical in origin and was based either on the assumption of laminar flow or on over-simplified models of turbulent channel flow. The experiments were carried out in a smooth-walled laboratory flume at various aspect ratios of the rectangular cross-section. Wall shear stress was determined with Preston tubes which were calibrated by a method exploiting the logarithmic form of the inner law of velocity distribution. Results were presented which clearly suggested that none of then present analytical techniques could be counted upon to provide any precise details on tractive force distributions in turbulent channel flow. 15
32 Literature Review Ghosh and Kar (1975) reported the evaluation of interaction effect and the distribution of boundary shear stress in meander channel with floodplain. Using the relationship proposed by Toebes and Sooky (1967) they evaluated the interaction effect by a parameter (W). The interaction loss increased up to a certain floodplain depth and there after it decreased. They concluded that the channel geometry and roughness distribution did not have any influence on the interaction loss. Myers (1978) carried out the experimentation using Preston tube to measure shear stress distributions around the periphery of a complex channel, consisting of a deep section and one flood plain. Measurements were made with full cross section flow and with flow confined to the deep, or channel, section. The results were used to quantify the momentum transfer due to interaction between the channel flow and that over its flood plain, demonstrating the danger of neglecting this phenomenon in complex channel analysis. Lateral momentum transfer throughout the channel and flood plain was compared under isolated and interacting conditions. Knight and Macdonald (1979) studied that the resistance of the channel bed was varied by means of artificial strip roughness elements, and measurements made of the wall and bed shear stresses. The distribution of velocity and boundary shear stress in a rectangular flume was examined experimentally, and the influence of varying the bed roughness and aspect ratio were accessed. Dimensionless plots of both shear stress and shear force parameters were presented for different bed roughness and aspect ratios, and those illustrated the complex way in which such parameters varied. The definition of a wide channel was also examined, and a graph giving the limiting aspect ratio for different roughness conditions was presented. The boundary shear stress distributions and isovel patterns were used to examine one of the standard side-wall correction procedures. One of the basic assumptions underlying the procedure was found to be untenable due to the cross channel transfer of linear momentum. Knight (1981) proposed an empirically derived equation that presented the percentage of the shear force carried by the walls as a function of the breadth/depth ratio and the ratio between the Nikuradse equivalent roughness sizes for the bed and the walls. A series of flume experiments were reported in which the walls and bed were differentially roughened, 16
33 Literature Review normal depth flow was set, and measurements were made of the boundary shear stress distribution. The results were compared with other available data for the smooth channel case and some disagreements noted. The systematic reduction in the shear force carried by the walls with increasing breadth/depth ratio and bed roughness was illustrated. Further equations were presented giving the mean wall and bed shear stress variation with aspect ratio and roughness parameters. Although the experimental data was somewhat limited, the equations were novel and indicated the general behavior of open channel flows with success. This idea was further discussed by Noutsopoulos and Hadjipanos (1982). Knight et al. (1984), Hu (1985) and Knight and his associates collected a great deal of experimental data about the effect of the side walls at different width depth ratios. With these data, they proposed several empirical relations which are very helpful in the studies of open-channel flow and sediment transport. Knight and Patel (1985) reported some of the laboratory experiments results concerning the distribution of boundary shear stresses in smooth closed ducts of a rectangular cross section for aspect ratios between 1 and 10. The distributions were shown to be influenced by the number and shape of the secondary flow cells, which, in turn, depended primarily upon the aspect ratio. For a square cross section with 8 symmetrically disposed secondary flow cells, a double peak in the distribution of the boundary shear stress along each wall was shown to displace the maximum shear stress away from the center position towards each corner. For rectangular cross sections, the number of secondary flow cells increased from 8 by increments of 4 as the aspect ratio increased, causing alternate perturbations in the boundary shear stress distributions at positions where there were adjacent contra-rotating flow cells. Equations were presented for the maximum, centerline, and mean boundary shear stresses on the duct walls in terms of the aspect ratio. Chiu and Chiou (1986) extended the logarithmic law to rectangular cross-sections and provided an analytical method to compute the wall shear stress. A parameter estimation method was developed for a system of three-dimensional mathematical models of flow in open channels, which did not require (primary flow) velocity data. It broadened the applicability and effectiveness of the model in scientific investigations into the complex interaction among the primary and secondary flows, shear stress distribution, channel characteristics (roughness, slope, and geometry), and other related variables governing all transport processes in open channels. The results were answered quantitatively many 17
34 Literature Review questions that aroused in open channel hydraulics. The difficulty was that the calculation of boundary shear stress required the knowledge of velocity profile. Knight and co-workers ( ), has led to an improved understanding of the lateral distributions of wall shear stress in prismatic channels and ducts. Nezu and Nakagawa (1993) pointed out that the results calculated by Chiu and Chiou revealed large errors. Rhodes and Knight (1994) deduced results of laboratory experiments on wide smooth rectangular ducts which were reported in terms of the relationship between duct aspect ratio b/h and the shear force on the walls expressed as a proportion of the total boundary shear force, %SF w. The data set (range 0.02 b/h 50) overlapped and extended the work of Knight and Patel (1985) that had range 0.1 b/h 10. A new form of empirical model was proposed for the %SF w b/h relationship. When compared with the %SF w predicted by assuming the shear force on an element of the boundary to be simply proportional to its length, the model results deviated from it, with definite maximum and minimum deviations. Following Einstein`s idea, Yang and Lim (1997) proposed an analytical method to delineate the two areas as given and determine the boundary shear stress distribution. An analytical approach for the partitioning of the flow cross-sectional area in steady and uniform three-dimensional channels was presented. The mechanism and direction of energy transport from the main flow were analyzed first. Based on the availability of surplus energy from the main flow, a concept of energy transportation through a minimum relative distance toward a unit area on the wetted perimeter was proposed. This led to a novel method to analytically divide the flow area into various parts corresponding to the channel shape and roughness composition of its wetted perimeter. The demarcated boundary or division line was evaluated using the presented equation. The existence of the division lines, which were lines of zero Reynolds shear stress within the flow region, had been proved through comparison with turbulence characteristics measurements. The method was illustrated in a study of the shear stress distribution in smooth rectangular open channels. Analytical solutions, valid for all aspect ratios, were derived for the mean side wall and bed shear stresses, and they compared well with existing experimental data from various researchers. However, their method was inconvenient for applications because of its implicit and segmental form except without considering the effect of secondary currents. 18
35 Literature Review Patra and Kar (2000) reported the test results concerning the boundary shear stress, shear force, and discharge characteristics of compound meandering river sections composed of a rectangular main channel and one or two floodplains disposed off to its sides. They used five dimensionless channel parameters to form equations representing the total shear force percentage carried by floodplains. A set of smooth and rough sections were studied with aspect ratio varying from 2 to 5. Apparent shear forces on the assumed vertical, diagonal, and horizontal interface plains were found to be different from zero at low depths of flow and changed sign with increase in depth over floodplain. They proposed a variable-inclined interface for which apparent shear force was calculated as zero. They presented empirical equations predicting proportion of discharge carried by the main channel and floodplain. Yang and McCorquodale (2004) developed a method for computing three-dimensional Reynolds shear stresses and boundary shear stress distribution in smooth rectangular channels by applying an order of magnitude analysis to integrate the Reynolds equations. A simplified relationship between the lateral and vertical terms was hypothesized for which the Reynolds equations become solvable. This relationship was in the form of a power law with an exponent of n = 1, 2, or infinity. The semi-empirical equations for the boundary shear distribution and the distribution of Reynolds shear stresses were compared with measured data in open channels. The power-law exponent of 2 gave the best overall results while n = infinity gave good results near the boundary. Guo and Julien (2005) determined the average bed and sidewall shear stresses in smooth rectangular open-channel flows after solving the continuity and momentum equations. The analysis showed that the shear stresses were functions of three components: (1) gravitational; (2) secondary flows; and (3) interfacial shear stress. An analytical solution in terms of series expansion was obtained for the case of constant eddy viscosity without secondary currents. In comparison with laboratory measurements, it slightly overestimated the average bed shear stress measurements but underestimated the average sidewall shear stress by 17% when the width depth ratio becomes large. A second approximation was formulated after introducing two empirical correction factors. The second approximation agreed very well (R 2 > 0.99 and average relative error less than 6%) with experimental measurements over a wide range of width depth ratios. Dey and Cheng (2005) and Dey and Lambert (2005) developed the expressions for the Reynolds stress and bed shear stress, assuming a modified logarithmic law of velocity 19
36 Literature Review profile due to upward seepage and with stream wise sloping beds. The computed Reynolds stress profiles were in agreement with the experimental data. Khatua (2008) and Khatua et al. (2009) undertook a series of laboratory tests for smooth and rigid meandering channels and developed numerical equations to evaluate and predict the boundary shear distribution OBJECTIVES OF THE PRESENT RESEARCH WORK The present research work is intended to study the variations of stage-discharge relationship with channel roughness, geometry and sinuosity in straight and meandering channels. The review shows the effect of the parameters such as the bed slope, aspect ratio, sinuosity, roughness coefficients, flow depth, etc. on the discharge estimation. Using dimensional analysis, a model for roughness coefficients is planned on which a method of calculation of discharge carried by meandering channel can be proposed. Again, the boundary shear distribution for meandering channels can be improved. This should be useful in the solution of many practical problems and for better understanding of the mechanism of flow. The present work is also directed towards understanding the underlying mechanism of flow resistance and flow distribution in the straight and meander channel rather than simulating a prototype situation. The experimental channel dimensions are small due to space and other limitations in the laboratory. In view of the above, the research program is taken up with the following objectives: fl To investigate the loss of energy with flow depth for meandering and straight channels in terms of variation of Manning s n, Chezy`s C, Darcy-Weisbach f from the experimental runs. fl To propose equations to estimate the percentage of shear carried by the wall of the meandering channel and to extend the models to the channels of high width ratio and sinuosity. 20
37 Literature Review fl To study the flow parameters of meandering channel on the basis of which a simple but accurate method of calculation of discharge carried by a meandering channel can be proposed. fl To validate the developed models using the available experimental channel data from other investigators. 21
38 CHAPTER 3 EXPERIMENTAL WORK
39 EXPERIMENTAL WORK 3.1. GENERAL The experiments have been conducted in the Fluid Mechanics and Hydraulics Laboratory of the Civil Engineering Department at the National Institute of Technology, Rourkela, India. In the laboratory, four types of flumes are fabricated in which channels of varying sinuosity; geometry and slope are cast inside. Experiments have been conducted in the channels by changing the geometrical parameters. This chapter discusses in detail the experimental procedure along with the apparatus required during the present work EXPERIMENTAL SETUP The present research uses both meandering and straight experimental channels fabricated inside the tilting flumes separately in the Fluid Mechanics and Hydraulics Engineering Laboratory of the Civil Engineering Department, at the National Institute of Technology, Rourkela. The present work is mainly based on the observation taken inside two straight channels, one of rectangular cross section (Type-I) and another of trapezoidal cross section (Type-II). The other two channels are Type-III and Type-IV respectively, consisting of meandering channel. The tilting flumes are made out of metal frame with glass walls at the test reach. The flumes are made tilting by hydraulic jack arrangement. Inside each flume, separate meandering/straight channels are cast using 5mm thick Perspex sheets. To facilitate fabrication, the whole channel length has been made in blocks of 1.20 m length each. The photo graphs of Type-II, III and IV experimental channels with measuring equipments taken from the down stream side are shown in Photos 3.1, 3.2, and 3.3 respectively. The detailed geometrical features of the experimental channels are given in Table


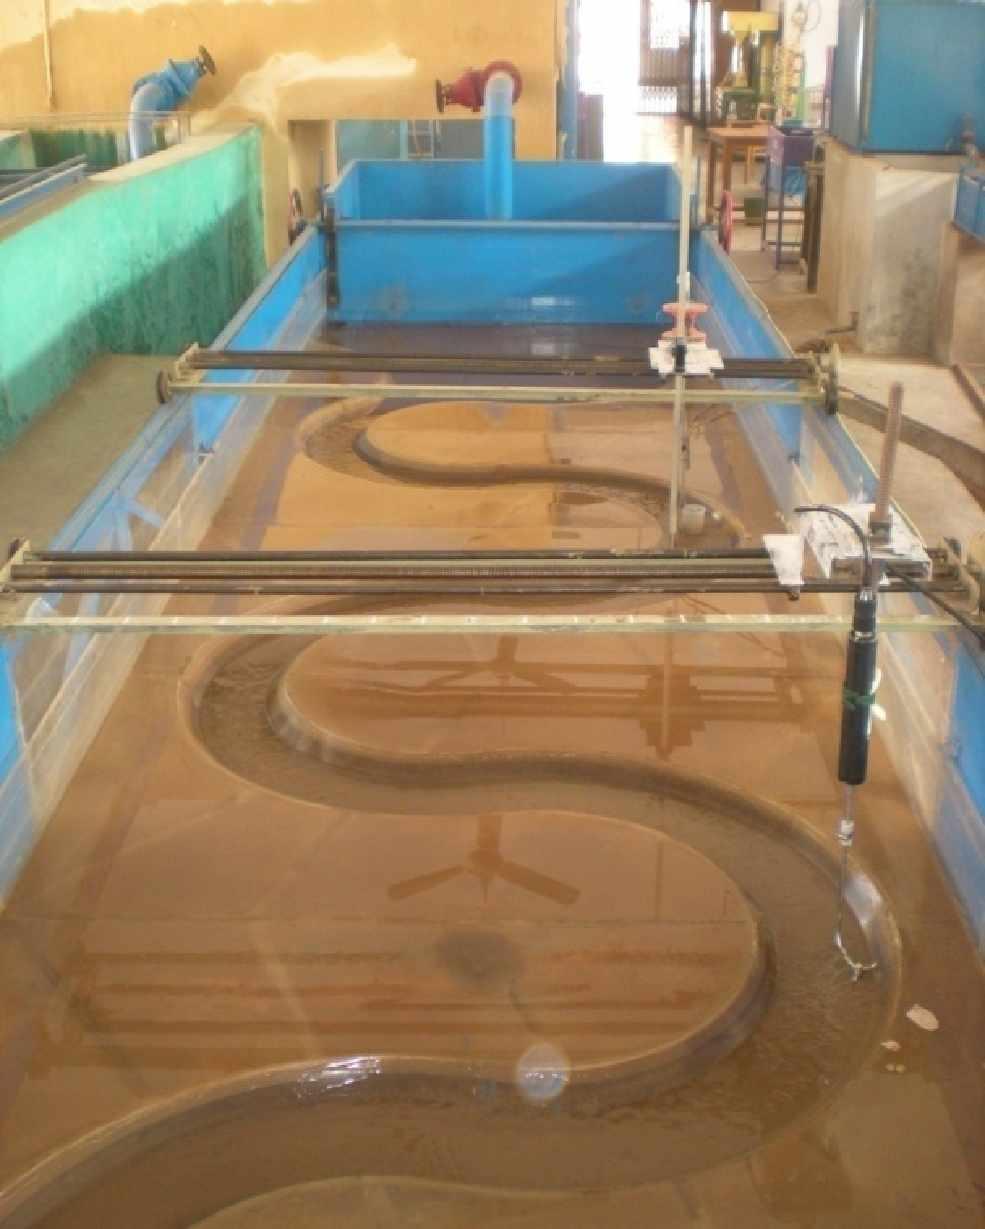
40 Experimental work Photo 3.1 Photo 3.2 Photo

41 Experimental work Table 3.1 Details of Geometrical Parameters of the Experimental Channels Sl no. Item description Type-I Type-II Type-III Type-IV 1 Channel Type Straight Straight Meandering Meandering 2 Wave length in down valley direction mm 2185 mm 3 Amplitude mm 4 Geometry of Main channel Trapezoidal Trapezoidal Rectangular Rectangular section (side slope 1:1) (side slope 1:1) 5 Nature of surface of bed Smooth and Smooth and rigid Smooth and Smooth and rigid bed bed rigid bed rigid bed 6 Channel width (b) 120 mm 120 mm at bottom and 280 mm at top 120 mm 120 mm at bottom and 280 mm at top 7 Bank full depth of channel 120 mm 80 mm 120 mm 80 mm 8 Bed Slope of the channel Varying 9 Meander belt width mm 1650 mm Minimum radius of 10 curvature of channel centerline at bend apex mm 420 mm 11 Sinuosity Cross over angle in degree mx0.4m 2.0m 0.6m 12m 0.6mx0.6mx 13 Flume size x12m long long 12m long 2.0m 0.6m 12 m long The fabricated channels have the following details. 1. Type-I channel: The straight channel section has the dimension of 120 mm 120 mm. The channel is cast inside a tilting flume of 12 m long, 450 mm wide, and 400 mm deep. The bed slope of the channel is kept at The plan view and details of the geometrical parameters of the Type-I channel are shown in Fig. 3.1 (a) and (b), respectively. Fig. 3.1(a) - Plan View of Type-I Channel inside the Experimental Flume 24
.")
42 Experimental work Fig. 3.1(b) Details of Geometrical Parameter of Type- I Channel 2. Type-II channel: The straight channel section is trapezoidal in cross section. The channel is of 120 mm wide at bottom, 280 mm wide at top having depth of 80 mm, and side slopes of 1:1 (Photo 3.1). The channel is cast inside a tilting flume of 12m long, 200 mm wide, and 600 mm deep. The bed slope of the channel is kept at The plan view and details of the geometrical parameters of the Type-II channel are shown in Fig. 3.2 (a) and (b), respectively. Fig. 3.2(a) Plan View of Type-II Channel inside the Experimental Flume Fig. 3.2(b) Details of Geometrical Parameter of Type- II Channel 25
.")
43 Experimental work 3. Type-III channel: The rectangular meandering channel has dimensions of 120 mm 120 mm in cross section. It has wavelength L = 400 mm, double amplitude 2A = 323 mm giving rise to sinuosity of 1.44 (Photo 3.2). This mildly meandering channel is placed inside a tilting flume of 12 m long, 600 mm wide, and 600 mm deep. The plan view and details of the geometrical parameters of the Type-III channel are shown in Fig. 3.3 (a) and (b), respectively. Fig. 3.3(a) Plan View of Type-III Channel inside the Experimental Flume Fig. 3.3(b) Details of One Wavelength of Type- III Channel 4. Type-IV channel: This meandering channel is trapezoidal in cross section. The channel is 120 mm wide at bottom, 280 mm at top having full depth of 80 mm, and side slopes of 1:1. The channel has wavelength L = 2185 mm and double amplitude 2A = 1370 mm. Sinuosity for this channel is scaled as 1.91 (Photo 3.3). The plan view and details of the geometrical parameters of the Type-IV channel are shown in Fig. 3.4 (a) and (b), respectively. 26
.")
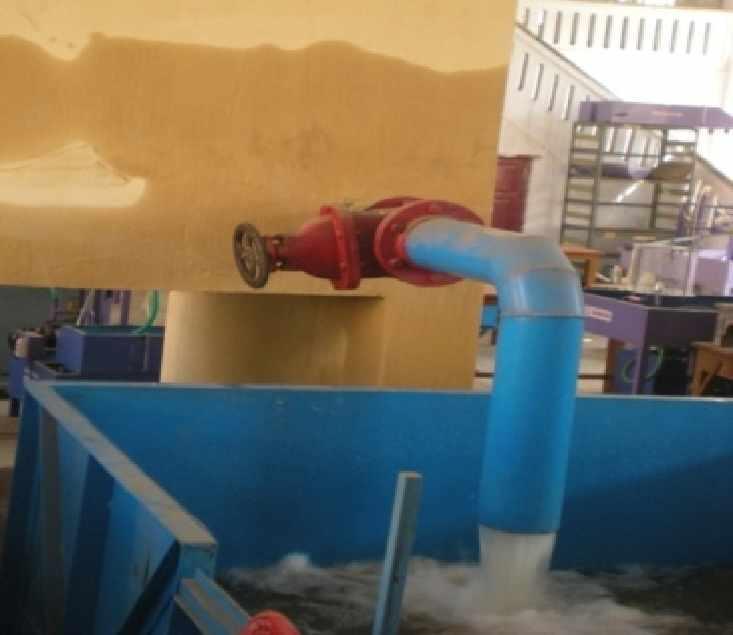
44 Experimental work Fig. 3.4(a) Plan View of Type-IV Channel inside the Experimental Flume Fig. 3.4(b) Details of One Wavelength of Type- IV Channel 3.3. EXPERIMENTAL PROCEDURE Apparatus and Methodology Water is supplied to the experimental setup by a recirculating system of water supply (Photo 3.4). Two parallel pumps are used to pump water from an underground sump to the overhead tank (Photo 3.4a). The overhead tank (Photo 3.4b) has an over flow arrangement to spill 27
45 Experimental work excess water to the sump and thus maintain a constant head. From the over head tank, water is led to a stilling tank (Photo 3.4 c) located at the upstream of the channel. A series of baffle walls between the stilling tank and channels are kept to reduce turbulence of the incoming water. At the end of the experimental channel, water is allowed to flow through a tailgate and is collected in a masonry volumetric tank (Photo 3.4f) from where it is allowed to flow back to the underground sump. From the sump, water is pumped back to the overhead tank, thus setting a complete re-circulating system of water supply for the experimental channel. The tailgate (Photo 3.4e) helps to establish uniform flow in the channel. It should be noted that the establishment of a flow that has its water surface parallel to the valley slope (where the energy losses are equal to potential energy input) may become a standard whereby the conveyance capacity of a meandering channel configuration is assessed. Water surface slope measurement is carried out using a pointer gauge (Photo 3.5) fitted to the travelling bridge operated manually having least count of 0.1 mm. Point velocities are measured using a 16-Mhz Micro ADV (Acoustic Doppler Velocity-meter) at a number of locations across the predefined channel section. Guide rails are provided at the top of the experimental flume on which a travelling bridge is moved in the longitudinal direction of the entire experimental channel. The point gauge and the micro-adv attached to the travelling bridge can also move in both longitudinal and the transverse direction of the experimental channel at the bridge position (Photo 3.6). The micro-adv readings are recorded in a computer placed besides the bridge (Photo 3.7 a, b). As the ADV is unable to read the data of upper most layer (up to 5cm from free surface), a micro -Pitot tube (Photo 3.8, Photo 3.9 a, b, c) of 4 mm external diameter in conjunction with suitable inclined manometer are used to measure velocity and its direction of flow at the pre defined points of the flow-grid. A flow direction finder is also used to get the direction of maximum velocity with respect to the longitudinal flow direction. The Pitot tube is physically rotated normal to the main stream direction till it gives maximum deflection of manometer reading. The angle of limb of Pitot tube with longitudinal direction of the channel is noted by the circular scale and pointer arrangements attached to the flow direction meter. Discharge in the channel is measured by the time rise method. The water flowing out at the down stream end of the experimental channel is led to a rectangular measuring tank of 1690 mm long x 1030 mm wide for Type-I channel, 1985 mm long xl900 mm wide for the Type-III channel and 2112 mm long x 3939 mm wide tank for Type-II and Type-IV channel. 28
46 Experimental work The change in the depth of water with time is measured by stopwatch in a glass tube indicator with a scale having least count of 0.01mm. A hand-operated tailgate weir is constructed at the downstream end of the channel to regulate and maintain the desired depth of flow in the flume. The bed slope is set by adjusting the whole structure, tilting it upwards or downwards with the help of a leaver, which is termed as slope changing leaver (Photo 3.12). Readings are taken for the different slopes, sinuosity and aspect ratio Determination of Channel Slope At the tail end, the impounded water in the channel is allowed to remain standstill by blocking the tail end. For Type-I and Type-II channel, the mean slope is obtained by dividing the level difference between the two end points of the test reach of 1 m along the centerline. The level difference between channel bed and water surface are recorded at a distance of one wavelength along its centerline for Type-III and Type-IV channels. For meandering channels, the mean slopes for Type-III and Type-IV channels is obtained by dividing the level difference between these two points by the length of meander wave along the centerline Measurement of Discharge and Water Surface Elevation A point gauge with least count of 0.1 mm is used to measure the water surface elevation above the bed of the channel. A measuring tank located at the end of each test channel receives water flowing through the channels. Depending on the flow rate, the time of collection of water in the measuring tanks vary between 50 to 262 seconds; lower one for higher rate of discharge. The time is recorded using a stopwatch. Change in the mean water level in the tank over the time interval is recorded. From the knowledge of the volume of water collected in the measuring tank and the corresponding time of collection, the discharge flowing in the experimental channel for each run of each channel is obtained. 29


47 Experimental work Start Photo 3.4(a) Photo 3.4(b) Photo 3.4(f) Photo 3.4(c) Photo 3.4(e) Photo 3.4 Recirculating Water System Photo 3.4(d) 30


48 Experimental work Photo 3.5 Photo 3.6 Photo 3.7(a) Photo 3.7(b) 31


49 Experimental work Photo 3.8 Photo 3.9(a) Photo 3.9(b) Photo 3.9 (c) Photo 3.10 Photo 3.11 Photo
 manufactured by M/s SonTek, San Diego, Canada is used for 3-axis (3D) velocity measurement at each grid")
50 Experimental work Measurement of Velocity and Its Direction A 16-MHz Micro ADV (Acoustic Doppler Velocity-meter) manufactured by M/s SonTek, San Diego, Canada is used for 3-axis (3D) velocity measurement at each grid point of the channel sections (Photo 3.7a). The higher acoustical frequency of 16 MHz makes the Micro-ADV the optimal instrument for laboratory study. The Micro ADV with the software package is used for taking high-quality three dimensional velocity data at different points. The data is received at the ADV-processor. A computer attached with the processor (Photo 3.7b) shows the 3-dimensional velocity data after compiling with the software package. At every point, the instrument records a number of velocity data per minute. With the statistical analysis using the installed software, mean values of 3D point velocities are recorded for each flow depth. The Micro-ADV uses the Doppler shift principle to measure the velocity of small particles, assuming to be moving at velocities similar to the fluid (Fig. 3.5 a). Velocities is resolved into three orthogonal components (tangential, radial, and vertical) and are measured at 5 cm below the sensor head, minimizing interference of the flow field, and allowing measurements to be made close to the bed. The Micro ADV has excellent features (Fig. 3.5 b) such as fl Three-axis velocity measurement fl High sampling rates - up to 50 Hz fl Small sampling volume - less than 0.1 cm 3 fl Distance to Sampling Volume-5 cm fl Small optimal scatterer - excellent for low flows fl High accuracy upto1% of measured range fl Large velocity ranges between 1 mm/s to 2.5 m/s fl Excellent low-flow performance fl No recalibration needed fl Comprehensive software Fig. 3.5 (a) - Standard Features of a MicroADV Fig. 3.5 (b) - Details of Probe of a MicroADV 33
51 Experimental work Boasting a sampling volume of less than 0.09 cc and sampling rates up to 50 Hz, the 16-MHz MicroADV is an ideal laboratory instrument for low flow and turbulence studies. Though the ADV has proven its versatility and reliability in a wide variety of applications, yet it is unable to read the upper layer velocity, that is, up to 50 mm from free surface. To overcome the short, a standard Prandtl type micro-pitot tube in conjunction with a manometer of accuracy 0.12 mm is used for the measurement of point velocity readings at the specified location for the upper 50 mm region from free surface across the channel. The results from the observations have been discussed in the next chapter. A flow direction meter is used to find the direction of the velocity readings taken by micro Pitot tube in the experimental channel. It essentially consists of a copper tube at lower end of which a metal pointer rod tied with a thread is attached, while another pointer at the upper end of the tube moves over a circular metallic protractor. The copper tube is fixed with the protractor through a ball bearing arrangement. The thread tied to the pointer rod is lowered into water that moves along the resultant direction of flow. The copper tube with the metal pointer rod at upper end is made to rotate till the pointer and thread are in a vertical straight line parallel to each other. The angle of rotation by upper pointer with the metallic protractor gives the direction of flow. The deviation of the angle of flow shown by the pointer with respect to the zero position of the metallic protractor (tangential direction) is taken as the local direction of the total velocity vector in the channel. When flow is confined to meander channel, velocity measurements are taken at the bend apex so as to get a broad picture of flow parameters covering half the meander wave length. For straight channels, the measurement is taken at the section in the central test reach. While taking velocity readings using Pitot tube, the tube is placed facing the direction of flow and then is rotated along a plane parallel to the bed and till it registers relatively a maximum head difference in the attached manometer. The deviation angle between the reference axis and the total velocity vector is considered positive, when the velocity vector is directed away from the outer bank. The total head h reading by the Pitot tube at the location in the channel is used to give the magnitude of the total velocity vector as U =2gh, where g is the acceleration due to gravity. Resolving U into the tangential and radial directions, the local velocity components are determined. While doing so, the tube coefficient is taken as unit and the error due to turbulence in the computation of U is considered negligible. Using the data of velocities by Pitot tube and micro-adv close to the 34
52 Experimental work surface of the channels, the boundary shear at various points on the channel bed at the predefined channel sections are evaluated from the logarithmic velocity distribution relationship which is described in the next chapter. All measurements are carried out under quasi-uniform flow condition by maintaining the out flow through downstream tailgate. Using the downstream tailgate, uniform flow is maintained for each experimental run and for each channel by maintaining the water surface slope parallel to the valley bed slope. Experimental results are accessed concerning stagedischarge-resistance relationships for meandering channels with rigid and smooth boundaries. All observations are recorded in the central test reach for straight channel of type-i and type-ii and at the bend apex of Type-III and type-iv (Photo 3.10 and Photo 3.11) meandering channels. Details of flow parameter of the experimental channels and the associated runs are given in Table-3.2. Table- 3.2 Hydraulic Details of the Experimental Runs Sl no Item description Type-I Type-II Type-III Type-IV 1 Channel Type Straight Straight Meandering Meandering 2 Number of runs for stagedischarge data 0.013, 0.015, 0.021) 55 (Slopes , , , 0.008, Discharge (cm 3 /s) Slope (1479, 2605, 3101, 3717, 4097, 4563, 5994) Slope (4798, 5329, 5899, 7210, 7809, 8636) 316, 426, Slope (294, 484, 987, 1742, 2048, 1061, 1280, , 3224, 3338, 3698, 4191, 2148, 2307, 1669, 2200, 4766, 6961, 4656, 5515, 6396, 7545) 2902, 3249, 2357, 2619, 8147, 8961, Slope (904, 1416, 2165, 4863, 5492, 4117, 4548, 2757, 2946, , 8473) 5058, 5947, 3338, 3698, Slope (2357, 4877, 5410, 5991, 7181, , 4656, 8157, 9480) 5596, 5680 Slope (1319, 2742, 4497, 4884, 6209, 8112, 8397) Slope (1286, 2150, 3346, 4070, 5451, 6123, 9223) Depth of flow (cm) corresponding to flow discharge of runs 5 Nature of surface of bed 6 No. of runs for detailed measurement of 3 dimensional point using Micro ADV 3.02, 3.44, 4.98, 5.24, 6.21, 6.80, 8.15, 8.82, 9.55, 10.92, smooth and rigid bed 5.2, 6.4, 7.0, 7.4, 7.8 smooth and rigid bed 1.29, 1.57, 3.44, 4.05, 4.98, 5.31, 5.78, 6.08, 6.41, 7.11, 7.7, 8.55, 9.34, 10.9,11.01 smooth and rigid bed Slope (3.1, 4.5, 5.0, 5.6, 5.9, 6.3, 7.4) Slope (5.7, 6.1, 6.5, 7.2, 7.5, 7.8) Slope (1.1, 1.4, 2.2, 3.1, 3.4, 4.1, 4.6, 4.7, 4.9, 5.3, 5.6, 6.2, 6.7, 7.3) Slope (1.9, 2.5, 3.3, 5.1, 5.6, 6.2, 7.0) Slope (3.1, 4.8, 5.1, 5.4, 6.0, 6.4, 7.0) Slope (2.1, 3.3, 4.4, 4.6, 5.3, 6.2, 6.3) Slope (1.9, 2.6, 3.4, 3.9, 4.6, 4.9, 6.3) smooth and rigid bed
53 CHAPTER 4 RESULTS AND DISCUSSIONS

54 RESULTS AND DISCUSSIONS 4.1. GENERAL The results of experiments concerning the distribution of velocity, flow, and boundary shear stress of meandering channels are presented in this chapter. Analysis of results is done for roughness coefficients and distribution of boundary shear in a meandering channel. The overall summary of experimental runs for straight channel (Type-I and Type-II) are given in Table 4.1 (a) and for meandering channels of Type-III and Type-IV it is given in Table 4.1 (b) and Fig. 4.1 (c), respectively. The detailed skeleton of the probe limits are shown in Fig Fig. 4.1 Cross Section of Channel for Experimentation Despite the use of three types of probes (up probe, down probe and side probe) there is a fringe zone for which the data could not be recorded due to the inherent limitations of the ADV as discussed in the previous chapter. The division of the channel section is done for the convenience to take the readings at maximum possible points as shown in Fig Therefore, the Pitot tube has been used to record the velocity of the fringe zone. 36
55 Results and Discussions Table 4.1(a) Experimental Runs for Type-I and Type-II Straight Channels Channel Type Run No Discharge Q (m 3 /sec) Flow Depth h (m) Channel Width b (m) Cross Section Area A(m 2 ) Wetted Perimeter P(m) Hydraulic Radius R= (A/P) Average Velocity (Q/A) (m/sec) Aspect Ratio(α) (1) (2) (3) (4) (5) (6) (7) (8) (9) (10) SR SR SR Type-I SR Straight SR Rectangular SR Channel SR Sinuosity=1 SR Slope= SR SR SR Type-II Straight Trapezoidal Channel Sinuosity=1 Slope= ST ST ST ST ST Channel Type Table 4.1(b) Experimental Runs for Type-III Meandering Channel Run No Discharge Q (m 3 /sec) Flow Depth h (m) Channel Width b (m) Cross Section Area A(m 2 ) Wetted Perimeter P(m) Hydraulic Radius R= (A/P) Average Velocity (Q/A) (m/sec) Aspect Ratio(α) (1) (2) (3) (4) (5) (6) (7) (8) (9) (10) MR MR MR MR MR MR MR MR MR Type-III Meandering Rectangular Channel Sinuosity=1.44 Slope= MR MR MR MR MR MR
56 Results and Discussions Channel Type Table 4.1(c) Experimental Runs for Type-I V Meandering Channels Run No Discharge Q (m 3 /sec) Flow Depth h (m) Channel Width b (m) Cross Section Area A(m 2 ) Wetted Perimeter P(m) Hydraulic Radius R= (A/P) Average Velocity (Q/A) (m/sec) Aspect Ratio(α) (1) (2) (3) (4) (5) (6) (7) (8) (9) (10) MT Meandering MT Trapezoidal MT Channel MT Sinuosity=1.91 MT Slope=0.003 MT MT Meandering Trapezoidal Channel Sinuosity=1.91 Slope= Meandering Trapezoidal Channel Sinuosity=1.91 Slope= Meandering Trapezoidal Channel Sinuosity=1.91 Slope=0.008 Meandering Trapezoidal Channel Sinuosity=1.91 Slope=0.013 Meandering Trapezoidal Channel Sinuosity=1.91 Slope=0.015 Meandering Trapezoidal Channel Sinuosity=1.91 Slope=0.021 MT MT MT MT MT MT MT MT MT MT MT MT MT MT MT MT MT MT MT MT MT MT MT MT MT MT MT MT MT MT MT MT MT MT MT MT MT MT MT MT MT MT MT MT MT MT MT MT
57 Results and Discussions 4.2. STAGE-DISCHARGE VARIATION FOR MEANDERING CHANNELS In the present investigation involving the flow in straight and meandering channels, achieving steady and uniform flow has been difficult due to the effect of curvature and the influence of a number of geometrical parameters. However, for the purpose of present work, an overall uniform flow is tried to be achieved in the channels. Flow depths in the experimental channel runs are so maintained that the water surface slope becomes parallel to the valley slope. At this stage, the energy losses are taken as equal to potential energy input. This has become a standard whereby the conveyance capacity of a meandering channel configuration can be assessed (Shiono, Al- Romaih, and Knight, 1999). Under such conditions, the depths of flow at the channel centerline separated by one wavelength distance must be the same. In all the experimental runs this simplified approach has been tried to achieve. This stage of flow is taken as normal depth, which can carry a particular flow only under steady and uniform conditions. The stage discharge curves plotted for different bed slopes for particular sinuosities of channel are shown in Fig The discharge increases with an increase in bed slope for the same stage. Fig. 4.2 Stage Discharge Variations in Open Channel Flow 4.3. VARIATION OF REACH AVERAGED LONGITUDINAL VELOCITY U WITH DEPTH OF FLOW Plots between the reach averaged velocity U and non-dimensional flow depth for all the experimental channels for the four types of channels are shown in Fig From the figure it 39
58 Results and Discussions can be seen that for all the channels, the increase in reach averaged longitudinal velocity of flow is nearly in accordance with the increase in depth of flow. The drop in the reach averaged velocity is higher for Type-IV channel. This may be due to spreading of water to a wider section for Type-IV channel than Type-I and Type-III channel sections, (Sinuosity S r = 1 for Type-I and Type-II, S r = 1.44 for Type-III, and S r = 1.91 for Type-IV), resulting additional resistance to flow. For all flow conditions, the rate of increase of velocity with flow depth is higher for the sinus channel of Type-IV and lower for straight channel of Type-I. This is mainly due to their large differences in the longitudinal bed slopes. The slope of the channel is an important parameter influencing the desired driving force. As for higher slopes (Type-IV, slope=0.021, 0.015, 0.013) in a particular channel there is increase in the rate of velocity with flow depth. Fig. 4.3 Variations of Velocity with Flow Depth in Open Channel Flow 4.4. DISTRIBUTION OF TANGENTIAL (LONGITUDINAL) VELOCITY Measurement of velocity for the experimental channels is mostly recorded by a micro-adv. The instrument uses the sign convention for 3-dimensional velocity as positive for ENU (east, north and upward) and negative for WSD (west, south and down ward) directions respectively for the longitudinal (V x ), radial (V y ) and vertical components (V z ). For the experimental channel position, east refers to the direction of longitudinal velocity. The east probe of ADV is kept in the longitudinal flow direction. Accordingly the other two flow directions are referred. In the experiments for meandering channels, the readings are taken at the bend apex with tangential velocity direction taken as east. For radial velocity, positive 40
59 Results and Discussions stands for outward and negative stands for inward radial velocity direction. Similarly, for vertical component of velocity when the ADV readings shows positive, then the velocity component is upward and if negative, it is in the down-ward direction. The detailed velocity and boundary shear distribution are carried out for three channels of Type-II, Type-III and Type-IV of sinuosity 1.00, 1.44 and 1.91, respectively. As the sinuosity of Type-I is similar as Type-II so, the detailed velocity distribution and evaluation of boundary shear has not been done. The measurements are taken at any cross section of the channel reach for straight channels of Type-II and at the bend apex for meandering channels of Type-III (Fig. 4.4a) and Type-IV (Fig. 4.4b). Fig. 4.4 (a) Location of Bend Apex (A-A) of Type-III Meandering Channel Fig. 4.4 (b) Location of Bend Apex (A-A) of Type-IV Meandering Channel For the straight channels of Type-II the radial distribution of tangential velocity with the boundary shear distribution are shown in Figs For meander channels, the radial distribution of tangential velocity in contour form for the runs of meandering channels of Type-III at bend apex are shown in Fig through Fig Similarly for Type-IV channels the radial distributions of tangential velocity at bend apex are shown in Fig The Fig , Fig and Fig also show the boundary shear distribution for straight channel of Type-II and meandering channels of Type-III and Type-IV respectively. 41


60 Results and Discussions Fig Flow depth h = 5.2 cm (Type-II channel) Fig Flow depth h = 6.4 cm (Type-II channel) Fig Flow depth h = 7.0 cm (Type-II channel) 42
 Fig. 4.6.2 Flow depth h = 6.08cm (Type-III channel) 43")
61 Results and Discussions Fig Flow depth h = 7.4 cm (Type-II channel) Figs Contours Showing the Distribution of Tangential Velocity and Boundary Shear for Type-II Straight Channel Fig Flow depth ` = 5.31cm (Type-III channel) Fig Flow depth h = 6.08cm (Type-III channel) 43
MEANDERING EFFECT FOR EVALUATION OF ROUGHNESS COEFFICIENTS IN OPEN CHANNEL FLOW
 Conference on Advances in Fluid Mechanics, 5th -7th September 00, Algarve-Portugal MEANDERING EFFECT FOR EVALUATION OF ROUGHNESS COEFFICIENTS IN OPEN CHANNEL FLOW K. K. Khatua, K.C.Patra and P.Nayak Department
STAGE DISCHARGE PREDICTION FOR MEANDERING CHANNELS
 K.K. Khatua, et al., Int. J. Comp. Meth. and Exp. Meas., Vol. 1, No. 1 (2013) 80 92 STAGE DISCHARGE PREDICTION FOR MEANDERING CHANNELS K. K. KHATUA, K.C. PATRA, P. NAYAK & N. SAHOO Department of Civil
ANALYSIS OF FLOW ALONG THE MEANDER PATH OF A HIGHLY SINUOUS RIGID CHANNEL
 ANALYSIS OF FLOW ALONG THE MEANDER PATH OF A HIGHLY SINUOUS RIGID CHANNEL A Thesis Submitted in Partial Fulfilment of the Requirement for the Degree of Master of Technology In Civil Engineering ARPAN PRADHAN
Analysis of Depth Averaged Velocity in Meandering Compound Channels
 Analysis of Depth Averaged Velocity in Meandering Compound Channels Prof. K.C.Patra, Ellora Padhi, Laxmipriya Mohanty & Manaswinee Patnaik. Department of Water Resources Engineering, National Institute
An experimental study of longitudinal velocity distribution at cross-over and bend section of a compound meandering channel
 American Journal of Civil Engineering 2013; 1(3): 124-128 Published online November 20, 2013 (http://www.sciencepublishinggroup.com/j/ajce) doi: 10.11648/j.ajce.20130103.16 An experimental study of longitudinal
Experimental Study of Discharge Characteristics in a Compound Meandering River
 American Journal of Engineering Research (AJER) e-issn : 2320-0847 p-issn : 2320-0936 Volume-02, Issue-07, pp-136-140 www.ajer.org Research Paper Open Access Experimental Study of Discharge Characteristics
Prediction of bed form height in straight and meandering compound channels
 Water Resources Management III 311 Prediction of bed form height in straight and meandering compound channels R. D. Karamisheva, J. F. Lyness, W. R. C. Myers, J. O Sullivan & J. B. C. Cassells School of
Transverse Distribution of Shear Stress in Compound Meandering Channel
 e-issn: 2278-1684, p-issn: 232-334X. Transverse Distribution of Shear Stress in Compound Meandering Channel A.sahu 1, L.Mohanty 2, K.K.Khatua³ 1,2 ( Department of Civil Engineering, VSSUT burla, India)
CHAPTER 2- BACKGROUND. INVESTIGATIONS OF COMPOSITE ROUGHNESS COEFFICIENT IN A RIVER WITH LOW FLOW
 2. Background 2.1 Introduction The estimation of resistant coefficient and hence discharge capacity in a channel or river is one of the fundamental problems facing river engineers. When applying Manning
Influence of Two-line Emergent Floodplain Vegetation on A Straight Compound Channel Flow
 International Journal of Integrated Engineering, Vol. 5 No. 1 (2013) p. 58-63 Influence of Two-line Emergent Floodplain Vegetation on A Straight Compound Channel Flow Mazlin Jumain 1,*, Zulkiflee Ibrahim
APPLICATION OF ADAPTIVE NEURO-FUZZY INFERENCE SYSTEM FOR THE ESTIMATION OF ROUGHNESS COEFFICIENT OF A MEANDERING OPEN-CHANNEL FLOW
 S. Moharana et al., Int. J. Sus. Dev. Plann. Vol. 10, No. 1 (2015) 87 99 APPLICATION OF ADAPTIVE NEURO-FUZZY INFERENCE SYSTEM FOR THE ESTIMATION OF ROUGHNESS COEFFICIENT OF A MEANDERING OPEN-CHANNEL FLOW
FLOW DISTRIBUTION IN STRAIGHT AND MEANDERING COMPOUND CHANNELS
 FLOW DISTRIBUTION IN STRAIGHT AND MEANDERING COMPOUND CHANNELS A PROJECT SUBMITTED IN PARTIAL FULFILMENT OF THE REQUIREMENTS FOR THE DEGREE OF Bachelor of Technology In Civil Engineering By Sangireddy
VELOCITY DISTRIBUTION IN TRAPEZOIDAL MEANDERING CHANNEL. A thesis submitted to. National Institute of Technology, Rourkela
 VELOCITY DISTRIBUTION IN TRAPEZOIDAL MEANDERING CHANNEL A thesis submitted to National Institute of Technology, Rourkela In partial fulfillment for the award of the degree of Master of Technology in Civil
5. Secondary Current and Spiral Flow
 5. Secondary Current and Spiral Flow The curve of constant velocity for rectangular and triangular cross-section obtained by Nikuradse are shown in Figures and 2. In all cases the velocities at the corners
Accounting for increased flow resistance due to lateral momentum loss in restoration designs using 2-stage channels
 Skamania 2005 Accounting for increased flow resistance due to lateral momentum loss in restoration designs using 2-stage channels Outline Aim and Objectives Definition Use of 2-stage channels in stream
Canadian Journal of Civil Engineering. Gene-Expression Programming to Predict Manning s n in Meandering Flows
 Gene-Expression Programming to Predict Manning s n in Meandering Flows Journal: Canadian Journal of Civil Engineering Manuscript ID cjce-2016-0569.r2 Manuscript Type: Article Date Submitted by the Author:
APPARENT SHEAR STRESS IN A COMPOUND CHANNEL
 APPARENT SHEAR STRESS IN A COMPOUND CHANNEL K. K. Khatua K. C. Patra R. Jha Asst. Professor Professor Professor Email: kkkhatua@yahoo.com/ kkkhatua@nitrkl.ac.in Department of Civil Engineering, N.I.T.Rourkela,
EQUATIONS FOR DISCHARGE CALCULATION IN COMPOUND CHANNELS HAVING HOMOGENEOUS ROUGHNESS * S. M. HOSSEINI **
 Iranian Journal of Science & Technology, Transaction B, Vol. 28, No. B5 Printed in The Islamic Republic of Iran, 2004 Shiraz University EQUATIONS FOR DISCHARGE CALCULATION IN COMPOUND CHANNELS HAVING HOMOGENEOUS
Detailed Investigation of Velocity Distributions in Compound Channels for both Main Channel and Flood Plain
 Detailed Investigation of Velocity Distributions in Compound Channels for both Main Channel and Flood Plain Jarmina Nake 1, Dr. Mimi Das Saikia 2 M.Tech Student, Dept. of Civil engineering, ADTU, Guwahati,
Uniform Channel Flow Basic Concepts. Definition of Uniform Flow
 Uniform Channel Flow Basic Concepts Hydromechanics VVR090 Uniform occurs when: Definition of Uniform Flow 1. The depth, flow area, and velocity at every cross section is constant 2. The energy grade line,
NATURAL RIVER. Karima Attia Nile Research Institute
 NATURAL RIVER CHARACTERISTICS Karima Attia Nile Research Institute NATURAL RIVER DEFINITION NATURAL RIVER DEFINITION Is natural stream of water that flows in channels with ih more or less defined banks.
Flow and Bed Topography in a 180 Curved Channel
 Flow and Bed Topography in a 180 Curved Channel Jae Wook Jung 1, Sei Eui Yoon 2 Abstract The characteristics of flow and bed topography has been analyzed by changing the bed materials in a 180-degree,
FLOOD-FLOW CHARACTERISTICS OF EQUATORIAL NATURAL RIVERS IN SARAWAK, MALAYSIA (Date received: )
") FLOOD-FLOW CHARACTERISTICS OF EQUATORIAL NATURAL RIVERS IN SARAWAK, MALAYSIA (Date received: 24.4.2007) Sai Hin Lai 1, Nabil Bessaih 2, Puong Ling Law 2, Nor Azazi bin Zakaria 1, Aminuddin bin Ghani 1
FLOOD-FLOW CHARACTERISTICS OF EQUATORIAL NATURAL RIVERS IN SARAWAK, MALAYSIA (Date received: 24.4.2007) Sai Hin Lai 1, Nabil Bessaih 2, Puong Ling Law 2, Nor Azazi bin Zakaria 1, Aminuddin bin Ghani 1
Analysis of Flow Resistance for Different Bed Materials with Varying Discharge Experimentally in Open Channels
 Analysis of Flow Resistance for Different Bed Materials with Varying Discharge Experimentally in Open Channels Lakshmi Mitra 1, Dr.Mimi Das Saikia 2 M.Tech. Student, Department of Civil Engineering, Assam
Keywords: flow characteristics, compound straight channel, bed morphology, floodplain
 Flow Characteristics on Floodplain Vegetation in Compound Straight Channels Nur Amirah Nabilah Mohd Zamri 1, a, Zulhilmi Ismail 1,b,Zulkiflee Ibrahim 1,c 1 Faculty of Civil Engineering, Universiti Teknologi
Discharge estimation in compound channels with fixed and mobile bed
 Sādhanā Vol. 34, Part 6, December 2009, pp. 923 945. Indian Academy of Sciences Discharge estimation in compound channels with fixed and mobile bed GALIP SECKIN 1, MUSTAFA MAMAK 1, SERTER ATABAY 2 and
Vermont Stream Geomorphic Assessment. Appendix E. River Corridor Delineation Process. VT Agency of Natural Resources. April, E0 - April, 2004
 Vermont Stream Geomorphic Assessment Appendix E River Corridor Delineation Process Vermont Agency of Natural Resources - E0 - River Corridor Delineation Process Purpose A stream and river corridor delineation
MATHEMATICAL MODELING OF FLUVIAL SEDIMENT DELIVERY, NEKA RIVER, IRAN. S.E. Kermani H. Golmaee M.Z. Ahmadi
 JOURNAL OF ENVIRONMENTAL HYDROLOGY The Electronic Journal of the International Association for Environmental Hydrology On the World Wide Web at http://www.hydroweb.com VOLUME 16 2008 MATHEMATICAL MODELING
Lecture 10: River Channels
 GEOG415 Lecture 10: River Channels 10-1 Importance of channel characteristics Prediction of flow was the sole purpose of hydrology, and still is a very important aspect of hydrology. - Water balance gives
Stage Discharge Prediction in a Prismatic Compound Channel
 International Journal of Civil Engineering Research. ISSN 2278-3652 Volume 5, Number 3 (2014), pp. 227-232 Research India Publications http://www.ripublication.com/ijcer.htm Stage Discharge Prediction
Composite roughness for rough compound channels
 Composite roughness for rough compound channels S. Pradhan Research Scholar (Ph. D), Department of Civil Engineering, National Institute of Technology, Rourkela, Orissa, India K.K.Khatua Associate Professor,
Effect of Roughness on Discharge
 Effect of Roughness on Discharge T.W. Lau, and N.R. Afshar Abstract These Water resource projects and hydraulic engineering works have been developing rapidly throughout the world, thus prediction of water
Factors affecting confluence scour
 & Wang (eds) River Sedimentation 1999., Balkema, Rotterdam. ISBN 9 9 3. 17 19 Factors affecting confluence scour R. B. Rezaur & A. W. Jayawardena. Department of Civil Engineering, The University of Hong
FLOW IN CONDUITS. Shear stress distribution across a pipe section. Chapter 10
 Chapter 10 Shear stress distribution across a pipe section FLOW IN CONDUITS For steady, uniform flow, the momentum balance in s for the fluid cylinder yields Fluid Mechanics, Spring Term 2010 Velocity
Uniform Channel Flow Basic Concepts Hydromechanics VVR090
 Uniform Channel Flow Basic Concepts Hydromechanics VVR090 ppt by Magnus Larson; revised by Rolf L Feb 2014 SYNOPSIS 1. Definition of Uniform Flow 2. Momentum Equation for Uniform Flow 3. Resistance equations
Closed duct flows are full of fluid, have no free surface within, and are driven by a pressure gradient along the duct axis.
 OPEN CHANNEL FLOW Open channel flow is a flow of liquid, basically water in a conduit with a free surface. The open channel flows are driven by gravity alone, and the pressure gradient at the atmospheric
This is a repository copy of An analytical model for lateral depth-averaged velocity distributions along a meander in curved compound channels.
 This is a repository copy of An analytical model for lateral depth-averaged velocity distributions along a meander in curved compound channels. White Rose Research Online URL for this paper: http://eprints.whiterose.ac.uk/80340/
EXPERIMENTAL STUDY OF FLOW THROUGH RIGID VEGETATION IN OPEN CHANNEL
 EXPERIMENTAL STUDY OF FLOW THROUGH RIGID VEGETATION IN OPEN CHANNEL A Thesis Submitted in Partial Fulfilment of the Requirements for the Degree of Master of Technology in Civil Engineering KAJAL PANIGRAHI
B-1. Attachment B-1. Evaluation of AdH Model Simplifications in Conowingo Reservoir Sediment Transport Modeling
 Attachment B-1 Evaluation of AdH Model Simplifications in Conowingo Reservoir Sediment Transport Modeling 1 October 2012 Lower Susquehanna River Watershed Assessment Evaluation of AdH Model Simplifications
This is a repository copy of Stage-Discharge Prediction for Converging Compound Channels with Narrow Floodplains.
 This is a repository copy of Stage-Discharge Prediction for Converging Compound Channels with Narrow Floodplains. White Rose Research Online URL for this paper: http://eprints.whiterose.ac.uk/126630/ Version:
Open Channel Flow Part 2. Ch 10 Young, notes, handouts
 Open Channel Flow Part 2 Ch 10 Young, notes, handouts Uniform Channel Flow Many situations have a good approximation d(v,y,q)/dx=0 Uniform flow Look at extended Bernoulli equation Friction slope exactly
Lecture Note for Open Channel Hydraulics
 Chapter -one Introduction to Open Channel Hydraulics 1.1 Definitions Simply stated, Open channel flow is a flow of liquid in a conduit with free space. Open channel flow is particularly applied to understand
Prof. B.S. Thandaveswara. Superelevation is defined as the difference in elevation of water surface between inside (1)
") 36.4 Superelevation Superelevation is defined as the difference in elevation of water surface between inside and outside wall of the bend at the same section. y=y y (1) 1 This is similar to the road banking
36.4 Superelevation Superelevation is defined as the difference in elevation of water surface between inside and outside wall of the bend at the same section. y=y y (1) 1 This is similar to the road banking
EFFECT OF CHANNEL BENDS ON TRANSVERSE MIXING
 NIJOTECH VOL. 10. NO. 1 SEPTEMBER 1986 ENGMANN 57 EFFECT OF CHANNEL BENDS ON TRANSVERSE MIXING BY E. O. ENGMANN ABSTRACT Velocity and tracer concentration measurements made in a meandering channel are
MEANDER MIGRATION MODEL ASSESSMENT FOR THE JANUARY 2005 STORM, WHITMAN PROPERTY, SAN ANTONIO CREEK, VENTURA COUNTY, CALIFORNIA
 MEANDER MIGRATION MODEL ASSESSMENT FOR THE JANUARY 2005 STORM, WHITMAN PROPERTY, SAN ANTONIO CREEK, VENTURA COUNTY, CALIFORNIA Prepared by Eric Larsen, Ph.D. Mark Rains, Ph.D. October 2006 INTRODUCTION
Geomorphology Geology 450/750 Spring Fluvial Processes Project Analysis of Redwood Creek Field Data Due Wednesday, May 26
 Geomorphology Geology 450/750 Spring 2004 Fluvial Processes Project Analysis of Redwood Creek Field Data Due Wednesday, May 26 This exercise is intended to give you experience using field data you collected
Closed duct flows are full of fluid, have no free surface within, and are driven by a pressure gradient along the duct axis.
 OPEN CHANNEL FLOW Open channel flow is a flow of liquid, basically water in a conduit with a free surface. The open channel flows are driven by gravity alone, and the pressure gradient at the atmospheric
Hydraulics of bendway weirs
 River Basin Management IV 389 Hydraulics of bendway weirs C. Thornton 1, S. Abt 1, D. Baird 2 & R. Padilla 3 1 Colorado State University, Fort Collins, CO, USA 2 U.S. Bureau of Reclamation, Denver, CO,
Aquifer an underground zone or layer of sand, gravel, or porous rock that is saturated with water.
 Aggradation raising of the streambed by deposition that occurs when the energy of the water flowing through a stream reach is insufficient to transport sediment conveyed from upstream. Alluvium a general
Hydraulic characteristics of meandering mobile bed compound channels
 Hydraulic characteristics of meandering mobile bed compound channels J. F. Lyness, MSc, PhD, MICE, W.R.C.Myers,BA, BSc, PhD, MICE and J. J. O'Sullivan, BA, BAI, MSc Proc. Instn Civ. Engrs Wat., Marit.
Advanced Hydraulics Prof. Dr. Suresh A. Kartha Department of Civil Engineering Indian Institute of Technology, Guwahati
 Advanced Hydraulics Prof. Dr. Suresh A. Kartha Department of Civil Engineering Indian Institute of Technology, Guwahati Module - 2 Uniform Flow Lecture - 1 Introduction to Uniform Flow Good morning everyone,
Hydraulic Design Of Polyethylene Pipes
 Hydraulic Design Of Polyethylene Pipes Waters & Farr polyethylene pipes offer a hydraulically smooth bore that provides excellent flow characteristics. Other advantages of Waters & Farr polyethylene pipes,
Modelling of flow and sediment transport in rivers and freshwater deltas Peggy Zinke
 1 Modelling of flow and sediment transport in rivers and freshwater deltas Peggy Zinke with contributions from Norwegian and international project partners 2 Outline 1. Introduction 2. Basic ideas of flow
GEOL 652. Poudre River Fieldtrip
 GEOL 652. Poudre River Fieldtrip One of the more difficult variables to measure and/or estimate when studying flow in natural channels is that of roughness. Roughness, usually approximated with Manning
Channel Pattern. Channel Pattern, Meanders, and Confluences. Description of Channel Pattern. Bridge (2003)
") Channel Pattern Channel Pattern, Meanders, and Confluences Outline Description of channel pattern Alternate bars Channel pattern continua and evolution Controls of channel pattern Description of Channel
Channel Pattern Channel Pattern, Meanders, and Confluences Outline Description of channel pattern Alternate bars Channel pattern continua and evolution Controls of channel pattern Description of Channel
Spreadsheet Tools for Quantifying the Costs and Benefits of Two-Stage Channels
 Spreadsheet Tools for Quantifying the Costs and Benefits of Two-Stage Channels J. Witter, A. Ward, D. Mecklenburg, J. D Ambrosio, S. Roley, and J. Tank AWRA Agricultural Hydrology and Water Quality II
Stream Geomorphology. Leslie A. Morrissey UVM July 25, 2012
 Stream Geomorphology Leslie A. Morrissey UVM July 25, 2012 What Functions do Healthy Streams Provide? Flood mitigation Water supply Water quality Sediment storage and transport Habitat Recreation Transportation
Conveyance Estimation System (CES) Launch
 Launch") (CES) Launch Conveyance Principles Caroline McGahey 10 June 2004 Why is there a new approach? Existing 1D software still based on historic hand-calculation methods - not based in rigorous physics - as
(CES) Launch Conveyance Principles Caroline McGahey 10 June 2004 Why is there a new approach? Existing 1D software still based on historic hand-calculation methods - not based in rigorous physics - as
7. Basics of Turbulent Flow Figure 1.
 1 7. Basics of Turbulent Flow Whether a flow is laminar or turbulent depends of the relative importance of fluid friction (viscosity) and flow inertia. The ratio of inertial to viscous forces is the Reynolds
THE HYDRAULIC PERFORMANCE OF ORIENTED SPUR DIKE IMPLEMENTATION IN OPEN CHANNEL
 Tenth International Water Technology Conference, IWTC10 2006, Alexandria, Egypt 281 THE HYDRAULIC PERFORMANCE OF ORIENTED SPUR DIKE IMPLEMENTATION IN OPEN CHANNEL Karima Attia 1 and Gamal El Saied 2 1
Investigation of Flow Profile in Open Channels using CFD
 Investigation of Flow Profile in Open Channels using CFD B. K. Gandhi 1, H.K. Verma 2 and Boby Abraham 3 Abstract Accuracy of the efficiency measurement of a hydro-electric generating unit depends on the
Turbulence is a ubiquitous phenomenon in environmental fluid mechanics that dramatically affects flow structure and mixing.
 Turbulence is a ubiquitous phenomenon in environmental fluid mechanics that dramatically affects flow structure and mixing. Thus, it is very important to form both a conceptual understanding and a quantitative
We will assume straight channels with simple geometries (prismatic channels) and steady state flow (in time).
 and steady state flow (in time).") 56 Review Drag & Lift Laminar vs Turbulent Boundary Layer Turbulent boundary layers stay attached to bodies longer Narrower wake! Lower pressure drag! 8. Open-Channel Flow Pipe/duct flow closed, full,
56 Review Drag & Lift Laminar vs Turbulent Boundary Layer Turbulent boundary layers stay attached to bodies longer Narrower wake! Lower pressure drag! 8. Open-Channel Flow Pipe/duct flow closed, full,
Probabilistic Evaluation of a Meandering Low-Flow Channel. February 24 th, UMSRS
 Probabilistic Evaluation of a Meandering Low-Flow Channel February 24 th, 2014 2014 UMSRS 1 2 acknowledgments Low- Flow Channel (LFC) overview Proposed Diversion Channel collects runoff from: The Rush
* Chapter 9 Sediment Transport Mechanics
 Chapter 9 Sediment Transport Mechanics Section I Introduction 9-1. Definition Sedimentation embodies the processes of erosion, entrainment, transportation, deposition, and compaction of sediment. These
Discharge estimation for equatorial natural rivers with overbank flow
 Intl. J. River Basin Management Vol. 6, No. (28), pp. 3 2 28 IAHR, INBO & IAHS Discharge estimation for equatorial natural rivers with overbank flow LAI SAI HIN, Lecturer, River Engineering and Urban Drainage
GLG598 Surface Processes and Landform Evolution K. Whipple Fall 2012 VERDE RIVER: FLOW MECHANICS, ROUGHNESS, AND SHEAR STRESS
 VERDE RIVER: FLOW MECHANICS, ROUGHNESS, AND SHEAR STRESS This lab will introduce you to some common field techniques and some general understanding of the geomorphic processes operating in a stream. The
SCOPE OF PRESENTATION STREAM DYNAMICS, CHANNEL RESTORATION PLANS, & SEDIMENT TRANSPORT ANALYSES IN RELATION TO RESTORATION PLANS
 DESIGN METHODS B: SEDIMENT TRANSPORT PROCESSES FOR STREAM RESTORATION DESIGN PETER KLINGEMAN OREGON STATE UNIVERSITY CIVIL ENGINEERING DEPT., CORVALLIS 2 ND ANNUAL NORTHWEST STREAM RESTORATION DESIGN SYMPOSIUM
1. Introduction. Keywords Compound channel, Momentum transfer, Relative roughness, Relative depth, Relative width
 International Journal of Hydraulic Engineering, (): -8 DOI:.9/j.ijhe.. Investigating the Effect of and Relative Roughness on Momentum Transfer in Symmetric Rectangular Compound Channels with Varius Relative
Fluid Mechanics Prof. S.K. Som Department of Mechanical Engineering Indian Institute of Technology, Kharagpur
 Fluid Mechanics Prof. S.K. Som Department of Mechanical Engineering Indian Institute of Technology, Kharagpur Lecture - 42 Flows with a Free Surface Part II Good morning. I welcome you to this session
CONCEPTS Conservational Channel Evolution and Pollutant Transport System
 CONCEPTS Conservational Channel Evolution and Pollutant Transport System Eddy J. Langendoen Watershed Physical Processes Research Unit National Sedimentation Laboratory USDA Agricultural Research Service
NATURE OF RIVERS B-1. Channel Function... ALLUVIAL FEATURES. ... to successfully carry sediment and water from the watershed. ...dissipate energy.
 1 2 Function... Sevier River... to successfully carry sediment and water from the watershed....dissipate energy. 3 ALLUVIAL FEATURES 4 CHANNEL DIMENSION The purpose of a stream is to carry water and sediment
PART 2:! FLUVIAL HYDRAULICS" HYDROEUROPE
 PART 2:! FLUVIAL HYDRAULICS" HYDROEUROPE 2009 1 HYDROEUROPE 2009 2 About shear stress!! Extremely complex concept, can not be measured directly!! Computation is based on very primitive hypotheses that
MODELING FLUID FLOW IN OPEN CHANNEL WITH HORSESHOE CROSS SECTION
 July. 2. Vol. 7. No. 2 MODELING FLUID FLOW IN OPEN CHANNEL WITH HORSESHOE CROSS SECTION 1 J. JOMBA, 2 D.M.THEURI, 2 E. MWENDA, 2 C. CHOMBA ABSTRACT Flow in a closed conduit is regarded as open channel
THE EFFECT OF THICKNESS OF PILLAR IN THE CHANNEL BEND TO CHANGES THE COEFFICIENT OF SUPERELEVATION
 Journal Engineering Science and Technology Vol. 11, No. 5 (2016) 745-754 School Engineering, Taylor s University THE EFFECT OF THICKNESS OF PILLAR IN THE CHANNEL BEND TO CHANGES THE COEFFICIENT OF SUPERELEVATION
Why Stabilizing the Stream As-Is is Not Enough
 Why Stabilizing the Stream As-Is is Not Enough Several examples of alternatives to the County s design approach have been suggested. A common theme of these proposals is a less comprehensive effort focusing
Fluid Mechanics Prof. T.I. Eldho Department of Civil Engineering Indian Institute of Technology, Bombay. Lecture - 17 Laminar and Turbulent flows
 Fluid Mechanics Prof. T.I. Eldho Department of Civil Engineering Indian Institute of Technology, Bombay Lecture - 17 Laminar and Turbulent flows Welcome back to the video course on fluid mechanics. In
Hydraulics Prof. Dr. Arup Kumar Sarma Department of Civil Engineering Indian Institute of Technology, Guwahati
 Hydraulics Prof. Dr. Arup Kumar Sarma Department of Civil Engineering Indian Institute of Technology, Guwahati Module No. # 04 Gradually Varied Flow Lecture No. # 07 Rapidly Varied Flow: Hydraulic Jump
FE Fluids Review March 23, 2012 Steve Burian (Civil & Environmental Engineering)
") Topic: Fluid Properties 1. If 6 m 3 of oil weighs 47 kn, calculate its specific weight, density, and specific gravity. 2. 10.0 L of an incompressible liquid exert a force of 20 N at the earth s surface.
Topic: Fluid Properties 1. If 6 m 3 of oil weighs 47 kn, calculate its specific weight, density, and specific gravity. 2. 10.0 L of an incompressible liquid exert a force of 20 N at the earth s surface.
Advanced Hydraulics Prof. Dr. Suresh A Kartha Department of Civil Engineering Indian Institute of Technology, Guwahati
 Advanced Hydraulics Prof. Dr. Suresh A Kartha Department of Civil Engineering Indian Institute of Technology, Guwahati Module - 2 Uniform Flows Lecture - 6 Design of Channels for Uniform Flow (Refer Slide
Sediment Transport Mechanism and Grain Size Distributions in Stony Bed Rivers. S.FUKUOKA 1 and K.OSADA 2
 Sediment Transport Mechanism and Grain Size Distributions in Stony Bed Rivers S.FUKUOKA 1 and K.OSADA 1 Professor, Research and Development Initiative, Chuo-University, 1-13-7 Kasuga Bunkyo-ku, Tokyo,
MODELING OF LOCAL SCOUR AROUND AL-KUFA BRIDGE PIERS Saleh I. Khassaf, Saja Sadeq Shakir
 ISSN 2320-9100 11 International Journal of Advance Research, IJOAR.org Volume 1, Issue 8,August 2013, Online: ISSN 2320-9100 MODELING OF LOCAL SCOUR AROUND AL-KUFA BRIDGE PIERS Saleh I. Khassaf, Saja Sadeq
Formation Of Hydraulic Jumps On Corrugated Beds
 International Journal of Civil & Environmental Engineering IJCEE-IJENS Vol:10 No:01 37 Formation Of Hydraulic Jumps On Corrugated Beds Ibrahim H. Elsebaie 1 and Shazy Shabayek Abstract A study of the effect
Chapter 10 Flow in Conduits
 Chapter 10 Flow in Conduits 10.1 Classifying Flow Laminar Flow and Turbulent Flow Laminar flow Unpredictable Turbulent flow Near entrance: undeveloped developing flow In developing flow, the wall shear
Towards the prediction of free-forming meander formation using 3D computational fluid dynamics
 Wasserbaukolloquium 2006: Strömungssimulation im Wasserbau 31 Dresdner Wasserbauliche Mitteilungen Heft 32 Towards the prediction of free-forming meander formation using 3D computational fluid dynamics
Overbank flow depth prediction in alluvial compound channels
 Provided by the author(s) and University College Dublin Library in accordance with publisher policies. Please cite the published version when available. Title Overbank flow depth prediction in alluvial
FORMATION OF HYDRAULIC JUMPS ON CORRUGATED BEDS
 International Journal of Civil & Environmental Engineering IJCEE-IJENS Vol: 10 No: 01 40 FORMATION OF HYDRAULIC JUMPS ON CORRUGATED BEDS Ibrahim H. Elsebaie 1 and Shazy Shabayek Abstract A study of the
R09. d water surface. Prove that the depth of pressure is equal to p +.
 Code No:A109210105 R09 SET-1 B.Tech II Year - I Semester Examinations, December 2011 FLUID MECHANICS (CIVIL ENGINEERING) Time: 3 hours Max. Marks: 75 Answer any five questions All questions carry equal
27. Running Water I (p ; )
") 27. Running Water I (p. 424-436; 440-444) Hydrosphere How much of the Earth s surface is covered by water? Earth's water is collectively called the and is stored in a number of so-called as follows: 1.
27. Running Water I (p. 424-436; 440-444) Hydrosphere How much of the Earth s surface is covered by water? Earth's water is collectively called the and is stored in a number of so-called as follows: 1.
Tom Ballestero University of New Hampshire. 1 May 2013
 Tom Ballestero University of New Hampshire 1 May 2013 1 Hydrology 2 Basic Hydrology Low flows most common Flows that fill the stream to the banks and higher are much less common Filling the stream to the
Flow structures in a compound meandering channel with flat and natural bedforms
 Loughborough University Institutional Repository Flow structures in a compound meandering channel with flat and natural bedforms This item was submitted to Loughborough University's Institutional Repository
Lateral Inflow into High-Velocity Channels
 Lateral Inflow into High-Velocity Channels by Richard L. Stockstill PURPOSE: This Coastal and Hydraulics Engineering Technical Note (CHETN) investigates lateral flow discharging into a high-velocity channel.
How to Design Bendway Weirs
 How to Design Bendway Weirs Project Background U.S. Bureau of Reclamation: Middle Rio Grande Channel Maintenance Program 29-Mile Study Reach: Cochiti Dam to Bernalillo Geomorphic Changes Due to Dam Construction
Streams. Stream Water Flow
 CHAPTER 14 OUTLINE Streams: Transport to the Oceans Does not contain complete lecture notes. To be used to help organize lecture notes and home/test studies. Streams Streams are the major geological agents
Project Proposal. Lyme Brook. Newcastle-under-Lyme. 3 rd July 2015
 Project Proposal Lyme Brook Newcastle-under-Lyme 3 rd July 2015 Contents Page 1.0 Introduction... 1.0 2.0 Background and rationale... 2.0 3.0 Proposed measures... 5 4.0 Summary of Recommendations... 10
ES 105 Surface Processes I. Hydrologic cycle A. Distribution % in oceans 2. >3% surface water a. +99% surface water in glaciers b.
 ES 105 Surface Processes I. Hydrologic cycle A. Distribution 1. +97% in oceans 2. >3% surface water a. +99% surface water in glaciers b. >1/3% liquid, fresh water in streams and lakes~1/10,000 of water
Discharge. Discharge (Streamflow) is: Q = Velocity (L T -1 ) x Area (L 2 ) Units: L 3 T -1 e.g., m 3 s -1. Velocity. Area
 is: Q = Velocity (L T -1 ) x Area (L 2 ) Units: L 3 T -1 e.g., m 3 s -1. Velocity. Area") Discharge Discharge (Streamflow) is: Q = Velocity (L T -1 ) x Area (L 2 ) Units: L 3 T -1 e.g., m 3 s -1 Velocity Area Where is the average velocity?? 3 Source: Brooks et al., Hydrology and the Management
Discharge Discharge (Streamflow) is: Q = Velocity (L T -1 ) x Area (L 2 ) Units: L 3 T -1 e.g., m 3 s -1 Velocity Area Where is the average velocity?? 3 Source: Brooks et al., Hydrology and the Management
Streams. Water. Hydrologic Cycle. Geol 104: Streams
 Streams Why study streams? Running water is the most important geologic agent in erosion, transportation and deposition of sediments. Water The unique physical and chemical properties of water make it
UNIT II CONVECTION HEAT TRANSFER
 UNIT II CONVECTION HEAT TRANSFER Convection is the mode of heat transfer between a surface and a fluid moving over it. The energy transfer in convection is predominately due to the bulk motion of the fluid
NPTEL Quiz Hydraulics
 Introduction NPTEL Quiz Hydraulics 1. An ideal fluid is a. One which obeys Newton s law of viscosity b. Frictionless and incompressible c. Very viscous d. Frictionless and compressible 2. The unit of kinematic