Applied Econometrics. Professor Bernard Fingleton
|
|
|
- Aron Carr
- 6 years ago
- Views:
Transcription

1 Applied Econometrics Professor Bernard Fingleton
2 Regression A quick summary of some key issues
3 Some key issues Text book JH Stock & MW Watson Introduction to Econometrics 2nd Edition Software Gretl Gretl.sourceforge.net 3
4 Course outline Week 5 introduction to regression Week 6 endogeneity & instrumental variables Week 7 panel data Week 8 spurious regression, Dickey-Fuller etc Week 9 cointegration and error correction Week 10 - autoregressive distributed lag models Week 11 vector autoregression (VAR), vector error correction, multiple cointegrating vectors Week 12 VAR, Johansen etc 4
5 Regression Regression is used to analyze how a single dependent variable (or Y variable) is affected by the values of one or more independent variables (also called regressors, X variables, factors). 5
6 6 Multiple regression ˆ... ˆ ˆ ˆ ˆ... ) ( = = = = k k k k k k X b X b X b b Y X b X b X b b Y E e X b X b X b b Y e X b X b b Y b 1 is change in E(Y) per unit change in X 1 b k-1 is change in E(Y) per unit change in X k-1
7 Interpreting partial regression coefficients b i is the change in E(Y) per unit change in X i, with all other variables held statistically constant E(Y) = b 0 + b 1 X 1 + b 2 X 2 assume we change X 1 by an amount equal to ΔX 1, but keep X 2 constant; this changes E(Y) to new E(Y) new E(Y) = b 0 + b 1 (X 1 + ΔX 1 ) + b 2 X 2 new E(Y) - E(Y) = ΔΕ( Y) = b 1 ΔX 1 thus if ΔX 1 = 1, ΔΕ( Y) = b 1 7
8 Theory indicating X variables output = f(labour, capital) adopt a Cobb-Douglas production function output = labour α capital β ln(output) = α ln(labour) + β ln(capital) if α + β > 1 we have increasing returns doubling inputs more than doubles output if α + β = 1 we have constant returns to scale 9
9 dy / Y elasticity = ;% change in Y per 1% change in X dx / X log Yˆ = b ˆ + bˆ log X 0 1 Yˆ = exp( bˆ ) X = b ˆ X bˆ 0 0 bˆ 1 1 dyˆ ˆ ˆ ˆ b1 1 = b 0 b1x dx dyˆ ˆ ˆ b1 = b1( b 0 X ) X dx dyˆ ˆ ˆ 1 = byx 1 dx ˆ / ˆ ˆ dy Y b1 = dx / X ˆ 1
10 Data indicating X variables letting the data speak is a good way to obtain a realistic theory we look at the data to identify important variables unimportant variables, that are indistinguishable from random variation and can be left in the error term 18
11 Methods for choosing X variables R 2 t tests F tests 19
12 R R = 1 - eˆ / S ˆ YY = corr(y,y ) 2 indicates, on a scale from 0 to 1, or 0% to 100% how much of Y s s variation is accounted for by the Xs s contained in the regression model [this equation assumes that b 0 is present] 20
13 R 2 DISADVANTAGES R 2 s s probability distribution is not constant making it difficult to objectively compare the R 2 of different models. R 2 ALWAYS increases if additional (perhaps unimportant)variables are added to the model. Hence the most complex model always seems the best using R 2. BUT R 2 -adjusted takes into account the number of Xs. 21
14 t -test Say we wish to test whether a particular variable, X i, should be included [In practice i could be,say, 2 if we were testing X 2 ] H 0 : b i =0 [X i has no effect on Y] t bˆ b bˆ = i i = i σˆ s se..( bˆ ) XX t ratio ~ t T k i When H o correct for population T = sample size, k = number of regression coefficients 22
15 23
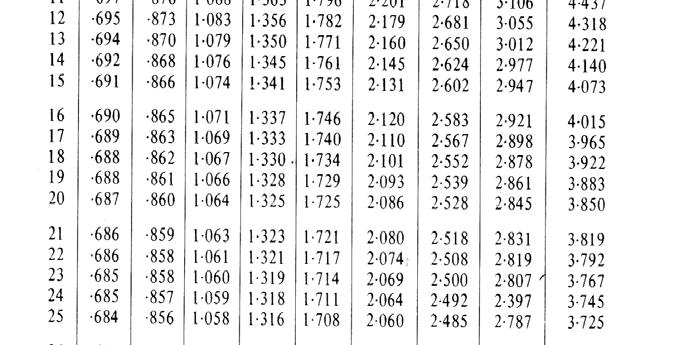
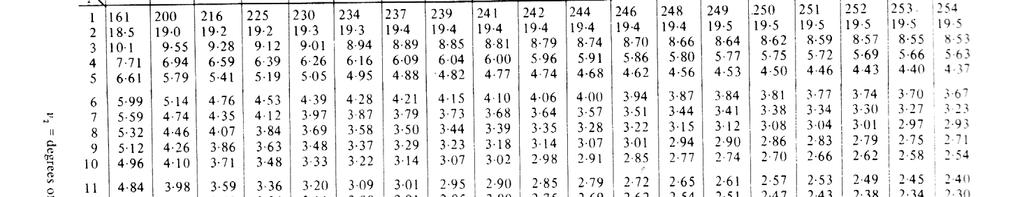
16 Taiwanese agricultural output The regression equation is ln output = ln labour ln capital Predictor Coef Stdev t-ratio p Constant b 0 = ln labour b 1 = ln capital b 2 = For ln(labour) from t tables t = / = 2.78 t crit = 2.18 with (T-k)( ) = = 12 degrees of freedom, crit is the value (ignoring sign) with p-value p = 0.05 in the 12 distribution t crit t 12 since t > t crit (ie p-value for t = < 0.05) reject H o that b 1 =0
17 Analysis of Variance (ANOVA) 25
18 F test : Jointly testing a group of X s H : b = b =...= b = O k 1 The test statistic is the F ratio calculated from an ANOVA table This is calculated automatically whenever a regression model is fitted to a data set 26
19 F test of a group of X variables H : b = b =... b = 0 H O A 1 2 k 1 is that H is untrue O ( SYY D)/( k 1) F = ~ Fk 1, T k assuming HO is true D/( T k) D= ( Y Yˆ ) = eˆ i S = ( Y Y) YY i i i 2 2 i i i i 2
20 The regression equation is cons = income wealth Predictor Coef Stdev t-ratio p Constant income wealth R-sq = Analysis of Variance (ANOVA table) SOURCE DF SS MS F p Regression < Error Total F = 92.4, p-value in F 2,7 is <0.0001
21 Analysis of Variance (ANOVA table) SOURCE DF SS MS F Regression k-1 S YY -D (S YY -D)/(k-1) (S YY -D)/(k-1) 2 error T-k D = e i D/(T-k) D/(T-k) Total T-1 S YY Analysis of Variance (ANOVA table) SOURCE DF SS MS F p Regression < Error Total

22 34
23 Interpreting the F test since the p-value for F = 92.4 is < 0.05 the H o is reject this means H : b = b =...= b = O is rejected 1 2 k 1 0 indicating that one or more b i is unequal to zero 35
24 Multicollinearity b -hence t- for any one variable will change as X variable(s) added or subtracted EXCEPT when the X variables not correlated with each other in which case t is the same in bivariate and multiple regression 37
25 Multicollinearity : consumption, income and wealth example A) The regression equation is consumption = income Predictor Coef Stdev t-ratio p Constant income B) The regression equation is consumption = income wealth Predictor Coef Stdev t-ratio p Constant income wealth Correlation of income and wealth = 0.999
26 Multicollinearity in A) income is highly significant similarly wealth alone is highly significant in B) wealth and income are insignificant yet paradoxically R 2 = 0.96 the reason for such extreme changes in the apparent effects is multicollinearity 39
27 Multicollinearity multicollinearity means that the X variables are very highly correlated, so that they are not distinct so with severe multicollinearity the estimated b s become very unreliable if we change X 1 (say) slightly, b 1 changes a lot the standard errors of the b s become very large hence we see low t values but high R 2 40
28 Multicollinearity Ln Halifax House price index, Greater London and Scotland Model 1: OLS, using observations 1983:2-2007:2 (T = 97) Dependent variable: lns coefficient std. error t-ratio p-value const e-017 *** lngl e-037 *** Mean dependent var S.D. dependent var Sum squared resid S.E. of regression R-squared Adjusted R-squared F(1, 95) P-value(F) 7.26e-37 Model 2: OLS, using observations 1983:2-2007:2 (T = 97) Dependent variable: lns coefficient std. error t-ratio p-value const e-019 *** lngl e-07 *** lne_ro e-028 *** Mean dependent var S.D. dependent var Sum squared resid S.E. of regression R-squared Adjusted R-squared F(2, 94) P-value(F) 4.36e-62
29 lns, lne_ro and lngl 7 lns lngl lne_ro
30 Solutions to multicollinearity problems use less-correlated X variables eg data for a longer/different time period, so that X 1, X 2, etc become more separated use the change in Y, X at each point in time rather than the levels of Y, X, since changes tend not to be as strongly correlated as levels 43
31 Solutions to multicollinearity problems use the change in Y, X at each point in time Actually the difference in logs equals the exponential growth rate X(t)=105 X(t-1)=100 growth 5% LnX(t) = lnx(t-1) = lnx(t)-lnx(t-1)=
32 Solutions to multicollinearity problems : use differences = growth with logs Model 3: OLS, using observations 1983:2-2007:2 (T = 97) Dependent variable: d_lns coefficient std. error t-ratio p-value const ** d_lngl d_lne_ro e-06 *** Mean dependent var S.D. dependent var Sum squared resid S.E. of regression R-squared Adjusted R-squared F(2, 94) P-value(F) 1.00e-06 45
33 Fitted values versus Scotland house price growth fv d_lns
34 Fitted values versus Scotland house price growth : with quarterly dummies Model 4: OLS, using observations 1983:2-2007:2 (T = 97) Dependent variable: d_lns coefficient std. error t-ratio p-value const * d_lngl ** d_lne_ro e-05 *** dq * dq *** dq Mean dependent var S.D. dependent var Sum squared resid S.E. of regression R-squared Adjusted R-squared F(5, 91) P-value(F) 2.70e-09 48
35 Observed S growth and fitted values : with quarterly dummies fv d_lns
36 F test of seasonal effects Model 5: OLS, using observations 1983:2-2007:2 (T = 97) Dependent variable: d_lns coefficient std. error t-ratio p-value const ** d_lngl d_lne_ro e-06 *** Mean dependent var S.D. dependent var Sum squared resid S.E. of regression R-squared Adjusted R-squared F(2, 94) P-value(F) 1.00e-06 Log-likelihood Akaike criterion Schwarz criterion Hannan-Quinn rho Durbin-Watson Comparison of Model 5 and Model 4: Null hypothesis: the regression parameters are zero for the variables dq1, dq2, dq3 Test statistic: F(3, 91) = , with p-value = e
37 Summary Statistical criteria R 2 gives the overall % of Y s variation accounted for by the X variables t test for testing the significance of individual Xs F test for testing whether groups of Xs should be present in the model Multicollinearity is a problem that occurs when we have highly correlated variables (as often occurs in time series) Solve by reducing the correlation by differencing and/or extra data 52
Exercises (in progress) Applied Econometrics Part 1
 Applied Econometrics Part 1") Exercises (in progress) Applied Econometrics 2016-2017 Part 1 1. De ne the concept of unbiased estimator. 2. Explain what it is a classic linear regression model and which are its distinctive features.
Exercises (in progress) Applied Econometrics 2016-2017 Part 1 1. De ne the concept of unbiased estimator. 2. Explain what it is a classic linear regression model and which are its distinctive features.
Brief Sketch of Solutions: Tutorial 3. 3) unit root tests
 unit root tests") Brief Sketch of Solutions: Tutorial 3 3) unit root tests.5.4.4.3.3.2.2.1.1.. -.1 -.1 -.2 -.2 -.3 -.3 -.4 -.4 21 22 23 24 25 26 -.5 21 22 23 24 25 26.8.2.4. -.4 - -.8 - - -.12 21 22 23 24 25 26 -.2 21 22
Brief Sketch of Solutions: Tutorial 3 3) unit root tests.5.4.4.3.3.2.2.1.1.. -.1 -.1 -.2 -.2 -.3 -.3 -.4 -.4 21 22 23 24 25 26 -.5 21 22 23 24 25 26.8.2.4. -.4 - -.8 - - -.12 21 22 23 24 25 26 -.2 21 22
Multiple Regression Analysis
 Chapter 4 Multiple Regression Analysis The simple linear regression covered in Chapter 2 can be generalized to include more than one variable. Multiple regression analysis is an extension of the simple
ARDL Cointegration Tests for Beginner
 ARDL Cointegration Tests for Beginner Tuck Cheong TANG Department of Economics, Faculty of Economics & Administration University of Malaya Email: tangtuckcheong@um.edu.my DURATION: 3 HOURS On completing
7. Integrated Processes
 7. Integrated Processes Up to now: Analysis of stationary processes (stationary ARMA(p, q) processes) Problem: Many economic time series exhibit non-stationary patterns over time 226 Example: We consider
1 Quantitative Techniques in Practice
 1 Quantitative Techniques in Practice 1.1 Lecture 2: Stationarity, spurious regression, etc. 1.1.1 Overview In the rst part we shall look at some issues in time series economics. In the second part we
The Multiple Regression Model Estimation
 Lesson 5 The Multiple Regression Model Estimation Pilar González and Susan Orbe Dpt Applied Econometrics III (Econometrics and Statistics) Pilar González and Susan Orbe OCW 2014 Lesson 5 Regression model:
G. S. Maddala Kajal Lahiri. WILEY A John Wiley and Sons, Ltd., Publication
 G. S. Maddala Kajal Lahiri WILEY A John Wiley and Sons, Ltd., Publication TEMT Foreword Preface to the Fourth Edition xvii xix Part I Introduction and the Linear Regression Model 1 CHAPTER 1 What is Econometrics?
EC408 Topics in Applied Econometrics. B Fingleton, Dept of Economics, Strathclyde University
 EC408 Topics in Applied Econometrics B Fingleton, Dept of Economics, Strathclyde University Applied Econometrics What is spurious regression? How do we check for stochastic trends? Cointegration and Error
APPLIED MACROECONOMETRICS Licenciatura Universidade Nova de Lisboa Faculdade de Economia. FINAL EXAM JUNE 3, 2004 Starts at 14:00 Ends at 16:30
 APPLIED MACROECONOMETRICS Licenciatura Universidade Nova de Lisboa Faculdade de Economia FINAL EXAM JUNE 3, 2004 Starts at 14:00 Ends at 16:30 I In Figure I.1 you can find a quarterly inflation rate series
Multiple Regression. Peerapat Wongchaiwat, Ph.D.
 Peerapat Wongchaiwat, Ph.D. wongchaiwat@hotmail.com The Multiple Regression Model Examine the linear relationship between 1 dependent (Y) & 2 or more independent variables (X i ) Multiple Regression Model
7. Integrated Processes
 7. Integrated Processes Up to now: Analysis of stationary processes (stationary ARMA(p, q) processes) Problem: Many economic time series exhibit non-stationary patterns over time 226 Example: We consider
Applied Econometrics. Professor Bernard Fingleton
 Applied Econometrics Professor Bernard Fingleton 1 Causation & Prediction 2 Causation One of the main difficulties in the social sciences is estimating whether a variable has a true causal effect Data
LINEAR REGRESSION ANALYSIS. MODULE XVI Lecture Exercises
 LINEAR REGRESSION ANALYSIS MODULE XVI Lecture - 44 Exercises Dr. Shalabh Department of Mathematics and Statistics Indian Institute of Technology Kanpur Exercise 1 The following data has been obtained on
Estimating σ 2. We can do simple prediction of Y and estimation of the mean of Y at any value of X.
 Estimating σ 2 We can do simple prediction of Y and estimation of the mean of Y at any value of X. To perform inferences about our regression line, we must estimate σ 2, the variance of the error term.
Applied Econometrics. Applied Econometrics Second edition. Dimitrios Asteriou and Stephen G. Hall
 Applied Econometrics Second edition Dimitrios Asteriou and Stephen G. Hall MULTICOLLINEARITY 1. Perfect Multicollinearity 2. Consequences of Perfect Multicollinearity 3. Imperfect Multicollinearity 4.
Time Series. Chapter Time Series Data
 Chapter 10 Time Series 10.1 Time Series Data The main difference between time series data and cross-sectional data is the temporal ordering. To emphasize the proper ordering of the observations, Table
Topic 4 Unit Roots. Gerald P. Dwyer. February Clemson University
 Topic 4 Unit Roots Gerald P. Dwyer Clemson University February 2016 Outline 1 Unit Roots Introduction Trend and Difference Stationary Autocorrelations of Series That Have Deterministic or Stochastic Trends
Introduction to Econometrics Chapter 4
 Introduction to Econometrics Chapter 4 Ezequiel Uriel Jiménez University of Valencia Valencia, September 2013 4 ypothesis testing in the multiple regression 4.1 ypothesis testing: an overview 4.2 Testing
Solution to Exercise E6.
 Solution to Exercise E6. The Multiple Regression Model. Inference Exercise E6.1 Beach umbrella rental Part I. Simple Linear Regression Model. a. Regression model: U t = α + β T t + u t t = 1,..., 22 Model
Christopher Dougherty London School of Economics and Political Science
 Introduction to Econometrics FIFTH EDITION Christopher Dougherty London School of Economics and Political Science OXFORD UNIVERSITY PRESS Contents INTRODU CTION 1 Why study econometrics? 1 Aim of this
10. Time series regression and forecasting
 10. Time series regression and forecasting Key feature of this section: Analysis of data on a single entity observed at multiple points in time (time series data) Typical research questions: What is the
About the seasonal effects on the potential liquid consumption
 About the seasonal effects on the potential liquid consumption Lucie Ravelojaona Guillaume Perrez Clément Cousin ENAC 14/01/2013 Consumption raw data Figure : Evolution during one year of different family
Introduction to Eco n o m et rics
 2008 AGI-Information Management Consultants May be used for personal purporses only or by libraries associated to dandelon.com network. Introduction to Eco n o m et rics Third Edition G.S. Maddala Formerly
4. Nonlinear regression functions
 4. Nonlinear regression functions Up to now: Population regression function was assumed to be linear The slope(s) of the population regression function is (are) constant The effect on Y of a unit-change
2. Linear regression with multiple regressors
 2. Linear regression with multiple regressors Aim of this section: Introduction of the multiple regression model OLS estimation in multiple regression Measures-of-fit in multiple regression Assumptions
Practice Questions for the Final Exam. Theoretical Part
 Brooklyn College Econometrics 7020X Spring 2016 Instructor: G. Koimisis Name: Date: Practice Questions for the Final Exam Theoretical Part 1. Define dummy variable and give two examples. 2. Analyze the
ECON 4551 Econometrics II Memorial University of Newfoundland. Panel Data Models. Adapted from Vera Tabakova s notes
 ECON 4551 Econometrics II Memorial University of Newfoundland Panel Data Models Adapted from Vera Tabakova s notes 15.1 Grunfeld s Investment Data 15.2 Sets of Regression Equations 15.3 Seemingly Unrelated
2.1. Consider the following production function, known in the literature as the transcendental production function (TPF).
.") CHAPTER Functional Forms of Regression Models.1. Consider the following production function, known in the literature as the transcendental production function (TPF). Q i B 1 L B i K i B 3 e B L B K 4 i
CHAPTER Functional Forms of Regression Models.1. Consider the following production function, known in the literature as the transcendental production function (TPF). Q i B 1 L B i K i B 3 e B L B K 4 i
EC408 Topics in Applied Econometrics. B Fingleton, Dept of Economics, Strathclyde University
 EC48 Topics in Applied Econometrics B Fingleton, Dept of Economics, Strathclyde University Applied Econometrics What is spurious regression? How do we check for stochastic trends? Cointegration and Error
ST430 Exam 2 Solutions
 ST430 Exam 2 Solutions Date: November 9, 2015 Name: Guideline: You may use one-page (front and back of a standard A4 paper) of notes. No laptop or textbook are permitted but you may use a calculator. Giving
Economics 308: Econometrics Professor Moody
 Economics 308: Econometrics Professor Moody References on reserve: Text Moody, Basic Econometrics with Stata (BES) Pindyck and Rubinfeld, Econometric Models and Economic Forecasts (PR) Wooldridge, Jeffrey
10) Time series econometrics
 Time series econometrics") 30C00200 Econometrics 10) Time series econometrics Timo Kuosmanen Professor, Ph.D. 1 Topics today Static vs. dynamic time series model Suprious regression Stationary and nonstationary time series Unit
30C00200 Econometrics 10) Time series econometrics Timo Kuosmanen Professor, Ph.D. 1 Topics today Static vs. dynamic time series model Suprious regression Stationary and nonstationary time series Unit
CHAPTER 6: SPECIFICATION VARIABLES
 Recall, we had the following six assumptions required for the Gauss-Markov Theorem: 1. The regression model is linear, correctly specified, and has an additive error term. 2. The error term has a zero
Econ 423 Lecture Notes: Additional Topics in Time Series 1
 Econ 423 Lecture Notes: Additional Topics in Time Series 1 John C. Chao April 25, 2017 1 These notes are based in large part on Chapter 16 of Stock and Watson (2011). They are for instructional purposes
3. Linear Regression With a Single Regressor
 3. Linear Regression With a Single Regressor Econometrics: (I) Application of statistical methods in empirical research Testing economic theory with real-world data (data analysis) 56 Econometrics: (II)
Multiple Regression. Midterm results: AVG = 26.5 (88%) A = 27+ B = C =
 A = 27+ B = C =") Economics 130 Lecture 6 Midterm Review Next Steps for the Class Multiple Regression Review & Issues Model Specification Issues Launching the Projects!!!!! Midterm results: AVG = 26.5 (88%) A = 27+ B =
Economics 130 Lecture 6 Midterm Review Next Steps for the Class Multiple Regression Review & Issues Model Specification Issues Launching the Projects!!!!! Midterm results: AVG = 26.5 (88%) A = 27+ B =
Econ 427, Spring Problem Set 3 suggested answers (with minor corrections) Ch 6. Problems and Complements:
 Ch 6. Problems and Complements:") Econ 427, Spring 2010 Problem Set 3 suggested answers (with minor corrections) Ch 6. Problems and Complements: 1. (page 132) In each case, the idea is to write these out in general form (without the lag
Econ 427, Spring 2010 Problem Set 3 suggested answers (with minor corrections) Ch 6. Problems and Complements: 1. (page 132) In each case, the idea is to write these out in general form (without the lag
Econometrics. 8) Instrumental variables
 Instrumental variables") 30C00200 Econometrics 8) Instrumental variables Timo Kuosmanen Professor, Ph.D. http://nomepre.net/index.php/timokuosmanen Today s topics Thery of IV regression Overidentification Two-stage least squates
30C00200 Econometrics 8) Instrumental variables Timo Kuosmanen Professor, Ph.D. http://nomepre.net/index.php/timokuosmanen Today s topics Thery of IV regression Overidentification Two-stage least squates
Exercise Sheet 6: Solutions
 Exercise Sheet 6: Solutions R.G. Pierse 1. (a) Regression yields: Dependent Variable: LC Date: 10/29/02 Time: 18:37 Sample(adjusted): 1950 1985 Included observations: 36 after adjusting endpoints C 0.244716
CHAPTER 21: TIME SERIES ECONOMETRICS: SOME BASIC CONCEPTS
 CHAPTER 21: TIME SERIES ECONOMETRICS: SOME BASIC CONCEPTS 21.1 A stochastic process is said to be weakly stationary if its mean and variance are constant over time and if the value of the covariance between
9) Time series econometrics
 Time series econometrics") 30C00200 Econometrics 9) Time series econometrics Timo Kuosmanen Professor Management Science http://nomepre.net/index.php/timokuosmanen 1 Macroeconomic data: GDP Inflation rate Examples of time series
30C00200 Econometrics 9) Time series econometrics Timo Kuosmanen Professor Management Science http://nomepre.net/index.php/timokuosmanen 1 Macroeconomic data: GDP Inflation rate Examples of time series
Answer all questions from part I. Answer two question from part II.a, and one question from part II.b.
 B203: Quantitative Methods Answer all questions from part I. Answer two question from part II.a, and one question from part II.b. Part I: Compulsory Questions. Answer all questions. Each question carries
Practical Econometrics. for. Finance and Economics. (Econometrics 2)
") Practical Econometrics for Finance and Economics (Econometrics 2) Seppo Pynnönen and Bernd Pape Department of Mathematics and Statistics, University of Vaasa 1. Introduction 1.1 Econometrics Econometrics
Practical Econometrics for Finance and Economics (Econometrics 2) Seppo Pynnönen and Bernd Pape Department of Mathematics and Statistics, University of Vaasa 1. Introduction 1.1 Econometrics Econometrics
Ch 2: Simple Linear Regression
 Ch 2: Simple Linear Regression 1. Simple Linear Regression Model A simple regression model with a single regressor x is y = β 0 + β 1 x + ɛ, where we assume that the error ɛ is independent random component
Questions and Answers on Unit Roots, Cointegration, VARs and VECMs
 Questions and Answers on Unit Roots, Cointegration, VARs and VECMs L. Magee Winter, 2012 1. Let ɛ t, t = 1,..., T be a series of independent draws from a N[0,1] distribution. Let w t, t = 1,..., T, be
NATCOR Regression Modelling for Time Series
 Universität Hamburg Institut für Wirtschaftsinformatik Prof. Dr. D.B. Preßmar Professor Robert Fildes NATCOR Regression Modelling for Time Series The material presented has been developed with the substantial
Time Series Methods. Sanjaya Desilva
 Time Series Methods Sanjaya Desilva 1 Dynamic Models In estimating time series models, sometimes we need to explicitly model the temporal relationships between variables, i.e. does X affect Y in the same
1 Regression with Time Series Variables
 1 Regression with Time Series Variables With time series regression, Y might not only depend on X, but also lags of Y and lags of X Autoregressive Distributed lag (or ADL(p; q)) model has these features:
DEPARTMENT OF ECONOMICS AND FINANCE COLLEGE OF BUSINESS AND ECONOMICS UNIVERSITY OF CANTERBURY CHRISTCHURCH, NEW ZEALAND
 DEPARTMENT OF ECONOMICS AND FINANCE COLLEGE OF BUSINESS AND ECONOMICS UNIVERSITY OF CANTERBURY CHRISTCHURCH, NEW ZEALAND Testing For Unit Roots With Cointegrated Data NOTE: This paper is a revision of
Exercise Sheet 5: Solutions
 Exercise Sheet 5: Solutions R.G. Pierse 2. Estimation of Model M1 yields the following results: Date: 10/24/02 Time: 18:06 C -1.448432 0.696587-2.079327 0.0395 LPC -0.306051 0.272836-1.121740 0.2640 LPF
Correlation Analysis
 Simple Regression Correlation Analysis Correlation analysis is used to measure strength of the association (linear relationship) between two variables Correlation is only concerned with strength of the
Lecture 8. Using the CLR Model. Relation between patent applications and R&D spending. Variables
 Lecture 8. Using the CLR Model Relation between patent applications and R&D spending Variables PATENTS = No. of patents (in 000) filed RDEP = Expenditure on research&development (in billions of 99 $) The
Econometrics Lab Hour Session 6
 Econometrics Lab Hour Session 6 Agustín Bénétrix benetria@tcd.ie Office hour: Wednesday 4-5 Room 3021 Martin Schmitz schmitzm@tcd.ie Office hour: Monday 5-6 Room 3021 Outline Importing the dataset Time
This is a repository copy of Estimating Quarterly GDP for the Interwar UK Economy: An Application to the Employment Function.
 This is a repository copy of Estimating Quarterly GDP for the Interwar UK Economy: n pplication to the Employment Function. White Rose Research Online URL for this paper: http://eprints.whiterose.ac.uk/9884/
Applied Economics. Regression with a Binary Dependent Variable. Department of Economics Universidad Carlos III de Madrid
 Applied Economics Regression with a Binary Dependent Variable Department of Economics Universidad Carlos III de Madrid See Stock and Watson (chapter 11) 1 / 28 Binary Dependent Variables: What is Different?
Simple Linear Regression: A Model for the Mean. Chap 7
 Simple Linear Regression: A Model for the Mean Chap 7 An Intermediate Model (if the groups are defined by values of a numeric variable) Separate Means Model Means fall on a straight line function of the
Eastern Mediterranean University Department of Economics ECON 503: ECONOMETRICS I. M. Balcilar. Midterm Exam Fall 2007, 11 December 2007.
 Eastern Mediterranean University Department of Economics ECON 503: ECONOMETRICS I M. Balcilar Midterm Exam Fall 2007, 11 December 2007 Duration: 120 minutes Questions Q1. In order to estimate the demand
A Guide to Modern Econometric:
 A Guide to Modern Econometric: 4th edition Marno Verbeek Rotterdam School of Management, Erasmus University, Rotterdam B 379887 )WILEY A John Wiley & Sons, Ltd., Publication Contents Preface xiii 1 Introduction
Univariate linear models
 Univariate linear models The specification process of an univariate ARIMA model is based on the theoretical properties of the different processes and it is also important the observation and interpretation
THE INFLUENCE OF FOREIGN DIRECT INVESTMENTS ON MONTENEGRO PAYMENT BALANCE
 Preliminary communication (accepted September 12, 2013) THE INFLUENCE OF FOREIGN DIRECT INVESTMENTS ON MONTENEGRO PAYMENT BALANCE Ana Gardasevic 1 Abstract: In this work, with help of econometric analysis
FinQuiz Notes
 Reading 9 A time series is any series of data that varies over time e.g. the quarterly sales for a company during the past five years or daily returns of a security. When assumptions of the regression
A discussion on multiple regression models
 A discussion on multiple regression models In our previous discussion of simple linear regression, we focused on a model in which one independent or explanatory variable X was used to predict the value
Modelling Seasonality of Gross Domestic Product in Belgium
 University of Vienna Univ.-Prof. Dipl.-Ing. Dr. Robert M. Kunst Course: Econometric Analysis of Seasonal Time Series (Oekonometrie der Saison) Working Paper Modelling Seasonality of Gross Domestic Product
Economtrics of money and finance Lecture six: spurious regression and cointegration
 Economtrics of money and finance Lecture six: spurious regression and cointegration Zongxin Qian School of Finance, Renmin University of China October 21, 2014 Table of Contents Overview Spurious regression
E c o n o m e t r i c s
 H:/Lehre/Econometrics Master/Lecture slides/chap 0.tex (October 7, 2015) E c o n o m e t r i c s This course 1 People Instructor: Professor Dr. Roman Liesenfeld SSC-Gebäude, Universitätsstr. 22, Room 4.309
Testing and Model Selection
 Testing and Model Selection This is another digression on general statistics: see PE App C.8.4. The EViews output for least squares, probit and logit includes some statistics relevant to testing hypotheses
Econometrics. 9) Heteroscedasticity and autocorrelation
 Heteroscedasticity and autocorrelation") 30C00200 Econometrics 9) Heteroscedasticity and autocorrelation Timo Kuosmanen Professor, Ph.D. http://nomepre.net/index.php/timokuosmanen Today s topics Heteroscedasticity Possible causes Testing for
30C00200 Econometrics 9) Heteroscedasticity and autocorrelation Timo Kuosmanen Professor, Ph.D. http://nomepre.net/index.php/timokuosmanen Today s topics Heteroscedasticity Possible causes Testing for
Bristol Business School
 Bristol Business School Academic Year: 10/11 Examination Period: January Module Leader: Module Code: Title of Module: John Paul Dunne Econometrics UMEN3P-15-M Examination Date: 12 January 2011 Examination
Multivariate Time Series: Part 4
 Multivariate Time Series: Part 4 Cointegration Gerald P. Dwyer Clemson University March 2016 Outline 1 Multivariate Time Series: Part 4 Cointegration Engle-Granger Test for Cointegration Johansen Test
Heteroscedasticity 1
 Heteroscedasticity 1 Pierre Nguimkeu BUEC 333 Summer 2011 1 Based on P. Lavergne, Lectures notes Outline Pure Versus Impure Heteroscedasticity Consequences and Detection Remedies Pure Heteroscedasticity
Section 2 NABE ASTEF 65
 Section 2 NABE ASTEF 65 Econometric (Structural) Models 66 67 The Multiple Regression Model 68 69 Assumptions 70 Components of Model Endogenous variables -- Dependent variables, values of which are determined
CHAPTER 5 FUNCTIONAL FORMS OF REGRESSION MODELS
 CHAPTER 5 FUNCTIONAL FORMS OF REGRESSION MODELS QUESTIONS 5.1. (a) In a log-log model the dependent and all explanatory variables are in the logarithmic form. (b) In the log-lin model the dependent variable
Tjalling C. Koopmans Research Institute
 Tjalling C. Koopmans Research Institute Tjalling C. Koopmans Research Institute Utrecht School of Economics Utrecht University Janskerkhof 12 3512 BL Utrecht The Netherlands telephone +31 30 253 9800 fax
in the time series. The relation between y and x is contemporaneous.
 9 Regression with Time Series 9.1 Some Basic Concepts Static Models (1) y t = β 0 + β 1 x t + u t t = 1, 2,..., T, where T is the number of observation in the time series. The relation between y and x
General Linear Model (Chapter 4)
") General Linear Model (Chapter 4) Outcome variable is considered continuous Simple linear regression Scatterplots OLS is BLUE under basic assumptions MSE estimates residual variance testing regression coefficients
General Linear Model (Chapter 4) Outcome variable is considered continuous Simple linear regression Scatterplots OLS is BLUE under basic assumptions MSE estimates residual variance testing regression coefficients
Statistical Inference. Part IV. Statistical Inference
 Part IV Statistical Inference As of Oct 5, 2017 Sampling Distributions of the OLS Estimator 1 Statistical Inference Sampling Distributions of the OLS Estimator Testing Against One-Sided Alternatives Two-Sided
TESTING FOR CO-INTEGRATION
 Bo Sjö 2010-12-05 TESTING FOR CO-INTEGRATION To be used in combination with Sjö (2008) Testing for Unit Roots and Cointegration A Guide. Instructions: Use the Johansen method to test for Purchasing Power
Answers to Problem Set #4
 Answers to Problem Set #4 Problems. Suppose that, from a sample of 63 observations, the least squares estimates and the corresponding estimated variance covariance matrix are given by: bβ bβ 2 bβ 3 = 2
5.1 Model Specification and Data 5.2 Estimating the Parameters of the Multiple Regression Model 5.3 Sampling Properties of the Least Squares
 5.1 Model Specification and Data 5. Estimating the Parameters of the Multiple Regression Model 5.3 Sampling Properties of the Least Squares Estimator 5.4 Interval Estimation 5.5 Hypothesis Testing for
Answers: Problem Set 9. Dynamic Models
 Answers: Problem Set 9. Dynamic Models 1. Given annual data for the period 1970-1999, you undertake an OLS regression of log Y on a time trend, defined as taking the value 1 in 1970, 2 in 1972 etc. The
13. Time Series Analysis: Asymptotics Weakly Dependent and Random Walk Process. Strict Exogeneity
 Outline: Further Issues in Using OLS with Time Series Data 13. Time Series Analysis: Asymptotics Weakly Dependent and Random Walk Process I. Stationary and Weakly Dependent Time Series III. Highly Persistent
Hypothesis testing Goodness of fit Multicollinearity Prediction. Applied Statistics. Lecturer: Serena Arima
 Applied Statistics Lecturer: Serena Arima Hypothesis testing for the linear model Under the Gauss-Markov assumptions and the normality of the error terms, we saw that β N(β, σ 2 (X X ) 1 ) and hence s
(4) 1. Create dummy variables for Town. Name these dummy variables A and B. These 0,1 variables now indicate the location of the house.
 1. Create dummy variables for Town. Name these dummy variables A and B. These 0,1 variables now indicate the location of the house.") Exam 3 Resource Economics 312 Introductory Econometrics Please complete all questions on this exam. The data in the spreadsheet: Exam 3- Home Prices.xls are to be used for all analyses. These data are
Exam 3 Resource Economics 312 Introductory Econometrics Please complete all questions on this exam. The data in the spreadsheet: Exam 3- Home Prices.xls are to be used for all analyses. These data are
sociology 362 regression
 sociology 36 regression Regression is a means of studying how the conditional distribution of a response variable (say, Y) varies for different values of one or more independent explanatory variables (say,
Fixed and Random Effects Models: Vartanian, SW 683
 : Vartanian, SW 683 Fixed and random effects models See: http://teaching.sociology.ul.ie/dcw/confront/node45.html When you have repeated observations per individual this is a problem and an advantage:
Empirical Economic Research, Part II
 Based on the text book by Ramanathan: Introductory Econometrics Robert M. Kunst robert.kunst@univie.ac.at University of Vienna and Institute for Advanced Studies Vienna December 7, 2011 Outline Introduction
(ii) Scan your answer sheets INTO ONE FILE only, and submit it in the drop-box.
 Scan your answer sheets INTO ONE FILE only, and submit it in the drop-box.") FINAL EXAM ** Two different ways to submit your answer sheet (i) Use MS-Word and place it in a drop-box. (ii) Scan your answer sheets INTO ONE FILE only, and submit it in the drop-box. Deadline: December
FINAL EXAM ** Two different ways to submit your answer sheet (i) Use MS-Word and place it in a drop-box. (ii) Scan your answer sheets INTO ONE FILE only, and submit it in the drop-box. Deadline: December
Econometrics I. Professor William Greene Stern School of Business Department of Economics 25-1/25. Part 25: Time Series
 Econometrics I Professor William Greene Stern School of Business Department of Economics 25-1/25 Econometrics I Part 25 Time Series 25-2/25 Modeling an Economic Time Series Observed y 0, y 1,, y t, What
Economics 471: Econometrics Department of Economics, Finance and Legal Studies University of Alabama
 Economics 471: Econometrics Department of Economics, Finance and Legal Studies University of Alabama Course Packet The purpose of this packet is to show you one particular dataset and how it is used in
CORRELATION, ASSOCIATION, CAUSATION, AND GRANGER CAUSATION IN ACCOUNTING RESEARCH
 CORRELATION, ASSOCIATION, CAUSATION, AND GRANGER CAUSATION IN ACCOUNTING RESEARCH Alireza Dorestani, Northeastern Illinois University Sara Aliabadi, Northeastern Illinois University ABSTRACT In this paper
Course information EC2020 Elements of econometrics
 Course information 2015 16 EC2020 Elements of econometrics Econometrics is the application of statistical methods to the quantification and critical assessment of hypothetical economic relationships using
ECON 366: ECONOMETRICS II. SPRING TERM 2005: LAB EXERCISE #10 Nonspherical Errors Continued. Brief Suggested Solutions
 DEPARTMENT OF ECONOMICS UNIVERSITY OF VICTORIA ECON 366: ECONOMETRICS II SPRING TERM 2005: LAB EXERCISE #10 Nonspherical Errors Continued Brief Suggested Solutions 1. In Lab 8 we considered the following
sociology 362 regression
 sociology 36 regression Regression is a means of modeling how the conditional distribution of a response variable (say, Y) varies for different values of one or more independent explanatory variables (say,
Financial Econometrics
 Financial Econometrics Multivariate Time Series Analysis: VAR Gerald P. Dwyer Trinity College, Dublin January 2013 GPD (TCD) VAR 01/13 1 / 25 Structural equations Suppose have simultaneous system for supply
Financial Time Series Analysis: Part II
 Department of Mathematics and Statistics, University of Vaasa, Finland Spring 2017 1 Unit root Deterministic trend Stochastic trend Testing for unit root ADF-test (Augmented Dickey-Fuller test) Testing
Reading Assignment. Serial Correlation and Heteroskedasticity. Chapters 12 and 11. Kennedy: Chapter 8. AREC-ECON 535 Lec F1 1
 Reading Assignment Serial Correlation and Heteroskedasticity Chapters 1 and 11. Kennedy: Chapter 8. AREC-ECON 535 Lec F1 1 Serial Correlation or Autocorrelation y t = β 0 + β 1 x 1t + β x t +... + β k
Exercices for Applied Econometrics A
 QEM F. Gardes-C. Starzec-M.A. Diaye Exercices for Applied Econometrics A I. Exercice: The panel of households expenditures in Poland, for years 1997 to 2000, gives the following statistics for the whole
Chapter 14 Multiple Regression Analysis
 Chapter 14 Multiple Regression Analysis 1. a. Multiple regression equation b. the Y-intercept c. $374,748 found by Y ˆ = 64,1 +.394(796,) + 9.6(694) 11,6(6.) (LO 1) 2. a. Multiple regression equation b.
STAT 212 Business Statistics II 1
 STAT 1 Business Statistics II 1 KING FAHD UNIVERSITY OF PETROLEUM & MINERALS DEPARTMENT OF MATHEMATICAL SCIENCES DHAHRAN, SAUDI ARABIA STAT 1: BUSINESS STATISTICS II Semester 091 Final Exam Thursday Feb