Experimental Testing of Shallow Embedded Connections Between Steel Columns and Concrete Footings
|
|
|
- Oliver Harmon
- 6 years ago
- Views:
Transcription

. All Theses and Dissertations. 448. https://scholarsarchive.byu.edu/etd/448 This Thesis is brought to you for free and open access by BYU ScholarsArchive.")
1 Brigham Young University BYU ScholarsArchive All Theses and Dissertations Experimental Testing of Shallow Embedded Connections Between Steel Columns and Concrete Footings Nicholas Valgardson Barnwell Brigham Young University - Provo Follow this and additional works at: Part of the Civil and Environmental Engineering Commons BYU ScholarsArchive Citation Barnwell, Nicholas Valgardson, "Experimental Testing of Shallow Embedded Connections Between Steel Columns and Concrete Footings" (15). All Theses and Dissertations This Thesis is brought to you for free and open access by BYU ScholarsArchive. It has been accepted for inclusion in All Theses and Dissertations by an authorized administrator of BYU ScholarsArchive. For more information, please contact scholarsarchive@byu.edu.
2 Experimental Testing of Shallow Embedded Connections Between Steel Columns and Concrete Footings Nicholas Valgardson Barnwell A thesis submitted to the faculty of Brigham Young University in partial fulfillment of the requirements for the degree of Master of Science Paul W. Richards, Chair Fernando S. Fonseca Richard J. Balling Department of Civil and Environmental Engineering Brigham Young University March 15 Copyright 15 Nicholas Valgardson Barnwell All Rights Reserved
3 ABSTRACT Experimental Testing of Shallow Embedded Connections Between Steel Columns and Concrete Footings Nicholas Valgardson Barnwell Department of Civil and Environmental Engineering, BYU Master of Science Shallow embedded column connections are widely used for columns resisting gravity loads in current design methods. These connections are usually considered pinned for structural analysis. In reality these connections fall in between a fixed and a pinned condition. Although methods exist to estimate the stiffness and strength of exposed columns or embedded columns under lateral loads, little research has been done to determine the strength of shallow embedded columns. An experimental study was carried out to investigate the strength of these connections. A total of 1 specimens with varying orientation, embedment depth, and column size were loaded laterally until failure or significant loss in strength. The results showed that shallow embedded connections are 86%-144% stronger in yielding and 3%-64% stronger in ultimate strength than current design methods would predict. This strength comes from a combination of the embedment depth and the resistance from the base plate and anchor rods. A model is proposed to explain the strength of the specimens and to conservatively estimate the strength of specimens with different variables. The specimens also exhibited stiffness ranging from 5%-75% of what would be expected from fully embedded columns. Keywords: Steel columns, spread footings, baseplates, anchor rods, lateral stiffness
4 ACKNOWLEDGEMENTS This research would not have been possible without the aid of numerous people, to whom I am very grateful. I would first like to thank Dr. Paul Richards for his constant support, encouragement, and advice throughout this process. He has been an incredible mentor and has put in a great amount of time and labor into this research. I would also like to thank my wife, Katelyn, who has been extremely patient and encouraging throughout this process. She has an incredible amount of faith in my abilities and constantly inspires me to do things that I thought were out of reach. Lastly I would like to thank the American Institute of Steel Construction which provided the funding for this project.
5 TABLE OF CONTENTS LIST OF TABLES... vii LIST OF FIGURES... viii 1 Introduction Base Column Connections Significance of Research Outline... 3 Literature Review Existing Strength Design Base Plate Guide Design Capacity Precast and Prestressed Concrete Institute Design Handbook Previous Research on Steel Column Connections Embedded Steel Members Exposed Base Plate Connections Methods Overview Specimen Design Steel Design Concrete Design Construction Process Specimen Construction Specimen Set Up Modified Specimen Instrumentation Strain Gages... 4 iv
6 3.4. String Pots Digital Image Capture System Instrumentation Setup Testing Equipment Loading Protocol Data Reduction Post-test Investigation Results Test Observations Specimen A Specimen A Specimen A Specimen A Specimen B Specimen B Specimen B Specimen B Specimen CA Specimen DA Specimen CB Specimen DB Post-test Investigation Global Results Backbone Curves Hysteretic Plots v
7 4.3 Specimen Stiffness Individual Cycle Stiffness Discussion Elastic Stiffness Expected Strength Proposed Model Bolt Forces Proposed Model Further Research Conclusion REFERENCES Appendix A. Design Justification Appendix B. Design Calculations Appendix C. Strain Data Appendix D. Material Properties vi
8 LIST OF TABLES Table 3-1: Standard Specimen Parameters...19 Table 3-: Modified Specimen Parameters... Table 3-3: As-built Dimensions...35 Table 4-1: Specimen Stiffness Progression...88 Table 5-1: Calculated Stiffnesses Based on k Table 5-: Calculated Stiffnesses Based on k...93 Table 5-3: Calculated Stiffnesses Based on k Table 5-4: Expected Strength vs. Actual Strength Shallow Embedment...98 Table 5-5: Expected Strength vs. Actual Strength Deep Embedment...98 Table 5-6: Resultant Force Location...1 Table 5-7: Actual vs. Model Strength...11 Table D-1: Compressive Strength and Unit Weight of Block-out, Footing and Grout for Each Specimen...16 Table D-: 8-day Strength of each Concrete Pour...16 Table D-3: Anchor Rod Properties...16 Table D-4: Steel Properties vii
9 LIST OF FIGURES Figure 1-1: Base Column Connections...1 Figure 1-: Typical Block-out... Figure -1: Base Plate Guide Design Model...5 Figure -: Original PCI Model...6 Figure -3: Current PCI Model...7 Figure -4: Pile-to-Pile-Cap Connections...1 Figure -5: Moment Resistance Mechanism...1 Figure -6: Moment Resisting Mechanisms...1 Figure -7: Friction Mechanism...13 Figure -8: Elastic Strength Method Developed by Eastman, R.S Figure -9: Model for Elastic Strength Compared with Elastic Strength of Specimens...17 Figure -1: Base Plate Yielding...18 Figure 3-1: Test Overview...1 Figure 3-: Base Plate Design... Figure 3-3: Concrete Elevations...3 Figure 3-4: Rebar Layout...4 Figure 3-5: Tying the Footing Rebar...6 Figure 3-6: Tying the Slab Rebar...6 Figure 3-7: Completed Footing Form...7 Figure 3-8: PVC Guide...7 Figure 3-9: Anchor Rod Guide...7 Figure 3-1: Footing Concrete Pour...8 Figure 3-11: Completed Footing...9 viii
10 Figure 3-1: Completed Slab Forms...3 Figure 3-13: Welding on Rebar Chairs...31 Figure 3-14: Block-out Forms...31 Figure 3-15: Finished Slab...3 Figure 3-16: Leveling Nuts and Washers...33 Figure 3-17: Column on Leveling Nuts and Washers...33 Figure 3-18: Bolt and Washer Installed on Grouted Column...34 Figure 3-19: Column After Filling the Block-out...34 Figure 3-: As-built Dimension Labels...35 Figure 3-1: Void between the Slab and Footing of Specimen H...36 Figure 3-: Shifted Block-out on Specimen E...36 Figure 3-3: Applying Form Release to Lab Floor...37 Figure 3-4: HYDROCAL Mix Preparation...38 Figure 3-5: Lowering Specimen into Place...38 Figure 3-6: Specimen Immediately after Being Placed in HYDROCAL...39 Figure 3-7: Connection Piece to Column Connection...4 Figure 3-8: Plate Washers...4 Figure 3-9: Modified Specimen Design...41 Figure 3-3: Strain Gage Locations...43 Figure 3-31: Installed Strain Gages...44 Figure 3-3: String Pot Locations...45 Figure 3-33: Installed Potentiometers...46 Figure 3-34: Loading Protocol...47 Figure 3-35: Actuator Pivot (Exaggerated)...48 Figure 4-1: Specimens at. Drift...51 ix
11 Figure 4-: Specimens at.4 Drift...5 Figure 4-3: Specimens after the Test...53 Figure 4-4: Slab Separation from Footing...54 Figure 4-5: Specimen A1 at.1 Drift...55 Figure 4-6: Specimen A1 at. Drift...56 Figure 4-7: Specimen A1 at.3 Drift...56 Figure 4-8: Specimen A1 at.4 Drift...57 Figure 4-9: Specimen A1 at.5 Drift...57 Figure 4-1: Specimen A1 at.6 Drift...58 Figure 4-11: Column Twist...58 Figure 4-1: Yielded Column Flanges...6 Figure 4-13: Triangular Cracking Pattern...66 Figure 4-14: Broken Anchor Bolt...67 Figure 4-15: Backbone Curves...68 Figure 4-16: Specimen A1 Global Hysteretic Plot...69 Figure 4-17: Specimen A Global Hysteretic Plot...7 Figure 4-18: Specimen A3 Global Hysteretic Plot...7 Figure 4-19: Specimen A4 Global Hysteretic Plot...71 Figure 4-: Specimen B1 Global Hysteretic Plot...71 Figure 4-1: Specimen B Global Hysteretic Plot...7 Figure 4-: Specimen B3 Global Hysteretic Plot...7 Figure 4-3: Specimen B4 Global Hysteretic Plot...73 Figure 4-4: Specimen CA Global Hysteretic Plot...73 Figure 4-5: Specimen DA Global Hysteretic Plot...74 Figure 4-6: Specimen CB Global Hysteretic Plot...74 x
12 Figure 4-7: Specimen DB Global Hysteretic Plot...75 Figure 4-8: Hysteretic Progression of Specimen A Figure 4-9: Hysteretic Progression of Specimen A...77 Figure 4-3: Hysteretic Progression of Specimen A Figure 4-31: Hysteretic Progression of Specimen A Figure 4-3: Hysteretic Progression of Specimen B1...8 Figure 4-33: Hysteretic Progression of Specimen B...81 Figure 4-34: Hysteretic Progression of Specimen B3...8 Figure 4-35: Hysteretic Progression of Specimen B Figure 4-36: Hysteretic Progression of Specimen CA...84 Figure 4-37: Hysteretic Progression of Specimen CB...85 Figure 4-38: Hysteretic Progression of Specimen DA...86 Figure 4-39: Hysteretic Progression of Specimen DB...87 Figure 5-1: Stiffness Mechanism...9 Figure 5-: Total Stiffness...91 Figure 5-3: Specimen Stiffness Progression...95 Figure 5-4: Backbone Curves vs. Expected Strength...97 Figure 5-5: Resultant Force Distance...1 Figure 5-6: Resultant Force Locations...11 Figure 5-7: Proposed Model...1 Figure C-1: Strain Gauge Data for Specimen A Figure C-: Strain Gauge Data for Specimen A Figure C-3: Strain Gauge Data for Specimen A Figure C-4: Strain Gauge Data for Specimen A Figure C-5: Strain Gauge Data for Specimen B xi
13 Figure C-6: Strain Gauge Data for Specimen B...15 Figure C-7: Strain Gauge Data for Specimen B Figure C-8: Strain Gauge Data for Specimen B Figure C-9: Strain Gauge Data for Specimen CA Figure C-1: Strain Gauge Data for Specimen DA Figure C-11: Strain Gauge Data for Specimen CB Figure C-1: Strain Gauge Data for Specimen DB Figure D-1: Steel Coupon Dimensions xii
14 1 INTRODUCTION 1.1 Base Column Connections In steel buildings there are three commonly used base connections for steel columns. These include: exposed, embedded, and shallow embedded column connections, all of which are shown in Figure 1-1. Exposed base connections are typical used in industrial facilities where the aesthetics of the connection are not important. Embedded base connections are used in moment frames to resist moment and shear loads. Shallow embedded base connections are the most widely used connection type and are typically used steel buildings for gravity columns (columns that are only designed to support the weight of the building). Shallow embedded connections for gravity columns are considered pinned for structural analysis and are only designed to resist the gravity load applied axially to the column. (a) Exposed (b) Embedded (c) Shallow Embedded Figure 1-1: Base Column Connections 1

15 In typical construction practice, shallow embedded base connections are built in a block-out. This is a region of the floor slab that has not been filled with concrete around the column base, and allows the workers to build the connection [Figure 1-]. After the connection is finished and the leveling grout underneath the baseplate has set, the block-out is filled in [Figure 1-1(c)]. These connections are considered to be pinned and have no flexural strength, this however is not entirely correct. The connection actually falls in between a pinned and a fixed connection. Figure 1-: Typical Block-out 1. Significance of Research Little research has been done on shallow embedded column connections to determine the actual stiffness and strength they may have, but recently there has been more discussion about
16 shallow embedded connections. In tests performed by Xiao et al. [1] on HP pile-to-cap connections with shallow embedment, the results showed that although this shallow embedment was modeled as a pinned connection, it was able to resist a large moment at the connection. Although this phenomenon has occurred and been documented in other research, it has not been explored in greater detail. It is important that an accurate model be developed to account for the strength and stiffness of these connections in the design of steel buildings. If significant strength and stiffness is discovered in these connections it could assist the lateral force resisting systems throughout the building. This could reduce the amount of steel used on a project because the amount of lateral force resisting systems could be reduced. 1.3 Outline This chapter has discussed the types of column connections that are typically used today. It has also touched on the lack of research that exists on shallow embedded connections. Chapter will go into detail on the research that has been done on embedded columns. Chapter 3 will lay out the testing procedures that were followed for this research. Chapters 4-6 will present and discuss the results obtained from the experimental testing. 3
17 LITERATURE REVIEW.1 Existing Strength Design While methods exist for computing the strength of embedded steel shapes, little research has gone into determining the strength of shallow embedded base connections. The existing methods today may calculate the strength of just an embedded column or just an exposed base plate but they do not account for the combination of the two. This literature review will go into the existing methods and research for designing these connections, the lack of research for the specific connections being explored, and the need for more research on this topic..1.1 Base Plate Guide Design Capacity The columns studied in this research are only designed to resist axial loads due to gravity loads throughout the structure. These types of connections are designed using the Base Plate Design Guide []. The guide allows the designer to specify a base plate for gravity loads, small moments, or large moments. Figure -1 displays the current model for designing base plates for large moments. This model will be used to compare the test results from this research. These types of connections are used when the bending moment in the column is relatively large in comparison to the axial load. As it states in the design guide, the anchor rods need to be designed to prevent the column from tipping or causing the concrete to fail in compression []. That is, the 4
18 only resisting forces in this model come from the anchor rods and the concrete in compression. It does not account for added resistance of the bending moment from surrounding concrete. Figure -1: Base Plate Guide Design Model [].1. Precast and Prestressed Concrete Institute Design Handbook The Precast and Prestressed Concrete Institute (PCI) Design Handbook [3] was one of the first texts to address the strength of embedded steel connections. Figure - shows the original model that appeared in this text. This model was based on an assumption that there was an embedment mechanism acting about a constant neutral axis. The model gave an estimated shear capacity, V c, that is based on the moment capacity of the connection and is given by equation -1 [3]. 5
19 (-1) where: = compressive strength of concrete in the pile cap = width of the embedded member = embedment depth = shear span of the pile Although this was a conservative estimate of the strength of embedded columns, later research showed that the model was not sufficient. l e C b 11/1l e a V c.85 C f 1/3l e Figure -: Original PCI Model In 198, Marcakis and Mitchell [4] performed experimental research on 5 different embedded specimens to determine a more accurate equation. Based on this research a new equation was proposed with some modifications. One of these modifications was that the width used in the equation could be taken as the confined column width, or the distance to the outside 6
20 of the column ties, but that it was limited to.5 times the width of the embedded shape. The new shear capacity is given by equation -. (-) where: = compressive strength of concrete in the pile cap = effective width of compression block = embedment depth = = shear span of the pile This equation appears in the most recent edition of the PCI Design Handbook and is used today to determine the strength of embedded steel members [3]. Axial Load l e N.A. e a V c ε b x f ε f l e Embedded Member x b β 1 x f Concrete Column α C b βx b C f.85 (a) (b) Figure -3: Current PCI Model [3] 7
21 . Previous Research on Steel Column Connections..1 Embedded Steel Members Embedded steel columns are widely used for steel moment resisting frames, but these connections are designed to fix the connection. Many tests have been performed to determine what actually makes an embedded column a fixed connection. Cui et al. [5] performed experimental research to determine if shallowly embedded columns could also function as fixed connections. In order to create this fixity, more rebar reinforcing was placed around the base plate. As part of the research a column with an exposed base plate connection was tested as well as columns with an unreinforced slab covering the connection. The research found that for a 1 mm slab and a mm slab the strength of the specimen was 1.1 and 1.5 times stronger, respectively, than the exposed base plate. Although this research was mostly focused on how to make these shallow connections fully fixed, elements of the research showed that the existing models for determining the strength of these connections are inadequate. In research performed by Pertold et al. [1], a model was proposed to determine the embedment length required to transfer moment and shear forces through an embedded connection. The embedment length determined by this model was smaller than what is used in practice today. One of the limitations of the research is that it is only valid for embedment depths ranging between b eff and b eff, where b eff is given by equation -3. ( ) (-3) where: width of the column section depth of the column section thickness of the column web 8
22 In the case of shallow embedded columns the embedment depth will typically lie outside of this range. Although this model has shown that shallower embedment depths can resist more load than is currently expected, it does not provide a model that will work for columns with embedment less than or equal to the depth of the member, h c, as defined in equation -3. In research done on steel pile-to-pile-cap connections, which also demonstrated unexplained strength, Shama et al. [6], developed an equation to determine the capacity of these shallow embedded connections. This research was focused on finding an embedment depth that would allow the column to form a plastic hinge. A formula was derived that allows the designer to specify an efficiency of the connection with respect to the plastic hinge moment of the column, and find the required embedment depth. To accomplish this, an equation to estimate the moment capacity of the concrete in the joint was derived assuming that the connection was limited by the compressive strength of the concrete at the extreme fiber in the front face of the connection. This capacity is given by equation -4. ( ) (-4) where: distance from the point of application of the lateral load to the neutral axis of the joint Xiao et al. [1] also performed research on steel pile-to-pile-cap connections. These connections typically have rebar attached to the embedded member which deviates from the model outlined in the PCI Design Handbook. This model is comparable to the base connections researched in this paper, as the strength of the attached rebar can be comparable to the strength of the anchor rods in a base plate. An example of these connections can be seen in Figure -4. 9
23 Figure -4: Pile-to-Pile-Cap Connections [1] In this study the specimens were able to develop large moment resistance that could not be explained. Using the equation derived by Shama et al. [6] the expected strength of the columns were computed as.6m p, where M p is the plastic moment of the steel member. However, the connections were able to resist moments ranging from.5 to.66m p. This is much greater than the estimated strength which means there were other mechanisms contributing to the moment resistance. Figure -5 shows the two different mechanisms that were believed to be creating the moment resistance. Figure -5: Moment Resistance Mechanism [1] 1
24 In the research the equation proposed by Marcakis and Mitchell [4] for embedment resistance was used in combination with the flexural resistance mechanism shown in Figure -5. Using this model the strength of these connections was able to be estimated very closely. The equations from the PCI Design handbook were reduced to equation -5 by simply multiplying the shear by the distance, as shown in the PCI model. The flexural mechanism resists the load through tension in the rebar and a compressive block underneath the steel shape (that is equal to the force in the rebar). (-5) where: = nominal strength provided by the embedment mechanism = compressive strength of concrete in the pile cap = effective width proposed by Marcakis and Mitchell (198) = embedment depth = = shear span of the pile While this approach seems reasonable, it has been shown in other tests that these connections still have unexplained strength even after taking into account the mechanism in the concrete and the flexural mechanism resisting the moment. In experimental tests performed by Richards et al. [7] on pile-to-cap connections for pipe piles, it was discovered that these connections had much more strength than anticipated from the methods mentioned above. Figure -6 shows the mechanisms that were used to calculate the expected strength of the connection before the tests were performed. 11
25 (a) Embedment Mechanism (B) Flexural Reinforcement Mechanism Figure -6: Moment Resisting Mechanisms [7] In these tests, the specimens consisted of two pipe piles embedded into a pile cap. One of the most intriguing specimens exhibited strengths much higher than predicted, and was able to pull the trailing pile out of the ground before any failure occurred in the pipe or the pile cap. It was suggested in the paper that unexplained strength of the specimens could be attributed to the friction force between the concrete and the pipe pile. This friction mechanism is shown in Figure -7. These friction forces could be calculated using the forces C b and C f from the embedment mechanism, multiplied by the friction coefficient for concrete poured against steel. In the calculations it was assumed that the force F f would only become as large as F b so that the forces were balanced, but that F b would be developed fully. With these assumptions, the moment due to the friction could be calculated with equation -6. where: = = coefficient of friction = = diameter of steel pipe (-6) 1
26 When added resistance was applied to the model used to predict the strength, it produced strength much higher than was exhibited in the specimen. As was stated before, the mode of failure for this specimen was that the trailing pile was pulled out of the ground, so it could have been possible for the specimen to reach this capacity had the pile stayed in the ground. Figure -7: Friction Mechanism [7] In recent research performed by Eastman R.S. [8], an experimental test was performed on steel piles with shallow embedment. This research consisted of three specimens. For each specimen the cap was with typical cap reinforcement. The piles used in the tests were 1.75 in diameter. All three piles extended approximately 5 out of the concrete and the embedment depths were 17.9, 6.5, and 4.56, respectively. These depths were chosen as fractions of the pile diameter, the fractions being, 1.5,.5, and.4, respectively. All the specimens had a steel cover plate welded to the embedded end of the pile cap. The specimen with the deepest embedment yielded the column, while the other two specimens experienced failure in the concrete. All three specimens exhibited larger strength than expected. From this research a model for elastic strength was proposed to explain the unexpected resistance. This model is essentially an elastic version of the model developed by Marcakis and 13
27 Mitchell, which is used in the PCI design handbook, with an added bearing force underneath the cover plate. The overall model is shown in Figure -8. V c a D T.O.C. d e σ f x f l e d b C b N.A. C e O C f d f σ b N.A. σ e d e C e Figure -8: Elastic Strength Method Developed by Eastman, R.S. [8]. With a few assumptions the values shown in this model can be determined. The first assumption is that the maximum stress at the front of the connection corresponds to a strain of.1. This assumption means the concrete strain is still in the elastic region. The stress at the front of the connection, σ f, can be determined from equation -7. (-7) where:, MPa compressive strength of concrete, MPa 14
28 Using this stress, the magnitude of the resultant acting on the front of the connection, C f, can be determined from equation -8. (-8) Using the elastic linear relationship between the stress at the front and back of the connection, the stress at the back of the connection can be determined using equation -9. ( ) ( ) (-9) The magnitude of the resultant acting at the back of the connection can be determined with equation -1. ( ) (-1) The distance from the neutral axis to the location of the resultants associated with these two stresses can be found from equations -11 and -1, respectively. (-11) (-1) Once these forces have been determined, force equilibrium gives us equation -13. (-13) The remaining forces acting in the y-direction, shown in Figure -8, could be limited by two factors that will be described here. The end bearing stress is assumed to be zero in the middle of the pile and increases linearly to the edge stress, σ e. This stress is given by equation - 14 and states that the magnitude of the bearing triangular stress block is similar to that of the back end stress block, σ b but limited to be less than it. (-14) 15
29 The resultant vertical force can then be determined from equation -15. (-15) The distance from the vertical neutral axis to the location where the resultant acts was derived and is given by equation -16. (-16) A balancing vertical force that can be seen in Figure -8 is also assumed to exist in the model. This force could be due to friction between the pile and the concrete. Since this value must be equal to the vertical bearing stress, the value of C e would be limited by the friction force. The second limitation put on the bearing force is given by equation -17. This resultant is assumed to act at the same distance d e given by equation -16. (-17) where: for kinetic friction between steel and concrete Once the limiting factor for the vertical bearing stress is determined, the location of the neutral axis can be found from equation -18. Then, the maximum elastic load can be found using equation -13. ( ) (-18) The methods for computing the maximum elastic load are compared in Figure -9. In this figure the lowest curve assumes no end bearing stress, the middle curve assumes the bearing force is limited by friction, and the upper curve assumes the bearing stress is equal to stress at the back of the column ( ). The elastic strength of the specimens is also plotted. 16
30 .8 V c /f' c bl e.6.4? No Bearing Force Bearing Force Based on Bearing Stress Bearing Force Based on Friction Force Elastic Strength of Test Specimens. Capacity limited by pile yielding not connection l e /D Figure -9: Model for Elastic Strength Compared with Elastic Strength of Specimens [8].. Exposed Base Plate Connections Other research has been conducted on exposed base plate connections as well. Recently Kanvinde and Deierlein [9] performed tests on standard exposed steel base connections. In these tests, base plates were designed according to the design guide and tested to determine how the moment resistance compared to the expected moment resistance. One of the most interesting aspects of this research was that the specimens showed little strength degradation up through 7%-1% drift cycles. This was surprising as other structural elements are typically designed to have little strength degradation up until about 4% drift. Also, on average the specimens were 8% stronger than the design guide estimates. In the experiment, yielding in the base plate was primarily responsible for the energy dissipation that allowed the specimens to show little strength degradation. An example of this yielding is shown in Figure -1. In todays practice much design is put into making sure the base plate remains elastic, although the base plate can dissipate a large amount of energy through yielding. While the research presented herein is 17

31 mainly focused on the effect embedment has on strength, the fact that existing models are not sufficient to estimate the moment resistance of these connections will be addressed. Figure -1: Base Plate Yielding [9] Other research performed by Thambiratnam and Paramasivam [1] also showed that base plate connections were able to develop more moment resistance than expected. In this experiment, one of the variables was the eccentricity at which the load was applied. The research showed at the lowest eccentricities the specimens failed from concrete cracking but for the rest of the tests, at medium to high eccentricities, the mode of failure was base plate yielding. In the end these connection had a factor of safety ranging from with a mean value of 1.35 when compared to the allowable strength method. The existing methods for designing shallow embedded columns have been shown to be insufficient. It is important that these connections be tested and quantified so that they can be accurately represented in design. 18
32 3 METHODS 3.1 Overview This study investigated three different factors to determine their effect on the flexural strength and stiffness of typical steel gravity column base connections. These factors include: embedment depth, column shape, and column orientation, with the main focus on embedment depth. There were eight specimens designed to specifically test these factors. Four more specimens were created to test the effect having the anchor bolts disengaged and the floor slab braced from movement had on the strength. The first eight specimens are listed in Table 3-1 and the four modified specimens are listed in Table 3- with their respective variables. Table 3-1: Standard Specimen Parameters Specimen Embedment [in] Orientation Shape A1 8 Strong W8 35 A 8 Strong W8 48 A3 8 Weak W8 35 A4 8 Weak W8 48 B1 16 Strong W8 35 B 16 Strong W8 48 B3 16 Weak W8 35 B4 16 Weak W
33 Table 3-: Modified Specimen Parameters Specimen Embedment [in] Orientation Shape Braced Slab CA 8 Strong W8 48 Y DA 8 Strong W8 48 N CB 16 Strong W8 48 Y DB 16 Strong W8 48 N The test setup consisted of the frame, the actuator and a test specimen as shown in Figure 3-1. The frame was constructed out of a W1 7 column that was bolted to the floor and then laterally braced by two W8 31 struts. This frame was designed to resist the force that came from the actuator as it pushed on the test columns. The actuator (11 kips capacity) was placed at two different heights depending on the specimen. This was done to keep the distance between actuator and the top-of-slab similar for different embedment depths. The actuator was connected to the test column through a connection piece that was bolted through the shape to a plate on the opposite side of the shape. This allowed the actuator to push and pull the shape back and forth. The connection piece was designed with a specific length so the actuator would begin testing at mid stroke, allowing it to reach its maximum displacement (+/- 1 ) in both directions. The specimen consisted of a steel column, slab-on-grade concrete, footing concrete, and block-out concrete. The slab-on-grade concrete was first poured around the block-out and then the column was connected to the footing through the anchor bolts embedded in the footing. The block-out was essential to create the connection. The embedment depths of the specimens were determined by the thickness of the slab-on-grade concrete. Typical slab-on-grade is 1 thick but in some cases can be up to 4 thick. The columns were designed on a ⅔ scale, thus the embedment depths of the columns were also based on a ⅔ scale which yielded depths of 8 and 16.
34 Connection Piece 1 kip Actuator Reaction Frame Specimen Block-out Out-of-plane Actuator Restraint Figure 3-1: Test Overview 3. Specimen Design 3..1 Steel Design The base plate design and column layout can be seen in Figure 3-. The specimens consisted of four W8 48 columns and four W8 35 columns all with identical base plates. The columns for the 8 embedment were 7 8 tall, and the columns for the 16 embedment were 8 7 tall. The base plate was designed as a PL plate with four diameter anchor rod holes spaced 1 ¼ from the edge of each side of the base plate. A grout hole with the same diameter as the anchor rod holes was placed on the centerline perpendicular to the web of the column and from the centerline parallel to the web of the beam. All the columns were welded 1
35 to the base plate with ¼ welds on the outside of the top and bottom flange. The calculations that were used to determine the plate size can be found in Appendix B. The column sizes were selected based on columns that would typically be found in steel buildings. Different shape property ratios were taken from W14 and W1 columns and were used to find W8 columns that had similar property ratios. The justification and explanation for this selection can be found in Appendix A. The calculations used to determine the ratios can be found in Appendix B. Figure 3-: Base Plate Design 3.. Concrete Design The concrete part of the test specimens was intended to represent a footing and slab-ongrade, and have the capacity to be lifted and moved. The bottom layer of concrete, representing
36 the footing, was [Figure 3-3 and Figure 3-4]. The bottom reinforcement consisted of six, 6 9 #5 bars in both directions. The outside bars were designed to guide the PVC that went through the footing and therefore the exact dimensions were set during the construction process. The remaining bars were evenly spaced from the outside bars with a spacing of 14 ⅜. The inside bars were spaced 11 ⅞ apart in order to guide the column anchor rods during the construction process. The bottom mat of rebar sat on chairs. Four #5 bars with 9-degree bends were designed to pick up the specimens. Both legs of the bars extended down to the bottom layer of reinforcement with the 9-degree bend wrapping underneath the rebar. 4 Slab-on-grade 8 Anchor Rods 1 PVC Footing Pick-up hooks (a) Shallow Embedment Slab-on-grade 4 16 Anchor Rods 1 PVC Footing Pick-up hooks (b) Deep Embedment Figure 3-3: Concrete Elevations 3
37 1 1 - ⅜ 11 ⅞ PVC Anchor Rods Block-out Pick-up hooks 5 (a) Slab-on-grade 7 (b) Footing Figure 3-4: Rebar Layout The second layer of concrete represents the slab-on-grade. For the first four specimens a thick slab was poured on top of the footing and for the other specimens the slab was 16 thick. Around where the column would be placed a diamond block-out was provided, centered on the slab and over the anchor bolts. To make up for the interrupted reinforcement at the block-out #4 bars were placed 1 ½ from the edge of the block-out. The remaining reinforcement consisted of # 4 bars evenly spaced at 1 in both directions. The specific lengths and layout of the bars varied and can be seen in Figure 3-4. For both embedment depths the bottom layer of the top reinforcement mat was placed about 4 from the top of the slab. An elevation view of the rebar in the slab and footing is shown in Figure 3-3. The justification for the concrete design is discussed in Appendix A. All the necessary calculations for the concrete design are found in Appendix B. 4
38 3.3 Construction Process Specimen Construction The overall construction process is shown in Figure 3-5 through Figure The process will be described for one specimen, but all eight specimens were constructed in the same way. The construction process began by laying out the bottom layer of rebar and tying it together in a mat for each specimen [Figure 3-5]. This process was repeated for rebar in the second layer of concrete as well [Figure 3-6]. The top layer was set aside until after the bottom concrete had been poured. Next eight 7 7 forms with plywood bases were assembled. Figure 3-7 shows the completed form and the placement of the PVC and anchor rods. Using the rebar to guide the placement of the PVC and anchor rods as was discussed before proved to be too difficult. In order to guide the PVC pipe, six plywood disks with the same inside diameter as the PVC were nailed in the locations where the PVC pipe would be placed [Figure 3-8]. To guide the anchor rods a plywood guide was fastened in the center of the base [Figure 3-9]. Then the rebar mat was placed in the form on chairs and the rebar designed to pick the specimen up was tied into it [Figure 3-7]. Next the anchor rods were placed in the guide and a second guide was placed at the top of the bolts with nuts on both sides of the plywood, which prevented the bolts from drifting out of place [Figure 3-7]. 5


39 Figure 3-5: Tying the Footing Rebar Figure 3-6: Tying the Slab Rebar 6


40 Figure 3-7: Completed Footing Form Figure 3-8: PVC Guide Figure 3-9: Anchor Rod Guide 7

41 After the rebar, anchor rods, and PVC were in place the footing concrete was poured into the forms. Concrete was placed into the forms and shoveled into place until it reached the 1 line drawn on the side of the forms [Figure 3-1]. Any excess concrete was placed in the next form and this process was continued until all the forms were filled up to 1. No finish was put on top of the footing because this would not be representative of what would be done in practice. Figure 3-11 shows one of the completed footings after the first pour. Figure 3-1: Footing Concrete Pour 8

42 Figure 3-11: Completed Footing In preparation for the next pour, plywood walls were formed inside the existing form and on top of the footing. The forms permitted the slab-on-grade concrete to be poured while maintaining the block-out area free of concrete. Figure 3-1 shows the completed slab forms. For the shallow embeds the rebar was placed on 4 chairs so the mat would sit in the middle of the slab. For the deeper embeds, 1 rebar rods had to be welded to the mat so that the rebar would sit at the same distance from the top of the slab as the shallow embeds [Figure 3-13]. Lastly a form for the block-out was built from plywood that had outside dimensions, and placed so the anchor bolts were centered inside the block-out [Figure 3-14]. A brace was used across the block-out to prevent the concrete from pushing it around [Figure 3-1]. Next the concrete for the slab-on-grade was poured following the same steps outlined for the footing concrete pour. Figure 3-15 shows two of the specimens after the concrete pour. A brush finish was put on this layer of concrete as is done for a typical floor slab. 9
 Deep")

43 (a) Shallow Embedment (b) Deep Embedment Figure 3-1: Completed Slab Forms 3

 Deep")

44 Figure 3-13: Welding on Rebar Chairs (a) Shallow Embedment (b) Deep Embedment Figure 3-14: Block-out Forms 31
")

45 (a) Shallow Embedment (b) Deep Embedment Figure 3-15: Finished Slab 3

![The columns were then oriented and placed on top of the washers and leveling nuts [Figure 3-17]. With the column in place, the nuts were adjusted until all four sides of the column were level.](/docs-images/74/70971500/images/46-1.jpg "Next ¼ plate washers with a 1 5 16 hole were placed on each anchor rod and then another ¾ bolt. The bolts were tightened by hand and then another ½ turn with a wrench.")
46 Once the concrete had set, the columns were placed into the block-outs. Leveling nuts and washers were screwed onto the anchor rods so that the top of the washer was about 1 ½ from the concrete footing [Figure 3-16]. The columns were then oriented and placed on top of the washers and leveling nuts [Figure 3-17]. With the column in place, the nuts were adjusted until all four sides of the column were level. Next ¼ plate washers with a hole were placed on each anchor rod and then another ¾ bolt. The bolts were tightened by hand and then another ½ turn with a wrench. Figure 3-16: Leveling Nuts and Washers Figure 3-17: Column on Leveling Nuts and Washers Once the columns were placed and leveled, high strength non-shrink grout was poured underneath the columns to fill the void needed for the leveling nuts. When the grout had set, the 33


47 block-out was filled in with concrete. During this process a vibrator was used to consolidate the concrete, making sure that there were no voids in the block-out. Once again a brush finish was placed on the block-outs as may be done in practice. The specimens were tested 8 days after the block-out concrete was poured. Figure 3-18: Bolt and Washer Installed on Grouted Column Figure 3-19: Column After Filling the Block-out Measurements were taken on each specimen to find the as-built dimensions. This was done to determine the exact location of the column with respect to the block-out, the slab-ongrade, and the footing. Table 3-3 shows the dimensions and Figure 3- shows how the dimensions were labeled on the different specimens. 34
48 Table 3-3: As-built Dimensions Actual Dimensions [in] Specimen A B C D E F G H I J K L A A A A B B B B CA/DA CB/DB (a) Strong Axis (b) Weak Axis Figure 3-: As-built Dimension Labels There are a few things that occurred during the construction process that should be noted. On specimen B1 the form began to bow out during the pour which created a large void around the end of the specimen [Figure 3-1]. Also, on specimen B3, the brace on top of the block-out form broke during the pour and the form shifted. Figure 3- shows where the off-center block- 35


49 out ended up relative to the anchor bolts (centered). Even with the offset, the column was able to be placed in the block-out without modification. See Table 3-3 for the as-built dimensions. These issues during construction did not seem to impact the final results. Figure 3-1: Void between the Slab and Footing of Specimen H Figure 3-: Shifted Block-out on Specimen E 3.3. Specimen Set Up The specimen set up involved fastening the specimen to the lab floor, connecting the actuator to the column, and setting up the instrumentation. The first step in the process was placing the specimen in the testing location and posttensioning it to the lab floor. Where the specimen needed to be placed, the floor was not level and tensioning down the specimen would cause the concrete to crack. In order to prevent this, a HYDROCAL mixture was poured underneath the specimen to form a level base. To do this the 36
![specimen was put into place but not lowered all the way. Then form release was applied to the floor so the HYDROCAL could easily be removed after each test [Figure 3-3].](/docs-images/74/70971500/images/50-0.jpg "Next the HYDROCAL was mixed and poured it inside the testing area [Figure 3-4]. Before the paste set the specimen was lowered into place [Figure 3-5].")
50 specimen was put into place but not lowered all the way. Then form release was applied to the floor so the HYDROCAL could easily be removed after each test [Figure 3-3]. Next the HYDROCAL was mixed and poured it inside the testing area [Figure 3-4]. Before the paste set the specimen was lowered into place [Figure 3-5]. Figure 3-6 shows the specimen immediately after being placed into the HYDROCAL mixture. Once the HYDROCAL had set for 4 hours, it had gained sufficient strength that the test setup could proceed. This was typically done the day before the test to give ample time for testing the following day. When the HYDROCAL was dry, the specimen was anchored down with six 1 ¼ rods that were tensioned to approximately 5 kips each. Figure 3-3: Applying Form Release to Lab Floor 37


51 Figure 3-4: HYDROCAL Mix Preparation Figure 3-5: Lowering Specimen into Place 38

52 Figure 3-6: Specimen Immediately after Being Placed in HYDROCAL After the specimen was tensioned to the floor, the actuator was connected to the column face. For the strong axis tests, four ¾ bolts were placed through the connector and the column face [Figure 3-7]. Nuts were placed on the outside and inside of the column flange and the inside of the flange and outside of the connection piece, for the side connected to the actuator connection piece. For the weak axis test four ¾ bolts were placed through the connection piece, through the holes in the web of the column and through the endplate. The plate on the end of the connection piece and the end plate were also bearing on the flanges of the column. Nuts were placed on the back sides of the end plate and the plate on the connection piece, as well as on both sides of the web [Figure 3-7]. This allowed the force to be transferred through the web as well as through bearing in the flanges. These nuts were snug tight. For the deeper embedment, plate washers were placed on the back of the plate on the connection piece [Figure 3-8]. This was a precautionary measure to ensure that prying did not produce forces in the bolts that would cause them to break suddenly. Lastly the instrumentation was connected, which will be explained in further detail in the next section. 39


53 (a) Strong Axis (a) Weak Axis Figure 3-7: Connection Piece to Column Connection Plate Washers Figure 3-8: Plate Washers Modified Specimen Two specimens were prepared that did not have a top nut on the anchor bolts, so the anchor rods were not engaged during the test. These specimens were labeled CA and CB, where CA had the same parameters (orientation, shape, and embedment) as specimen A and CB had the same parameters as specimen B. As will be discussed later, the slab began to rock back and forth during the test. After the test, the specimens were modified to prevent the slab from rocking back and forth, and tested again. Two steel beams were placed on top of the outside 4
![edges of the slab and bolted to the rods already being used to fasten the specimen to the lab floor [Figure 3-9]. For the second test the specimens were named DA and DB respectively.](/docs-images/74/70971500/images/54-0.jpg "(a) Specimen DA (b) Specimen DB Figure 3-9: Modified Specimen Design Once the tests were complete, the block-outs were jackhammered out so the orientation of the columns could be changed.")

54 edges of the slab and bolted to the rods already being used to fasten the specimen to the lab floor [Figure 3-9]. For the second test the specimens were named DA and DB respectively. (a) Specimen DA (b) Specimen DB Figure 3-9: Modified Specimen Design Once the tests were complete, the block-outs were jackhammered out so the orientation of the columns could be changed. The columns were switched to be tested in the weak axis, bolted, and then the block-outs were re-filled with fresh concrete. These specimens were then named A4 and B4 and tested as the other standard specimens had been tested. 3.4 Instrumentation Three main forms of instrumentation were used during the test. Strain gages were placed in various locations on the steel column to measure the strain as the loads were applied. String 41
55 pots were also placed in different locations in order to measure specific displacements. Lastly a Digital Image Capture (DIC) system was used to record specimen response during testing. For each specimen the instrumentation was kept as similar as possible Strain Gages All strain gages were placed to the inside the flanges of the steel columns. Elevations of the gages depended on the specimen depth. The shallow specimens (A1-A4, CA, and DA) had two gages on each flange [see Figure 3-3(a)]. The first gage was placed above the top of the base plate. The next gage was placed with a spacing of 5 O.C. which resulted in it being placed 1 ½ above the concrete. For specimens B1-B4, CB, and DB, which all had 16 embedment, three strain gages were placed on each flange [see Figure 3-3(b)]; one above the steel base plate and the other two placed at 6 ½ O.C. This resulted in the top strain gage being located 1 ½ above the surface of the concrete. For specimens B1, B, CB, and DB extra strain gages were placed on the south flanges between the bottom two gages so they were 5 ¼ from the top of the base plate. On specimens B, CB, and DB, extra strain gages were placed between the top two strain gages on the same flange where the other extra gages were placed. This meant the spacing of all the strain gages (standard and extra) was actually 3 ¼ O.C. for those two flanges. Both strong and weak axis instrumentation can be seen in Figure 3-3. In the figure the plain text are the gages on the east facing flange for the strong axis, and south facing flange for weak axis. The gages in parenthesis are the gages opposite these. Figure 3-31 shows some of the strain gages after they were placed on the columns. 4
56 S5 (S7) S6 (S8) 1 ½ S1 (S3) S (S4) 5 (a) Shallow Embedment S5 (S7) S6 (S8) 1 ½ S15 (S16) Specimens CB, DB & B S9 (S11) S1 (S1) Specimens CB, DB, B, & B1 3 ¼ S13 (S14) S1 (S3) S (S4) 5 ½ (b) Deep Embedment Figure 3-3: Strain Gage Locations 43

![The first two pots were centered on the east side of the footing and the slab, respectively, to measure any horizontal movement in either direction [see Figure 3-3].](/docs-images/74/70971500/images/57-1.jpg "The next five pots were placed along the steel column. The first one was placed from the top of the concrete and the rest were spaced at 9 16 O.C. for the deeper embeds and 19 13 16 O.")

57 Figure 3-31: Installed Strain Gages 3.4. String Pots String potentiometers (pots) were used to measure important displacements throughout the test. Each specimen had the same number of pots. The first two pots were centered on the east side of the footing and the slab, respectively, to measure any horizontal movement in either direction [see Figure 3-3]. The next five pots were placed along the steel column. The first one was placed from the top of the concrete and the rest were spaced at 9 16 O.C. for the deeper embeds and O.C. for the shallower embeds. This left the last string pot lined up with the line of action of the actuator. The next one was placed at the same elevation as the top string pot on the column but on the face perpendicular to the other pots. The purpose of this string pot was to measure any out-of-plane displacements at the top of the column. The last two string pots were placed on top of the slab, centered at the edge of each end. These pots were placed to measure any uplift in the slab. The overall layout of the string pots can be seen in Figure
58 Out-of-plane String Pot String pots Figure 3-3: String Pot Locations Digital Image Capture System A Digital Image Capture (DIC) system was also used to record our tests. Although the collected data will not be included in this report, the system was very helpful as it was a stationary recording apparatus and the changes in the specimen could be seen from a fixed location. This helped identify that the slab was rocking back and forth early on in the test which will be discussed later on. 45


59 3.4.4 Instrumentation Setup The strain gauge wires were first connected to the module that would read the data. They were then labeled in the computer with the labels shown in Figure 3-3. The pots that measure the column movement were attached to the column with strong magnets that would not move as the column deflected. To connect the pots to the concrete, holes were drilled in the desired locations and I-hooks were epoxied into the holes. The string pot bases were all fastened to objects that would not move during the testing. Figure 3-33 shows the installed string pots and how they were connected to the specimen and to fixed locations. Magnets String Pots Figure 3-33: Installed Potentiometers 3.5 Testing Equipment The actuator used is an MTS model Kip actuator with of displacement and the system to control the actuator is called MTS TestStar IIm. The data acquisition system used is National Instruments, which uses the LabView 13 software. Four Analog Input Bridge NI-937 Strain Gauge modules were used. The main block that holds the modules is called NI cdaq-917. To complete each Strain Gauge channel an NI 9944 (1 ohm) was used. To read 46
60 the string pots an NI-96 Analog Input Fuel Cell module was used. Firstmark Controls Analog- Output Miniature Position Transducers, model C6SU, were used to measure the movement of the samples. 3.6 Loading Protocol The loading protocol was based on story drift. The actuator was programed to push with the load required to get to each drift. The test was typically stopped after each drift cycle to take photographs and inspect the specimen for damage. The loading protocol is listed here with the drift first and the number of cycles run at that drift in parenthesis:.375(6),.5(6),.75(6),.1(4),.15(),.(),.3(),.4(),.5(),.6(),.7(),.8(),.9(),.1(),.11(). Not all of the specimens were tested up to a drift of.11, but all of the tests followed the same loading protocol until it was decided to end the test. A graphical representation of the loading protocol can be seen in Figure Story Drift Cycle Figure 3-34: Loading Protocol 47
61 3.7 Data Reduction The data was output as an excel file with the following data: time step, actuator load, actuator displacement, string pot displacements, and strain gage data. There were a few different methods used to interpret and draw conclusions from the data. During the test the actuator began to pivot upward as it pushed on the column and downward as it pulled on the column [Figure 3-35]. To compensate for this in the data, as the actuator load was greater than it would have been to push the column directly perpendicular, the load was multiplied by the actual displacement, taken from a string pot at the same elevation as the actuator, and divided by the displacement measured from the actuator. This gave the component of the load that was strictly acting perpendicular to the face of the column. Figure 3-35: Actuator Pivot (Exaggerated) 48
62 After the load had been corrected for each specimen, the hysteretic force vs. displacement plots were plotted from the corrected load and the string pot at the line of action of the actuator. From these plots several factors were determined including: the initial stiffness, where the specimen connection began to yield, and the ultimate load the specimen could resist. 3.8 Post-test Investigation After the tests the block-outs of most of the samples were jackhammered out to investigate what had happened around the base plate. The concrete was removed down to the grout level, which left the base plate uncovered. At this point most of the nuts could be taken off and the columns removed. Pictures are shown with the test observations in the next section. 49
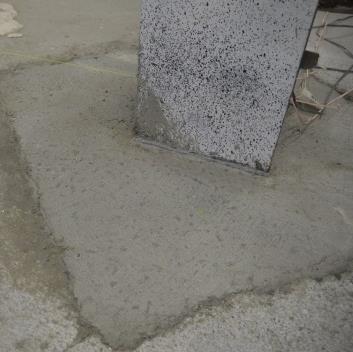
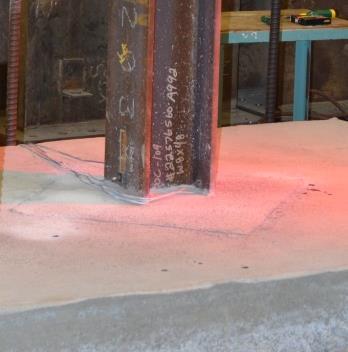
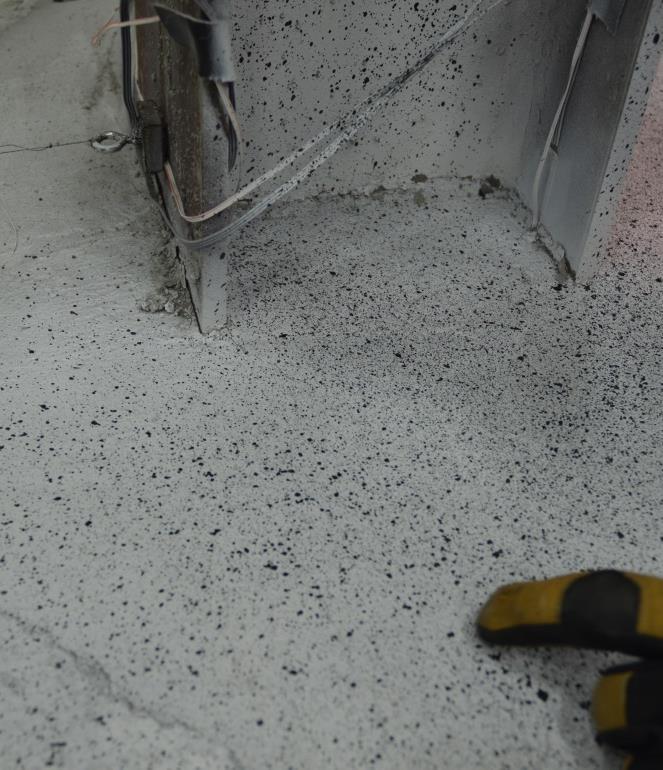
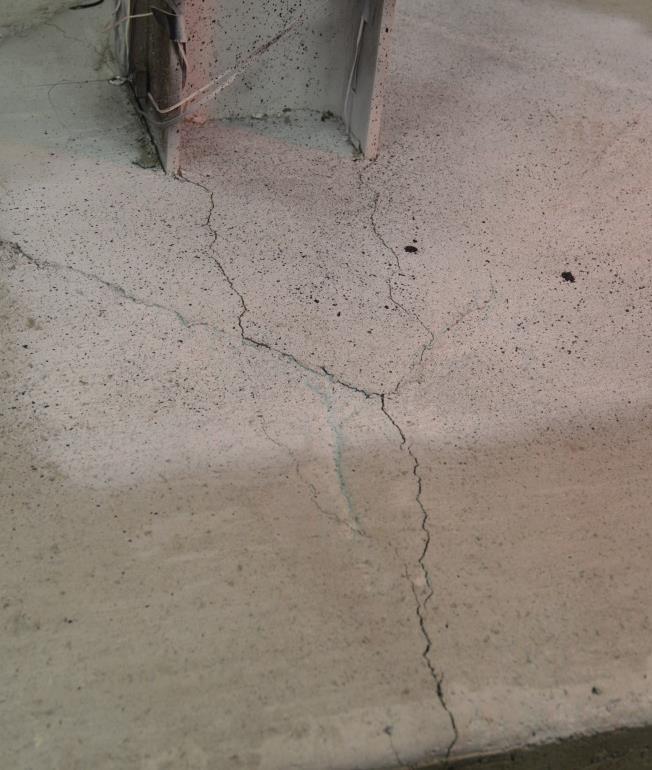
63 4 RESULTS 4.1 Test Observations For each individual specimen observations were recorded as the test progressed. Many of the observations and photos of the specimens were similar. Specimen A1 will be discussed in detail and photos of the specimen are included from the.1.6 drift cycle. Less detailed discussion is provided for the other specimens, which performed similarly. Photos of the blockout at. percent drift,.4 percent drift, and after the test have been included for all the specimens in Figure 4-1 through Figure 4-3. At.4 drift most of the specimens began to form visible cracks. For most of the specimens the slab-on-grade separated from the footing, forming a gap at the edges of the footing. As the test progressed, the gap between the slab-on-grade and the footing widened. Figure 4-4 shows one of the specimens later on in the test once the separation was visible. This was initially discovered after reviewing the DIC results after the first few cycles of the first test. A similar crack pattern was observed on most of the specimens. These cracks typically formed from the corner of the flanges, propagated to the edge of the block-out, then followed the outline of the block-out to a corner, and the from the corner of the block-out to the edge of the slab. 5

 A3")
 B1")
 B4")
 DB")


64 (a) Specimen A1 (b) Specimen A (c) Specimen A3 (d) Specimen A4 (e) Specimen B1 (f) Specimen B (g) Specimen B3 (h) Specimen B4 (i) Specimen DA (l) Specimen DB Figure 4-1: Specimens at. Drift 51

 A3")
 B1")
 B3")


65 (a) Specimen A1 (b) Specimen A (c) Specimen A3 (d) Specimen A4 (e) Specimen B1 (f) Specimen B (g) Specimen B3 (h) Specimen B4 Figure 4-: Specimens at.4 Drift 5

 A3")
 B1")
 B3")
 CA")
 CB")


66 (a) Specimen A1 (b) Specimen A (c) Specimen A3 (d) Specimen A4 (e) Specimen B1 (f) Specimen B (g) Specimen B3 (h) Specimen B4 (i) Specimen CA (j) Specimen DA (k) Specimen CB (l) Specimen DB Figure 4-3: Specimens after the Test 53

67 Figure 4-4: Slab Separation from Footing Specimen A1 A progression of the specimen from the.1 drift cycle to the.6 drift cycle is shown in Figure 4-5 through Figure 4-1. During the initial cycles, , there was no observable damage. The column connection at the.1 drift cycle is shown in Figure 4-5. During the.15 cycle the slab separated from the concrete footing and began to rock back and forth as is shown in Figure 4-4. During the. cycle there were no other changes. Figure 4-1(a) and Figure 4-6 show the column connection at. drift. In the.3 cycle a faint crack formed from the corners of the flange and propagated to the edge of the slab [Figure 4-7].There was also a small pop during this cycle. A large crack opened up on the edge of the slab during the.4 drift cycle and 54


68 the column at this drift is shown in Figure 4-(a) and Figure 4-8. Throughout this cycle more cracks formed and began to widen. Little change was observed in the specimen throughout the.5 drift cycle which is shown in Figure 4-9. During the.6 drift cycle the concrete around the cracks also began to flake [see Figure 4-1]. Between the.7 and.9 drift cycle the actuator head started to swivel causing the column to twist as can be seen in Figure Besides these observations, little new damage was detected during these cycles, although the existing cracks continued to widen and flake. During the.9 drift cycle the bolts broke during the first cycle. After the bolts broke the test was ended to prevent any more sudden and potentially dangerous failures in the specimen. Figure 4-3 shows the column connection after the test was finished. Figure 4-5: Specimen A1 at.1 Drift 55


69 Figure 4-6: Specimen A1 at. Drift Figure 4-7: Specimen A1 at.3 Drift 56


70 Figure 4-8: Specimen A1 at.4 Drift Figure 4-9: Specimen A1 at.5 Drift 57


71 Figure 4-1: Specimen A1 at.6 Drift Figure 4-11: Column Twist 58
72 4.1. Specimen A Specimen A behaved in a similar way as specimen A1. During the.375 drift cycle, no change was seen in the specimen. In the.5 drift cycle, the slab separated from the footing and began to rock back and forth throughout the remaining cycles. From the.5 to the.15 cycle there was minimal change in the specimen. During the. drift cycle, small cracks began to form from the corners of the flange but they did not reach to the edge of the block-out. Figure 4-1(b) shows the column connection during this drift cycle. These cracks spread to the edge of the block-out and to the edge of the slab during the.3 drift cycle. During the.4 drift cycle the cracks began to propagate vertically through the edge of the slab. Also during this cycle a crack formed between the cracks leading to the edge of the slab [see Figure 4-(b)]. In the.5 drift cycle an arching crack formed between the flanges. From the.5 cycle to the.8 cycle the cracks continued to widen but no other new evidence of degradation was observed. During the.9 drift cycle there was a very large pop and it is believed that the bolts broke at this point. The test was ended on the.1 drift cycle. Figure 4-3(b) shows the specimen at the end of the test Specimen A3 Due to an actuator control error the column was pushed until it yielded on the first cycle. There was little damaged to the concrete surrounding the specimen and the test was able to be continued. Figure 4-1 shows the flaking of the paint indicating yielding of the flanges on the column. Once the actuator was brought back to the original position the correct loading protocol was input into the computer and the test was started over. Also during the initial push the slab separated from the footing and began to rock back and forth during the first drift cycle. During the.375 cycle, a crack opened up from the flange of the column to the edge of the slab. This 59
]. There was little change between. and.")
73 crack may have formed during the first push but closed up when the column was brought back to the original position. From cycles.5 to.15 there was no change in the specimen. During the. rad drift cycle a small crack began to form the un-yielded flange [see Figure 4-1(c)]. There was little change between. and.7 except for some small cracks around the big cracks that had previously formed. Figure 4-(c) shows the specimen at.4 drift. During the.7 cycle the concrete around the web opposite the yielded flanges began to flake. During the.8 drift cycle the cracks that formed second spread diagonally to the edge of the slab. The test was ended on the.9 drift cycle. Figure 4-3(c) shows the specimen after the end of the test. Figure 4-1: Yielded Column Flanges Specimen A4 The base for this specimen was used for the test of specimens CA and DA so there were existing cracks in the slab before the test started. These cracks are shown in Figure 4-3(j). 6
74 As this base had previously been used, the slab had already separated from the footing and consequently began to rock back and forth during the first drift cycle. Little change was seen in the specimen between the.375 and. drift cycles. Figure 4-1(d) shows the specimen during the. drift cycle. During the.3 drift cycles, cracks formed about ⅓ of the way between the edge of the slab perpendicular to the applied load and the column, propagating out from the block-out and column. These cracks occurred on all four sides of the specimen. During the.4 drift cycle, cracks began to form from the corners of the flanges to the edge of the block-out as had occurred with previous specimens [see Figure 4-(d)]. During the.5 drift cycle, the existing cracks from the previous test that occurred at the corner of the block-out to the edge of the slab began to open up. Throughout the.6 drift cycle, the concrete began to crush and flake on edge the footing where the slab was rocking up and down. By the.7 drift cycle, the cracks propagating from the corners of the flanges spread across the front of the flanges and to the other flange corners. The test was ending after the.8 drift cycle. Figure 4-3(d) shows the column after the test had finished Specimen B1 Specimen B1 had a very high bond strength between the slab and the footing, which allowed the specimen to gain considerable strength. Between the.375 and.15 drift cycles there was little change observed in the specimen other than small gaps between the flanges and webs, and the concrete. During the. rad drift, cycle the bond between the slab and the footing broke and the specimen began to rock back and forth, as happened in previous tests. There was also a significant loss in strength during this cycle due to the break in the concrete bond. Also, during this cycle a crack formed on the edge of the slab in the middle of the specimen. This was interesting because the cracks that formed on the other specimens typically started in the block- 61
75 out and propagated out from the flanges of the column. This may have been due to the sudden break in the bond. Figure 4-1(e) shows the specimen during the. drift cycle. No change was observed during the.3 drift cycle, but in the.4 rad drift cycle the crack widened and it spread on top of the slab to the edge of the block-out and then two more cracks formed through the block-out to the corners of the column flanges. Also, a crack began to form from one of the flanges to the other flange [Figure 4-(e)]. Throughout the.5 drift cycle the crack between the flanges grew until it was fully connected. During the last cycle (.6 drift) the concrete began to flake and crush around the cracks Specimen B Specimen B also had a very strong concrete bond between the slab and the footing. Once again the specimen was able to receive much higher loads than the other specimens. From the.375 to the.1 drift cycle, there was no change in the specimen. During the.15 drift cycle the concrete bond broke and the slab began to rock back and forth. There was no change during the. drift cycle, but in the.3 drift cycle the slab lift on each end became more visible and a crack began to open up in the middle of the side of the slab. Figure 4-1(f) shows the specimen during the. drift cycle. Also, during the.3 drift cycle as the concrete rocked back and forth, it began to crush on the edges of the concrete underneath the slab. No change was observed during the.4 drift cycle, but throughout the.5 drift cycle cracks opened up from the corner of the flange to the edge of the block-out, and then to the crack that had formed on the side of the slab. Figure 4-(f) shows the specimen during the.4 drift cycle. The.6 drift cycle showed no new changes in the specimen. During the.7 drift cycle a crack opened up from each edge of the flange to the other flange. Through the remaining cycles,.8 drift and 6
76 .9 drift, these cracks continued to widen and flake. The test was ended on the.9 drift cycle. Figure 4-3(f) shows the specimen at the end of the test Specimen B3 There were no visible changes in the specimen from.375 drift to. drift. Figure 4-1(g) shows the specimen at. drift. During the.3 drift cycle flaking was observed in the column steel indicating that it had yielded. Throughout the remaining cycles of the test, the column continued to yield, but there was no evidence of degradation in the concrete. It appears that the bond between the concrete of the slab and the footing never broke because the column yielded before it could break the bond. The test was ended after the.8 drift cycle. Figure 4-(g) and Figure 4-3(g) show the specimen at.4 drift and after the test, respectively Specimen B4 The base for this specimen was used for the test of specimens CB and DB so there were existing cracks in the slab before the test started. These cracks are shown in Figure 4-3(l). Because the slab base had already been used, the slab had separated from the footing and began to rock back and forth as soon as the test began. From the.375 drift cycle up until the.5 drift cycle there was little change in the specimen. There were no cracks in the block-out but the existing cracks in the slab, from the previous test, opened up as the slab rocked back forth. Figure 4-1(h) and Figure 4-(h) show the specimen at. drift and.4 drift. During the.6 drift cycle, a small crack formed perpendicular to the flange and out to the corner of the blockout. Also towards the end of this cycle a second crack formed in the block-out and propagated to the edge of the slab and then down the side of the slab. No change was observed in the.7 drift cycle but during the.8 drift cycle a third crack opened up in the block-out and much of the 63
77 concrete began to flake around the cracks. Also during this cycle the concrete cracked and began to flake between the flanges the test was ended on this cycle. Figure 4-3(h) shows the specimen after the end of the test Specimen CA There was no visible change in the specimen during the.375 drift cycle. It became evident that the slab was rocking back and forth during the.5 drift cycle; however, it was not entirely clear exactly when the concrete bond broke. There were no other visible changes throughout the test which was ended on the.1 drift cycle. Figure 4-3(i) shows the specimen after the end of the test Specimen DA We tested specimen CA again with the modifications noted in the methods section (3.3.3 Modified Specimen) and it was renamed DA. There were no changes in the specimen through the.375 drift cycle but during the.5 rad drift cycle cracks began to form from the outside corners of the flange and spread to the edges of the block-out. Also a visible separation was observed between the flange and the concrete and became more noticeable throughout the cycles. As the drift increased to.75, the existing cracks widened and new ones formed from the corners of the block-out to the side of the slab. Another large crack began to form from the outside of the block-out to the south east corner of the slab during the.1 drift cycle. There was no change in the specimen during the.15 drift cycle. Similarly during the. cycle two more cracks opened up, one from the middle of the block-out to the edge of the slab, in between the middle of the slab and the northeast corner, and the other between the middle of the slab and the 64
78 northwest corner. The test was ended after this cycle. Figure 4-3(j) shows the specimen after the end of the test Specimen CB There was very little change in the specimen from the.375 drift cycle to the.75 drift cycle. During the.1 drift cycle, the concrete bond between the slab and the footing broke. At this point the slab began to rock back and forth like the other specimen had done. After the.1 drift cycle the test was ended. Figure 4-3(k) shows the specimen after the test Specimen DB Specimen CB was tested again with the modifications noted in the methods section (3.3.3 Modified Specimen) and was renamed DB. Little change was seen during drift cycles During the.1 drift cycle, a crack formed from the corner of the block-out to the edge of the slab and there were also a few small cracks that began to propagate out from the column flanges. During the.15 drift cycle, those small cracks began to open up and an obvious path could be traced from the column flanges to the edge of the block-out and then from the edge of the block-out to the edge of the slab. Throughout the. rad drift cycle, these cracks widened and the crack on the edge of the slab began to grow down the side of the slab and towards the foundation. After this cycle the test was ended. Figure 4-3(l) shows the specimen after the test was completed Post-test Investigation The post-test investigation was performed to determine if anything could be found out about what was going on inside the concrete and around the base plate. After jackhammering out 65

79 the specimen similar patterns were noticed with most of the specimens. For many of the specimens a triangular cracking pattern was observed around the bolts as shown in Figure On the columns that the bolts broke, the break happened just underneath or just inside the leveling nut in all cases. This is shown for one of the specimens in Figure It was also noticed that there was no evidence of yielding in the base plates. This was particularly interesting because the loads that were reached during the test would have resulted in failure in the baseplate according to the baseplate design guide. Figure 4-13: Triangular Cracking Pattern 66

80 Figure 4-14: Broken Anchor Bolt 4. Global Results 4..1 Backbone Curves Backbone curves were developed based on the corrected data. To create the curves the maximum load at each drift cycle was plotted versus the recorded displacement at that load for each specimen. For the deeper embeds, a high initial strength can be seen. This strength can be attributed to the strong concrete bond between the slab-on-grade and the footing. The backbone curves are shown in Figure At drifts greater than.4, all of the specimens with bolts, had similar strength. 67
Experimental Investigation of Steel Pipe Pile to Concrete Cap Connections
 Brigham Young University BYU ScholarsArchive All Theses and Dissertations 211-4-19 Experimental Investigation of Steel Pipe Pile to Concrete Cap Connections Ryan S. Eastman Brigham Young University - Provo
Rotational Stiffness Models for Shallow Embedded Column-to-Footing Connections
 Brigham Young University BYU ScholarsArchive All Theses and Dissertations 218-3-1 Rotational Stiffness Models for Shallow Embedded Column-to-Footing Connections Ashley Lauren Sadler Brigham Young University
COLUMN BASE WEAK AXIS ALIGNED ASYMMETRIC FRICTION CONNECTION CYCLIC PERFORMANCE
 8 th International Conference on Behavior of Steel Structures in Seismic Areas Shanghai, China, July 1-3, 2015 COLUMN BASE WEAK AXIS ALIGNED ASYMMETRIC FRICTION CONNECTION CYCLIC PERFORMANCE J. Borzouie*,
NAME: Given Formulae: Law of Cosines: Law of Sines:
 NME: Given Formulae: Law of Cosines: EXM 3 PST PROBLEMS (LESSONS 21 TO 28) 100 points Thursday, November 16, 2017, 7pm to 9:30, Room 200 You are allowed to use a calculator and drawing equipment, only.
MECHANICS OF MATERIALS. Prepared by Engr. John Paul Timola
 MECHANICS OF MATERIALS Prepared by Engr. John Paul Timola Mechanics of materials branch of mechanics that studies the internal effects of stress and strain in a solid body. stress is associated with the
Annex - R C Design Formulae and Data
 The design formulae and data provided in this Annex are for education, training and assessment purposes only. They are based on the Hong Kong Code of Practice for Structural Use of Concrete 2013 (HKCP-2013).
CONNECTION DESIGN. Connections must be designed at the strength limit state
 CONNECTION DESIGN Connections must be designed at the strength limit state Average of the factored force effect at the connection and the force effect in the member at the same point At least 75% of the
[5] Stress and Strain
![[5] Stress and Strain](/thumbs/95/123344550.jpg "[5] Stress and Strain") [5] Stress and Strain Page 1 of 34 [5] Stress and Strain [5.1] Internal Stress of Solids [5.2] Design of Simple Connections (will not be covered in class) [5.3] Deformation and Strain [5.4] Hooke s Law
[5] Stress and Strain Page 1 of 34 [5] Stress and Strain [5.1] Internal Stress of Solids [5.2] Design of Simple Connections (will not be covered in class) [5.3] Deformation and Strain [5.4] Hooke s Law
Buckling-Restrained Braced Frame Connection Design and Testing
 Brigham Young University BYU ScholarsArchive All Theses and Dissertations 2007-07-19 Buckling-Restrained Braced Frame Connection Design and Testing Bradly B. Coy Brigham Young University - Provo Follow
Purpose of this Guide: To thoroughly prepare students for the exact types of problems that will be on Exam 3.
 ES230 STRENGTH OF MTERILS Exam 3 Study Guide Exam 3: Wednesday, March 8 th in-class Updated 3/3/17 Purpose of this Guide: To thoroughly prepare students for the exact types of problems that will be on
Example 1 - Single Headed Anchor in Tension Away from Edges BORRADOR. Calculations and Discussion
 Example 1 - Single Headed Anchor in Tension Away from Edges Check the capacity of a single anchor, 1 in. diameter, F1554 Grade 36 headed bolt with heavy-hex head installed in the top of a foundation without
Karbala University College of Engineering Department of Civil Eng. Lecturer: Dr. Jawad T. Abodi
 Chapter 04 Structural Steel Design According to the AISC Manual 13 th Edition Analysis and Design of Compression Members By Dr. Jawad Talib Al-Nasrawi University of Karbala Department of Civil Engineering
Science 7 Unit B: Structures and Forces. Topic 4. Forces, Loads, & Stresses. pp WORKBOOK. Name:
 Science 7 Unit B: Structures and Forces Topic 4 Forces, Loads, & Stresses pp. 305-314 WORKBOOK Name: Every object that provides support is a structure. A structure may be made up of one or more parts,
Structural Steelwork Eurocodes Development of A Trans-national Approach
 Structural Steelwork Eurocodes Development of A Trans-national Approach Course: Eurocode Module 7 : Worked Examples Lecture 0 : Simple braced frame Contents: 1. Simple Braced Frame 1.1 Characteristic Loads
APPENDIX G I-BEAM SUMMARIES 0.6-IN. STRAND G-1
 APPENDIX G I-BEAM SUMMARIES.6-IN. STRAND G-1 Concrete Compressive Strength Embedment Length(L e ) Span Failure Mode Maximum Load Maximum Shear Maximum Moment Maximum Deflection attained Rebound after complete
Lecture-08 Gravity Load Analysis of RC Structures
 Lecture-08 Gravity Load Analysis of RC Structures By: Prof Dr. Qaisar Ali Civil Engineering Department UET Peshawar www.drqaisarali.com 1 Contents Analysis Approaches Point of Inflection Method Equivalent
Experimental investigation on monotonic performance of steel curved knee braces for weld-free beam-to-column connections
 Experimental investigation on monotonic performance of steel curved knee braces for weld-free beam-to-column connections *Zeyu Zhou 1) Bo Ye 2) and Yiyi Chen 3) 1), 2), 3) State Key Laboratory of Disaster
Finite Element Modelling with Plastic Hinges
 01/02/2016 Marco Donà Finite Element Modelling with Plastic Hinges 1 Plastic hinge approach A plastic hinge represents a concentrated post-yield behaviour in one or more degrees of freedom. Hinges only
Flexure: Behavior and Nominal Strength of Beam Sections
 4 5000 4000 (increased d ) (increased f (increased A s or f y ) c or b) Flexure: Behavior and Nominal Strength of Beam Sections Moment (kip-in.) 3000 2000 1000 0 0 (basic) (A s 0.5A s ) 0.0005 0.001 0.0015
PLATE GIRDERS II. Load. Web plate Welds A Longitudinal elevation. Fig. 1 A typical Plate Girder
 16 PLATE GIRDERS II 1.0 INTRODUCTION This chapter describes the current practice for the design of plate girders adopting meaningful simplifications of the equations derived in the chapter on Plate Girders
Sabah Shawkat Cabinet of Structural Engineering Walls carrying vertical loads should be designed as columns. Basically walls are designed in
 Sabah Shawkat Cabinet of Structural Engineering 17 3.6 Shear walls Walls carrying vertical loads should be designed as columns. Basically walls are designed in the same manner as columns, but there are
Seismic Pushover Analysis Using AASHTO Guide Specifications for LRFD Seismic Bridge Design
 Seismic Pushover Analysis Using AASHTO Guide Specifications for LRFD Seismic Bridge Design Elmer E. Marx, Alaska Department of Transportation and Public Facilities Michael Keever, California Department
FLEXIBILITY METHOD FOR INDETERMINATE FRAMES
 UNIT - I FLEXIBILITY METHOD FOR INDETERMINATE FRAMES 1. What is meant by indeterminate structures? Structures that do not satisfy the conditions of equilibrium are called indeterminate structure. These
five Mechanics of Materials 1 ARCHITECTURAL STRUCTURES: FORM, BEHAVIOR, AND DESIGN DR. ANNE NICHOLS SUMMER 2017 lecture
 ARCHITECTURAL STRUCTURES: FORM, BEHAVIOR, AND DESIGN DR. ANNE NICHOLS SUMMER 2017 lecture five mechanics www.carttalk.com of materials Mechanics of Materials 1 Mechanics of Materials MECHANICS MATERIALS
CHAPTER 6: ULTIMATE LIMIT STATE
 CHAPTER 6: ULTIMATE LIMIT STATE 6.1 GENERAL It shall be in accordance with JSCE Standard Specification (Design), 6.1. The collapse mechanism in statically indeterminate structures shall not be considered.
Parametric Study of Self-Centering Concentrically- Braced Frames in Response to Earthquakes
 The University of Akron IdeaExchange@UAkron Honors Research Projects The Dr. Gary B. and Pamela S. Williams Honors College Spring 2015 Parametric Study of Self-Centering Concentrically- Braced Frames in
Task 1 - Material Testing of Bionax Pipe and Joints
 Task 1 - Material Testing of Bionax Pipe and Joints Submitted to: Jeff Phillips Western Regional Engineer IPEX Management, Inc. 20460 Duncan Way Langley, BC, Canada V3A 7A3 Ph: 604-534-8631 Fax: 604-534-7616
Calculation for Moment Capacity of Beam-to- Upright Connections of Steel Storage Pallet Racks
 Missouri University of Science and Technology Scholars' Mine International Specialty Conference on Cold- Formed Steel Structures (2014) - 22nd International Specialty Conference on Cold-Formed Steel Structures
Special edition paper
 Development of New Aseismatic Structure Using Escalators Kazunori Sasaki* Atsushi Hayashi* Hajime Yoshida** Toru Masuda* Aseismatic reinforcement work is often carried out in parallel with improvement
Mechanics of Materials Primer
 Mechanics of Materials rimer Notation: A = area (net = with holes, bearing = in contact, etc...) b = total width of material at a horizontal section d = diameter of a hole D = symbol for diameter E = modulus
ME Final Exam. PROBLEM NO. 4 Part A (2 points max.) M (x) y. z (neutral axis) beam cross-sec+on. 20 kip ft. 0.2 ft. 10 ft. 0.1 ft.
 M (x) y. z (neutral axis) beam cross-sec+on. 20 kip ft. 0.2 ft. 10 ft. 0.1 ft.") ME 323 - Final Exam Name December 15, 2015 Instructor (circle) PROEM NO. 4 Part A (2 points max.) Krousgrill 11:30AM-12:20PM Ghosh 2:30-3:20PM Gonzalez 12:30-1:20PM Zhao 4:30-5:20PM M (x) y 20 kip ft 0.2
ME 323 - Final Exam Name December 15, 2015 Instructor (circle) PROEM NO. 4 Part A (2 points max.) Krousgrill 11:30AM-12:20PM Ghosh 2:30-3:20PM Gonzalez 12:30-1:20PM Zhao 4:30-5:20PM M (x) y 20 kip ft 0.2
ENERGY DIAGRAM w/ HYSTERETIC
 ENERGY DIAGRAM ENERGY DIAGRAM w/ HYSTERETIC IMPLIED NONLINEAR BEHAVIOR STEEL STRESS STRAIN RELATIONSHIPS INELASTIC WORK DONE HYSTERETIC BEHAVIOR MOMENT ROTATION RELATIONSHIP IDEALIZED MOMENT ROTATION DUCTILITY
twenty one concrete construction: shear & deflection ARCHITECTURAL STRUCTURES: FORM, BEHAVIOR, AND DESIGN DR. ANNE NICHOLS SUMMER 2014 lecture
 ARCHITECTURAL STRUCTURES: FORM, BEHAVIOR, AND DESIGN DR. ANNE NICHOLS SUMMER 2014 lecture twenty one concrete construction: Copyright Kirk Martini shear & deflection Concrete Shear 1 Shear in Concrete
System Capacity of Vintage Reinforced Concrete Moment Frame Culverts with No Overlay
 DCT 252 System Capacity of Vintage Reinforced Concrete Moment Frame Culverts with No Overlay By Timothy Porter Thomas Schumacher August, 2015 Delaware Center for Transportation University of Delaware 355
Failure in Flexure. Introduction to Steel Design, Tensile Steel Members Modes of Failure & Effective Areas
 Introduction to Steel Design, Tensile Steel Members Modes of Failure & Effective Areas MORGAN STATE UNIVERSITY SCHOOL OF ARCHITECTURE AND PLANNING LECTURE VIII Dr. Jason E. Charalambides Failure in Flexure!
Chapter 4. Test results and discussion. 4.1 Introduction to Experimental Results
 Chapter 4 Test results and discussion This chapter presents a discussion of the results obtained from eighteen beam specimens tested at the Structural Technology Laboratory of the Technical University
ME 243. Mechanics of Solids
 ME 243 Mechanics of Solids Lecture 2: Stress and Strain Ahmad Shahedi Shakil Lecturer, Dept. of Mechanical Engg, BUET E-mail: sshakil@me.buet.ac.bd, shakil6791@gmail.com Website: teacher.buet.ac.bd/sshakil
Accordingly, the nominal section strength [resistance] for initiation of yielding is calculated by using Equation C-C3.1.
![Accordingly, the nominal section strength [resistance] for initiation of yielding is calculated by using Equation C-C3.1.](/thumbs/89/98617066.jpg "Accordingly, the nominal section strength [resistance] for initiation of yielding is calculated by using Equation C-C3.1.") C3 Flexural Members C3.1 Bending The nominal flexural strength [moment resistance], Mn, shall be the smallest of the values calculated for the limit states of yielding, lateral-torsional buckling and distortional
C3 Flexural Members C3.1 Bending The nominal flexural strength [moment resistance], Mn, shall be the smallest of the values calculated for the limit states of yielding, lateral-torsional buckling and distortional
Earthquake-resistant design of indeterminate reinforced-concrete slender column elements
 Engineering Structures 29 (2007) 163 175 www.elsevier.com/locate/engstruct Earthquake-resistant design of indeterminate reinforced-concrete slender column elements Gerasimos M. Kotsovos a, Christos Zeris
Technical Note PP TN Engineering Considerations for Temperature Change
 Technical Note PP 814 - TN Engineering Considerations for Temperature Change www.performancepipe.com Like most materials, polyethylene is affected by temperature change. However, polyethylene s response
Chapter Objectives. Design a beam to resist both bendingand shear loads
 Chapter Objectives Design a beam to resist both bendingand shear loads A Bridge Deck under Bending Action Castellated Beams Post-tensioned Concrete Beam Lateral Distortion of a Beam Due to Lateral Load
Chapter 12. Static Equilibrium and Elasticity
 Chapter 12 Static Equilibrium and Elasticity Static Equilibrium Equilibrium implies that the object moves with both constant velocity and constant angular velocity relative to an observer in an inertial
Lap splice length and details of column longitudinal reinforcement at plastic hinge region
 Lap length and details of column longitudinal reinforcement at plastic hinge region Hong-Gun Park 1) and Chul-Goo Kim 2) 1), 2 Department of Architecture and Architectural Engineering, Seoul National University,
Entrance exam Master Course
 - 1 - Guidelines for completion of test: On each page, fill in your name and your application code Each question has four answers while only one answer is correct. o Marked correct answer means 4 points
Crack Control for Ledges in Inverted T Bent Caps
 Crack Control for Ledges in Inverted T Bent Caps Research Report 0-1854-5 Prepared for Texas Department of Transportation Project 0-1854 By Ronnie Rong-Hua Zhu Research Associate Hemant Dhonde Research
Design of a Multi-Storied RC Building
 Design of a Multi-Storied RC Building 16 14 14 3 C 1 B 1 C 2 B 2 C 3 B 3 C 4 13 B 15 (S 1 ) B 16 (S 2 ) B 17 (S 3 ) B 18 7 B 4 B 5 B 6 B 7 C 5 C 6 C 7 C 8 C 9 7 B 20 B 22 14 B 19 (S 4 ) C 10 C 11 B 23
2012 MECHANICS OF SOLIDS
 R10 SET - 1 II B.Tech II Semester, Regular Examinations, April 2012 MECHANICS OF SOLIDS (Com. to ME, AME, MM) Time: 3 hours Max. Marks: 75 Answer any FIVE Questions All Questions carry Equal Marks ~~~~~~~~~~~~~~~~~~~~~~
QUESTION BANK SEMESTER: III SUBJECT NAME: MECHANICS OF SOLIDS
 QUESTION BANK SEMESTER: III SUBJECT NAME: MECHANICS OF SOLIDS UNIT 1- STRESS AND STRAIN PART A (2 Marks) 1. Define longitudinal strain and lateral strain. 2. State Hooke s law. 3. Define modular ratio,
A study of the critical condition of a battened column and a frame by classical methods
 University of South Florida Scholar Commons Graduate Theses and Dissertations Graduate School 003 A study of the critical condition of a battened column and a frame by classical methods Jamal A.H Bekdache
MECE 3321 MECHANICS OF SOLIDS CHAPTER 3
 MECE 3321 MECHANICS OF SOLIDS CHAPTER 3 Samantha Ramirez TENSION AND COMPRESSION TESTS Tension and compression tests are used primarily to determine the relationship between σ avg and ε avg in any material.
BLOCK SHEAR BEHAVIOUR OF COPED STEEL BEAMS
 University of Alberta Department of Civil & Environmental Engineering Structural Engineering Report No. 244 BLOCK SHEAR BEHAVIOUR OF COPED STEEL BEAMS by Cameron R. Franchuk Robert G. Driver and Gilbert
PERIYAR CENTENARY POLYTECHNIC COLLEGE PERIYAR NAGAR - VALLAM THANJAVUR. DEPARTMENT OF MECHANICAL ENGINEERING QUESTION BANK
 PERIYAR CENTENARY POLYTECHNIC COLLEGE PERIYAR NAGAR - VALLAM - 613 403 - THANJAVUR. DEPARTMENT OF MECHANICAL ENGINEERING QUESTION BANK Sub : Strength of Materials Year / Sem: II / III Sub Code : MEB 310
MODULE F: SIMPLE CONNECTIONS
 MODULE F: SIMPLE CONNECTIONS This module of CIE 428 covers the following subjects Connector characterization Failure modes of bolted shear connections Detailing of bolted connections Bolts: common and
Tension Members. ENCE 455 Design of Steel Structures. II. Tension Members. Introduction. Introduction (cont.)
") ENCE 455 Design of Steel Structures II. Tension Members C. C. Fu, Ph.D., P.E. Civil and Environmental Engineering Department University of Maryland Tension Members Following subjects are covered: Introduction
ENCE 455 Design of Steel Structures II. Tension Members C. C. Fu, Ph.D., P.E. Civil and Environmental Engineering Department University of Maryland Tension Members Following subjects are covered: Introduction
Presented by: Civil Engineering Academy
 Presented by: Civil Engineering Academy Structural Design and Material Properties of Steel Presented by: Civil Engineering Academy Advantages 1. High strength per unit length resulting in smaller dead
APPLICATION OF INTENSIVE SHEAR REINFORCEMENT TO SPLICING SLEEVE JOINT OF PRE-FABRICATED REINFORCEMENT ASSEMBLY
 13 th World Conference on Earthquake Engineering Vancouver, B.C., Canada August 1-6, 24 Paper No. 587 APPLICATION OF INTENSIVE SHEAR REINFORCEMENT TO SPLICING SLEEVE JOINT OF PRE-FABRICATED REINFORCEMENT
Solid Mechanics Chapter 1: Tension, Compression and Shear
 Solid Mechanics Chapter 1: Tension, Compression and Shear Dr. Imran Latif Department of Civil and Environmental Engineering College of Engineering University of Nizwa (UoN) 1 Why do we study Mechanics
An investigation of the block shear strength of coped beams with a welded. clip angles connection Part I: Experimental study
 An investigation of the block shear strength of coped beams with a welded clip angles connection Part I: Experimental study Michael C. H. Yam a*, Y. C. Zhong b, Angus C. C. Lam b, V. P. Iu b a Department
Influence of Relative Compaction on Passive Resistance of Abutments with Mechanically Stabilized Earth (MSE) Wingwalls
 Wingwalls") Brigham Young University BYU ScholarsArchive All Theses and Dissertations 2010-08-11 Influence of Relative Compaction on Passive Resistance of Abutments with Mechanically Stabilized Earth (MSE) Wingwalls
Brigham Young University BYU ScholarsArchive All Theses and Dissertations 2010-08-11 Influence of Relative Compaction on Passive Resistance of Abutments with Mechanically Stabilized Earth (MSE) Wingwalls
CHAPTER 5. T a = 0.03 (180) 0.75 = 1.47 sec 5.12 Steel moment frame. h n = = 260 ft. T a = (260) 0.80 = 2.39 sec. Question No.
 0.75 = 1.47 sec 5.12 Steel moment frame. h n = = 260 ft. T a = (260) 0.80 = 2.39 sec. Question No.") CHAPTER 5 Question Brief Explanation No. 5.1 From Fig. IBC 1613.5(3) and (4) enlarged region 1 (ASCE 7 Fig. -3 and -4) S S = 1.5g, and S 1 = 0.6g. The g term is already factored in the equations, thus
CHAPTER 5 Question Brief Explanation No. 5.1 From Fig. IBC 1613.5(3) and (4) enlarged region 1 (ASCE 7 Fig. -3 and -4) S S = 1.5g, and S 1 = 0.6g. The g term is already factored in the equations, thus
A PROPOSAL OF DESIGN PROCEDURE FOR FLEXURAL STRENGTHENING RC BEAMS WITH FRP SHEET
 N. Kishi, E-89, 1/8 A PROPOSAL OF DESIGN PROCEDURE FOR FLEXURAL STRENGTHENING RC BEAMS WITH FRP SHEET Yusuke Kurihashi Norimitsu Kishi Hiroshi Mikami Sumiyuki Sawada Civil Engrg. Research Muroran Inst.
Preferred practice on semi-integral abutment layout falls in the following order:
 GENERAL INFORMATION: This section of the chapter establishes the practices and requirements necessary for the design and detailing of semi-integral abutments. For general requirements and guidelines on
Chapter (6) Geometric Design of Shallow Foundations
 Geometric Design of Shallow Foundations") Chapter (6) Geometric Design of Shallow Foundations Introduction As we stated in Chapter 3, foundations are considered to be shallow if if [D (3 4)B]. Shallow foundations have several advantages: minimum
Chapter (6) Geometric Design of Shallow Foundations Introduction As we stated in Chapter 3, foundations are considered to be shallow if if [D (3 4)B]. Shallow foundations have several advantages: minimum
Service Information Letter SIL # 017
 Service Information Letter SIL # 017 Trunnion Adjustment - Double Barrels Only Equipment: Double Barrels With Sloped Trunnions Date Issued: 9-24-03 Additional Reference: SIL # 016 Revised: Revision #:
Elastic Properties of Solids (One or two weights)
") Elastic properties of solids Page 1 of 8 Elastic Properties of Solids (One or two weights) This is a rare experiment where you will get points for breaking a sample! The recommended textbooks and other
Elastic properties of solids Page 1 of 8 Elastic Properties of Solids (One or two weights) This is a rare experiment where you will get points for breaking a sample! The recommended textbooks and other
Chapter 8. Shear and Diagonal Tension
 Chapter 8. and Diagonal Tension 8.1. READING ASSIGNMENT Text Chapter 4; Sections 4.1-4.5 Code Chapter 11; Sections 11.1.1, 11.3, 11.5.1, 11.5.3, 11.5.4, 11.5.5.1, and 11.5.6 8.2. INTRODUCTION OF SHEAR
Electric Field Mapping Lab 2. Precautions
 TS 2-12-12 Electric Field Mapping Lab 2 1 Electric Field Mapping Lab 2 Equipment: mapping board, U-probe, resistive boards, templates, dc voltmeter (431B), 4 long leads, 16 V dc for wall strip Reading:
INSPIRE GK12 Lesson Plan. Elastic Deformation of Materials: An Investigation of Hooke s Law Length of Lesson
 Lesson Title Elastic Deformation of Materials: An Investigation of Hooke s Law Length of Lesson 1.5 hours Created By Justin Warren Subject Physics Grade Level 11-12 State Standards Physics: 1 c, d, f;
INVESTIGATION INTO THE EFFECTS OF VARIABLE ROW SPACING IN BOLTED TIMBER CONNECTIONS SUBJECTED TO REVERSE CYCLIC LOADING CALEB JESSE KNUDSON
 INVESTIGATION INTO THE EFFECTS OF VARIABLE ROW SPACING IN BOLTED TIMBER CONNECTIONS SUBJECTED TO REVERSE CYCLIC LOADING By CALEB JESSE KNUDSON A thesis submitted in partial fulfillment of the requirements
Dynamic analysis of a reinforced concrete shear wall with strain rate effect. Synopsis. Introduction
 Dynamic analysis of a reinforced concrete shear wall with strain rate effect Synopsis A simplified analysis method for a reinforced concrete shear wall structure considering strain rate effects is presented.
CIVIL DEPARTMENT MECHANICS OF STRUCTURES- ASSIGNMENT NO 1. Brach: CE YEAR:
 MECHANICS OF STRUCTURES- ASSIGNMENT NO 1 SEMESTER: V 1) Find the least moment of Inertia about the centroidal axes X-X and Y-Y of an unequal angle section 125 mm 75 mm 10 mm as shown in figure 2) Determine
ENG1001 Engineering Design 1
 ENG1001 Engineering Design 1 Structure & Loads Determine forces that act on structures causing it to deform, bend, and stretch Forces push/pull on objects Structures are loaded by: > Dead loads permanent
Direct (and Shear) Stress
 Stress") 1 Direct (and Shear) Stress 3.1 Introduction Chapter 21 introduced the concepts of stress and strain. In this chapter we shall discuss direct and shear stresses. We shall also look at how to calculate
1 Direct (and Shear) Stress 3.1 Introduction Chapter 21 introduced the concepts of stress and strain. In this chapter we shall discuss direct and shear stresses. We shall also look at how to calculate
Lab Exercise #5: Tension and Bending with Strain Gages
 Lab Exercise #5: Tension and Bending with Strain Gages Pre-lab assignment: Yes No Goals: 1. To evaluate tension and bending stress models and Hooke s Law. a. σ = Mc/I and σ = P/A 2. To determine material
D : SOLID MECHANICS. Q. 1 Q. 9 carry one mark each. Q.1 Find the force (in kn) in the member BH of the truss shown.
 in the member BH of the truss shown.") D : SOLID MECHANICS Q. 1 Q. 9 carry one mark each. Q.1 Find the force (in kn) in the member BH of the truss shown. Q.2 Consider the forces of magnitude F acting on the sides of the regular hexagon having
D : SOLID MECHANICS Q. 1 Q. 9 carry one mark each. Q.1 Find the force (in kn) in the member BH of the truss shown. Q.2 Consider the forces of magnitude F acting on the sides of the regular hexagon having
Design of a Balanced-Cantilever Bridge
 Design of a Balanced-Cantilever Bridge CL (Bridge is symmetric about CL) 0.8 L 0.2 L 0.6 L 0.2 L 0.8 L L = 80 ft Bridge Span = 2.6 L = 2.6 80 = 208 Bridge Width = 30 No. of girders = 6, Width of each girder
Electric Field Mapping
 Electric Field Mapping Equipment: mapping board, U-probe, 5 resistive boards, templates, knob adjustable DC voltmeter, 4 long leads, 16 V DC for wall strip, 8 1/2 X 11 sheets of paper Reading: Topics of
Application nr. 7 (Connections) Strength of bolted connections to EN (Eurocode 3, Part 1.8)
 Strength of bolted connections to EN (Eurocode 3, Part 1.8)") Application nr. 7 (Connections) Strength of bolted connections to EN 1993-1-8 (Eurocode 3, Part 1.8) PART 1: Bolted shear connection (Category A bearing type, to EN1993-1-8) Structural element Tension
Application nr. 7 (Connections) Strength of bolted connections to EN 1993-1-8 (Eurocode 3, Part 1.8) PART 1: Bolted shear connection (Category A bearing type, to EN1993-1-8) Structural element Tension
CIVE 2700: Civil Engineering Materials Fall Lab 2: Concrete. Ayebabomo Dambo
 CIVE 2700: Civil Engineering Materials Fall 2017 Lab 2: Concrete Ayebabomo Dambo Lab Date: 7th November, 2017 CARLETON UNIVERSITY ABSTRACT Concrete is a versatile construction material used in bridges,
Steel Cross Sections. Structural Steel Design
 Steel Cross Sections Structural Steel Design PROPERTIES OF SECTIONS Perhaps the most important properties of a beam are the depth and shape of its cross section. There are many to choose from, and there
SAULTCOLLEGE of AppliedArtsand Technology SaultSte. Marie COURSEOUTLINE
 SAULTCOLLEGE of AppliedArtsand Technology SaultSte. Marie COURSEOUTLINE STRENGTH OF ~1ATERIALS MCH 103-3 revised June 1981 by W.J. Adolph ------- STRENGHT OF MATERIALS MCH 103-3 To'Cic Periods Tooic Description
CHAPTER 12 STATIC EQUILIBRIUM AND ELASTICITY. Conditions for static equilibrium Center of gravity (weight) Examples of static equilibrium
 Examples of static equilibrium") CHAPTER 12 STATIC EQUILIBRIUM AND ELASTICITY As previously defined, an object is in equilibrium when it is at rest or moving with constant velocity, i.e., with no net force acting on it. The following
CHAPTER 12 STATIC EQUILIBRIUM AND ELASTICITY As previously defined, an object is in equilibrium when it is at rest or moving with constant velocity, i.e., with no net force acting on it. The following
CHAPTER 3 EXPERIMENTAL STUDY
 Experimental Study 42 CHAPTER 3 EXPERIMENTAL STUDY 3.1. INTRODUCTION The experimental study that has been carried out in this thesis has two main objectives: 1. Characterise the concrete behaviour in mode
Experimental Study and Numerical Simulation on Steel Plate Girders With Deep Section
 6 th International Conference on Advances in Experimental Structural Engineering 11 th International Workshop on Advanced Smart Materials and Smart Structures Technology August 1-2, 2015, University of
1.105 Solid Mechanics Laboratory Fall 2003 Experiment 3 The Tension Test
 1.105 Solid Mechanics Laboratory Fall 2003 Experiment 3 The Tension Test Our objective is to measure the Elastic Modulus of steel. The experiment comes in two parts. In the first, you will subject a steel
EQUIVALENT FRACTURE ENERGY CONCEPT FOR DYNAMIC RESPONSE ANALYSIS OF PROTOTYPE RC GIRDERS
 EQUIVALENT FRACTURE ENERGY CONCEPT FOR DYNAMIC RESPONSE ANALYSIS OF PROTOTYPE RC GIRDERS Abdul Qadir Bhatti 1, Norimitsu Kishi 2 and Khaliq U Rehman Shad 3 1 Assistant Professor, Dept. of Structural Engineering,
March 24, Chapter 4. Deflection and Stiffness. Dr. Mohammad Suliman Abuhaiba, PE
 Chapter 4 Deflection and Stiffness 1 2 Chapter Outline Spring Rates Tension, Compression, and Torsion Deflection Due to Bending Beam Deflection Methods Beam Deflections by Superposition Strain Energy Castigliano
Mechanics of Materials
 Mechanics of Materials Notation: a = acceleration = area (net = with holes, bearing = in contact, etc...) SD = allowable stress design d = diameter of a hole = calculus symbol for differentiation e = change
Design of Reinforced Concrete Beam for Shear
 Lecture 06 Design of Reinforced Concrete Beam for Shear By: Prof Dr. Qaisar Ali Civil Engineering Department UET Peshawar drqaisarali@uetpeshawar.edu.pk 1 Topics Addressed Shear Stresses in Rectangular
FE-Analysis of Stringer-to-floor-beam Connections in Riveted Railway Bridges
 FE-Analysis of Stringer-to-floor-beam Connections in Riveted Railway Bridges By Mohammad Al-Emrani 1 and Robert Kliger 2 Department of Structural Engineering Chalmers University of Technology, SE-412 96
DESIGN AND DETAILING OF COUNTERFORT RETAINING WALL
 DESIGN AND DETAILING OF COUNTERFORT RETAINING WALL When the height of the retaining wall exceeds about 6 m, the thickness of the stem and heel slab works out to be sufficiently large and the design becomes
(Refer Slide Time: 2:43-03:02)
") Strength of Materials Prof. S. K. Bhattacharyya Department of Civil Engineering Indian Institute of Technology, Kharagpur Lecture - 34 Combined Stresses I Welcome to the first lesson of the eighth module
Strength of Materials Prof. S. K. Bhattacharyya Department of Civil Engineering Indian Institute of Technology, Kharagpur Lecture - 34 Combined Stresses I Welcome to the first lesson of the eighth module
PES Institute of Technology
 PES Institute of Technology Bangalore south campus, Bangalore-5460100 Department of Mechanical Engineering Faculty name : Madhu M Date: 29/06/2012 SEM : 3 rd A SEC Subject : MECHANICS OF MATERIALS Subject
AXIAL COLLAPSE OF REINFORCED CONCRETE COLUMNS
 3 th World Conference on Earthquake Engineering Vancouver, B.C., Canada August -6, 4 Paper No. 699 AXIAL COLLAPSE OF REINFORCED CONCRETE COLUMNS Manabu YOSHIMURA, Yoshikazu TAKAINE and Takaya NAKAMURA
Structural Analysis Laboratory. Michael Storaker, Sam Davey and Rhys Witt. JEE 332 Structural Analysis. 4 June 2012.
 Structural Analysis Laboratory Michael Storaker, Sam Davey and Rhys Witt JEE 332 Structural Analysis 4 June 2012 Lecturer/Tutor Shinsuke Matsuarbara 1 Contents Statically Indeterminate Structure Objective...
Chapter 12 Static Equilibrium; Elasticity and Fracture
 2009 Pearson Education, Inc. This work is protected by United States copyright laws and is provided solely for the use of instructors in teaching their courses and assessing student learning. Dissemination
Part 1 is to be completed without notes, beam tables or a calculator. DO NOT turn Part 2 over until you have completed and turned in Part 1.
 NAME CM 3505 Fall 06 Test 2 Part 1 is to be completed without notes, beam tables or a calculator. Part 2 is to be completed after turning in Part 1. DO NOT turn Part 2 over until you have completed and
Design of Reinforced Concrete Beam for Shear
 Lecture 06 Design of Reinforced Concrete Beam for Shear By: Civil Engineering Department UET Peshawar drqaisarali@uetpeshawar.edu.pk Topics Addressed Shear Stresses in Rectangular Beams Diagonal Tension
SECTION 7 DESIGN OF COMPRESSION MEMBERS
 SECTION 7 DESIGN OF COMPRESSION MEMBERS 1 INTRODUCTION TO COLUMN BUCKLING Introduction Elastic buckling of an ideal column Strength curve for an ideal column Strength of practical column Concepts of effective
Civil Engineering Design (1) Design of Reinforced Concrete Columns 2006/7
 Design of Reinforced Concrete Columns 2006/7") Civil Engineering Design (1) Design of Reinforced Concrete Columns 2006/7 Dr. Colin Caprani, Chartered Engineer 1 Contents 1. Introduction... 3 1.1 Background... 3 1.2 Failure Modes... 5 1.3 Design Aspects...
Civil Engineering Design (1) Design of Reinforced Concrete Columns 2006/7 Dr. Colin Caprani, Chartered Engineer 1 Contents 1. Introduction... 3 1.1 Background... 3 1.2 Failure Modes... 5 1.3 Design Aspects...