H-C one-bond correlations: HSQC Preliminaries.
|
|
|
- Gavin Allen
- 6 years ago
- Views:
Transcription
1 A.- F. Miller 2010 C HSQC H-C one-bond correlations: HSQC Preliminaries. For both 1 H and C, you need a good power- pw90 pair and you should have good values for both sw and tof for both nuclei. In short, you should have a beautiful calibrated 1 H spectrum in one workspace (experiment) and beautiful calibrated C 1D conveniently loaded in another workspace. Having both these spectra loaded before you begin makes it easy to check on parameters you will need. A good way to keep track of these is to fill out a table such as the one below Nucleus power pw90 spectral width offset 1 H C ( tpwr) ( pw) ( sw) ( tof) ( pwxlvl) ( pwx) ( sw1) ( dof) Begin with your beautiful calibrated 1H 1D. The HSQC set up is based on the parameters of a beautiful 1 H 1D, so work in an experiment that has this spectrum in it. If you are using a spectrum collected on another day, it is a good precaution to reacquire it immediately before beginning the HSQC. If the pw90 is in doubt, re- determine it (30 sec!). (Also load a C spectrum of your sample in another workspace, for reference.) After phasing up your beautiful 1D type crof2 (on Thing2 or Thing1) or setlp0 (Gort) to cause the software to recalculate a short delay prior to the start of data acquisition, so as to preclude the need for any lp (lp becomes zero and all your signals should have the same phase.) Under 'Experiments' choose 'Convert current parameters to do... > Indirect Het. Corr. (Basic) > Gradient HSQC (Figure 1). The pulse sequence contains a number of familiar motifs. It begins with our gradient- 90- gradient pre- sequence to prevent any left- over magnetization from carrying over from the preceding scan. Next is a TANGO module that will prevent 1 H attached to 12 C from contributing to the final spectrum (check- box in Acquire>Pulse Sequence). This eliminates artifacts that would appear to have a C frequency of zero, because 12 C has no magnetic moment (Larmor frequency is zero). [3] is the excitation pulse. 1 H magnetization is the starting point for an HSQC. Next we have a spin echo [4], note the matched delays on either side of 180 pulses. The delay is set to 1/4J, where J is the one- bond H- C coupling (for aliphatic CH, 1 JHC 146 Hz, 1/584 =.0017 s). If you wanted to optimize the spectrum for other H- C pairs, you would modify this delay. For example aromatic CH groups have J 170 Hz and the best delay would be 1/680 =.0015 s.). Instead of typing in the delay, we provide the J- coupling constant (see Acquire>PulseSequence, below). The fact that both channels have simultaneous 180 pulses means that this spin echo is accruing J- 1
2 A.- F. Miller 2010 C HSQC coupling between C and H (and 1 H chemical shift evolution is refocussed to a total of zero for this time interval). Next there are 90 pulses on both 1 H and C that transfer magnetization from H to C [5]. After that we have d2, the indirect chemical shift detection delay (also called t1) during which the C chemical shift is encoded into amplitude [6]. You will notice a 180 pulse on 1 H in the centre of this interval to refocus J- coupling to 1 H and produce un- split C lines. Then there is a module that looks like a spin- echo [7] and serves to make the sign of CH2 groups opposite to that of CH groups and CH3 groups. Finally, another pair of 90 pulses returns magnetization from C back to 1 H for detection [8]. The last item is a gradient [9] that rephases magnetization that was dephased when it was on C. This ensures that only magnetization that spent time on C but ends up on 1 H will contribute to the spectrum. This filter results in a very clean baseline and substantially eliminates solvent, and thus any need for lots of phase cycling. The only reason to collect a lot of scans is if your 1 H signal is weak. In Acquire>Parameters (Figure 2), note that the 1 H sw and tof are preserved from your beautiful 1D, as are the 1 H pw90 [3] and power [4]. However information for the C is drawn from saved probe parameters, and is not necessarily applicable if you have a solvent other than the one used to calibrate the probe. You might need to replace the C pw90 [5] and the corresponding C power [6]. Go to your beautiful calibrated C 1D and note the pw90 and power. Enter these in locations [5] and [6]. Alternately, if you want to use the command line, these values will respectively become the pwx, pwxlvl (pulse width for nucleus X (not H), power level for that pulse). Note that the tof you chose for a full C 1D may have been chosen to include signals from carboxylates, carbonyls and C sites that do not have an attached H but do have extreme chemical shifts. However the HSQC spectrum can only detect C atoms that have an H attached, so the foregoing C sites in addition to any quaternary Cs will not appear, and we do not need the chemical shift range to accommodate them. The default C spectral width and centre frequency (sw1 and dof) are values that anticipate the normal chemical shift range for H- bearing Cs, and they will almost always be fine. However in case you have a special sample (eg containg F substituents, metal ions... ) you may take a more active role in determining your C spectral width. When in doubt, collect the entire width you saw in your beautiful C 1D. From the beautiful C 1D note the offset (tof = carrier frequency) and spectral width sw. Enter the C offset in [7] ('X offset'). This acquires the parameter name dof, decoupler offset (the second channel retains its traditional name of decoupler). (The C spectral width will be entered in Acquire>Acquisition, below). This is also where the C decoupling is set up. The W40_ATB_P0 composite pulse decoupling sequence uses the C pw90 to calculate pulse widths and allows the use of a very modest power for decoupling (35). To set up your spectral widths you have to go to Acquire>Acquisition (Figure 3). In The C spectral width is entered under F1 Spectral Width (sw1) and the 1 H sw is 2
3 A.- F. Miller 2010 C HSQC entered under F2.. This is also where you choose ni (the number of increments) [3]. Here you confront the resolution issue for your C dimension. The default value of 128 produces a C resolution of 155 Hz per point (for my sw1). This sounds lousy. However this 1.54 ppm resolution is likely comparable to the separation between peaks. Look at your beautiful C 1D and decide what resolution you need. Shoot for half or a quarter of that here, because you will be spreading signals out in a second dimension, and you will also be linear predicting. (i.e. if you have two peaks 2 Hz apart peak to peak, you really only need 2 Hz/point from your ni, not 1 Hz/points as you might think). For a real shock note that our sw1 and ni produce an at1 (acquisition time in the indirect dimension) of only 6 ms or 0.006!!! [4]. I doubled ni to 256. You have simpler molecules, so you may be fine with ni=128, many people are. The other resolution shocker is the 1 H at [5]. Contrary to my recommendation for COSY, TOCSY and NOESY, I do NOT recommend you double this. DO NOT. The reason is that during at we are decoupling C during 1 H acquisition. The wide sw1 of C means the probe is carrying a lot of power during at. We cannot afford for at to be long. Under Acquire>Pulse Sequence (Figure 4) you see a number of options. If the TANGO option is disabled then the sequence will not actively suppress 1 H attached to 12 C and you will have weak artifacts at correct 1 H frequencies that have apparently a C frequency of 0. (I recommend you run with TANGO active). Note that Figure 4 shows the pulse sequence when TANGO is inactivated, and the module number 2 shown in Figure 1 is now absent. This is also the panel where you input the 1 JHC coupling you want to exploit, and thereby determine the delays in your spin echos. The value shown [3] is the sum of the two delays, the total duration of the spin echo (=1/2J). Under X- multiplicity you have the option of XH/XH3 up and XH2 down (recommended) [4]. This will yield positive- amplitude peaks for C to which an odd number of Hs are attached. C bearing 2H will yield negative- amplitude peaks. This makes the HSQC much more valuable and can be very helpful in assigning spectra as it is not uncommon for a pair of geminal H to have very similar 1 H chemical shifts and therefore to fall together in the COSY and TOCSY. These cases are instantly identified in an HSQC that colour- codes peaks according to number of attached Hs. In Acquire>Acquisition, select 'Find Gain'. The spectrometer will go to a much higher gain than you had for the ordinary 1 H 1D. This is because the HSQC selects and detects only 1 H magnetization of 1 H bound to a C. This is only 1.1 % of the Cs. Even if a higher gain is recommended, I don't usually bother with gains above 30. Click on Show Time (Figure 5), modify the number of scans nt and/or ni (in Acquire> Aquisition) to reach a compromise between the quality of data and the time allowed. Click on Acquire to begin acquiring. Note that typing wft then dssa [3] gives you a preview of the 1Ds being collected. dssa(1,74,6) shows spectra 3
4 A.- F. Miller 2010 C HSQC from 1 to 74 showing every 6 th spectrum. We can see that signal amplitude is being modulated as the value of d2 is incremented. Given that you left Acquire>Future Actions set to execute the 'process' routine, the software will perform automatic processing when data collection ends. All you need to do is save (Figure 6). The 2D that results has two frequency axes. In the FIgure shown, the vertical one is the 1 H chemical shifts and the horizontal one has the chemical shifts of the C to which 12 H are attached [3] (in this case trace='f1' ). To make 1 H the horizontal axis type trace='f2' or go to the Process>Display panel to change the horizontal axis. Trick for a higher- resolution HSQC Regarding the C spectral width, many of the C signals may already be known to arise from C with no Hs. You see that if the full C SW is used for sw1 in the HSQC, there will be a lot of empty space. (Figure 7 shows the example of pulegone. Beware: the C axis is not calibrated in the figure: the chemical shifts are wrong. Instead, of using the full C 1D spectral width for your HSQC (using dof = and sw1 = for pugelone), you could collect an HSQC with a spectral width set only for the H- bearing Cs. Obtain a new C sw and tof by collecting second C 1D containing only Cs coupled to H. You can identify these Cs by collecting a full- width C with dm = 'yyn' (turn the decouping off). Set the cursors around the Cs that that show coupling to 1 H (compare with a standard decoupled C 1D). Click 'Move SW' and collect a new narrower C to serve as a high- resolution reference for a narrower HSQC (Figure 8). (For pugelone, I got tof= and sw= Hz. These then translate to dof and sw1 in the HSQC.) Whereas a full- width HSQC can devote a lot of data collection time to characterizing empty space (Figure 9), a sw1 set to the spectral region containing H- bearing Cs permits the use of a smaller ni to get the same resolution, and thus allows you to collect the HSQC in less time. Alternately, if you retain the same ni, the narrower HSQC will have higher resolution. (compare at1.) Gourmet Processing Each of the F1 and F2 dimensions could need linear prediction, weighting and phasing, in that order. However we usually phase both dimensions at the very end after obtaining a 2D. Moreover the F2 dimension rarely requires linear prediction. Thus, the procedure is - 1- weighting in F2, - 2- weighting in F1, - 3- Linear prediction in F1, - 4- phasing in F1 (if needed), - 5- phasing in F2 (if needed). For the HSQC, phase corrections are usually small. 1- weighting in F2 In Process > Weighting, click 'FT 1D - 1st Increment'. The phasing SHOULD be 90 off. Leave it and phase if necessary on the 2D. (Figure 10). 4
5 A.- F. Miller 2010 C HSQC Go to the right- hand side of this panel by sliding the slider to the right (Figure 11), Click on 'Interactive Weighting' to produce the three panels and click with the middle mouse in the bottom panel to reveal the FID [3]. Because I have strong data right to the end of the at, I chose a squared sine- bell [4] under F2, because this is the directly- detected FID [5]. The squared sine- bell collects more of the late- time data than a Gaussian does. The minus sign ahead of the sinebell number [4] makes is a sine 2 function whereas a positive value would simply be a sine function. Shifting it by the same value [6] as the sine value (always with a negative sign on the shift) produces the cosine function in the example. The cosine function begins with a value of Cos(0) = 1 [7] (A sine function begins with a value of sin(0) = 0). Next, click on 'Transform F2' (back on the left- side of the panel) (Figure 12 ). 2- weighting in F1 Click in the graphical display window with the middle mouse to reveal the data. You can see the intensities oscillating as a function of t1, for example at 4.5 ppm. Place the cursor on one of the streaks, and click on 'Interactive Weighting' [3] (right hand side of panel). In the resulting display (Figure ), click in the lower panel with the middle mouse to reveal the interferrogram. (You may have to click several times, and click well above the green horizontal line.) The suggested Gaussian fits my data nicely assuming that the length of the FID will be doubled by linear prediction. If you want to alter the weighting function, choose different functions by activation the corresponding boxes under F1, click 'Interactive Weighting' again and then click in the middle panel [ to modify the duration of your chosen function. 3- Linear prediction in F1 Given that we have doubled ni (Figure 3), we also need to alter the linear prediction parameters that apply to F1. In Process>More 2D (Figure 14) under F1 enter the value we used as ni as the number of basis points, the number of actual data points to be used as the basis for linear prediction. Also enter the same number as starting point in order to use all the ni data points you collected. To double the data set size we will want to add one ni more predicted points [3]. The first predicted point will be point number ni+1 [4] because you already have ni actual data, and we want to add the predicted data right after that. (In the example, you see that my value of ni is 256.) Now that you wil have a total of 512 points as input to the Fourier transform, make the size of the Fourier transform at least twice as large (1k = 1024 points) [5]. In this example the choice of an F2 Fourier transform size of 1k is on the small side, I would use 2k (=2048 points) to allow for doubling in F2 as well, with a room to spare [6]. For perspective, Agilent's default parameters assume 128 complex points and add 384 more (quadrupling the data). I am not quite that aggressive, but our data was good enough that we could have tripled it, adding 512 points instead of 256, if we had wanted to. Agilent assumes 4 signals per row whereas I assumed 8 [7]. 5
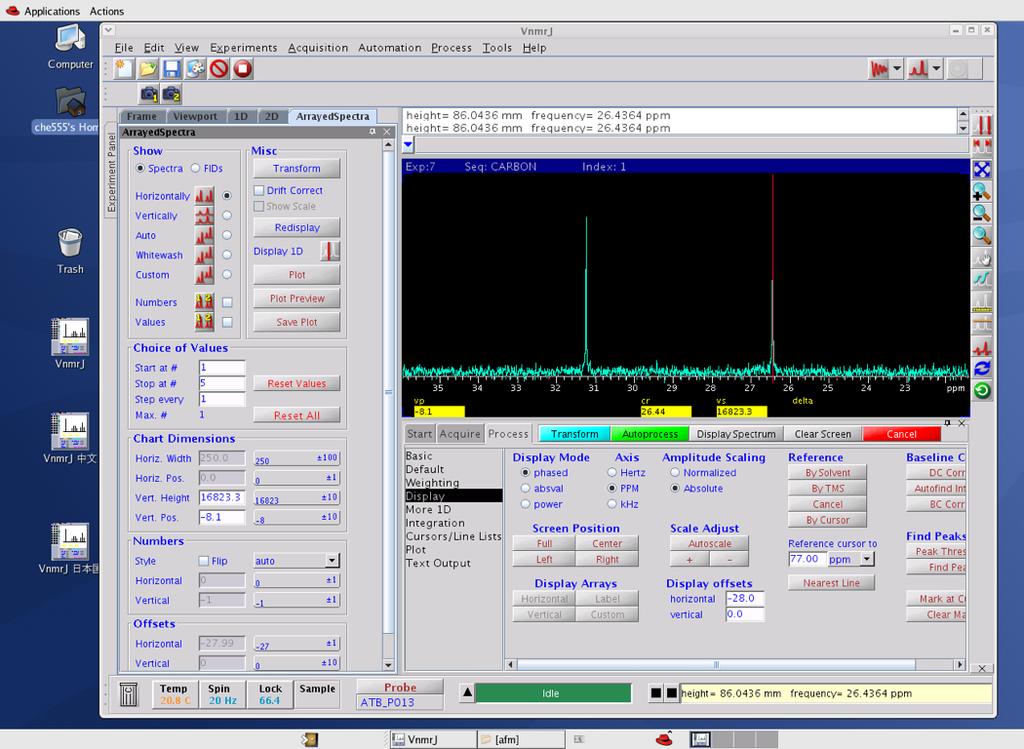
6 A.- F. Miller 2010 C HSQC With these adjustments made, click on 'Full 2D Transform' [8].. You will probably need to use the middle mouse again to make the vertical scale of your 2D (vs2d) smaller in order to not be looking at the noise floor. Alternately, you can type vs2d=2000, or another value, or type vs2d=vs2d/2 to make the vertical scale half as tall. (Figure 15 ) Figure 15 shows a very nice spectrum. You can see that the peaks identified as quaternary C by the DEPT are indeed absent from the HSQC, as expected since HSQC only detects C via bound 1 H. (Multiple bond experiments such as HMBC or CIGAR will reveal C two bonds from H). If phase correction is necessary, proceed as for TOCSY, selecting red peaks (positive amplitude). referencing the spectrum For 1D spectra, we reference the - C and 1H axes vs. internal TMS ideally, or vs. solvent if no TMS can be seen. However the HSQC spectrum will not likely contain a resonance from TMS. The 1 H calibration should carry over from your beautiful calibrated 1D. To transfer your C calibration to the HSQC, go to your referenced C1D (loaded in another workspace, Figure 16) and locate a line that is well separated from its neighbours and can easily be recognized by its context. Put the cursor on it and note the value cr at the bottom of the screen (use the nearest line button to get the cursor right on the highest point of the line). Return to the workspace containing your HSQC experiment (Figure 17) and place cursors around the corresponding resonance and zoom in to make it easier to put your cursor on the exact centre of the peak as far as the C axis is concerned (the horizontal axis here ). then type rl1(26.44d) where is the chemical shift of that line, based on the calibrated C 1D, the 'd' specifies that the instrument is to use the MHz frequency of the second channel (the X- channel) to convert frequencies to ppm, and the rl1 means reference line on F1 axis. Display the spectrum one more time to confirm that the C axis is correctly adjusted. In the event that your 1 H chemical shifts in the HSQC do not match those of the 1 H1D, and the 1 H1D is properly referenced vs. TMS, use the 1 H1D to reference the chemical shift axis of the HSQC by an analogous procedure to the one described above for C. Go to your referenced 1 H1D loaded in another workspace, identify a well isolated and recognizable line, zoom in on it and put the cursor on its centre (Figure 18). Note the value of cr. Now return to the workspace containing your HSQC, zoom in on the corresponding resonance (Figure 19) and place your cursor so that it lies right across the centre of the peak as far as the 1 H axis is concerned (vertical axis). Type rl(5.95p) for 6
7 A.- F. Miller 2010 C HSQC reference line 5.95 ppm. Click 'Display Spectrum' and confirm that the chemical shift axes are now correctly positioned with respect to the resonances. After clicking on the 'Full Spectrum' icon to see the whole HSQC (Figure 20) you can go to the '2D' tab on the left- hand side and activate the 'Print Screen' to save pdf or ps files of your spectrum. See the earlier notes regarding editing display parameters to get a white background etc. Be SURE to return all settings to the state in which you found them. Figure 21 compares the results obtained without the tango presequence and with it, for a strong sample (EMD). Figure 22 shows a sample figure I assembled by hand from a.ps file of my HSQC and files of the two corresponding high- resolution 1Ds. Agilent's software will also do this for you (more later...). 7
8 [3] [4] [5] [6] [7] [8] [9] 1 [5] [6] [7] 2 [3] [4]
9 3 [3] [4] [5] 4 [3] [4]
10 During acquisition of the 2D 5 [3] 6 [3]
11 7 8
12 9 10
13 11 [3] [4] [5] [6] [7] 12 [3]
![[3] [4] 14 [3]](/docs-images/72/67441056/images/14-1.jpg "[4] [5] [6] [8]")
14 [3] [4] 14 [3] [4] [5] [6] [8] [7]

15 15 16 Screen_Ccr
16 17 18


17 19 20
18 No tango 21 Tango 22
H-C one-bond correlations: HSQC Preliminaries.
 A. F. Miller 2010 C HSQC H-C one-bond correlations: HSQC Preliminaries. For both 1 H and C, you need a good power pw90 pair and you should have good values for both sw and tof for both nuclei. In short,
Once again, a good way to keep track of these is to fill out the table below: Nucleus power pw90 spectral width offset
 A. F. Miller 2010 C HMBC (CIGAR) H-C multiple-bond correlations: HMBC The HSQC is a high sensitivity way to observe Cs that have an attached H, get the chemical shifts of each, and know which Hs are attached
Collecting the data. A.- F. Miller 2012 DQF- COSY Demo 1
 A.- F. Miller 2012 DQF- COSY Demo 1 gradient Double-Quantum-Filtered COSY (gdqf-cosy) This spectrum produces cross peaks exclusively between 1 Hs that are connected through bonds, usually 3 or less. (Exceptions
Determining C-H Connectivity: ghmqc and ghmbc (VnmrJ-2.2D Version: For use with the new Software)
") Determining C-H Connectivity: ghmqc and ghmbc (VnmrJ-2.2D Version: For use with the new Software) Heteronuclear Multiple Quantum Coherence (HMQC) and Heteronuclear Multiple Bond Coherence (HMBC) are 2-dimensional
Determining C-H Connectivity: ghmqc and ghmbc (VnmrJ-2.2D Version: For use with the new Software) Heteronuclear Multiple Quantum Coherence (HMQC) and Heteronuclear Multiple Bond Coherence (HMBC) are 2-dimensional
SSSC Discovery Series NMR2 Multidimensional NMR Spectroscopy
 SSSC Discovery Series NMR2 Multidimensional NMR Spectroscopy Topics: 1. Some Common Experiments 2. Anatomy of a 2D experiment 3. 3D NMR spectroscopy no quantum mechanics! Some Common 2D Experiments Very
Login -the operator screen should be in view when you first sit down at the spectrometer console:
 Lab #2 1D 1 H Double Resonance (Selective Decoupling) operation of the 400 MHz instrument using automated sample insertion (robot) and automated locking and shimming collection of 1D 1 H spectra retrieving
Chemistry Department
 Chemistry Department NMR/Instrumentation Facility Users Guide - VNMRJ Prepared by Leila Maurmann The following procedures should be used to acquire one-dimensional proton and carbon NMR data on the 400MHz
North Carolina State University Department of Chemistry Varian NMR Training Manual
 North Carolina State University Department of Chemistry Varian NMR Training Manual by J.B. Clark IV & Dr. S. Sankar 1 st Edition 05/15/2009 Section 3: Glide Program Operations for Advanced 1D & 2D Spectra
HMQC HSQC and HMBC. Gradient HMQC, HMBC on the Bruker400 and 500
 1 Gradient HMQC, HMBC on the Bruker400 and 500 HMQC, HSQC - Heteronuclear Multiple Quantum Correlation. These experiments correlate the chemical shift of proton with the chemical shift of the directly
Band-Selective Homonuclear 2D Correlation Experiments
 Band-Selective Homonuclear 2D Correlation Experiments Application Note Authors Péter Sándor Agilent Technologies GmbH D76337 Waldbronn Germany Abstract This application note demonstrates the utility of
How to perform 2D NMR Experiments on the Varian/Agilent VNMRS 500 when using the Chempack interface
 How to perform 2D NMR Experiments on the Varian/Agilent VNMRS 500 when using the Chempack interface 1 June 3, 2014 To start: 1. Insert your sample 2. If running any 2D spectrum or even just a 1D 13 C spectrum
Carbon and Heteronuclear NMR on the Bruker
 Carbon and Heteronuclear NMR on the Bruker There are several different types of carbon spectra such as a normal qualitative spectrum, DEPT, coupled, and those with and without NOE. This handout discusses
Nuclear Magnetic Resonance
 Nuclear Magnetic Resonance Most of you should have learned about NMR in your organic course. Just to underscore that learning, let me say that NMR is arguably the best technique we have for characterizing
NMR TRAINING. What to Cover
 NMR TRAINING MULTI-DIMENSIONAL EXPERIMENTS What to Cover Introducing a second dimension COSY, NOESY, TOCSY, SQC, MBC D Processing Proton T1/T measurement, Diffusion measurement Spectrometer Preparation
Ultra-high Resolution in Low Field Tabletop NMR Spectrometers
 Electronic Supplementary Material (ESI) for RSC Advances. This journal is The Royal Society of Chemistry 2017 Supporting Information Ultra-high Resolution in Low Field Tabletop NMR Spectrometers Experimental
Operation of the Bruker 400 JB Stothers NMR Facility Department of Chemistry Western University
 Operation of the Bruker 400 JB Stothers NMR Facility Department of Chemistry Western University 1. INTRODUCTION...3 1.1. Overview of the Bruker 400 NMR Spectrometer...3 1.2. Overview of Software... 3 1.2.1.
Cungen Zhang. NOESY experiment. noesy 90. at, t2. mix
 NOESY experiment 90 noesy 90 90 Cungen Zhang at, t2 d1 t1 mix Nuclear Overhauser Effect SpectroscopY is a 2D spectroscopy method whose aim is to identify spins undergoing cross-relaxation and to measure
1H 1D-NOE Difference Spectra and Spin-Saturation Transfer Experiments on the GN500
 UGN526 VVM-21JUN88CD VVM-31OCT91UD 1H 1D-NOE Difference Spectra and Spin-Saturation Transfer Experiments on the GN500 Double-resonance experiments are techniques which use a second irradiating field (B
NMR Data workup using NUTS
 omework 1 Chem 636, Fall 2008 due at the beginning of the 2 nd week lab (week of Sept 9) NMR Data workup using NUTS This laboratory and homework introduces the basic processing of one dimensional NMR data
Simulation of Second Order Spectra Using SpinWorks. CHEM/BCMB 8190 Biomolecular NMR UGA, Spring, 2005
 Simulation of Second Order Spectra Using SpinWorks CHEM/BCMB 8190 Biomolecular NMR UGA, Spring, 2005 Introduction Although we frequently assume that scalar couplings are small compared to the differences
Determining Chemical Structures with NMR Spectroscopy the ADEQUATEAD Experiment
 Determining Chemical Structures with NMR Spectroscopy the ADEQUATEAD Experiment Application Note Author Paul A. Keifer, Ph.D. NMR Applications Scientist Agilent Technologies, Inc. Santa Clara, CA USA Abstract
BASIC NMR HANDBOOK Written by M. A. Eastman Copyright 1997, 2001, 2013, 2015, 2018
 BASIC NMR HANDBOOK Written by M. A. Eastman Copyright 1997, 2001, 2013, 2015, 2018 Basic NMR Handbook Table of Contents: Preface ii viii PART 1 Chapter 1: Introduction to NMR 1 Why Study NMR? 1 The Magnetic
Non Uniform Sampling in Routine 2D Correlation Experiments
 Analytical and Imaging Solutions for Advanced R&D Non Uniform Sampling in Routine 2D Correlation Experiments NUCLEAR MAGNETIC RESONANCE INTRODUCTION Data obtained from two-dimensional NMR experiments is
Basic One- and Two-Dimensional NMR Spectroscopy
 Horst Friebolin Basic One- and Two-Dimensional NMR Spectroscopy Third Revised Edition Translated by Jack K. Becconsall WILEY-VCH Weinheim New York Chichester Brisbane Singapore Toronto Contents XV 1 The
Agilent MassHunter Quantitative Data Analysis
 Agilent MassHunter Quantitative Data Analysis Presenters: Howard Sanford Stephen Harnos MassHunter Quantitation: Batch Table, Compound Information Setup, Calibration Curve and Globals Settings 1 MassHunter
Nuclear magnetic resonance spectroscopy II. 13 C NMR. Reading: Pavia Chapter , 6.7, 6.11, 6.13
 Nuclear magnetic resonance spectroscopy II. 13 NMR Reading: Pavia hapter 6.1-6.5, 6.7, 6.11, 6.13 1. General - more/better/additional structural information for larger compounds -problems: a) isotopes
NMR PRAKTIKUM. Data processing Data acquisition... 17
 NMR PRAKTIKUM 1. INTRODUCTION... 2 1.1. Description of a Spectrometer... 2 1.2. Principle of a NMR Experiment... 4 1.2.1. 1D NMR experiment... 4 1.2.2. 2D NMR experiment... 5 2. PRACTICAL PART... 8 2.1.
High-Resolutio n NMR Techniques i n Organic Chemistry TIMOTHY D W CLARIDGE
 High-Resolutio n NMR Techniques i n Organic Chemistry TIMOTHY D W CLARIDGE Foreword Preface Acknowledgements V VI I X Chapter 1. Introduction 1.1. The development of high-resolution NMR 1 1.2. Modern
Two Dimensional (2D) NMR Spectroscopy
 NMR Spectroscopy") The two important parameters obtained from NMR spectra are; Two Dimensional (2D) NMR Spectroscopy py Correlation NMR a. Chemical shift b. Spin-spin coupling constant Large molecules with numerous atoms
The two important parameters obtained from NMR spectra are; Two Dimensional (2D) NMR Spectroscopy py Correlation NMR a. Chemical shift b. Spin-spin coupling constant Large molecules with numerous atoms
NMR Predictor. Introduction
 NMR Predictor This manual gives a walk-through on how to use the NMR Predictor: Introduction NMR Predictor QuickHelp NMR Predictor Overview Chemical features GUI features Usage Menu system File menu Edit
PROTEIN NMR SPECTROSCOPY
 List of Figures List of Tables xvii xxvi 1. NMR SPECTROSCOPY 1 1.1 Introduction to NMR Spectroscopy 2 1.2 One Dimensional NMR Spectroscopy 3 1.2.1 Classical Description of NMR Spectroscopy 3 1.2.2 Nuclear
Agilent s new solution for obtaining routinely quantitative results from NMR measurements. Magnetic Resonance Systems
 Agilent s new solution for obtaining routinely quantitative results from NMR measurements. 1 Magnetic Resonance Systems The Scope of Analytical Chemistry Analytical Chemistry is the study of the separation,
Tools for Structure Elucidation
 Innovation with Integrity Tools for Structure Elucidation Sandra Groscurth Workflow in Natural Product Research Organism Natural Products Extraction Activity Assay Characterization of Unknown Structures
NMR: PRACTICAL ASPECTS
 NMR: PRACTICAL ASPECTS Pedro M. Aguiar Sample Preparation Well prepared sample can yield high quality spectra Poorly prepared sample typically yields low quality spectra Tubes of appropriate quality Higher
ONE AND TWO DIMENSIONAL NMR SPECTROSCOPY
 ONE AND TWO DIMENSIONAL NMR SPECTROSCOPY Atta-ur-Rahman H.E.J. Research Institute of Chemistry, University ofkarachi, Karachi 32, Pakistan ELSEVIER Amsterdam Oxford New York Tokyo 1989 IX CONTENTS Chapter-l
5 Heteronuclear Correlation Spectroscopy
 61 5 Heteronuclear Correlation Spectroscopy H,C-COSY We will generally discuss heteronuclear correlation spectroscopy for X = 13 C (in natural abundance!), since this is by far the most widely used application.
X-Nucleus NMR: 31 P and 19 F
 Chem 636, Fall 2008 HW #9 Due at the beginning of lab, the week of Oct 28 (cgf: updated 12 July 2010) X-ucleus MR: 31 P and 19 F Many nuclei in MR can be detected in a manner similar to 13 C. 31 P and
NMR FACILITY NEWSLETTER
 NMR Newsletter NMR FACILITY NEWSLETTER Department of Chemistry and Biochemistry Matt Revington-Facility Coordinator mrevingt@uwindsor.ca Ext 3997 500 MHz NMR upgraded The 500 MHz NMR has received a $250,000
It is possible to choose the temperature for each experiment by setting a temperature under the Temp pane (under the Standard panel).
.") 1 2 The study queue gives a lot of flexibility for lining up experiments: they can be run at different temperatures or at different times. You must respect the instrument limits: do not submit experiments
1 2 The study queue gives a lot of flexibility for lining up experiments: they can be run at different temperatures or at different times. You must respect the instrument limits: do not submit experiments
τ 1 > 1/J - if this lifetime is significantly shortened, the coupling (splitting of the signal) will not be observed
 will not be observed") It is often advantageous to reverse or remove the splitting caused by spin-spin coupling This is called spin decoupling Spin decoupling (or just decoupling) can be used for several reasons - to simplify
It is often advantageous to reverse or remove the splitting caused by spin-spin coupling This is called spin decoupling Spin decoupling (or just decoupling) can be used for several reasons - to simplify
Relaxation, Multi pulse Experiments and 2D NMR
 Relaxation, Multi pulse Experiments and 2D NMR To Do s Read Chapter 6 Complete the end of chapter problems; 6 1, 6 2, 6 3, 6 5, 6 9 and 6 10. Read Chapter 15 and do as many problems as you can. Relaxation
2D NMR: HMBC Assignments and Publishing NMR Data Using MNova
 Homework 10 Chem 636, Fall 2014 due at the beginning of lab Nov 18-20 updated 10 Nov 2014 (cgf) 2D NMR: HMBC Assignments and Publishing NMR Data Using MNova Use Artemis (Av-400) or Callisto (Av-500) for
Pulsar. Delivering NMR to your benchtop
 Pulsar NMR Delivering NMR to your benchtop Pulsar TM NMR for your laboratory The Pulsar TM NMR spectrometer from Oxford Instruments delivers affordable, high performance NMR spectroscopy into the laboratory
NMR at UNC: Tips, Tricks, and Techniques
 NMR at UNC: Tips, Tricks, and Techniques Laura Adduci UNC-Chapel Hill Graduate student Gagné Lab NMR Assistant Chemistry Department Topics and Examples 1. 2D spectra 2. Selective 1D spectra 3. Homonuclear
CHEM / BCMB 4190/6190/8189. Introductory NMR. Lecture 10
 CHEM / BCMB 490/690/889 Introductory NMR Lecture 0 - - CHEM 490/690 Spin-Echo The spin-echo pulse sequence: 90 - τ - 80 - τ(echo) Spins echoes are widely used as part of larger pulse sequence to refocus
Homonuclear Broadband Decoupling via PSYCHE Element Benjamin Görling, Aitor Moreno, Wolfgang Bermel
 Homonuclear Broadband Decoupling via PSYCHE Element Benjamin Görling, Aitor Moreno, Wolfgang Bermel Bruker BioSpin GmbH Homonuclear broadband decoupling of proton spectra is a challenging task since standard
NMR Spectroscopy Laboratory Experiment Introduction. 2. Theory
 1. Introduction 64-311 Laboratory Experiment 11 NMR Spectroscopy Nuclear Magnetic Resonance (NMR) spectroscopy is a powerful and theoretically complex analytical tool. This experiment will introduce to
UI500NB Spectrometer: Advanced 1D and 2D NMR Experiments With Application to Structure Elucidation of Small Organic Molecules
 Revised 29 Feb 2016; LZ and DLO UI500NB Spectrometer: Advanced 1D and 2D NMR Experiments With Application to Structure Elucidation of Small Organic Molecules You should finish basic NMR training with NMR
APPENDIX 1 Version of 8/24/05 11:01 AM Simulation of H-NMR without a structure*:
 WARNING NOTICE: The experiments described in these materials are potentially hazardous and require a high level of safety training, special facilities and equipment, and supervision by appropriate individuals.
Experiment 4: Equilibrium Thermodynamics of a Keto-Enol Tautomerism Reaction
 Experiment 4: Equilibrium Thermodynamics of a Keto-Enol Tautomerism Reaction Reading: SGN: Experiment 21 (p.256-263), Experiment 43 (p.456-459). Quanta: Nuclear magnetic resonance, Relaxation All reactions
Laboration 8a. Relaxation, T 1 -measurement with inversion recovery
 , T 1 -measurement with inversion recovery KR Theory The way the magnetizations returns to equilibrium, relaxation, is a very important concept in NMR, for example, due to the fact that the rate of relaxation
NMR NEWS June To find tutorials, links and more, visit our website
 Department of Chemistry NMR Facilities Director: Dr. Carlos A. Steren NMR NEWS June 2014 To find tutorials, links and more, visit our website www.chem.utk.edu/facilities/nmr Computers and software updates
Supplementary Information. Figure S1. 1 H NMR (600 MHz, CDCl 3 ) of 1.
 of 1.") Supplementary Information Figure S1. 1 H NMR (600 MHz, CDCl 3 ) of 1. Mar. Drugs 2014, 12 2 Figure S2. 13 C NMR (125 MHz, CDCl 3 ) of 1. Mar. Drugs 2014, 12 3 Figure S3. gcosy (600 MHz, CDCl 3 ) of 1.
Supplementary Information Figure S1. 1 H NMR (600 MHz, CDCl 3 ) of 1. Mar. Drugs 2014, 12 2 Figure S2. 13 C NMR (125 MHz, CDCl 3 ) of 1. Mar. Drugs 2014, 12 3 Figure S3. gcosy (600 MHz, CDCl 3 ) of 1.
NMR spectra of some simple molecules. Effect of spinning: averaging field inhomogeneity (nmr1.pdf pg 2)
") NMR spectra of some simple molecules Effect of spinning: averaging field inhomogeneity (nmr1.pdf pg 2) N S H 0 H o Because the protons have a magnetic field associated with them, the field changes as across
NMR spectra of some simple molecules Effect of spinning: averaging field inhomogeneity (nmr1.pdf pg 2) N S H 0 H o Because the protons have a magnetic field associated with them, the field changes as across
Electric Fields and Equipotentials
 OBJECTIVE Electric Fields and Equipotentials To study and describe the two-dimensional electric field. To map the location of the equipotential surfaces around charged electrodes. To study the relationship
CHARTING THE HEAVENS USING A VIRTUAL PLANETARIUM
 Name Partner(s) Section Date CHARTING THE HEAVENS USING A VIRTUAL PLANETARIUM You have had the opportunity to look at two different tools to display the night sky, the celestial sphere and the star chart.
Table of Contents. Chapter 1 lntroduction and Practical Considerations of Two-Dimensional. Chapter 2 Establishing Proton-Proton Connectivities
 Table of Contents Chapter 1 lntroduction and Practical Considerations of Two-Dimensional NMR Spectroscopy lntroduction Fundamental Segments of Two-Dimensional NMR Experiments Preparation Evolution Mixing
StepNOESY Overcoming Spectral Overlap in NOESY1D
 StepNOESY Overcoming Spectral Overlap in NOESY1D Application Note Author David Russell NMR Applications Scientist Research Products Group Santa Clara, CA Abstract VnmrJ 3 software provides easy-to-use,
Zeeman Effect Physics 481
 Zeeman Effect Introduction You are familiar with Atomic Spectra, especially the H- atom energy spectrum. Atoms emit or absorb energies in packets, or quanta which are photons. The orbital motion of electrons
PAPER No. 12: ORGANIC SPECTROSCOPY. Module 19: NMR Spectroscopy of N, P and F-atoms
 Subject Chemistry Paper No and Title Module No and Title Module Tag Paper 12: Organic Spectroscopy CHE_P12_M19_e-Text TABLE OF CONTENTS 1. Learning Outcomes 2. 15 N NMR spectroscopy 3. 19 F NMR spectroscopy
Experiment P-5 Motion of a Cart on an Inclined Plane
 1 Experiment P-5 Motion of a Cart on an Inclined Plane Objectives To learn about the four motion equations. To study the motion of a cart on an inclined plane. To study motion with constant acceleration.
Homonuclear 2DJ spectroscopy - HOMO2DJ
 Homonuclear 2DJ spectroscop - HOMO2DJ All 2D eperiments we ve analzed so far are used to find out correlations or connections between spin sstems. There are man other things that we can etract from 2D
Jasco V-670 absorption spectrometer
 Laser Spectroscopy Labs Jasco V-670 absorption spectrometer Operation instructions 1. Turn ON the power switch on the right side of the spectrophotometer. It takes about 5 minutes for the light source
BCMB/CHEM 8190 Lab Exercise Using Maple for NMR Data Processing and Pulse Sequence Design March 2012
 BCMB/CHEM 8190 Lab Exercise Using Maple for NMR Data Processing and Pulse Sequence Design March 2012 Introduction Maple is a powerful collection of routines to aid in the solution of mathematical problems
Connect the Vernier spectrometer to your lap top computer and power the spectrometer if necessary. Start LoggerPro on your computer.
 Connect the Vernier spectrometer to your lap top computer and power the spectrometer if necessary. Start LoggerPro on your computer. The screen shown in Fig. 1 may be displayed. If status line displays
The Use of NMR Spectroscopy
 Spektroskopi Molekul Organik (SMO): Nuclear Magnetic Resonance (NMR) Spectroscopy All is adopted from McMurry s Organic Chemistry The Use of NMR Spectroscopy Used to determine relative location of atoms
Understanding Your Spectra Module. Agilent OpenLAB CDS ChemStation Edition
 Understanding Your Spectra Module Agilent OpenLAB CDS ChemStation Edition Notices Agilent Technologies, Inc. 1994-2012, 2013 No part of this manual may be reproduced in any form or by any means (including
4 Spin-echo, Spin-echo Double Resonance (SEDOR) and Rotational-echo Double Resonance (REDOR) applied on polymer blends
 and Rotational-echo Double Resonance (REDOR) applied on polymer blends") 4 Spin-echo, Spin-echo ouble Resonance (SEOR and Rotational-echo ouble Resonance (REOR applied on polymer blends The next logical step after analyzing and concluding upon the results of proton transversal
4 Spin-echo, Spin-echo ouble Resonance (SEOR and Rotational-echo ouble Resonance (REOR applied on polymer blends The next logical step after analyzing and concluding upon the results of proton transversal
New Approaches to the Development of GC/MS Selected Ion Monitoring Acquisition and Quantitation Methods Technique/Technology
 New Approaches to the Development of GC/MS Selected Ion Monitoring Acquisition and Quantitation Methods Technique/Technology Gas Chromatography/Mass Spectrometry Author Harry Prest 1601 California Avenue
Chem 325 NMR Intro. The Electromagnetic Spectrum. Physical properties, chemical properties, formulas Shedding real light on molecular structure:
 Physical properties, chemical properties, formulas Shedding real light on molecular structure: Wavelength Frequency ν Wavelength λ Frequency ν Velocity c = 2.998 10 8 m s -1 The Electromagnetic Spectrum
C NMR Spectroscopy
 13.14 13 C NMR Spectroscopy 1 H and 13 C NMR compared: both give us information about the number of chemically nonequivalent nuclei (nonequivalent hydrogens or nonequivalent carbons) both give us information
Experiment 10. Zeeman Effect. Introduction. Zeeman Effect Physics 244
 Experiment 10 Zeeman Effect Introduction You are familiar with Atomic Spectra, especially the H-atom energy spectrum. Atoms emit or absorb energies in packets, or quanta which are photons. The orbital
Kinematics Lab. 1 Introduction. 2 Equipment. 3 Procedures
 Kinematics Lab 1 Introduction An object moving in one dimension and undergoing constant or uniform acceleration has a position given by: x(t) =x 0 +v o t +1/2at 2 where x o is its initial position (its
NMR course at the FMP: NMR of organic compounds and small biomolecules - II -
 NMR course at the FMP: NMR of organic compounds and small biomolecules - II - 16.03.2009 The program 2/76 CW vs. FT NMR What is a pulse? Vectormodel Water-flip-back 3/76 CW vs. FT CW vs. FT 4/76 Two methods
Simple Harmonic Motion
 Introduction Simple Harmonic Motion The simple harmonic oscillator (a mass oscillating on a spring) is the most important system in physics. There are several reasons behind this remarkable claim: Any
IncuCyte ZOOM NeuroTrack Fluorescent Processing
 IncuCyte ZOOM NeuroTrack Fluorescent Processing The NeuroTrack TM Software Module (Cat No 9600-0011) is used to measure the processes of neurons in monoculture or with fluorescent labeling in co-culture.
Relaxation times in nuclear magnetic resonance
 Relaxation times in TEP Related topics Nuclear spins, atomic nuclei with a magnetic moment, precession movement of the nuclear spins, Landau-Lifshitz equation, Bloch equation, magnetisation, resonance
NMR Practical Considerations Gregory R. Cook, NDSU Monday, January 28, 13
 NMR Practical Considerations Sample Preparation Choose a high quality 5 mm NMR tube that is free of defects. Low quality tubes may be cause poor lineshape and difficulty in shimming Decide on sample amount
Z 2 (OMe) = Z 3 (Cl) = 1.4. Calculated: Measured: Deviation:
 = Z 3 (Cl) = 1.4. Calculated: Measured: Deviation:") Question 1. hemical Shifts & Increment Systems. (20 points) 13 -NMR of para-hloroanisol (from SDBS, requires the book by Pretsch et al.) The structure of para-chloroanisol is shown along with the atom
Question 1. hemical Shifts & Increment Systems. (20 points) 13 -NMR of para-hloroanisol (from SDBS, requires the book by Pretsch et al.) The structure of para-chloroanisol is shown along with the atom
Activity P11: Collision Impulse and Momentum (Force Sensor, Motion Sensor)
") Name Class Date Activity P11: Collision Impulse and Momentum (Force Sensor, Motion Sensor) Concept DataStudio ScienceWorkshop (Mac) ScienceWorkshop (Win) Newton s Laws P11 Impulse.DS P14 Collision P14_COLL.SWS
Name Class Date Activity P11: Collision Impulse and Momentum (Force Sensor, Motion Sensor) Concept DataStudio ScienceWorkshop (Mac) ScienceWorkshop (Win) Newton s Laws P11 Impulse.DS P14 Collision P14_COLL.SWS
Laboratory and Rotating frames
 Laborator and Rotating frames The coordinate sstem that we used for the previous eample (laborator frame) is reall pathetic. The whole sstem is spinning at ω o, which makes an kind of analsis impossible.
COSY type experiments exploring through-bond homonuclear correlations
 COSY type experiments exploring through-bond homonuclear correlations Assistant Professor Kenneth Kongstad Bioanalytical Chemistry and Metabolomics Research Group Section for Natural Products and Peptides
16.1 Introduction to NMR Spectroscopy. Spectroscopy. Spectroscopy. Spectroscopy. Spectroscopy. Spectroscopy 4/11/2013
 What is spectroscopy? NUCLEAR MAGNETIC RESONANCE (NMR) spectroscopy may be the most powerful method of gaining structural information about organic compounds. NMR involves an interaction between electromagnetic
Agilent All Ions MS/MS
 Agilent All Ions MS/MS Workflow Overview A Determine fragment ions for LC/MS Quant method B Develop final Quant method Develop LC/MS Qualitative Analysis method Process data with Find by Formula Build
Lab 1g: Horizontally Forced Pendulum & Chaotic Motion
 58:080 Experimental Engineering OBJECTIVE Lab 1g: Horizontally Forced Pendulum & Chaotic Motion The objective of this lab is to study horizontally forced oscillations of a pendulum. This will be done trough
Simple Harmonic Motion
 Physics Topics Simple Harmonic Motion If necessary, review the following topics and relevant textbook sections from Serway / Jewett Physics for Scientists and Engineers, 9th Ed. Hooke s Law (Serway, Sec.
ISIS/Draw "Quick Start"
 ISIS/Draw "Quick Start" Click to print, or click Drawing Molecules * Basic Strategy 5.1 * Drawing Structures with Template tools and template pages 5.2 * Drawing bonds and chains 5.3 * Drawing atoms 5.4
Lab 1: Intro to NMR. March 10, 2014
 Lab 1: Intro to NMR March 10, 2014 Christine Leon-Swisher (GSI), Miki Lustig (Prof) 1 Preliminaries Never bring anything metal into the room with an MRI (i.e. keys, metallic jewelry, chairs) Do not enter
4 DQF-COSY, Relayed-COSY, TOCSY Gerd Gemmecker, 1999
 44 4 DQF-COSY, Relayed-COSY, TOCSY Gerd Gemmecker, 1999 Double-quantum filtered COSY The phase problem of normal COSY can be circumvented by the DQF-COSY, using the MQC term generated by the second 90
Lasentec Product Group
 Document Number: 004-0043 Window Reference Procedure - M500/600 P Probes, version 6.0 and higher FBRM CI Software The Window Reference Procedure is the standard calibration procedure used to reference
NMR Thermometer. Variable Temperature Control Using the 2H Lock System of AVANCE III HD Spectrometers User Manual Version 002
 NMR Thermometer Variable Temperature Control Using the 2H Lock System of AVANCE III HD Spectrometers User Manual Version 002 Innovation with Integrity NMR Copyright by Bruker Corporation All rights reserved.
NMR = Nuclear Magnetic Resonance
 NMR = Nuclear Magnetic Resonance NMR spectroscopy is the most powerful technique available to organic chemists for determining molecular structures. Looks at nuclei with odd mass numbers or odd number
Assignment #0 Using Stellarium
 Name: Class: Date: Assignment #0 Using Stellarium The purpose of this exercise is to familiarize yourself with the Stellarium program and its many capabilities and features. Stellarium is a visually beautiful
Raman Spectroscopy of Liquids
 Chemistry 357 Spring 2013 Raman Spectroscopy of Liquids Lab TA: Paul Dent pwdent@syr.edu PURPOSE: You will investigate Raman light scattering of several different molecular liquids. You will also determine
Magnetic Resonance Imaging. Pål Erik Goa Associate Professor in Medical Imaging Dept. of Physics
 Magnetic Resonance Imaging Pål Erik Goa Associate Professor in Medical Imaging Dept. of Physics pal.e.goa@ntnu.no 1 Why MRI? X-ray/CT: Great for bone structures and high spatial resolution Not so great
Biochemistry 530 NMR Theory and Practice. Gabriele Varani Department of Biochemistry and Department of Chemistry University of Washington
 Biochemistry 530 NMR Theory and Practice Gabriele Varani Department of Biochemistry and Department of Chemistry University of Washington 1D spectra contain structural information.. but is hard to extract:
Quantification of JEOL XPS Spectra from SpecSurf
 Quantification of JEOL XPS Spectra from SpecSurf The quantification procedure used by the JEOL SpecSurf software involves modifying the Scofield cross-sections to account for both an energy dependency
J. Sauri, R.D. Cohen, Y. Liu, M. Reibarkh, A.V. Buevich, R.T. Williamson & G.E. Martin
 1,1-ADEQUATE Exclusively Affords 1 J CC Correlations 1 Bruker NMR User s Meeting SMASH 2016 Well Most of the Time! J. Sauri, R.D. Cohen, Y. Liu, M. Reibarkh, A.V. Buevich, R.T. Williamson & G.E. Martin
Information Dependent Acquisition (IDA) 1
 1") Information Dependent Acquisition (IDA) Information Dependent Acquisition (IDA) enables on the fly acquisition of MS/MS spectra during a chromatographic run. Analyst Software IDA is optimized to generate
Information Dependent Acquisition (IDA) Information Dependent Acquisition (IDA) enables on the fly acquisition of MS/MS spectra during a chromatographic run. Analyst Software IDA is optimized to generate
3D - Structure Graphics Capabilities with PDF-4 Database Products
 3D - Structure Graphics Capabilities with PDF-4 Database Products Atomic Structure Information in the PDF-4 Databases ICDD s PDF-4 databases contain atomic structure information for a significant number