It is possible to choose the temperature for each experiment by setting a temperature under the Temp pane (under the Standard panel).
|
|
|
- Ginger Maxwell
- 6 years ago
- Views:
Transcription
1 1
2 2
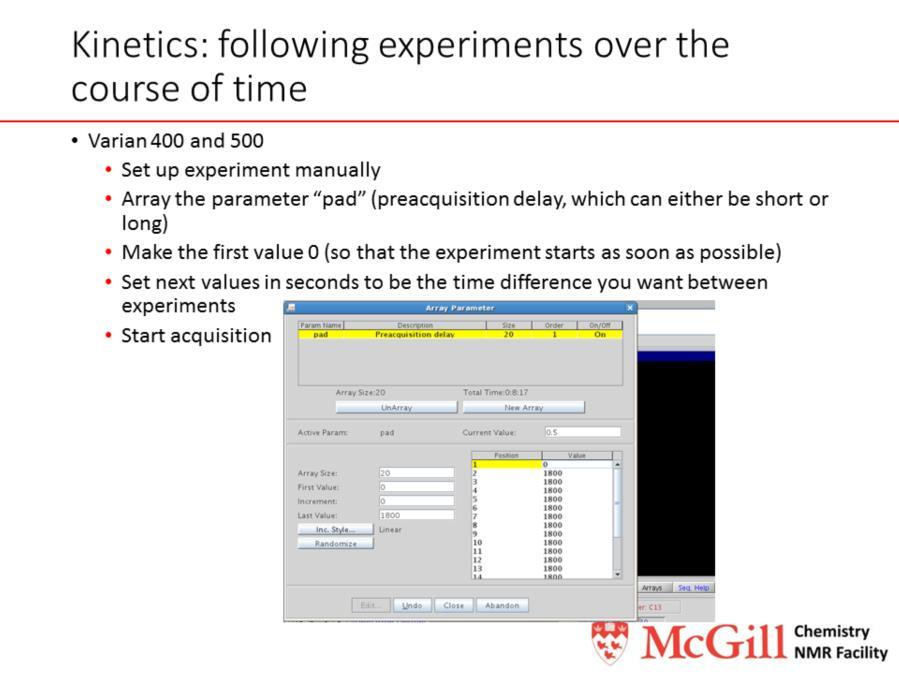
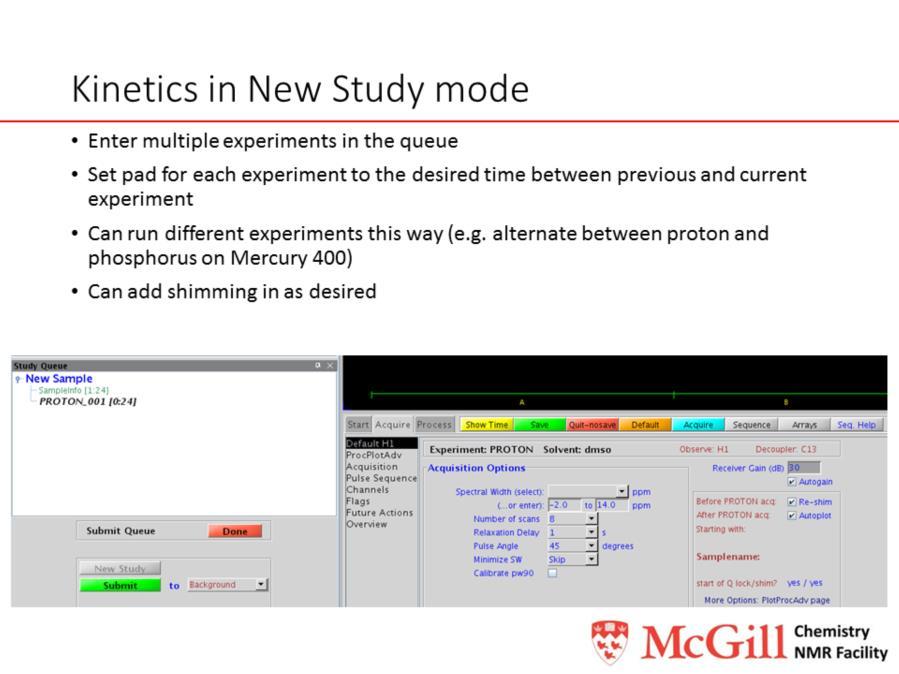
3 The study queue gives a lot of flexibility for lining up experiments: they can be run at different temperatures or at different times. You must respect the instrument limits: do not submit experiments for nuclei that the probe is not tuned to or which it cannot do. For example, on the 500, you cannot run fluorine without first manually tuning to it, so you cannot have a queue with both proton and fluorine experiments in it. The Varian 300, on the other hand, is always tuned to 1 H, 19 F, and 13 C. However, the Varian 300 has no VT controller, so you cannot submit VT experiments to it. It is possible to choose the temperature for each experiment by setting a temperature under the Temp pane (under the Standard panel). 3
 does not save the spectrum automatically. You must save it yourself! Or, you can start acquisition with the command run.")
4 Working manually in VnmrJ bypasses the occasional errors that occur with the Study Queue on the Varian 400 and 500. However, the standard acquisition command ga (or the Acquire button) does not save the spectrum automatically. You must save it yourself! Or, you can start acquisition with the command run. The parameter bs, for block scans, sets when the data is written to disk. For example, if bs = 8, then you can look at the data after only 8 scans, even if the number of scans, nt=
5 The concentration of water in a solution of water is 110 M, easily obscuring standard NMR samples which are only present in mm concentration. 5
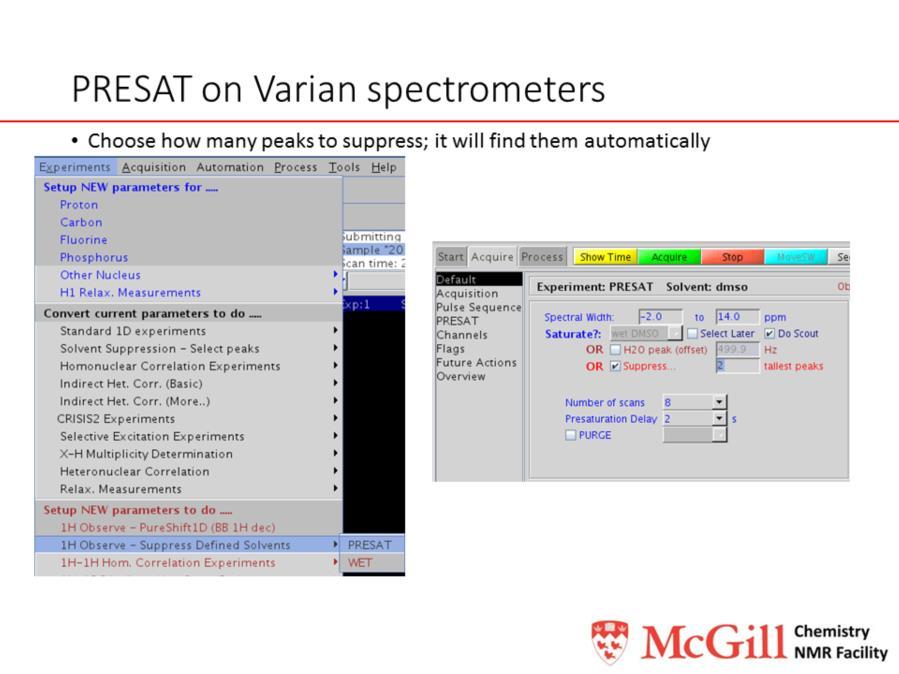
6 Mostly, either the saturation method or gradient methods are used, because it is very difficult to fail to excite the large water signal. Note that the signal-to-noise ratio has improved in the spectrum with water suppression. 6
7 Presaturation methods are reliable in that they do not depend upon exact calculations of any pulses, delays, gradients, etc. They need accurate adjustment of the presaturation position, but this can be automated. Attenuation of signals near the solvent peak being presaturated can be minimized by using a lower power for a longer duration, albeit at the cost of longer experiment time. 7
8 8
9 One side effect of introducing multiple pulses into a pulse sequence is that errors in the pulses tend to add, so that parts of the sample at the edges of the rf coil, which do not feel the full effect of the pulse applied, do not end up being excited. This is how the edge water is made to not show up in the spectrum. The Bruker experiment also looks for the largest signal automatically and suppresses it. 9
10 The key to all these sequences is that only the solvent signal experiences a net dephasing, or loss of signal, from the gradient pulse. The WATERGATE and excitation sculpting sequences use selective refocussing to select the signals other than water. These sequences do an excellent job of suppressing water, but the selective pulses used are long, and during the time which they are applied, J-coupled peaks become distorted. Thus, integrals are not as good with these sequences as with standard presat. 10
11 In the presence of a magnetic field gradient, spins evolve with frequencies that depend on their physical location in the sample. They yield no net signal at the end of a gradient pulse, because they all have different phases. 11
12 However, if a gradient pulse with opposite polarity but equal strength is applied for the same amount of time, the spins will evolve in exactly the opposite direction. Following that gradient pulse, their signal is said to be refocused. 12

13 The Bruker experiment 1d_DOUBSOLVSUPP uses NOESY-presat (like in single solvent version) to do decoupling. In both cases, a shaped pulse is generated which excites multiple sites. Exchangeable protons are still removed. 13
14 14
15 15
16 16
17 17
18 18
19 19
20 20
21 The NMR signal does not last forever, as can be seen from the decay apparent in most FIDs. In liquidstate NMR, as a rule, signal decays over a period of a few seconds. Two types of relaxation are important: T 1 relaxation, which is a return to equilibrium along the z axis, and T 2 relaxation, where coherence disappears in the transverse plane. In general, T 2 T 1. For small molecules, the two relaxation constants are nearly equal, but for large molecules like proteins, T 2 is considerably less than T 1. The main effect of T 1 is to limit the repetition rate of an experiment. For a 90 pulse in a simple pulse acquire experiment, if we wait 1xT1 between scans, the amount of magnetization that will have recovered is as follows: Assuming M z (eq)=1, M z (T1)= 1 1e -1, which is 1 1/2.718 = 0.63, i.e. 63% of the equilibrium z-magnetization remains. If we want 95% recovery, we need a delay of 3xT 1, and a delay of 5xT 1 will give 99.5% recovery. In practice, 3xT1 is usually sufficient. Longitudinal relaxation is stimulated by local magnetic fields oscillating with inverse correlation times close to the Larmor frequency, and is most efficient when the product of the Larmor frequency and the correlation time for molecular tumbling, w 0* t c =1. The main effect of T 2 appears in the linewidth. The longer T 2 is, the narrower the theoretically minimum linewidth is, which is why protein linewidths are greater than those of small molecules. However, the visible linewidth apparent in a spectrum is also affected by effects not intrinsic to the molecule, like magnetic inhomogeneity or bulk susceptibility (or poor shimming). This effect is known as T 2*. 21
22 Longitudinal relaxation is stimulated by motions at the Larmor frequency. As the tumbling rate decreases (the solution becomes more viscous or the molecule becomes larger), the spectral density function initially increases (the function is less spread out ) and T 1 decreases, but then as the rate falls further, the amount of highfrequency component falls and T 1 increases again. Transverse relaxation is stimulated by motions with inverse correlation times close to zero, and thus T 2 always decreases as molecular tumbling rate decreases. The actual origins of the fluctuating fields that cause relaxation include Interaction Dipolar coupling Quadrupolar coupling Paramagnetic interactions Scalar coupling Chemical shift anisotropy Spin rotation Relevant parameters Abundance of magnetically active nuclei: size of the magnetogyric ratio Electric field gradient at the nucleus Concentration of paramagnetic impurities Size of the J coupling Symmetry at the nuclear site Molecular motion 22
23 On the Varian instruments, this sequence can be set up by typing the command dot1. You will be prompted for the expected minimum T 1 value in seconds, the expected maximum T 1 value in seconds, and the time you want the experiment to take, in hours (use 0.1 if you want it to run as quickly as possible, with only 1 scan per τ value. This procedure can be used for any nucleus, once the instrument is set up to acquire a standard 1D spectrum for that nucleus. On the Bruker instruments, the setup is slightly more complicated, but it only needs to be done once; let me know before you need to run the experiment and I ll get it set up. As a rule of thumb, T 1 for 1 H in small molecules is usually a few seconds, if the sample hasn t been degassed (it s perhaps 10 s when the sample has been degassed) while it can range from a few seconds to s for 13 C, increasing as the number of protons on the carbon decreases. 23
24 Note that the fit will not be as correct if the recycle delay used is not at least 3 times the actual T 1 value. To try to compensate for this, the decay curve is usually fit to the equation M z (t) = A(1 2e -t/t1 ), where A is an adjustable parameter, rather than to M z (t) = M eq,z (1 2e -t/t1 ), which helps a lot. 24
25 If the sample and magnetic field are perfectly homogeneous, the FID only becomes less intense because of transverse relaxation. In real samples, the line is broadened by poor shimming, sample inhomogeneity etc. To account for this, we need an experiment where chemical shift effects are eliminated during the relaxation period the spin-echo experiment. 180 pulses applied during the evolution will refocus the inhomogenous broadening the envelope at the refocus points will be the real T 2. 25
26 In a CPMG experiment, the magnetization decays during a delay t, then there is a 180 degree pulse, and the signal builds up again to an echo after a further time t, after which the signal is acquired. The experiment is incremented by increasing the number of echoes only the last echo is acquired. This incrementation is controlled by incrementing a loop counter. Note that the number of echoes should always be an even number, to compensate for errors in the 180 degree pulses. The delay between echoes should be <<1/J, but must be reasonably long compared to the 180 degree pulse length, to avoid sample heating/probe damage. 26
27 27
28 The DOSY experiment depends on the effect of a pair of gradient pulses in which the spins are made to precess in one direction during the first and in the other direction during the second. A gradient pulse creates a nonuniform magnetic field that varies linearly with distance along the NMR tube (the z direction). If the spins diffuse during time period D, then they will experience a different magnetic field during the second gradient pulse than during the initial gradient pulse. The result of this is that not all their intensity is refocused at the end of the second gradient pulse, so that the intensity of the NMR signal is modulated during signal detection. The diffusion constant of a molecule D is related to its shape by the Stokes- Einstein equation where k B is the Boltzmann constant, T is the temperature, h is the viscosity, and R H is the hydrodynamic radius of the molecule. 28
29 One of the early developments in DOSY was the use of the spin-echo (a 90-t- 180-t-acquire pulse sequence), using two gradients with the same sign, since the magnetisation was inverted between the two gradients. In this experiment, however, the magnetisation decayed with time constant T 2, not T 1. The amended stimulated echo sequence allows magnetisation to be stored along the z axis so that it decays with time constant T 1. As T 1 is almost always greater than T 2, this leads to greater signal intensity. The spoil gradient destroys magnetisation that is not returned to the z axis. 29
30 At the end of the STE sequence, the magnetisation is dephased in the transverse plane. After some time for the magnetisation to rephase, it is returned to the longitudinal axis and a decay period allows eddy currents to decay before the magnetisation is returned to the transverse plane for acquisition. 30
31 Replacing each gradient pulse with a pair of gradient pulses with opposite polarity refocuses static gradient terms, reducing the effect of eddy currents on the appearance of the final signal. 31
32 The goal in selecting big delta and little delta is to observe a large reduction in signal when gpz6 is large (95%), so that a strong gradient is applied, compared with when only a weak (gpz6=5%) gradient is applied. The three plots of signal intensity as a function of gradient strength are DOSY decay curves. They show, from left to right, a decay that is too slow, a decay that is too fast, and a decay that is appropriate; D and d can be neither too short nor too long to get the decay correct. Choosing D and d appropriately means that the decay curve will be described well over the full range of gradient strengths possible. 32
33 Experiment 5 in the multiple display window was run with gpz6=5%; experiment 6 was run with gpz6=95%. All other parameters were identical. 33
34 34
 has a set set of steps, called the method tree, to follow.")
35 The Dynamics Center can usually be started from the Start Menu, under Start / All Programs / Bruker NMR Programs / Dynamics Center. On Linux, it can be found under Applications / Bruker TopSpin. The Dynamics Center also includes a component for analysing Protein Dynamics, but this requires a separate license. The Dynamics Center works using a method-based approach, in which each method (e.g. Diffusion) has a set set of steps, called the method tree, to follow. Each step has to be followed in order. 35

36 Click on Sample in the Diffusion method tree to start processing by entering information about the sample. Note that entering information here is optional, though it will appear on a report later. However, without at least clicking on Sample and clicking OK, it will not be possible to go on to the next step. Alternatively, drag and drop your dataset from a Windows explorer window (type expl in TopSpin for this) or straight from the Bruker data browser onto the word Diffusion in the Dynamics Center method tree. 36
 should be applicable if you have used the standard Bruker pulse sequences.")
37 Under the data entry in the method tree, you can choose the dataset you want to use and set some other parameters, such as those relating to peak picking. For the dataset, the default pseudo 2D (N traces) should be applicable if you have used the standard Bruker pulse sequences. Browse in the browser to the pdata number where you have processed the data using xf2. Once you have chosen the data and clicked on Open, you can verify that the diffusion parameters have been read correctly by looking at the DiffusionPar tab. 37

38 The spectrum will be displayed after the data is chosen. A toolbar permits you to see each trace of the spectrum. The peaks have been picked automatically, but if other peaks have to be picked or peaks have to be deleted, right-clicking will bring up an appropriate context-dependent menu. If the peak picking has failed totally, return to Data. Go to the peaks tab and choose threshold based peak picking. Left-click on the spectrum, hold the mouse button down, and release it when you are at an appropriate level for the threshold. The peaks displayed when you go on to the next step (Analysis) will be those used in the fitting, so make sure that the most intense trace is shown before continuing. 38
39 The default curve fitting function should be appropriate for the experiment you ran. Change the error estimation method to error estimation by weighted fit for more accurate error analysis. It is suggested that you calculate a 1D Inverse Laplace Transform (ILT) as a check on the diffusion curve fitting. 39

40 The fit is not displayed automatically. You must go to the View tab and click OK, although you can choose other options if you like. For the DOSY plot, the fit appears to have higher resolution if you set the number of points in F1 to a higher value. 40

41 Moving the cursor over any point shows its 1D ILT and 1D DOSY fit. Here, the agreement is excellent and the DOSY plot shows good resolution of pamoic acid from TMS, DMSO, and an impurity. The diffusion coefficients can be read off the 1D plot. For plotting purposes, you can export the 2D DOSY plot to Topspin as a 2rr file (so you can generate a PDF, for example) by right-clicking on it. When the 1D plots do not agree with each other, you should try to refit the data by increasing the range of the fit under Data / ILT / calculate 1D ILT. Try fitting from, for example, 1.0e-7 to 1.0e-13. You can always refit it later with a smaller range. Then, under View / DOSY plot, it might help to set the F1 display range manually to the same values you have selected. Once the two 1D plots are in good agreement, you can trust the D values displayed on the plot. 41

42 The report generation step is fairly self-explanatory. 42
43 The report contains a spectrum overview, the DOSY plot, and the diffusion coefficients, plus the 1D plots. The report tab allows this information to be customized. 43

44 The Dynamics Center allows information to be exported for use with other software. 44
45 For rigid molecules in a solid, anisotropic interactions dominate the spectrum because they are not averaged by isotropic motion. Such interactions include chemical shift anisotropy, dipolar coupling, and quadrupolar interactions. In the other extreme, isotropic interactions like the isotropic chemical shift (commonly called the chemical shift) and J-coupling dominate the spectra of liquids. In between, the spectra of inhomogeneous mixtures is dominated by magnetic susceptibility anisotropy, or the environment being different in every direction, although local anisotropic interactions are averaged by local motions. 45
 to average away anisotropic interactions and reduce them to their isotropic")
46 Like a lightweight version of a solids probe, the nanoprobe spins samples at the magic angle (the angle of a cube) to average away anisotropic interactions and reduce them to their isotropic component. 46
47 47
48 48
49 49
50 The spectrum shows the chemical shift anisotropy (CSA) pattern of the two 13 C sites in glycine. The different width in the patterns reflects the greater anisotropy in the chemical shift at the carboxylic acid site than the methylene site. The actual shape of the line reflects the greater asymmetry in the chemical shift at the carboxylic acid site than at the methylene site. These patterns can be simulated and interpreted in terms of the electronic structure around each site. 50
51 The isotropic component is the average of the principal components of the CSA tensor. The anisotropic component is the distance between the isotropic component and the largest principal component. The anisotropy is a measure of the difference between the two smaller components. 51
52 The NMR experiment doesn t detect signal is the frame of the individual chemical shift tensor, but in the frame of the main magnetic field. Each crystallite in a powder is physically oriented differently in this frame, so each crystallite has a different resonance in the spectrum. The sum of all of the individual chemical shifts of each crystallite is the powder pattern shown in the CSA spectrum. 52
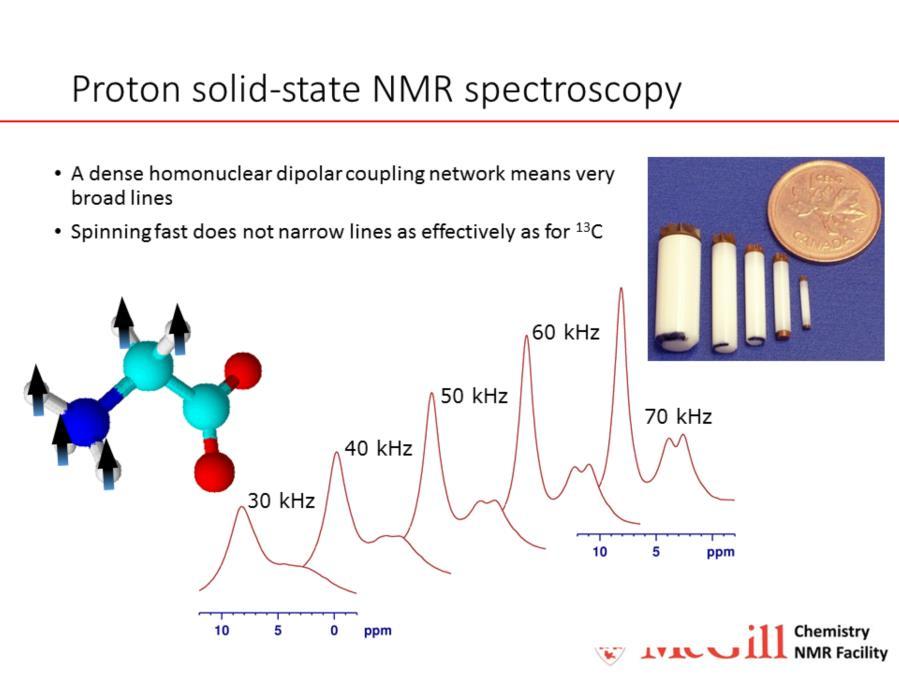
53 Magic-angle spinning narrows the lines of a spin-half nucleus significantly, and breaks the lines into spinning sidebands that are separated from the main peak (at the isotropic chemical shift) by the spinning frequency (in hertz). Residual linewidth is determined by: shimming (a well-shimmed liquid or highly mobile solid sample in a solids probe has a linewidth of a few Hz) magic angle setting (a poorly-set angle contributes 10 Hz or more to linewidth) decoupling (in a typical organic solid, residual coupling may broaden lines by Hz) disorder in the sample (this factor is usually measured in ppm and varies greatly from sample to sample) T 2. In general, under MAS and with 1 H decoupling (if appropriate), lines should have a Lorentzian or Gaussian lineshape (depending on the degree of disorder or remaining dipolar coupling, where more disorder or dipolar coupling leads to a more Gaussian lineshape). The only exception to this rule is lines that are coupled to a quadrupolar nucleus. These lines exhibit a lineshape with clear features characteristic of so-called residual dipolar splitting, which results from the interaction of a dipolar and a quadrupolar tensor, which has an angular dependence that is not averaged to an isotropic value under spinning at the magic angle. This splitting is larger at lower field and gives rise to characteristic 1:2 doubles in carbonyl peaks in 13 C spectra of amino acids. The splitting arises from coupling to 14 N and is particularly apparent at fields of 400 MHz and below. Splitting from other quadrupolar nuclei may also be observed. 53
54 Homonuclear dipolar coupling is the through-space coupling of two of the same kind of nuclei. The main homonuclear dipolar coupling network, present in most organic molecules, is hydrogen (marked in black in the alanine shown in the slide). Because hydrogen is such high gamma and so abundant, it couples very strongly to other hydrogen atoms. This gives rise to very broad, inhomogeneous lines, both of the protons themselves, and of the nuclei coupled to them, because the protons form a network of spins. Homonuclear dipolar coupling may also be present among other nuclei such as 13 C or 29 Si, if the sample is isotopically labelled, or among 31 P or other nuclei. The strength of dipolar coupling scales with the gamma of the nuclei involved, so it is less strong in these cases than for 1 H, and lines can often still be narrow, especially under MAS, for these nuclei. Information contained in homonuclear dipolar coupling can be used to assign peaks by tracing a backbone through a sample. J coupling occurs between any pair of spin-active nuclei (homonuclear or heteronuclear). 54
55 55
56 Heteronuclear dipolar coupling is through-space coupling that occurs between two spin-active nuclei of different isotopes. The molecule shown here is alanine. The vertical red arrow shows the dipolar coupling between the CH 13 C and its attached proton. This coupling is what allows cross-polarisation, or sensitivity enhancement, to occur on 13 C: magnetisation is transferred from the high gamma (sensitive) proton to the lower gamma (less sensitive) 13 C. The horizontal green arrow shows heteronuclear dipolar coupling between the CH 13 C and the 15 N to which it is attached. This coupling can be used to give information about the bond linking the 15 N and the 13 C, but there is a sensitivity issue: 13 C is naturally only 1% abundance, while 15 N has only 0.3% natural abundance. So, unless the sample is labelled in both the 13 C and 15 N sites, obtaining information about the bond length will be very difficult. Usually, protein samples are run fully labelled for just this reason. 56
57 57
58 58
59 Some of the main heteronuclear proton decoupling techniques are shown here. Continuous wave (CW) decoupling methods work, as they do in solution-state NMR, by saturating the 1 H resonances so that coupling between an X nucleus and the 1 H is disrupted and the X nucleus resonance is not split by coupling to the 1 H. Both dipolar and J coupling are removed by this method. In general, 1 H decoupling is more efficient as higher proton power is applied, and decoupling at 100 khz (2.5 μs 90 ) is not uncommon. However, continuous wave decoupling is not very efficient, so other methods have been developed that are more efficient and more broadband (in short, more effective) than continuous wave decoupling. TPPM (two-pulse phase modulation) is a variation of CW decoupling in which the phase changes between 0 and 15 (or some other value) while high power is maintained continuously. The length of each pulse is approximately 180 but must be optimized for each sample. A further development of this technique is SPINAL (small phase incremental alternation), in which phases are changed and alternated in a more complicated (supercycled) pattern to remove higher-order coupling components. A different technique is the XiX (X-inverse X) method, in which 180 pulses alternate between x (0 ) and x (180 ). This sequence tends to be more widely used with faster MAS. 59
60 60
61 61
62 62
63 63
64 CP at various times, dipolar dephasing, non-quaternary suppression 64
65 65
, 113 Cd, 119 Sn (and 115 Sn and 117 Sn), 125 Te (and 123 Te), 129 Xe, 183 W, 187 Os, 195 Pt, 199 Hg,")
66 Spin-half nuclei are those in yellow or pink in the periodic table above. They include: 1 H, 13 C, 15 N, 19 F, 29 Si, 31 P, 57 Fe, 77 Se, 89 Y, 103 Rh, 109 Ag (and 107 Ag), 113 Cd, 119 Sn (and 115 Sn and 117 Sn), 125 Te (and 123 Te), 129 Xe, 183 W, 187 Os, 195 Pt, 199 Hg, 205 Tl (and 203 Tl), 207 Pb, 209 Bi, 209 Po and 171 Yb. That is, there are not many nuclei with spin ½, but those nuclei with spin ½ occur frequently in a wide variety of compounds: 1 H, 13 C, and 15 N in organic compounds, 31 P and 29 Si in minerals, and 19 F in pharmaceutical compounds and glasses, to name but a few nuclei and applications! Unlike in liquid-state NMR, 1 H spectra tend to be broad and featureless, giving little to no information about a sample, while The considerations to take account of when deciding whether a spin-half nucleus will lend itself to investigation are its frequency, natural abundance, and relaxation properties. The greater the NMR frequency, the more sensitive is NMR. Probe capabilities, too, determine whether a nucleus can be studied on a particular setup. The natural abundance of a particular isotope can limit the applicability of NMR studies to a particular nucleus, and even if an isotope is present in great enough abundance to make NMR possible, it may not be abundant enough to make correlation experiments (linking two nuclei) possible. Finally, a nucleus that has a very long T 1 can be painful to study, while a very short T 2 leads to broad lines and signal lost in the probe dead time (the delay between the final pulse and the start of acquisition). Problems of abundance and long relaxation can frequently be overcome if the site of interest is near nuclei that are highly abundant and sensitive (such as protons), as will be shown in the slides about CP. 66
67 67
68 68
69 69
70 70
71 71
72 72
73 73
74 74
NMR Spectroscopy: A Quantum Phenomena
 NMR Spectroscopy: A Quantum Phenomena Pascale Legault Département de Biochimie Université de Montréal Outline 1) Energy Diagrams and Vector Diagrams 2) Simple 1D Spectra 3) Beyond Simple 1D Spectra 4)
High-Resolutio n NMR Techniques i n Organic Chemistry TIMOTHY D W CLARIDGE
 High-Resolutio n NMR Techniques i n Organic Chemistry TIMOTHY D W CLARIDGE Foreword Preface Acknowledgements V VI I X Chapter 1. Introduction 1.1. The development of high-resolution NMR 1 1.2. Modern
CHEM / BCMB 4190/6190/8189. Introductory NMR. Lecture 10
 CHEM / BCMB 490/690/889 Introductory NMR Lecture 0 - - CHEM 490/690 Spin-Echo The spin-echo pulse sequence: 90 - τ - 80 - τ(echo) Spins echoes are widely used as part of larger pulse sequence to refocus
4 Spin-echo, Spin-echo Double Resonance (SEDOR) and Rotational-echo Double Resonance (REDOR) applied on polymer blends
 and Rotational-echo Double Resonance (REDOR) applied on polymer blends") 4 Spin-echo, Spin-echo ouble Resonance (SEOR and Rotational-echo ouble Resonance (REOR applied on polymer blends The next logical step after analyzing and concluding upon the results of proton transversal
4 Spin-echo, Spin-echo ouble Resonance (SEOR and Rotational-echo ouble Resonance (REOR applied on polymer blends The next logical step after analyzing and concluding upon the results of proton transversal
PROTEIN NMR SPECTROSCOPY
 List of Figures List of Tables xvii xxvi 1. NMR SPECTROSCOPY 1 1.1 Introduction to NMR Spectroscopy 2 1.2 One Dimensional NMR Spectroscopy 3 1.2.1 Classical Description of NMR Spectroscopy 3 1.2.2 Nuclear
Laboration 8a. Relaxation, T 1 -measurement with inversion recovery
 , T 1 -measurement with inversion recovery KR Theory The way the magnetizations returns to equilibrium, relaxation, is a very important concept in NMR, for example, due to the fact that the rate of relaxation
Operation of the Bruker 400 JB Stothers NMR Facility Department of Chemistry Western University
 Operation of the Bruker 400 JB Stothers NMR Facility Department of Chemistry Western University 1. INTRODUCTION...3 1.1. Overview of the Bruker 400 NMR Spectrometer...3 1.2. Overview of Software... 3 1.2.1.
Spin Relaxation and NOEs BCMB/CHEM 8190
 Spin Relaxation and NOEs BCMB/CHEM 8190 T 1, T 2 (reminder), NOE T 1 is the time constant for longitudinal relaxation - the process of re-establishing the Boltzmann distribution of the energy level populations
Spin Dynamics Basics of Nuclear Magnetic Resonance. Malcolm H. Levitt
 Spin Dynamics Basics of Nuclear Magnetic Resonance Second edition Malcolm H. Levitt The University of Southampton, UK John Wiley &. Sons, Ltd Preface xxi Preface to the First Edition xxiii Introduction
Biophysical Chemistry: NMR Spectroscopy
 Relaxation & Multidimensional Spectrocopy Vrije Universiteit Brussel 9th December 2011 Outline 1 Relaxation 2 Principles 3 Outline 1 Relaxation 2 Principles 3 Establishment of Thermal Equilibrium As previously
Cross Polarization 53 53
 Cross Polarization 53 Why don t we normally detect protons in the solid-state BPTI Strong couplings between protons ( >20kHz) Homogeneous interaction Not readily averaged at moderate spinning speeds Rhodopsin
Center for Sustainable Environmental Technologies, Iowa State University
 NMR Characterization of Biochars By Catherine Brewer Center for Sustainable Environmental Technologies, Iowa State University Introduction Nuclear magnetic resonance spectroscopy (NMR) uses a very strong
NMR in Structural Biology
 NMR in Structural Biology Exercise session 2 1. a. List 3 NMR observables that report on structure. b. Also indicate whether the information they give is short/medium or long-range, or perhaps all three?
Slow symmetric exchange
 Slow symmetric exchange ϕ A k k B t A B There are three things you should notice compared with the Figure on the previous slide: 1) The lines are broader, 2) the intensities are reduced and 3) the peaks
Chemistry Department
 Chemistry Department NMR/Instrumentation Facility Users Guide - VNMRJ Prepared by Leila Maurmann The following procedures should be used to acquire one-dimensional proton and carbon NMR data on the 400MHz
Introduction to MRI. Spin & Magnetic Moments. Relaxation (T1, T2) Spin Echoes. 2DFT Imaging. K-space & Spatial Resolution.
 Spin Echoes. 2DFT Imaging. K-space & Spatial Resolution.") Introduction to MRI Spin & Magnetic Moments Relaxation (T1, T2) Spin Echoes 2DFT Imaging Selective excitation, phase & frequency encoding K-space & Spatial Resolution Contrast (T1, T2) Acknowledgement:
Introduction to MRI Spin & Magnetic Moments Relaxation (T1, T2) Spin Echoes 2DFT Imaging Selective excitation, phase & frequency encoding K-space & Spatial Resolution Contrast (T1, T2) Acknowledgement:
Login -the operator screen should be in view when you first sit down at the spectrometer console:
 Lab #2 1D 1 H Double Resonance (Selective Decoupling) operation of the 400 MHz instrument using automated sample insertion (robot) and automated locking and shimming collection of 1D 1 H spectra retrieving
Principios Básicos de RMN en sólidos destinado a usuarios. Gustavo Monti. Fa.M.A.F. Universidad Nacional de Córdoba Argentina
 Principios Básicos de RMN en sólidos destinado a usuarios Gustavo Monti Fa.M.A.F. Universidad Nacional de Córdoba Argentina CONTENIDOS MODULO 2: Alta resolución en sólidos para espines 1/2 Introducción
T 1, T 2, NOE (reminder)
") T 1, T 2, NOE (reminder) T 1 is the time constant for longitudinal relaxation - the process of re-establishing the Boltzmann distribution of the energy level populations of the system following perturbation
T 1, T 2, NOE (reminder) T 1 is the time constant for longitudinal relaxation - the process of re-establishing the Boltzmann distribution of the energy level populations of the system following perturbation
1H 1D-NOE Difference Spectra and Spin-Saturation Transfer Experiments on the GN500
 UGN526 VVM-21JUN88CD VVM-31OCT91UD 1H 1D-NOE Difference Spectra and Spin-Saturation Transfer Experiments on the GN500 Double-resonance experiments are techniques which use a second irradiating field (B
An introduction to Solid State NMR and its Interactions
 An introduction to Solid State NMR and its Interactions From tensor to NMR spectra CECAM Tutorial September 9 Calculation of Solid-State NMR Parameters Using the GIPAW Method Thibault Charpentier - CEA
NMR course at the FMP: NMR of organic compounds and small biomolecules - II -
 NMR course at the FMP: NMR of organic compounds and small biomolecules - II - 16.03.2009 The program 2/76 CW vs. FT NMR What is a pulse? Vectormodel Water-flip-back 3/76 CW vs. FT CW vs. FT 4/76 Two methods
General NMR basics. Solid State NMR workshop 2011: An introduction to Solid State NMR spectroscopy. # nuclei
 : An introduction to Solid State NMR spectroscopy Dr. Susanne Causemann (Solid State NMR specialist/ researcher) Interaction between nuclear spins and applied magnetic fields B 0 application of a static
NMR FACILITY NEWSLETTER
 NMR Newsletter NMR FACILITY NEWSLETTER Department of Chemistry and Biochemistry Matt Revington-Facility Coordinator mrevingt@uwindsor.ca Ext 3997 500 MHz NMR upgraded The 500 MHz NMR has received a $250,000
Principles of Nuclear Magnetic Resonance in One and Two Dimensions
 Principles of Nuclear Magnetic Resonance in One and Two Dimensions Richard R. Ernst, Geoffrey Bodenhausen, and Alexander Wokaun Laboratorium für Physikalische Chemie Eidgenössische Technische Hochschule
NMR PRAKTIKUM. Data processing Data acquisition... 17
 NMR PRAKTIKUM 1. INTRODUCTION... 2 1.1. Description of a Spectrometer... 2 1.2. Principle of a NMR Experiment... 4 1.2.1. 1D NMR experiment... 4 1.2.2. 2D NMR experiment... 5 2. PRACTICAL PART... 8 2.1.
10.4 Continuous Wave NMR Instrumentation
 10.4 Continuous Wave NMR Instrumentation coherent detection bulk magnetization the rotating frame, and effective magnetic field generating a rotating frame, and precession in the laboratory frame spin-lattice
Carbon 13 NMR NUCLEAR MAGNETIC RESONANCE SPECTROSCOPY
 NUCLEAR MAGNETIC RESONANCE SPECTROSCOPY PRINCIPLE AND APPLICATION IN STRUCTURE ELUCIDATION Carbon 13 NMR Professor S. SANKARARAMAN Department of Chemistry Indian Institute of Technology Madras Chennai
4 DQF-COSY, Relayed-COSY, TOCSY Gerd Gemmecker, 1999
 44 4 DQF-COSY, Relayed-COSY, TOCSY Gerd Gemmecker, 1999 Double-quantum filtered COSY The phase problem of normal COSY can be circumvented by the DQF-COSY, using the MQC term generated by the second 90
NMR and MRI : an introduction
 Intensive Programme 2011 Design, Synthesis and Validation of Imaging Probes NMR and MRI : an introduction Walter Dastrù Università di Torino walter.dastru@unito.it \ Introduction Magnetic Resonance Imaging
Timescales of Protein Dynamics
 Timescales of Protein Dynamics From Henzler-Wildman and Kern, Nature 2007 Summary of 1D Experiment time domain data Fourier Transform (FT) frequency domain data or Transverse Relaxation Ensemble of Nuclear
NMR Predictor. Introduction
 NMR Predictor This manual gives a walk-through on how to use the NMR Predictor: Introduction NMR Predictor QuickHelp NMR Predictor Overview Chemical features GUI features Usage Menu system File menu Edit
Band-Selective Homonuclear 2D Correlation Experiments
 Band-Selective Homonuclear 2D Correlation Experiments Application Note Authors Péter Sándor Agilent Technologies GmbH D76337 Waldbronn Germany Abstract This application note demonstrates the utility of
Solid-state NMR and proteins : basic concepts (a pictorial introduction) Barth van Rossum,
 Barth van Rossum,") Solid-state NMR and proteins : basic concepts (a pictorial introduction) Barth van Rossum, 16.02.2009 Solid-state and solution NMR spectroscopy have many things in common Several concepts have been/will
Solid-state NMR and proteins : basic concepts (a pictorial introduction) Barth van Rossum, 16.02.2009 Solid-state and solution NMR spectroscopy have many things in common Several concepts have been/will
Chemistry 431. Lecture 23
 Chemistry 431 Lecture 23 Introduction The Larmor Frequency The Bloch Equations Measuring T 1 : Inversion Recovery Measuring T 2 : the Spin Echo NC State University NMR spectroscopy The Nuclear Magnetic
τ 1 > 1/J - if this lifetime is significantly shortened, the coupling (splitting of the signal) will not be observed
 will not be observed") It is often advantageous to reverse or remove the splitting caused by spin-spin coupling This is called spin decoupling Spin decoupling (or just decoupling) can be used for several reasons - to simplify
It is often advantageous to reverse or remove the splitting caused by spin-spin coupling This is called spin decoupling Spin decoupling (or just decoupling) can be used for several reasons - to simplify
Determining C-H Connectivity: ghmqc and ghmbc (VnmrJ-2.2D Version: For use with the new Software)
") Determining C-H Connectivity: ghmqc and ghmbc (VnmrJ-2.2D Version: For use with the new Software) Heteronuclear Multiple Quantum Coherence (HMQC) and Heteronuclear Multiple Bond Coherence (HMBC) are 2-dimensional
Determining C-H Connectivity: ghmqc and ghmbc (VnmrJ-2.2D Version: For use with the new Software) Heteronuclear Multiple Quantum Coherence (HMQC) and Heteronuclear Multiple Bond Coherence (HMBC) are 2-dimensional
Protein dynamics from NMR Relaxation data
 Protein dynamics from NMR Relaxation data Clubb 3/15/17 (S f2 ) ( e ) Nitrogen-15 relaxation ZZ-exchange R 1 = 1/T 1 Longitudinal relaxation (decay back to z-axis) R 2 = 1/T 2 Spin-spin relaxation (dephasing
Chapter 7. Nuclear Magnetic Resonance Spectroscopy
 Chapter 7 Nuclear Magnetic Resonance Spectroscopy I. Introduction 1924, W. Pauli proposed that certain atomic nuclei have spin and magnetic moment and exposure to magnetic field would lead to energy level
BMB/Bi/Ch 173 Winter 2018
 BMB/Bi/Ch 173 Winter 2018 Homework Set 8.1 (100 Points) Assigned 2-27-18, due 3-6-18 by 10:30 a.m. TA: Rachael Kuintzle. Office hours: SFL 220, Friday 3/2 4:00-5:00pm and SFL 229, Monday 3/5 4:00-5:30pm.
Timescales of Protein Dynamics
 Timescales of Protein Dynamics From Henzler-Wildman and Kern, Nature 2007 Dynamics from NMR Show spies Amide Nitrogen Spies Report On Conformational Dynamics Amide Hydrogen Transverse Relaxation Ensemble
Ferdowsi University of Mashhad
 Spectroscopy in Inorganic Chemistry Nuclear Magnetic Resonance Spectroscopy spin deuterium 2 helium 3 The neutron has 2 quarks with a -e/3 charge and one quark with a +2e/3 charge resulting in a total
PRACTICAL ASPECTS OF NMR RELAXATION STUDIES OF BIOMOLECULAR DYNAMICS
 PRACTICAL ASPECTS OF MR RELAXATIO STUDIES OF BIOMOLECULAR DYAMICS Further reading: Can be downloaded from my web page Korzhnev D.E., Billeter M., Arseniev A.S., and Orekhov V. Y., MR Studies of Brownian
Polarised Nucleon Targets for Europe, 2nd meeting, Bochum 2005
 Polarised Nucleon Targets for Europe, nd meeting, Bochum Temperature dependence of nuclear spin-lattice relaxations in liquid ethanol with dissolved TEMPO radicals H. Štěpánková, J. Englich, J. Kohout,
How to perform 2D NMR Experiments on the Varian/Agilent VNMRS 500 when using the Chempack interface
 How to perform 2D NMR Experiments on the Varian/Agilent VNMRS 500 when using the Chempack interface 1 June 3, 2014 To start: 1. Insert your sample 2. If running any 2D spectrum or even just a 1D 13 C spectrum
BASIC NMR HANDBOOK Written by M. A. Eastman Copyright 1997, 2001, 2013, 2015, 2018
 BASIC NMR HANDBOOK Written by M. A. Eastman Copyright 1997, 2001, 2013, 2015, 2018 Basic NMR Handbook Table of Contents: Preface ii viii PART 1 Chapter 1: Introduction to NMR 1 Why Study NMR? 1 The Magnetic
CONTENTS. 2 CLASSICAL DESCRIPTION 2.1 The resonance phenomenon 2.2 The vector picture for pulse EPR experiments 2.3 Relaxation and the Bloch equations
 CONTENTS Preface Acknowledgements Symbols Abbreviations 1 INTRODUCTION 1.1 Scope of pulse EPR 1.2 A short history of pulse EPR 1.3 Examples of Applications 2 CLASSICAL DESCRIPTION 2.1 The resonance phenomenon
Advanced Quadrupolar NMR. Sharon Ashbrook School of Chemistry, University of St Andrews
 Advanced Quadrupolar NMR Sharon Ashbrook School of Chemistry, University of St Andrews Quadrupolar nuclei: revision single crystal powder ST 500 khz ST ω 0 MAS 1 khz 5 khz second-order broadening Example:
Supporting Information Elucidating Lithium-Ion and Proton Dynamics in Anti- Perovskite Solid Electrolytes
 Electronic Supplementary Material (ESI) for Energy & Environmental Science. This journal is The Royal Society of Chemistry 2018 Supporting Information Elucidating Lithium-Ion and Proton Dynamics in Anti-
NMR BMB 173 Lecture 16, February
 NMR The Structural Biology Continuum Today s lecture: NMR Lots of slides adapted from Levitt, Spin Dynamics; Creighton, Proteins; And Andy Rawlinson There are three types of particles in the universe Quarks
Carbon and Heteronuclear NMR on the Bruker
 Carbon and Heteronuclear NMR on the Bruker There are several different types of carbon spectra such as a normal qualitative spectrum, DEPT, coupled, and those with and without NOE. This handout discusses
8.2 The Nuclear Overhauser Effect
 8.2 The Nuclear Overhauser Effect Copyright Hans J. Reich 2016 All Rights Reserved University of Wisconsin An important consequence of DD relaxation is the Nuclear Overhauser Effect, which can be used
e 2m p c I, (22.1) = g N β p I(I +1), (22.2) = erg/gauss. (22.3)
 = g N β p I(I +1), (22.2) = erg/gauss. (22.3)") Chemistry 26 Molecular Spectra & Molecular Structure Week # 7 Nuclear Magnetic Resonance Spectroscopy Along with infrared spectroscopy, nuclear magnetic resonance (NMR) is the most important method available
Chemistry 26 Molecular Spectra & Molecular Structure Week # 7 Nuclear Magnetic Resonance Spectroscopy Along with infrared spectroscopy, nuclear magnetic resonance (NMR) is the most important method available
H-C one-bond correlations: HSQC Preliminaries.
 A. F. Miller 2010 C HSQC H-C one-bond correlations: HSQC Preliminaries. For both 1 H and C, you need a good power pw90 pair and you should have good values for both sw and tof for both nuclei. In short,
NMR: PRACTICAL ASPECTS
 NMR: PRACTICAL ASPECTS Pedro M. Aguiar Sample Preparation Well prepared sample can yield high quality spectra Poorly prepared sample typically yields low quality spectra Tubes of appropriate quality Higher
Magnetic Resonance Spectroscopy
 INTRODUCTION TO Magnetic Resonance Spectroscopy ESR, NMR, NQR D. N. SATHYANARAYANA Formerly, Chairman Department of Inorganic and Physical Chemistry Indian Institute of Science, Bangalore % I.K. International
HMQC HSQC and HMBC. Gradient HMQC, HMBC on the Bruker400 and 500
 1 Gradient HMQC, HMBC on the Bruker400 and 500 HMQC, HSQC - Heteronuclear Multiple Quantum Correlation. These experiments correlate the chemical shift of proton with the chemical shift of the directly
Relaxation, Multi pulse Experiments and 2D NMR
 Relaxation, Multi pulse Experiments and 2D NMR To Do s Read Chapter 6 Complete the end of chapter problems; 6 1, 6 2, 6 3, 6 5, 6 9 and 6 10. Read Chapter 15 and do as many problems as you can. Relaxation
NMR Spectroscopy Laboratory Experiment Introduction. 2. Theory
 1. Introduction 64-311 Laboratory Experiment 11 NMR Spectroscopy Nuclear Magnetic Resonance (NMR) spectroscopy is a powerful and theoretically complex analytical tool. This experiment will introduce to
SSSC Discovery Series NMR2 Multidimensional NMR Spectroscopy
 SSSC Discovery Series NMR2 Multidimensional NMR Spectroscopy Topics: 1. Some Common Experiments 2. Anatomy of a 2D experiment 3. 3D NMR spectroscopy no quantum mechanics! Some Common 2D Experiments Very
NMR-spectroscopy of proteins in solution. Peter Schmieder
 NMR-spectroscopy of proteins in solution Basic aspects of NMR-Spektroskopie Basic aspects of NMR-spectroscopy 3/84 Prerequisite for NMR-spectroscopy is a nuclear spin that can be thought of as a mixture
More NMR Relaxation. Longitudinal Relaxation. Transverse Relaxation
 More NMR Relaxation Longitudinal Relaxation Transverse Relaxation Copyright Peter F. Flynn 2017 Experimental Determination of T1 Gated Inversion Recovery Experiment The gated inversion recovery pulse sequence
Introduction to 1D and 2D NMR Spectroscopy (4) Vector Model and Relaxations
 Vector Model and Relaxations") Introduction to 1D and 2D NMR Spectroscopy (4) Vector Model and Relaxations Lecturer: Weiguo Hu 7-1428 weiguoh@polysci.umass.edu October 2009 1 Approximate Description 1: Energy level model Magnetic field
Introduction to 1D and 2D NMR Spectroscopy (4) Vector Model and Relaxations Lecturer: Weiguo Hu 7-1428 weiguoh@polysci.umass.edu October 2009 1 Approximate Description 1: Energy level model Magnetic field
NMR Spectroscopy of Polymers
 UNESCO/IUPAC Course 2005/2006 Jiri Brus NMR Spectroscopy of Polymers Brus J 1. part At the very beginning the phenomenon of nuclear spin resonance was studied predominantly by physicists and the application
North Carolina State University Department of Chemistry Varian NMR Training Manual
 North Carolina State University Department of Chemistry Varian NMR Training Manual by J.B. Clark IV & Dr. S. Sankar 1 st Edition 05/15/2009 Section 3: Glide Program Operations for Advanced 1D & 2D Spectra
Nuclear magnetic resonance spectroscopy II. 13 C NMR. Reading: Pavia Chapter , 6.7, 6.11, 6.13
 Nuclear magnetic resonance spectroscopy II. 13 NMR Reading: Pavia hapter 6.1-6.5, 6.7, 6.11, 6.13 1. General - more/better/additional structural information for larger compounds -problems: a) isotopes
Apparative Methoden in der Physikalischen Chemie DIFFUSION MEASUREMENTS BY NUCLEAR MAGNETIC RESONANCE (NMR) 1 Introduction.
 1 Introduction.") Apparative Methoden in der Physikalischen Chemie DIFFUSION MEASUREMENTS BY NUCLEAR MAGNETIC RESONANCE (NMR) 12th March 2008 Before reading the following script it is recommended first obtain basic knowledge
Apparative Methoden in der Physikalischen Chemie DIFFUSION MEASUREMENTS BY NUCLEAR MAGNETIC RESONANCE (NMR) 12th March 2008 Before reading the following script it is recommended first obtain basic knowledge
Magnetic Resonance Imaging. Pål Erik Goa Associate Professor in Medical Imaging Dept. of Physics
 Magnetic Resonance Imaging Pål Erik Goa Associate Professor in Medical Imaging Dept. of Physics pal.e.goa@ntnu.no 1 Why MRI? X-ray/CT: Great for bone structures and high spatial resolution Not so great
Lab 1: Intro to NMR. March 10, 2014
 Lab 1: Intro to NMR March 10, 2014 Christine Leon-Swisher (GSI), Miki Lustig (Prof) 1 Preliminaries Never bring anything metal into the room with an MRI (i.e. keys, metallic jewelry, chairs) Do not enter
X-Nucleus NMR: 31 P and 19 F
 Chem 636, Fall 2008 HW #9 Due at the beginning of lab, the week of Oct 28 (cgf: updated 12 July 2010) X-ucleus MR: 31 P and 19 F Many nuclei in MR can be detected in a manner similar to 13 C. 31 P and
Fundamental MRI Principles Module Two
 Fundamental MRI Principles Module Two 1 Nuclear Magnetic Resonance There are three main subatomic particles: protons neutrons electrons positively charged no significant charge negatively charged Protons
Magnetization Gradients, k-space and Molecular Diffusion. Magnetic field gradients, magnetization gratings and k-space
 2256 Magnetization Gradients k-space and Molecular Diffusion Magnetic field gradients magnetization gratings and k-space In order to record an image of a sample (or obtain other spatial information) there
Physical Background Of Nuclear Magnetic Resonance Spectroscopy
 Physical Background Of Nuclear Magnetic Resonance Spectroscopy Michael McClellan Spring 2009 Department of Physics and Physical Oceanography University of North Carolina Wilmington What is Spectroscopy?
Filtered/edited NOESY spectra
 Filtered/edited NOESY spectra NMR Seminar HS 207 Nina Ripin 22..7 Overview NMR of biomolecular complexes Problems and Solutions Filtered/edited nomenclature Experimental elements NOESY vs filtered pulse
Spin-spin coupling I Ravinder Reddy
 Spin-spin coupling I Ravinder Reddy Spin-interactions External interactions Magnetic field Bo, RF field B1 Internal Interactions Molecular motions Exchange Chemical shifts J-coupling Spin Diffusion Dipolar
H-C one-bond correlations: HSQC Preliminaries.
 A.- F. Miller 2010 C HSQC H-C one-bond correlations: HSQC Preliminaries. For both 1 H and C, you need a good power- pw90 pair and you should have good values for both sw and tof for both nuclei. In short,
NMR NEWS June To find tutorials, links and more, visit our website
 Department of Chemistry NMR Facilities Director: Dr. Carlos A. Steren NMR NEWS June 2014 To find tutorials, links and more, visit our website www.chem.utk.edu/facilities/nmr Computers and software updates
Introduction to Relaxation Theory James Keeler
 EUROMAR Zürich, 24 Introduction to Relaxation Theory James Keeler University of Cambridge Department of Chemistry What is relaxation? Why might it be interesting? relaxation is the process which drives
MRI Physics I: Spins, Excitation, Relaxation
 MRI Physics I: Spins, Excitation, Relaxation Douglas C. Noll Biomedical Engineering University of Michigan Michigan Functional MRI Laboratory Outline Introduction to Nuclear Magnetic Resonance Imaging
Double-Resonance Experiments
 Double-Resonance Eperiments The aim - to simplify complicated spectra by eliminating J-couplings. omonuclear Decoupling A double resonance eperiment is carried out using a second rf source B 2 in addition
Measuring Spin-Lattice Relaxation Time
 WJP, PHY381 (2009) Wabash Journal of Physics v4.0, p.1 Measuring Spin-Lattice Relaxation Time L.W. Lupinski, R. Paudel, and M.J. Madsen Department of Physics, Wabash College, Crawfordsville, IN 47933 (Dated:
Two Dimensional (2D) NMR Spectroscopy
 NMR Spectroscopy") The two important parameters obtained from NMR spectra are; Two Dimensional (2D) NMR Spectroscopy py Correlation NMR a. Chemical shift b. Spin-spin coupling constant Large molecules with numerous atoms
The two important parameters obtained from NMR spectra are; Two Dimensional (2D) NMR Spectroscopy py Correlation NMR a. Chemical shift b. Spin-spin coupling constant Large molecules with numerous atoms
K-space. Spin-Warp Pulse Sequence. At each point in time, the received signal is the Fourier transform of the object s(t) = M( k x
 = M( k x") Bioengineering 280A Principles of Biomedical Imaging Fall Quarter 2015 MRI Lecture 4 k (t) = γ 2π k y (t) = γ 2π K-space At each point in time, the received signal is the Fourier transform of the object
Bioengineering 280A Principles of Biomedical Imaging Fall Quarter 2015 MRI Lecture 4 k (t) = γ 2π k y (t) = γ 2π K-space At each point in time, the received signal is the Fourier transform of the object
PRACTICAL ASPECTS OF NMR RELAXATION STUDIES OF BIOMOLECULAR DYNAMICS
 PRACTICAL ASPECTS OF MR RELAXATIO STUDIES OF BIOMOLECULAR DYAMICS Further reading: (Can be downloaded from my web page Korzhnev D.E., Billeter M., Arseniev A.S., and Orekhov V. Y., MR Studies of Brownian
TECNICHE DI ALTA E BASSA RISOLUZIONE IN NMR STATO SOLIDO
 TECNICHE DI ALTA E BASSA RISOLUZIONE IN NMR STATO SOLIDO Roberto Gobetto Dipartimento di Chimica I.F.M., Università di Torino, Via P. Giuria 7, 10125 Torino Chemical Shift Anisotropy s q Chemical shift
MEASURING DIFFUSION BY NMR. Bruker Instruments Inc. Sophie Kazanis Application Scientist August 2000
 1 MEASURING DIFFUSION BY NMR Bruker Instruments Inc. Sophie Kazanis Application Scientist August 2000 2 Table of Contents Chapter 1 Section 1.1 Section 1.2 Section 1.3 Chapter 2 Chapter 3 Section 3.1 Section
Chem 325 NMR Intro. The Electromagnetic Spectrum. Physical properties, chemical properties, formulas Shedding real light on molecular structure:
 Physical properties, chemical properties, formulas Shedding real light on molecular structure: Wavelength Frequency ν Wavelength λ Frequency ν Velocity c = 2.998 10 8 m s -1 The Electromagnetic Spectrum
NMR TRAINING. What to Cover
 NMR TRAINING MULTI-DIMENSIONAL EXPERIMENTS What to Cover Introducing a second dimension COSY, NOESY, TOCSY, SQC, MBC D Processing Proton T1/T measurement, Diffusion measurement Spectrometer Preparation
Linear and nonlinear spectroscopy
 Linear and nonlinear spectroscopy We ve seen that we can determine molecular frequencies and dephasing rates (for electronic, vibrational, or spin degrees of freedom) from frequency-domain or timedomain
Natural abundance solid-state 95 Mo MAS NMR of MoS 2 reveals precise 95 Mo anisotropic parameters from its central and satellite transitions
 Electronic Supplementary Information for: Natural abundance solid-state 95 Mo MAS NMR of MoS 2 reveals precise 95 Mo anisotropic parameters from its central and satellite transitions Hans J. Jakobsen,*
Correcting Lineshapes in NMR Spectra
 Correcting Lineshapes in NMR Spectra Colin Vitols, Pascal Mercier June 2006 In this note we present a method for removing lineshape distortions from nuclear magnetic resonance (NMR) spectra prior to more
Principles of Nuclear Magnetic Resonance Microscopy
 Principles of Nuclear Magnetic Resonance Microscopy Paul T. Callaghan Department of Physics and Biophysics Massey University New Zealand CLARENDON PRESS OXFORD CONTENTS 1 PRINCIPLES OF IMAGING 1 1.1 Introduction
NMR Data workup using NUTS
 omework 1 Chem 636, Fall 2008 due at the beginning of the 2 nd week lab (week of Sept 9) NMR Data workup using NUTS This laboratory and homework introduces the basic processing of one dimensional NMR data
G Medical Imaging. Outline 4/13/2012. Physics of Magnetic Resonance Imaging
 G16.4426 Medical Imaging Physics of Magnetic Resonance Imaging Riccardo Lattanzi, Ph.D. Assistant Professor Department of Radiology, NYU School of Medicine Department of Electrical and Computer Engineering,
Advanced Topics and Diffusion MRI
 Advanced Topics and Diffusion MRI Slides originally by Karla Miller, FMRIB Centre Modified by Mark Chiew (mark.chiew@ndcn.ox.ac.uk) Slides available at: http://users.fmrib.ox.ac.uk/~mchiew/teaching/ MRI
NMR FACILITY User's Guide
 NMR FACILITY User's Guide Texas A&M University Department of Chemistry August 19, 2010 Table of Contents I. Introduction...5 II. Experiments Available...5 A. One Dimensional NMR...5 1. 'Normal' spectra...5
The NMR Spectrum - 13 C. NMR Spectroscopy. Spin-Spin Coupling 13 C NMR. A comparison of two 13 C NMR Spectra. H Coupled (undecoupled) H Decoupled
 H Decoupled") Spin-Spin oupling 13 NMR A comparison of two 13 NMR Spectra 1 oupled (undecoupled) 1 Decoupled 1 Proton Decoupled 13 NMR 6. To simplify the 13 spectrum, and to increase the intensity of the observed signals,
Spin-Spin oupling 13 NMR A comparison of two 13 NMR Spectra 1 oupled (undecoupled) 1 Decoupled 1 Proton Decoupled 13 NMR 6. To simplify the 13 spectrum, and to increase the intensity of the observed signals,
EL-GY 6813/BE-GY 6203 Medical Imaging, Fall 2016 Final Exam
 EL-GY 6813/BE-GY 6203 Medical Imaging, Fall 2016 Final Exam (closed book, 1 sheets of notes double sided allowed, no calculator or other electronic devices allowed) 1. Ultrasound Physics (15 pt) A) (9
Relaxation times in nuclear magnetic resonance
 Relaxation times in TEP Related topics Nuclear spins, atomic nuclei with a magnetic moment, precession movement of the nuclear spins, Landau-Lifshitz equation, Bloch equation, magnetisation, resonance
Chem8028(1314) - Spin Dynamics: Spin Interactions
 - Spin Dynamics: Spin Interactions") Chem8028(1314) - Spin Dynamics: Spin Interactions Malcolm Levitt see also IK m106 1 Nuclear spin interactions (diamagnetic materials) 2 Chemical Shift 3 Direct dipole-dipole coupling 4 J-coupling 5 Nuclear
Chem8028(1314) - Spin Dynamics: Spin Interactions Malcolm Levitt see also IK m106 1 Nuclear spin interactions (diamagnetic materials) 2 Chemical Shift 3 Direct dipole-dipole coupling 4 J-coupling 5 Nuclear