Agilent MassHunter Quantitative Data Analysis
|
|
|
- Lesley Pope
- 6 years ago
- Views:
Transcription
1 Agilent MassHunter Quantitative Data Analysis Presenters: Howard Sanford Stephen Harnos MassHunter Quantitation: Batch Table, Compound Information Setup, Calibration Curve and Globals Settings 1
2 MassHunter Quantitative Software Review and Quant Method Optimization Topics Brief Review Batch Table Navigation Compound Information - Data review and manual integration Calibration Curve Working in Compounds At a Glance Method Editor Globals Setting 2
3 Review Three major views in MassHunter Quantitative Analysis. Batch At a Glance Method Editor Compounds At a Glance Handling MS/MS data QQQ and QTOF. Handling accurate mass data TOF and QTOF. 3

4 MassHunter Quantitative Software Batch-at-a-Glance View Batch Table Compound Information Calibration Curve 4


5 MassHunter Quantitative Software Method Editor View Method > Edit menu or F10 key Method Table Method Tasks Sample Information Compound Information 5

6 MassHunter Quantitative Software Compounds at a Glance View View > Compounds-at-a-Glance 6
7 Editing a Quantitation Method for TOF Mass Extraction Setup Method > Edit > Advanced Tasks > Mass Extraction Setup Allows for a mass range for the extraction of the accurate mass (MZ). Available MZ Extraction Window Units 7
8 Editing a Quantitation Method for QTOF Compound Setup & Mass Extraction Setup QTOF is a combination of MS/MS and accurate mass data Name Compound name TS time segments may be multiple Transition Precursor ion Product ion scan Scan Product Ion Type Target, ISTD, Surrogate or Matrix Spike Precursor Ion mass of the ion Product Ion mass of the ion for the target ion to monitor RT retention time of compound of interest Ion Polarity usually positive Criteria Close RT, Close RT with Qualifiers, Greatest Response or Greatest Q-Value 8
9 Batch Table Navigation Click in a sample row to display data on that sample Click on Next and Previous icons to move through a batch or use Hotkeys: Next Sample = Alt + Down Next Compound = Alt + Right Previous Sample= Alt + Up Previous Compound = Alt + Left Compound list are frequently long, try the Compound drop down list to go directly to the desired compound. 9


10 Batch Table Alphabetizing the Compound List From within the Batch Table right click, select Arrange Compounds By > Name 10
 Messages Outliers Hover cursor over the outlier or message to display")
11 Batch Table Messages and Outliers Select Outliers for Display Red Outlier High (above upper limit) Blue Outlier Low (below lower limit) Messages Outliers Hover cursor over the outlier or message to display details 11


12 Batch Table Layout Modification Add/Remove/Move Columns Use the Add/Remove Columns function to customize the Batch table. Note that the columns of data in the Batch Table are organized into sections. Columns can be moved only within a section. 12


13 Batch Table Layout Modification Single and Multiple Compound Modes Single Compound Mode Flat Table compounds across the top. Multiple Compound Mode 13

14 Batch Table Layout Modification Compound Table Modes Compound Table lists by compound rather than sample. Select Flat Table to see list by sample. 14

15 Batch Table Compounds Groups It may be useful to group compounds to organize Batch Table. Look at parent compound and metabolites. Group hydrocarbons to Group 1, aromatics to Group 2 and so forth. Compound groups are generated in the Method Editor. 15

16 Batch Table Compounds Groups Activated with a right click to the right of the flags or View > Toolbars > Filtering. Yields an Additional Toolbar. 16


17 Batch Table Samples Groups Sample Groups are specified in the Batch Table through Add/Remove Columns. Each Sample is assigned to a group, then only samples specific to a group are displayed and evaluated. Samples groups are distinctively different from compound groups. 17

 Exponential")
 General 4) Significant Figures")
18 Batch Table Layout Modification Format Columns How to change the number of decimal places. Alter number formats 1) Exponential (scientific notation) 2) Fixed point 3) General 4) Significant Figures Alter Date formats 18

19 Batch Table Layout Modification Context Menu Properties Change the Font size Change the Color scheme 19


20 Export Batch Table Easy to layout columns and format data, then export into Excel. 20
21 Let s take a moment for questions on Batch Table Navigation. 21
22 Time for a demo on Batch Table Navigation Next up: Compound Information 22

23 Compound Information Display and access one compound in one sample at a time. Target Quantifier Target Qualifiers Target Spectrum ISTD Quantifier ISTD Qualifiers ISTD Spectrum 23
24 Compound Information - Toolbar Un-zooms, Peak scaling, Auto Scales x and y axes Sample and Compound Navigation Next / Pervious Display/Hide Target, Qualifiers, Spectra, ISTD Manual Integration Functions 24

25 Manual Integrations and MI Toolbar Click on the Manual Integration icon to place Compound Information in Manual Integration mode. Each signal is placed in its own window (no overlay of qualifiers). 25
26 Manual Integration Toolbar Enable Manual Integration this tool activates the manual integration toolbar. Clear Manual Integration this tool becomes active once a manual integration is present. Zero Peak this tool sets start and stop to the same value. Merge Right/Left Peak this tool merges the peak to the right/left of the selected peak. Split Peak and Pick Right/Left this tool splits the peak and then selects the right or left peak. Snap Baseline this tool places start/stop integration points on the baseline. Drop Baseline this tool finds the lowest end of the peak, then drops the baseline on the other side of the peak from it, thereby creating a flat baseline that avoids negative area. 26
.")
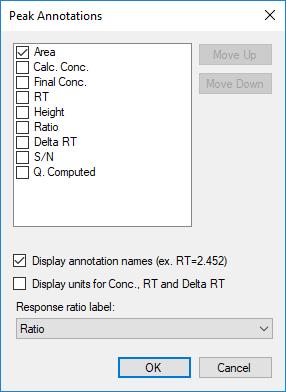
27 Compound Information Peak Annotation Activated from Tools > Add-Ins NI The peak was not integrated at all by the computer software. LT The peak in question was inappropriately integrated to an area less than what it should be (e.g., Peak area was cut). GT - The peak in question was inappropriately integrated to an area greater than what it should be (e.g., Peak Tailing). BA The baseline had to be adjusted correctly by the analyst. CO The analyst had to split to co-eluting peaks apart that were not (or could not be) separated by the computer system. RT The retention time for the peak in question has shifted from the expected retention time. INT There was electronic interference (e.g., Noise). 27
28 Compound Information Peak Annotation The editable file is located in C:\Program Files\Agilent\MassHunter\Workstation\Quant\bin\AddIns\PeakAnnotations.xml. 28


29 Compound Information Peak Annotation The Peak Annotation can also be displayed in the Batch Table. When the batch is saved, the values are retained. The MI flag is checked in the Compound Results. 29

30 Compound Information Context Menu Integration Parameters Right click to expose the context menu. Most of the features are toolbar icons. Integration Parameters can be used to change the integration parameters. Applies ONLY to this compound in this sample. Restore Integration Parameters reverts to the method integration values. 30

31 Compound Information Context Menu Properties Properties allows for customization of the display. Can change Fill colors. Can change Peak labels. Can change Titles. 31

32 Compound Information Context Menu Properties Qualifier Properties can be changed. Spectrum Properties can be altered. Manual integration parameters can be varied. 32
33 Signal to Noise Five algorithms are available Consult online help for more information on the algorithms. Noise regions can be automatically determined or individually specified. The Noise regions can be displayed in the Compound Information window under Properties > Compound Information (1) > Baseline Calculation Points. In this example, 2 noise regions were determined one before the peak and the other after. 33
34 Let s take a moment for questions on Compound Information 34
35 Let s take a moment for a demo on the features of Compound Information Next up: Calibration Curve and Curve Fit Assistant 35
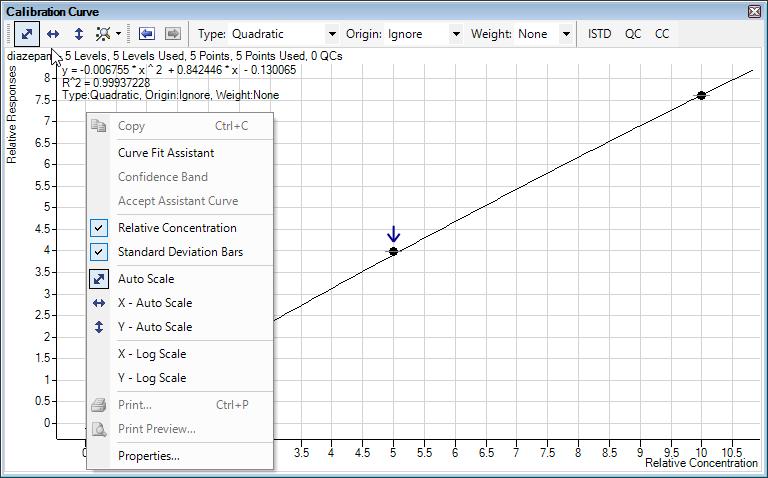
36 Calibration Curve Fit to Levels (Scaling) Change Curve Fit. View ISTD Responses R 2 CC Levels QC Samples Concentration can be set as relative (to ISTD) or actual. 36
37 Calibration Curve Disable calibration points Click on calibration point once to disable and remove from curve. 37

38 Curve Fit Assistant 38

39 Curve Fit Assistant Sorting Columns Best curve fit may be ranked using by R 2, Standard Error, or Max % Residual. Curve Fit Assistant calculates the mathematical curves. 39
40 Curve Fit Assistant Disabled Points # of Disabled Points defaults to 3 but column can be filtered. 40
41 Curve Fit Assistant Confidence Band Original Fit (black) Best Fit (blue) Confidence Band (blue) 41
42 Calibration Curve Log Log Plot Logarithmic Scale 42

43 Curve Fit Assistant Accept Assistant Curve 43
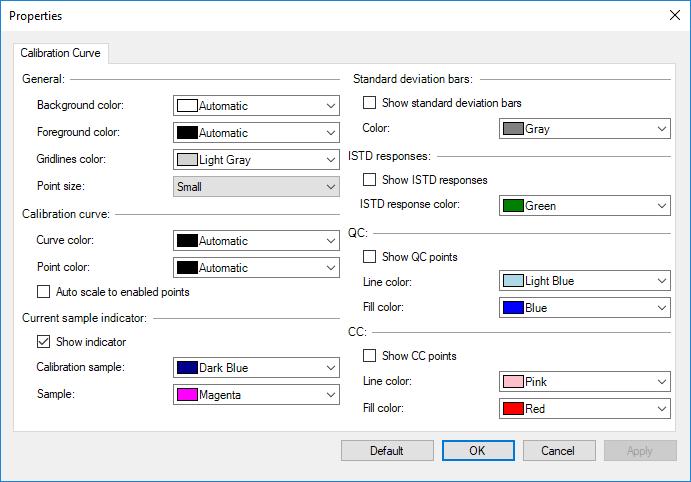
44 Calibration Curve Properties 44
45 Let s take a moment for questions on Calibration Curve and Curve Fit Assistant 45
46 Time for a demo on Calibration Curve and Curve Fit Assistant Next up: Compounds at a Glance 46

47 Compounds-at-a-Glance High throughput data review environment. View compounds across multiple samples. View all compounds within a sample. 47
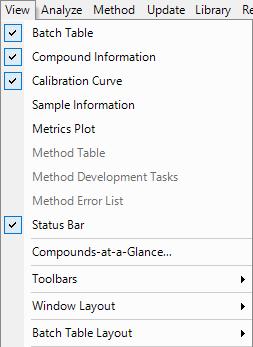
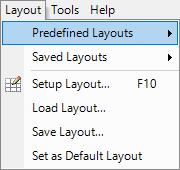
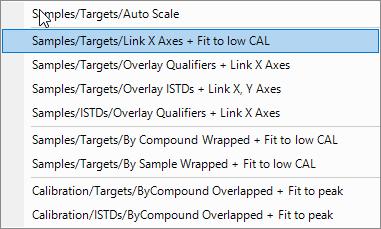
48 Compounds-at-a-Glance To start, select View > Compounds-at-a-Glance Choose Layout > Predefined Layout 48

49 Compounds-at-a-Glance Setup Graphics Wizard To customize select Layout > Setup Specify Samples to view in Compounds-at-a-Glance then Compounds. By default, all samples and all compounds are selected. Specific samples and order can be modified. 49


50 Compounds-at-a-Glance Setup Graphics Wizard Define how to Organize the selected compounds and samples. Define the Overlay mode. Review Mode Sample by Sample Compound by Compound Compound Group by Compound Group Display Options 50

51 Compounds-at-a-Glance Setup Graphics Wizard Finally, define which Outliers should be highlighted Outliers can also be filtered by Panes without outliers Panes with outliers 51

52 Compounds-at-a-Glance Outliers Outliers are highlighted in red. 52

53 Compounds-at-a-Glance Manual Integration Pop Up Double click for single pane access. Can be accessed without manual integration being activated. 53


54 Compounds-at-a-Glance Print Preview Select File > Print Preview to create a chromatogram report. Export Graphics give a graphic image in various formats. 54
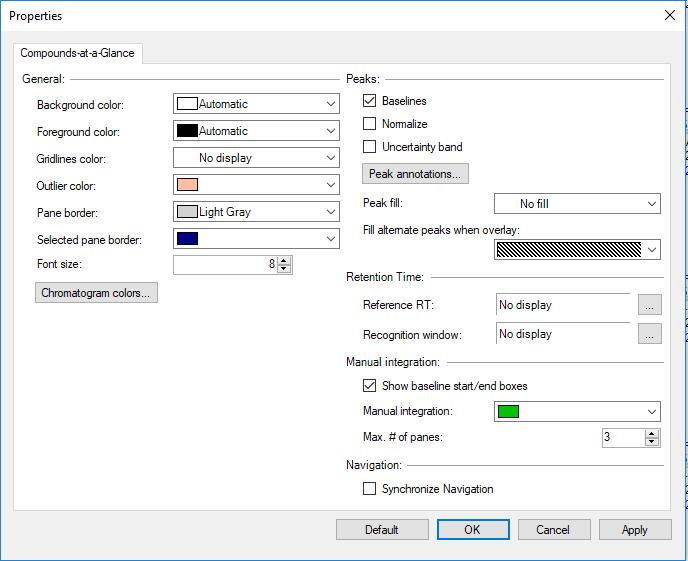
55 Compounds-at-a-Glance Properties From the context menu select Properties 55


56 Compounds-at-a-Glance Save Layout Some settings in the Layout screens are not saved such as compounds, samples, etc. 56
57 Time for questions on Compounds at a Glance 57
58 Let s watch a demo on Compounds at a Glance Next up: Global Settings 58
59 Globals Settings Component of Method Editor. Global parameters are critical to proper quantitation. Globals are method parameters. Globals apply to the whole batch all samples and all compounds. 59

60 Globals Settings Apply Multiplier s None or Overlapped or Sample Group Associates target and qualifiers in min Dynamic Background Subtraction To avoid flagging target compounds that absent Part of unified method Peak identification within the extraction window Spectral Reference Library (.reflibrary.xml) Spectral Pattern Reference Library (.reflibrary.xml) Peak identification within the extraction window (ISTD with Time Reference Flag checked) Semi quant relative to ISTD Quantitate with Standard Addition 60
 is the concentration after the Multiplier has been applied to the Calculated Concentration.")
61 Globals Settings Calculated and Final Concentration Calculated Concentration (Calc. Conc.) is the concentration of the compound as calculated from the calibration curve. Final Concentration (Final Conc.) is the concentration after the Multiplier has been applied to the Calculated Concentration. The equations are: Final Concentration = Calculated Concentration x Multiplier 61
 or implicitly (Amt. and Tot. Amt.) 62")
62 Globals Settings Multiplier Multiplier = Dilution x Sample Amount Multiplier where Sample Amount Multiplier = TotalAmt/Amt All three of the factors are columns in the Sample section of the Batch Table. By default, they are set to 1, either explicitly (Dil.) or implicitly (Amt. and Tot. Amt.) 62
 must be added to the Batch Table.")
63 Globals Settings Multiplier The columns (Dil., Amt., TotalAmt, and Multiplier) must be added to the Batch Table. The Multiplier in the Compound Results represents the product applied to the compound. 63
64 Globals Settings Bracketing type = None No (None) Bracketing allows the user to have sample(s) quantitated using the average of all the calibration standards in the batch without regard to order. [Cal Set A] [Sample 1 Set] Avg. Cal (A+B+C) [Cal Set B] [Sample 2 Set] [Cal Set C] [Sample 3 Set] 64
65 Globals Settings Bracketing type = Overlapped Overlapped Bracketing allows the user to have sample(s) quantitated using the average of the calibration standards injected both before and after the samples injection. [Cal Set A] [Sample 1 Set] [Cal Set B] [Sample 2 Set] [Cal Set C] Average Calibration (A+B) Average Calibration (B+C) 65
66 Globals Settings Bracketing Type = Sample Group Used with Stream Select (LC) When the Bracketing Type Sample Group is implemented, only samples from a specific Sample Group (specified in the Batch Table) are considered in the formation of the calibration curve and quantitation of the samples. This feature would accommodate slight shifts in retention time and/or variations in instrument responses. Added from Worklist or Batch Table. 66
67 Globals Settings Correlation Window Indicates the retention time relationship of target and ions to one or more qualifiers. Tolerance of extracted ions to be considered a single peak. Default time of 0.5 min is rather wide. Typically 0.01 to 0.05 min (0.6 sec to 3 sec) 67


68 Globals Settings Dynamic Background Subtraction Removes noise or background ions in TIC, not generally recommended. Before DBS After DBS 68


69 Globals Settings Non Reference & Reference Window Extract full signal for baseline and noise. Restrict peak selection to smaller RT window. MassHunter Webinar Series 69


70 Option to Display Reference RT and Window Compound Information > Properties > Retention time Chose which reference points to show and in what color and style. 70


71 Globals Settings Reference Library The Reference Library is activated from Library > Setup Reference Library A reference library can be created from a calibrator or existing library and added to the quant method to aid in the identification of compounds. High level calibrator should be selected before entering Method Editor to obtain better quality spectra for the reference library from the sample. MassHunter Webinar Series 71

72 Globals Settings Reference Library Target Scan Reference Spectrum Library Match Score is column that can be added in the Batch Table. MassHunter Webinar Series 72
73 Globals Settings Relative ISTD A method of semi quantitation. It is a global parameter and is applied to every sample in the batch. Relative ISTD is a concept where the response factor of the ISTD is used for quantitation. MassHunter Webinar Series 73


74 Globals Settings Standard Addition Standard Addition is activated in Globals Setup in the Method Editor. The calibration curve is Linear, Ignore Origin and No Weighting. The non-spiked sample MUST precede the calibrators in the Batch Table. Quant assumes that the order samples are acquired are the order in which they are analyzed. Order in Batch Table is imperative. Sample, Cal1, Cal 2. MassHunter Webinar Series 74
75 Training Resources Training resources that are available. 75

76 Agilent University Upgraded customer experience: Search and find courses that meet your interests and needs in the format they require Introduce new elearning capabilities: Recorded and video-based learning Virtual online classes Expanded portfolio: Foundational subjects Intermediate subjects Advanced subjects Workflow and applications Helping customers: Educate your employees on Agilent instruments and software From new hires to the most seasoned scientists 2015 Agilent Technologies All Rights Reserved 76


77 Questions on today s material Thank you for your attention. MassHunter Quantitative Analysis 77
Agilent MassHunter Quantitative Data Analysis
 Agilent MassHunter Quantitative Data Analysis Presenters: Howard Sanford Stephen Harnos MassHunter Quantitation: Batch and Method Setup Outliers, Data Review, Reporting 1 MassHunter Quantitative Analysis
MassHunter TOF/QTOF Users Meeting
 MassHunter TOF/QTOF Users Meeting 1 Qualitative Analysis Workflows Workflows in Qualitative Analysis allow the user to only see and work with the areas and dialog boxes they need for their specific tasks
MassHunter Software Overview
 MassHunter Software Overview 1 Qualitative Analysis Workflows Workflows in Qualitative Analysis allow the user to only see and work with the areas and dialog boxes they need for their specific tasks A
Agilent MassHunter Profinder: Solving the Challenge of Isotopologue Extraction for Qualitative Flux Analysis
 Agilent MassHunter Profinder: Solving the Challenge of Isotopologue Extraction for Qualitative Flux Analysis Technical Overview Introduction Metabolomics studies measure the relative abundance of metabolites
Agilent All Ions MS/MS
 Agilent All Ions MS/MS Workflow Overview A Determine fragment ions for LC/MS Quant method B Develop final Quant method Develop LC/MS Qualitative Analysis method Process data with Find by Formula Build
All Ions MS/MS: Targeted Screening and Quantitation Using Agilent TOF and Q-TOF LC/MS Systems
 All Ions MS/MS: Targeted Screening and Quantitation Using Agilent TOF and Q-TOF LC/MS Systems Technical Overview Introduction All Ions MS/MS is a technique that is available for Agilent high resolution
Making Sense of Differences in LCMS Data: Integrated Tools
 Making Sense of Differences in LCMS Data: Integrated Tools David A. Weil Agilent Technologies MassHunter Overview Page 1 March 2008 How Clean is our Water?... Page 2 Chemical Residue Analysis.... From
New Approaches to the Development of GC/MS Selected Ion Monitoring Acquisition and Quantitation Methods Technique/Technology
 New Approaches to the Development of GC/MS Selected Ion Monitoring Acquisition and Quantitation Methods Technique/Technology Gas Chromatography/Mass Spectrometry Author Harry Prest 1601 California Avenue
Information Dependent Acquisition (IDA) 1
 1") Information Dependent Acquisition (IDA) Information Dependent Acquisition (IDA) enables on the fly acquisition of MS/MS spectra during a chromatographic run. Analyst Software IDA is optimized to generate
Information Dependent Acquisition (IDA) Information Dependent Acquisition (IDA) enables on the fly acquisition of MS/MS spectra during a chromatographic run. Analyst Software IDA is optimized to generate
Cerno Application Note Extending the Limits of Mass Spectrometry
 Creation of Accurate Mass Library for NIST Database Search Novel MS calibration has been shown to enable accurate mass and elemental composition determination on quadrupole GC/MS systems for either molecular
Agilent TOF Screening & Impurity Profiling Julie Cichelli, PhD LC/MS Small Molecule Workshop Dec 6, 2012
 1 Agilent TOF Screening & Impurity Profiling Julie Cichelli, PhD LC/MS Small Molecule Workshop Dec 6, 2012 Review: Technology for Accurate Mass Analysis: TOF LC/MS Mass measurements accurate to several
ProMass Deconvolution User Training. Novatia LLC January, 2013
 ProMass Deconvolution User Training Novatia LLC January, 2013 Overview General info about ProMass Features Basics of how ProMass Deconvolution works Example Spectra Manual Deconvolution with ProMass Deconvolution
TUTORIAL EXERCISES WITH ANSWERS
 TUTORIAL EXERCISES WITH ANSWERS Tutorial 1 Settings 1. What is the exact monoisotopic mass difference for peptides carrying a 13 C (and NO additional 15 N) labelled C-terminal lysine residue? a. 6.020129
Rapid and Accurate Forensics Analysis using High Resolution All Ions MS/MS
 Rapid and Accurate Forensics Analysis using High Resolution All Ions MS/MS Application Note Forensic Toxicology Authors Martin Josefsson, and Markus Roman National Board of Forensic Medicine Linköping,
Last updated: Copyright
 Last updated: 2012-08-20 Copyright 2004-2012 plabel (v2.4) User s Manual by Bioinformatics Group, Institute of Computing Technology, Chinese Academy of Sciences Tel: 86-10-62601016 Email: zhangkun01@ict.ac.cn,
Agilent 6400 Series Triple Quadrupole LC/MS/MS Users Session
 Agilent 6400 Series Triple Quadrupole LC/MS/MS Users Session QQQ Method Development and Optimization MassHunter Quant: Method setup Peak detection optimization Quant troubleshooting David Presser Application
Mnova Software for Analyzing Reaction Monitoring NMR Spectra
 Mnova Software for Analyzing Reaction Monitoring NMR Spectra Version 10 Chen Peng, PhD, VP of Business Development, US & China Mestrelab Research SL San Diego, CA, USA chen.peng@mestrelab.com 858.736.4563
The new Water Screening PCDL
 The new Water Screening PCDL Content and integration in suspect and non-target screening Dr. Thomas Glauner Senior LC/MS Applications Scientist EMEA Market Development Team 1 Accurate mass screening and
How to Make or Plot a Graph or Chart in Excel
 This is a complete video tutorial on How to Make or Plot a Graph or Chart in Excel. To make complex chart like Gantt Chart, you have know the basic principles of making a chart. Though I have used Excel
Appendix B Microsoft Office Specialist exam objectives maps
 B 1 Appendix B Microsoft Office Specialist exam objectives maps This appendix covers these additional topics: A Excel 2003 Specialist exam objectives with references to corresponding material in Course
Multi-residue analysis of pesticides by GC-HRMS
 An Executive Summary Multi-residue analysis of pesticides by GC-HRMS Dr. Hans Mol is senior scientist at RIKILT- Wageningen UR Introduction Regulatory authorities throughout the world set and enforce strict
Quantification of JEOL XPS Spectra from SpecSurf
 Quantification of JEOL XPS Spectra from SpecSurf The quantification procedure used by the JEOL SpecSurf software involves modifying the Scofield cross-sections to account for both an energy dependency
GAS CHROMATOGRAPHY MASS SPECTROMETRY. Pre-Lab Questions
 GAS CHROMATOGRAPHY MASS SPECTROMETRY Pre-Lab Questions Questions to be answered before doing the experiment. The answers are due at the beginning of each experiment without exception (the questions are
Understanding Your Spectra Module. Agilent OpenLAB CDS ChemStation Edition
 Understanding Your Spectra Module Agilent OpenLAB CDS ChemStation Edition Notices Agilent Technologies, Inc. 1994-2012, 2013 No part of this manual may be reproduced in any form or by any means (including
Compounding insights Thermo Scientific Compound Discoverer Software
 Compounding insights Thermo Scientific Compound Discoverer Software Integrated, complete, toolset solves small-molecule analysis challenges Thermo Scientific Orbitrap mass spectrometers produce information-rich
Building Inflation Tables and CER Libraries
 Building Inflation Tables and CER Libraries January 2007 Presented by James K. Johnson Tecolote Research, Inc. Copyright Tecolote Research, Inc. September 2006 Abstract Building Inflation Tables and CER
2010 Autodesk, Inc. All rights reserved. NOT FOR DISTRIBUTION.
 Wastewater Profiles 2010 Autodesk, Inc. All rights reserved. NOT FOR DISTRIBUTION. The contents of this guide were created for Autodesk Topobase 2011. The contents of this guide are not intended for other
NMR Predictor. Introduction
 NMR Predictor This manual gives a walk-through on how to use the NMR Predictor: Introduction NMR Predictor QuickHelp NMR Predictor Overview Chemical features GUI features Usage Menu system File menu Edit
Quantitation of High Resolution MS Data Using UNIFI: Acquiring and Processing Full Scan or Tof-MRM (Targeted HRMS) Datasets for Quantitative Assays
 Datasets for Quantitative Assays") : Acquiring and Processing Full Scan or Tof-MRM (Targeted HRMS) Datasets for Quantitative Assays Mark Wrona, Jayne Kirk, and Yun Alelyunas Waters Corporation, Milford, MA, USA APPLICATION BENEFITS Ability
: Acquiring and Processing Full Scan or Tof-MRM (Targeted HRMS) Datasets for Quantitative Assays Mark Wrona, Jayne Kirk, and Yun Alelyunas Waters Corporation, Milford, MA, USA APPLICATION BENEFITS Ability
Tutorial 2: Analysis of DIA data in Skyline
 Tutorial 2: Analysis of DIA data in Skyline In this tutorial we will learn how to use Skyline to perform targeted post-acquisition analysis for peptide and inferred protein detection and quantitation using
WADA Technical Document TD2003IDCR
 IDENTIFICATION CRITERIA FOR QUALITATIVE ASSAYS INCORPORATING CHROMATOGRAPHY AND MASS SPECTROMETRY The appropriate analytical characteristics must be documented for a particular assay. The Laboratory must
Jasco V-670 absorption spectrometer
 Laser Spectroscopy Labs Jasco V-670 absorption spectrometer Operation instructions 1. Turn ON the power switch on the right side of the spectrophotometer. It takes about 5 minutes for the light source
M E R C E R W I N WA L K T H R O U G H
 H E A L T H W E A L T H C A R E E R WA L K T H R O U G H C L I E N T S O L U T I O N S T E A M T A B L E O F C O N T E N T 1. Login to the Tool 2 2. Published reports... 7 3. Select Results Criteria...
Bioanalytical Chem: 4590: LC-MSMS of analgesics LC-MS Experiment Liquid Chromatography Mass Spectrometry (LC/MS)
") Liquid Chromatography Mass Spectrometry (LC/MS) Prelab Questions: Questions to be answered before doing the experiment. The answers are due at the beginning of each experiment without exception (the questions
Liquid Chromatography Mass Spectrometry (LC/MS) Prelab Questions: Questions to be answered before doing the experiment. The answers are due at the beginning of each experiment without exception (the questions
Analyst Software. Peptide and Protein Quantitation Tutorial
 This document is provided to customers who have purchased AB Sciex equipment to use in the operation of such AB Sciex equipment. This document is copyright protected and any reproduction of this document
41. Sim Reactions Example
 HSC Chemistry 7.0 41-1(6) 41. Sim Reactions Example Figure 1: Sim Reactions Example, Run mode view after calculations. General This example contains instruction how to create a simple model. The example
Agilent 6400 Series Triple Quadrupole Users Workshop. MH QQQ Users workshop 2/21/2014 1
 Agilent 6400 Series Triple Quadrupole Users Workshop 1 Agilent 6400 Series Triple Quadrupole Users Workshop QQQ Method Development and Optimization MassHunter Quantitation: Batch and Method setup QC s,
SRM assay generation and data analysis in Skyline
 in Skyline Preparation 1. Download the example data from www.srmcourse.ch/eupa.html (3 raw files, 1 csv file, 1 sptxt file). 2. The number formats of your computer have to be set to English (United States).
Agilent G3212 GC-APCI Source
 Agilent G3212 GC-APCI Source Quick Start Guide Where to find information 2 Getting Started 3 Step 1. Start the Data Acquisition program for the GC and the Q-TOF 3 Step 2. Prepare the GC and Q-TOF for data
Analyst Software. Automatic Optimization Tutorial
 This document is provided to customers who have purchased AB Sciex equipment to use in the operation of such AB Sciex equipment. This document is copyright protected and any reproduction of this document
SEAMLESS INTEGRATION OF MASS DETECTION INTO THE UV CHROMATOGRAPHIC WORKFLOW
 SEAMLESS INTEGRATION OF MASS DETECTION INTO THE UV CHROMATOGRAPHIC WORKFLOW Paula Hong, John Van Antwerp, and Patricia McConville Waters Corporation, Milford, MA, USA Historically UV detection has been
Extend Your Metabolomics Insight!
 Extend Your Metabolomics Insight! Introducing MassHunter VistaFlux April 2016 Agilent THE Leader in Metabolomics! Fiehn EI Library METLIN MS/MS Library Mass Profiler Professional with Pathway Architect
Cerno Bioscience MassWorks: Acquiring Calibration Data on Agilent GC/MSDs
 Cerno Bioscience MassWorks: Acquiring Calibration Data on Agilent GC/MSDs Application Note Author Harry Prest, Ph.D. Senior Chemist in GC-MS Agilent Technologies, Inc. 5301 Stevens Creek Blvd Santa Clara,
Tutorial. Getting started. Sample to Insight. March 31, 2016
 Getting started March 31, 2016 Sample to Insight CLC bio, a QIAGEN Company Silkeborgvej 2 Prismet 8000 Aarhus C Denmark Telephone: +45 70 22 32 44 www.clcbio.com support-clcbio@qiagen.com Getting started
Creating Empirical Calibrations
 030.0023.01.0 Spreadsheet Manual Save Date: December 1, 2010 Table of Contents 1. Overview... 3 2. Enable S1 Calibration Macro... 4 3. Getting Ready... 4 4. Measuring the New Sample... 5 5. Adding New
High-Throughput Protein Quantitation Using Multiple Reaction Monitoring
 High-Throughput Protein Quantitation Using Multiple Reaction Monitoring Application Note Authors Ning Tang, Christine Miller, Joe Roark, Norton Kitagawa and Keith Waddell Agilent Technologies, Inc. Santa
An Effective Workflow for Impurity Analysis Incorporating High Quality HRAM LCMS & MSMS with Intelligent Automated Data Mining
 An Effective Workflow for Impurity Analysis Incorporating High Quality HRAM LCMS & MSMS with Intelligent Automated Data Mining Dave Weil, Ph.D. and Jim Lau, Ph.D. Typical Method Conditions: 1260 UHPLC
Protein Deconvolution Version 2.0
 Thermo Protein Deconvolution Version 2.0 User Guide XCALI-97414 Revision A August 2012 2012 Thermo Fisher Scientific Inc. All rights reserved. ReSpect is a trademark of Positive Probability Ltd. Xcalibur
Application Note. Authors. Abstract. Introduction. Environmental
 Using a Chlorine Filter for Accurate-Mass Data Analysis of Environmental Samples Application Note Environmental Authors Imma Ferrer and E. Michael Thurman Center for Environmental Mass Spectrometry University
TOF/QTOF Users Meeting. Jim Lau, Agilent Technologies.
 TOF/QTOF Users Meeting Jim Lau, Agilent Technologies. Agenda Goal Share Best Practices, Develop Network of Agilent Users Today s Topics: Care and Feeding Agilent LCMS Systems Data Acquisition: Optimize
Agilent ESI and APCI sources: for polar to non-polar compounds
 1 Agilent 6400 Series Triple Quadrupole Users Workshop 1 Agilent ESI and APCI sources: for polar to non-polar compounds Nebulizer Pressure Corona current Nebulizer Pressure Vaporizer Vcap Vcap Drying Gas
ncounter PlexSet Data Analysis Guidelines
 ncounter PlexSet Data Analysis Guidelines NanoString Technologies, Inc. 530 airview Ave North Seattle, Washington 98109 USA Telephone: 206.378.6266 888.358.6266 E-mail: info@nanostring.com Molecules That
New Dynamic MRM Mode Improves Data Quality and Triple Quad Quantification in Complex Analyses
 New Dynamic MRM Mode Improves Data Quality and Triple Quad Quantification in Complex Analyses Technical Overview Authors Abstract Peter Stone, Thomas Glauner, Frank Kuhlmann, Tim Schlabach and Ken Miller
MassHunter METLIN Metabolite PCD/PCDL Quick Start Guide
 MassHunter METLIN Metabolite PCD/PCDL Quick Start Guide What is the MassHunter METLIN Metabolite PCD/PCDL? 2 Where to find more information 2 Kit Content 3 Installation 5 Before you start 5 Install MassHunter
Computer simulation of radioactive decay
 Computer simulation of radioactive decay y now you should have worked your way through the introduction to Maple, as well as the introduction to data analysis using Excel Now we will explore radioactive
Experiment: Oscillations of a Mass on a Spring
 Physics NYC F17 Objective: Theory: Experiment: Oscillations of a Mass on a Spring A: to verify Hooke s law for a spring and measure its elasticity constant. B: to check the relationship between the period
Preparing Spatial Data
 13 CHAPTER 2 Preparing Spatial Data Assessing Your Spatial Data Needs 13 Assessing Your Attribute Data 13 Determining Your Spatial Data Requirements 14 Locating a Source of Spatial Data 14 Performing Common
Using the Stock Hydrology Tools in ArcGIS
 Using the Stock Hydrology Tools in ArcGIS This lab exercise contains a homework assignment, detailed at the bottom, which is due Wednesday, October 6th. Several hydrology tools are part of the basic ArcGIS
User Guide. Affirmatively Furthering Fair Housing Data and Mapping Tool. U.S. Department of Housing and Urban Development
 User Guide Affirmatively Furthering Fair Housing Data and Mapping Tool U.S. Department of Housing and Urban Development December, 2015 1 Table of Contents 1. Getting Started... 5 1.1 Software Version...
Analyzing Compounds of Environmental Interest Using an LC/Q-TOF Part 1: Dyes and Pigments. Application. Introduction. Authors. Abstract.
 Analyzing Compounds of Environmental Interest Using an LC/Q-TOF Part 1: Dyes and Pigments Application Environmental Authors Jim Lau, Chin-Kai Meng, and Jennifer Gushue Agilent Technologies, Inc. 285 Centerville
Agilent MassHunter Workstation Software
 Agilent MassHunter Workstation Software Quantitative Analysis Quantitation DataSet Agilent Technologies Notices Agilent Technologies, Inc. 2017 No part of this manual may be reproduced in any form or by
Screening for Water Pollutants With the Agilent SureTarget GC/MSD Water Pollutants Screener, SureTarget Workflow, and Customized Reporting
 Screening for Water Pollutants With the Agilent SureTarget GC/MSD Water Pollutants Screener, SureTarget Workflow, and Customized Reporting Application Note Authors Angela Smith Henry and Bruce Quimby Agilent
Introduction to Spark
 1 As you become familiar or continue to explore the Cresset technology and software applications, we encourage you to look through the user manual. This is accessible from the Help menu. However, don t
(THIS IS AN OPTIONAL BUT WORTHWHILE EXERCISE)
") PART 2: Analysis in ArcGIS (THIS IS AN OPTIONAL BUT WORTHWHILE EXERCISE) Step 1: Start ArcCatalog and open a geodatabase If you have a shortcut icon for ArcCatalog on your desktop, double-click it to start
PART 2: Analysis in ArcGIS (THIS IS AN OPTIONAL BUT WORTHWHILE EXERCISE) Step 1: Start ArcCatalog and open a geodatabase If you have a shortcut icon for ArcCatalog on your desktop, double-click it to start
In this exercise we will learn how to use the analysis tools in ArcGIS with vector and raster data to further examine potential building sites.
 GIS Level 2 In the Introduction to GIS workshop we filtered data and visually examined it to determine where to potentially build a new mixed use facility. In order to get a low interest loan, the building
Die Nadel im Heuhaufen
 Die Nadel im Heuhaufen Workflow zur Identifizierung unerwarteter Komponenten in LC Q-Tof Daten Umwelt & Lebensmittel Seminar Tour Andreas Reimann Produktspezialist LC-MS Agilent Technologies Instrumentation
Yun W. Alelyunas, Mark D. Wrona, Russell J. Mortishire-Smith, Nick Tomczyk, and Paul D. Rainville Waters Corporation, Milford, MA, USA INTRODUCTION
 Quantitation by High Resolution Mass Spectrometry: Using Target Enhancement and Tof-MRM to Achieve Femtogram-level On-column Sensitivity for Quantitation of Drugs in Human Plasma Yun W. Alelyunas, Mark
Guide to Peptide Quantitation. Agilent clinical research
 Guide to Peptide Quantitation Agilent clinical research Peptide Quantitation for the Clinical Research Laboratory Peptide quantitation is rapidly growing in clinical research as scientists are translating
Nature Methods: doi: /nmeth Supplementary Figure 1. Fragment indexing allows efficient spectra similarity comparisons.
 Supplementary Figure 1 Fragment indexing allows efficient spectra similarity comparisons. The cost and efficiency of spectra similarity calculations can be approximated by the number of fragment comparisons
The Theory of HPLC. Quantitative and Qualitative HPLC
 The Theory of HPLC Quantitative and Qualitative HPLC i Wherever you see this symbol, it is important to access the on-line course as there is interactive material that cannot be fully shown in this reference
Tutorial 1: Setting up your Skyline document
 Tutorial 1: Setting up your Skyline document Caution! For using Skyline the number formats of your computer have to be set to English (United States). Open the Control Panel Clock, Language, and Region
BASIC TECHNOLOGY Pre K starts and shuts down computer, monitor, and printer E E D D P P P P P P P P P P
 BASIC TECHNOLOGY Pre K 1 2 3 4 5 6 7 8 9 10 11 12 starts and shuts down computer, monitor, and printer P P P P P P practices responsible use and care of technology devices P P P P P P opens and quits an
Basic chromatographic parameters and optimization in LC
 AM0925 Assignment Basic chromatographic parameters and optimization in LC Introduction This is a computer exercise where you will apply a simulator of reversed phase LC to study the influence of chromatographic
Overview. Introduction. André Schreiber AB SCIEX Concord, Ontario (Canada)
") Quantitation and Identification of Pharmaceuticals and Personal Care Products (PPCP) in Environmental Samples using Advanced TripleTOF MS/MS Technology André Schreiber AB SCIEX Concord, Ontario (Canada)
Quantitation and Identification of Pharmaceuticals and Personal Care Products (PPCP) in Environmental Samples using Advanced TripleTOF MS/MS Technology André Schreiber AB SCIEX Concord, Ontario (Canada)
SIERRA ANALYTICS, INC. Version Polymerix Software User Manual
 SIERRA ANALYTICS, INC. Version 3.0.0 Polymerix Software User Manual V E R S I O N 3.0.0 M A R C H 2013 Polymerix Software User Manual Copyright 2010 to 2013 Sierra Analytics, Inc. 5815 Stoddard Road, Suite
Table of content. Understanding workflow automation - Making the right choice Creating a workflow...05
 Marketers need to categorize their audience to maximize their r e a c h. Z o h o C a m p a i g n s a u t o m a t e s r e c i p i e n t c l a s s i fi c a t i o n a n d action performance to free up marketers
Using the Budget Features in Quicken 2008
 Using the Budget Features in Quicken 2008 Quicken budgets can be used to summarize expected income and expenses for planning purposes. The budget can later be used in comparisons to actual income and expenses
LightCycler 480 Instrument Quick Guide Relative Quantification
 LightCycler 480 Instrument Quick Guide Relative Quantification Performing a Relative Quantification Analysis: 1. Open the experiment that you want to analyze in main window 1. 2. If sample information
Automated and accurate component detection using reference mass spectra
 TECHNICAL NOTE 72703 Automated and accurate component detection using reference mass spectra Authors Barbara van Cann 1 and Amit Gujar 2 1 Thermo Fisher Scientific, Breda, NL 2 Thermo Fisher Scientific,
CREATING CUSTOMIZED DATE RANGE COLLECTIONS IN PRESENTATION STUDIO
 CREATING CUSTOMIZED DATE RANGE COLLECTIONS IN PRESENTATION STUDIO Date range collections are pre-defined reporting periods for performance data. You have two options: Dynamic date ranges automatically
Software Operation Manual
 Varian, Inc. 2700 Mitchell Drive Walnut Creek, CA 94598-1675/USA 240-MS GC/MS Ion Trap MS Workstation Version 6 Software Operation Manual Varian, Inc. 2009 Printed in U.S.A. 395416800:3 Trademark Acknowledgments
MAGNETITE OXIDATION EXAMPLE
 HSC Chemistry 7.0 1 MAGNETITE OXIDATION EXAMPLE Pelletized magnetite (Fe 3 O 4 ) ore may be oxidized to hematite (Fe 2 O 3 ) in shaft furnace. Typical magnetite content in ore is some 95%. Oxidation is
A Workflow Approach for the Identification and Structural Elucidation of Impurities of Quetiapine Hemifumarate Drug Substance
 A Workflow Approach for the Identification and Structural Elucidation of Impurities of Quetiapine Hemifumarate Drug Substance Michael D. Jones, Marian Twohig, Karen Haas, and Robert S. Plumb Waters Corporation,
Modeling Incident Density with Contours in ArcGIS Pro
 Modeling Incident Density with Contours in ArcGIS Pro By Mike Price, Entrada/San Juan, Inc. What you will need ArcGIS Pro 1.4 license or later ArcGIS Spatial Analyst license ArcGIS Online for organizational
CHEMDRAW ULTRA ITEC107 - Introduction to Computing for Pharmacy. ITEC107 - Introduction to Computing for Pharmacy 1
 CHEMDRAW ULTRA 12.0 ITEC107 - Introduction to Computing for Pharmacy 1 Objectives Basic drawing skills with ChemDraw Bonds, captions, hotkeys, chains, arrows Checking and cleaning up structures Chemical
PesticideScreener. Innovation with Integrity. Comprehensive Pesticide Screening and Quantitation UHR-TOF MS
 PesticideScreener Comprehensive Pesticide Screening and Quantitation Innovation with Integrity UHR-TOF MS The Challenge of Comprehensive Pesticide Residue Analysis The use of pesticides to reduce crop
FORENSIC TOXICOLOGY SCREENING APPLICATION SOLUTION
 FORENSIC TOXICOLOGY SCREENING APPLICATION SOLUTION A purpose-built collection of the best-inclass components for forensic toxicology Whether you re challenged to present reliable and secure forensic sample
Performing Peptide Bioanalysis Using High Resolution Mass Spectrometry with Target Enhancement MRM Acquisition
 Performing Peptide Bioanalysis Using High Resolution Mass Spectrometry with Target Enhancement MRM Acquisition Yun Wang Alelyunas, Mark D. Wrona, and Nick Tomczyk Waters Corporation, Milford, MA, USA GOAL
MetWorks Metabolite Identification Software
 m a s s s p e c t r o m e t r y MetWorks Metabolite Identification Software Enabling Confident Analysis of Metabolism Data Part of Thermo Fisher Scientific MetWorks Software for the Confident Analysis
How to Create a Substance Answer Set
 How to Create a Substance Answer Set Select among five search techniques to find substances Since substances can be described by multiple names or other characteristics, SciFinder gives you the flexibility
Key Words Q Exactive, Accela, MetQuest, Mass Frontier, Drug Discovery
 Metabolite Stability Screening and Hotspot Metabolite Identification by Combining High-Resolution, Accurate-Mass Nonselective and Selective Fragmentation Tim Stratton, Caroline Ding, Yingying Huang, Dan
Z -LYTE Assay Setup Guide on the BMG LABTECH CLARIOstar Reader
 08 Jan 15 Page 1 of 18 Z -LYTE Assay Setup Guide on the BMG LABTECH CLARIOstar Reader The BMG LABTECH CLARIOstar Microplate Readers were tested for compatibility with the Life Technologies Z -LYTE Assay
Introduction to Structure Preparation and Visualization
 Introduction to Structure Preparation and Visualization Created with: Release 2018-4 Prerequisites: Release 2018-2 or higher Access to the internet Categories: Molecular Visualization, Structure-Based
Computational Study of Chemical Kinetics (GIDES)
") Computational Study of Chemical Kinetics (GIDES) Software Introduction Berkeley Madonna (http://www.berkeleymadonna.com) is a dynamic modeling program in which relational diagrams are created using a graphical
Computational Study of Chemical Kinetics (GIDES) Software Introduction Berkeley Madonna (http://www.berkeleymadonna.com) is a dynamic modeling program in which relational diagrams are created using a graphical
AlphaVision-5.3. Integrated, Ethernetconnected. spectrometers. 32-bit software for Windows 2000 and XP Professional ORTEC
 AlphaVision-5.3 Integrated, Ethernetconnected alpha spectrometers 32-bit software for Windows 2000 and XP Professional Alpha Vision 5.3 What makes us the best???? We are the cutting edge!!!! Introduction
You w i ll f ol l ow these st eps : Before opening files, the S c e n e panel is active.
 You w i ll f ol l ow these st eps : A. O pen a n i m a g e s t a c k. B. Tr a c e t h e d e n d r i t e w i t h t h e user-guided m ode. C. D e t e c t t h e s p i n e s a u t o m a t i c a l l y. D. C
OECD QSAR Toolbox v.4.1. Step-by-step example for building QSAR model
 OECD QSAR Toolbox v.4.1 Step-by-step example for building QSAR model Background Objectives The exercise Workflow of the exercise Outlook 2 Background This is a step-by-step presentation designed to take
Create Satellite Image, Draw Maps
 Create Satellite Image, Draw Maps 1. The goal Using Google Earth, we want to create and import a background file into our Adviser program. From there, we will be creating paddock boundaries. The accuracy
Simulation of Second Order Spectra Using SpinWorks. CHEM/BCMB 8190 Biomolecular NMR UGA, Spring, 2005
 Simulation of Second Order Spectra Using SpinWorks CHEM/BCMB 8190 Biomolecular NMR UGA, Spring, 2005 Introduction Although we frequently assume that scalar couplings are small compared to the differences
Skin Damage Visualizer TiVi60 User Manual
 Skin Damage Visualizer TiVi60 User Manual PIONEERS IN TISSUE VIABILITY IMAGING User Manual 3.2 Version 3.2 October 2013 Dear Valued Customer! TiVi60 Skin Damage Visualizer Welcome to the WheelsBridge Skin